tomographic extreme-ultraviolet spectrographs: tess
TRANSCRIPT

me
Tomographic extreme-ultraviolet spectrographs: TESS
Daniel M. Cotton, Andrew Stephan, Timothy Cook, James Vickers, Valerie Taylor, andSupriya Chakrabarti
We describe the system of Tomographic Extreme Ultraviolet ~EUV! SpectrographS ~TESS! that are theprimary instruments for the Tomographic Experiment using Radiative Recombinative Ionospheric EUVand Radio Sources ~TERRIERS! satellite. The spectrographs were designed to make high-sensitivity $80countsys!yRayleigh @one Rayleigh is equivalent to 106 photons/~4p str cm2 s!%, line-of-sight measurementsof the oI 135.6- and 91.1-nm emissions suitable for tomographic inversion. The system consists of fivespectrographs, four identical nightglow instruments ~for redundancy and added sensitivity!, and oneinstrument with a smaller aperture to reduce sensitivity and increase spectral resolution for daytimeoperation. Each instrument has a bandpass of 80–140 nm with approximately 2- and 1-nm resolutionfor the night and day instruments, respectively. They utilize microchannel-plate-based two-dimensional imaging detectors with wedge-and-strip anode readouts. The instruments were designed,fabricated, and calibrated at Boston University, and the TERRIERS satellite was launched on 18 May1999 from Vandenberg Air Force Base, California. © 2000 Optical Society of America
OCIS codes: 000.2170, 040.0040, 110.6960, 120.4640, 120.6200, 300.6540.
1. Introduction
Scientific and technical advances have pushed opticaltechniques toward greater sensitivity, higher spec-tral resolution, and better spatial resolution within asingle instrument. The availability of instrumentsthat incorporate all these improvements has led op-tical engineers toward inventive multispectral imag-ing techniques in fields from astrophysics tomedicine. In the field of space physics, scientistsseek to observe the complex, dynamic, and magne-tized plasma that surrounds the Earth at high spa-tial, spectral, and temporal resolutions. The goalsare to obtain further insights into this scientificallyrich system as well as to forecast disturbances in thisnear-space environment. For example, the Imagerfor Magnetosphere-to-Aurora Global Exploration~IMAGE! mission, which used a series of imagers to
ap out the inner magnetosphere from a single sat-llite, was designed for this purpose.1The Tomographic Experiment using Radiative Re-
The authors are with the Center for Space Physics and theDepartment of Astronomy, Boston University, 725 CommonwealthAvenue, Boston, Massachusetts 02215. D. M. Cotton’s e-mail ad-dress is [email protected].
Received 14 December 1999; revised manuscript received 27March 2000.
0003-6935y00y220001-09$15.00y0© 2000 Optical Society of America
combinative Ionospheric EUV and Radio Sources~TERRIERS! satellite mission was designed withsimilar goals in mind. The TERRIERS’s target wasthe ionosphere, the near-space plasma in the range of80–1200 km above the Earth, and its goal was toprovide global, two-dimensional ~latitude and alti-tude! maps of the ionospheric electron density from asmall, spinning spacecraft in a circular polar orbit.To accomplish this we developed a new tomographicstrategy utilizing optically thin atomic oxygen recom-bination emissions. These emissions are directly re-lated to line integral measurements of the electrondensity. Thus, the TERRIERS satellite would, forthe first time, make global-scale two-dimensional im-ages of the ionosphere on time scales of low Earth-orbiting passes ~20 min!.
The technique requires measurements of relativelylow-intensity ~,5 Rayleighs! extreme-ultraviolet~EUV! and far-ultraviolet ~FUV! features for a largeseries of viewing angles in the orbital plane at manypoints along the satellite track. Because of the num-ber of measurements needed, the two key require-ments placed on the instruments are high sensitivityand low noise. Secondary requirements includemoderate spectral resolution ~1–2 nm! and moderateone-dimensional spatial resolution ~;0.5°!. Fur-thermore, the program-imposed conservative sched-ule ~1 year for design and fabrication! and budget~;$1.5 million! constraints. The TERRIERS satel-lite was a part of the Student Explorer Demonstra-
1 August 2000 y Vol. 39, No. 22 y APPLIED OPTICS 3991

w~t
fcsloF
3
tion Initiative ~STEDI!, a low-cost, satellite project inhich students participated; its development phase
design, fabrication, and integration! was intended toake only two years.
The Tomographic EUV SpectrographS ~TESS!were the result of efforts to fulfill these requirementsand are the topic of this paper. The TESS design isthe best compromise among spatial imaging, spectralresolution, and high sensitivity through the use of thesingle-element imaging spectrograph ~SEIS!.2 Thedetector and readout electronics were kept fairly sim-ple to permit more resources to be devoted to thisunique optical design. Among the key contributionsthat the TESS have made to the state of the art arethat they
• Facilitate global-scale latitude–vertical iono-spheric imaging.
• Have high sensitivity ~.203 more sensitivethan previously flown satellite spectrographs! withmoderate spectral and spatial resolutions.
• Have added dayside capability with improvedspectral resolution.
Below, we detail the requirements for the TESSand describe the optical, mechanical, detector, andreadout designs. Furthermore, we present calibra-tion results for the instruments and discuss the TER-RIERS mission.
2. Extreme-Ultraviolet Ionospheric Tomography
The primary goal of the TERRIERS satellite missionwas to demonstrate a novel new tomographic tech-nique called EUV tomography. That is, the TERRI-ERS satellite was to apply tomographic techniques tomeasurements of optically thin recombination emis-sions to provide unprecedented global-scale two-dimensional ionospheric images. Furthermore,secondary TERRIERS measurements that used adual phase-coherent radio beacon3 and oI 6300-Å on-line and off-line photometers relied on tomographic
Fig. 1. Viewing geometry for TESS aboard TERRIERS. For siangles from the spacecraft as it moves from right to left. If one abelow the orbit!, the response recorded in ~b! is obtained. The ar
992 APPLIED OPTICS y Vol. 39, No. 22 y 1 August 2000
techniques to prove and complement the EUV mea-surements.
Specifically, for the TERRIERS tomography is theinversion of a two-dimensional quantity from a seriesof its line integrals. It is a transformation or map-ping of one two-dimensional function ~line integrals!to another ~original function!, as illustrated in Fig. 1or the TERRIERS geometry. To simplify the dis-ussion we have assumed a plane-parallel iono-phere. The radial lines in Fig. 1~a! represent theine-of-sight observations for several positions in therbit ~here the spacecraft is moving from left to right!.igure 1~b! illustrates the response function ~inten-
sity relative to look direction and to spacecraft posi-tion! for the point indicated in middle of Fig. 1~a!~position 3!. This mapping can be recognized as aRadon transform.4 The inverse transform has manyapplications and has been well studied. As a result,we have investigated many well-developed numericaltechniques to optimize the TESS inverse transform,including a statistical reconstruction framework thatproduced an estimation of uncertainty for simulateddata of 10–20%.5
Tomography is a powerful tool when one is physi-cally or practically limited to only line integral typesof measurements, e.g., CAT scans and magnetic res-onance imaging in medicine. Thus tomography isan ideal tool for global atmospheric studies becauseline integral measurements can be made by remote-sensing instruments. Ionospheric physics has re-cently benefitted from the effects of tomographythrough a newly developed radio tomographic tech-nique that uses beacon transmissions fromsatellites.6–12 Optical techniques have also been uti-lized to study auroral and airglow photoemissions inaeronomy.13–16
The TESS make ionospheric tomography possiblefrom an entirely new measurement technique thathas certain advantages over more-conventional tech-niques. Unlike the visible technique, which mea-sures photoemissions that involve ~10–20! chemical
city we have assumed a plane-parallel ionosphere. ~a! Viewinges that the ionosphere radiates at only one point ~position 3 just
indicates an operation, which in this case is a Radon transform.
mplissumrow
brtitFgnt
sbpss
pbTw
s
Table 1. TERRIERS Measurement Requirements
reactions, the EUV technique makes use of emissionsproduced by a single process ~radiative recombina-tion! that are directly related to the electron content.Also, because there is negligible background thatoriginates below 90 km, one eliminates both the ~po-tentially insoluble! noise sources that are due toright reflected moonlight and city lights and theeduced conditioning that is intrinsic in the addi-ional parameterization needed to account for the vis-ble albedo. The radio technique also has limits onhe viewing angles, which hinders its performance.urthermore, it is practically impossible to makelobal tomographic measurements because this tech-ique relies on a series of ground stations to facilitatehe measurements.
3. Instrument Requirements
The TESS’s requirements evolved from a series ofscientific, programmatic, and mission constraints.The targeted TERRIERS science was a broad rangeof independent and coupled phenomena: equatorialaeronomy, daytime ionosphere and thermosphere,nightside and dayside aurora, stable auroral red arcs,F-region troughs, and polar cap aeronomy. Table 1lists the spatial and accuracy requirements for sev-eral of these studies based on preliminary missiondesigns. The primary programmatic drivers werecost and orbit selection; the $4.3 million budget forthe entire mission limited development efforts, andthe orbit was required to be low Earth polar. Wechose an approximately 9 AM–9 PM Sun-synchronous ~inclination, ;97°! 550-km circular orbitin combination with a cartwheel spinner ~10-rpm!pacecraft configuration. This mission profile wasased on our viewing requirements, science goals,ower restrictions, and simplicity of spacecraft de-ign. The TESS requirements flowed from this basicet of parameters.
4. Instrument Description
The TESS are five EUV–FUV SEIS spectrographs;four are identical and one has a modified slit to re-duce sensitivity and increase spectral resolution fordaytime operation. The nightglow complement is
Objective Quantity Altitude ~km!
Spread F Variability Eph~55776300!a @e#b 100
Equatorial Anomaly Eph~55776300! @e#b 200
Ionospheric trough @e#b 50Gravity waves @e#b NATAD’sc @e#b NADayside aeronomy Eph~989
1304! 30Eph~1325
1356) 30EUVsolar –
aEph~l! indicates volume production rates for l Å emission.b@e# is electron density.cNA, not applicable.dTraveling atmospheric disturbances.
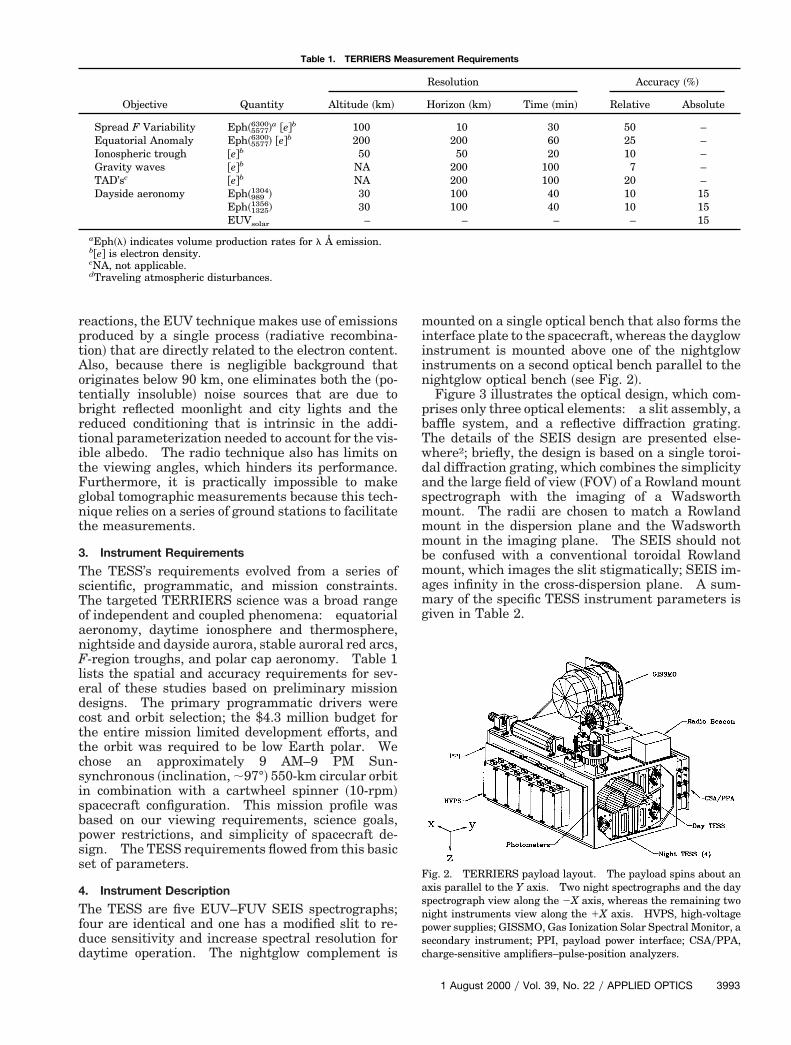
mounted on a single optical bench that also forms theinterface plate to the spacecraft, whereas the dayglowinstrument is mounted above one of the nightglowinstruments on a second optical bench parallel to thenightglow optical bench ~see Fig. 2!.
Figure 3 illustrates the optical design, which com-rises only three optical elements: a slit assembly, aaffle system, and a reflective diffraction grating.he details of the SEIS design are presented else-here2; briefly, the design is based on a single toroi-
dal diffraction grating, which combines the simplicityand the large field of view ~FOV! of a Rowland mountspectrograph with the imaging of a Wadsworthmount. The radii are chosen to match a Rowlandmount in the dispersion plane and the Wadsworthmount in the imaging plane. The SEIS should notbe confused with a conventional toroidal Rowlandmount, which images the slit stigmatically; SEIS im-ages infinity in the cross-dispersion plane. A sum-mary of the specific TESS instrument parameters isgiven in Table 2.
Fig. 2. TERRIERS payload layout. The payload spins about anaxis parallel to the Y axis. Two night spectrographs and the daypectrograph view along the 2X axis, whereas the remaining two
night instruments view along the 1X axis. HVPS, high-voltagepower supplies; GISSMO, Gas Ionization Solar Spectral Monitor, asecondary instrument; PPI, payload power interface; CSAyPPA,charge-sensitive amplifiers–pulse-position analyzers.
Resolution Accuracy ~%!
Horizon ~km! Time ~min! Relative Absolute
10 30 50 –200 60 25 –50 20 10 –
200 100 7 –200 100 20 –100 40 10 15100 40 10 15
– – – 15
1 August 2000 y Vol. 39, No. 22 y APPLIED OPTICS 3993

p
wabfwFntor
iWtpde
ESS P
3
We chose the SEIS design because its imaging ca-pabilities and large FOV offer the highest possiblethroughput with moderate spatial resolution ~0.4°! ina very small configuration ~150-mm focal length!.
Fig. 3. Optical layout for the TESS. ~a! Three-dimensional viewof the design, showing the size in centimeters. ~b! Top view, il-lustrating the dispersion plane. ~c! Side view, depicting the im-aging capability.
Table 2. T
Feature
Toroidal gratingDispersion radius ~mm!Imaging radius ~mm!Line density ~linesymm!Ruled areaBlaze wavelength ~nm!Reflective coating
Wavelength coverage ~nm!FOVSpatial resolutionSpectral resolution ~nm!Sensitivity @~cyclesys!Rayleigh#Slit height ~mm!Slit width ~mm!
994 APPLIED OPTICS y Vol. 39, No. 22 y 1 August 2000
The large number of tomographic measurementscombined with the expected signals ~approximately0.5–50 Rayleighs! required us to optimize for maxi-mum throughput. A single SEIS could achieve thespecified performance. However, for similar weight,power, and cost, four smaller, independent spectro-graphs that yield the same performance were base-lined to add redundancy and flexibility of operation.Furthermore, this design allowed us to include day-side operations by adding a nearly identical dayglowspectrograph for marginal cost. However, a compro-mise in cross-track resolution was made in order toachieve this high sensitivity. By accepting a 10°cross-track FOV, we limited our resolution in thisdirection to ;350 km, the size of the ionosphere sam-
led at the limb.Inasmuch as our spectral resolution requirementsere modest, we chose a mean grating incident anglethat optimized the imaging across the band. The
est imaging for a SEIS occurs when the mean dif-racted angle b is 0°. Thus we chose a to be 20.61°,hich yields b 5 0° at the center of the band, 110 nm.igures 4 and 5 show ray traces of the dayglow andightglow spectrographs, respectively. The horizon-al lines are separated by 0.4°, showing that thisne-bounce system can easily achieve the imagingequirements.
The sensitivities for the nightglow and dayglownstruments are shown in Figs. 6 and 7, respectively.
e chose a SiC coating for the grating because it hashe highest reflectivity over the whole bandpass ~es-ecially at the low end! and is fairly resistant toegradation from exposure to radiation and the spacenvironment.17 A mechanically ruled grating was
chosen rather than a holographically ruled grating toenhance the sensitivity while it maintained accept-able scattering properties. The grating was blazedat 90 nm to compensate for the lower reflectivity atshorter wavelengths; the blaze efficiency that we ex-pected for a mechanically ruled grating was calcu-
arameters
Type of Spectrograph
ightglow Dayglow
150.0 150.0290.4 290.43200 3200
m 3 65 mm 27 mm 3 65 mm90 90
SiC SiC90–140 80–140
10° 3 10° 10° 3 10°0.4° 0.4°2.0 1.080 0.540 10
500 100
N
27 m

t
wtd
lated with a scalar approximation and geometricshadowing.
To reduce the stray light and trap zero-order light,two internal baffle walls isolate the detector from theslit. The walls were 0.8-mm-thick bead-blastedstainless steel ~304! @total reflectivity, ,0.005 forwavelengths of #1216 Å ~Ref. 18!#. A knife-edge oneach aperture minimized glinting from the baffles.
The optical components, slits, baffles, gratings, anddetectors were individually mounted to aluminumoptical benches, as shown in Fig. 3. The optical cav-ities were enclosed by two lightweight, light-tightcovers. The slits were large enough to ensure ade-quate venting ~1 lys! during evacuation for calibra-ion. Each of the slits was charged to 128 V to
prevent ambient ions from entering the instrument.Details of all the optical mounts were patterned
after previous designs of aluminum support struc-tures.19 The supports have custom-made structural
Fig. 4. Day TESS simulations. ~a! Diagram of the focal plane ofthe dayglow TESS. To illustrate the spectral resolution, we havesuperimposed a ray trace of three fictitious doublets separated by1.0 nm. The source consisted of 25 line sources 10° wide andequally spaced 0.4° apart in the imaging direction. The circleindicates the active area of the detector. ~b! X and Y histogramsfor this ray trace, assuming a 150-mm detector resolution.
webbing for high rigidity and low mass. Two VitonO rings were used as an interface between the alu-minum mounts and the glass optics.
5. Detector Design
Each TESS spectrograph utilizes a 40-mm-diameteractive-area microchannel plate ~MCP! detector with awedge-and-strip photon-counting readout. This de-sign was chosen because it offered low noise and thedynamic range necessary for the expected signal.To cover the passband at a 1-nm resolution, we re-quired only 150 bins ~2.5 binsyresolution element forthe day spectrograph and 5 binsyresolution elementfor the night spectrographs! and a 40-mm-diameteractive area. Based on expected signals,20,21 we cal-culated a maximum ~burst! count rate of 20 kHz forthe entire bandpass ~80–140 nm!.
The details of the operational characteristics of theedge-and-strip readout are well known, and life
ests were performed with MCP’s in windowless EUVetectors22 that showed that the MCP’s continue to
Fig. 6. Initial sensitivities @in counts per second ~cps!yRayleigh#of the four night instruments ~TESS A–TESS D! compared withtheoretical calculations. The data compare well with the theoryexcept at longer wavelengths ~.120 nm! at which the detectorquantum efficiencies dropped off faster than did the nominal KBrmeasurements.
Fig. 5. Night TESS simulations. Same as Fig. 4, except for thenight instrument design and fictitious doublets separated by 2.0nm.
Fig. 7. Initial sensitivity of the day TESS instrument comparedwith theoretical calculations. The discrepancy between the dataand calculations was due to reduced quantum efficiencies in thedetector.
1 August 2000 y Vol. 39, No. 22 y APPLIED OPTICS 3995

13
a
oapsamsflptmIfl
utlbTpv
3
operate nominally, even after an exposure to 10countsycm2. At the maximum count rate of 20 kHz,the detector can operate continuously for 1.5 yearswithout significant loss in performance.
The TESS detector bodies were constructed ofbrazed ceramic–metal for ruggedness, simplicity, andreliability. Each MCP was held in place by an an-nular spring ring that applied an even pressurearound its circumference. A stack of three back-to-back MCP’s was utilized, each of which had a channeldiameter of 12.55 mm and a channel length-to-diameter ratio of 80:1 with a bias angle of 13°. Thisconfiguration yielded high gain ~.2 3 107! with rea-sonable pulse height distributions ~,80% FWHM!nd low background rates ~,0.5 event s21 cm22!. A
KBr photocathode was deposited onto the top MCP ofthe four night instruments to enhance the quantumefficiency at 80–140 nm. The plates were left barefor the day instruments to reduce sensitivity primar-ily at longer wavelengths. The required resolutionperformance ~150 mm FWHM! was easily achieved.
For this mission it was important that the detectorand electronics remain stable so the image map datagenerated during calibration would remain validthroughout the flight. Although efforts were madein instrument design and calibration to stabilize thesystem, we anticipated some electronic gain or lin-earity shift after launch; periodic in-flight calibrationusing stars ~radiometric! and the airglow itself ~wave-length! was planned. Using the known airglow lines~e.g., 83.4, 98.9, 130.4, and 135.6 nm! as well as stel-lar spectra, we could detect and correct for changes inthe electronic and linearity, gain, and dc offsets to theoptical resolution of the spectrographs.
6. Readout Electronics
The TERRIERS satellite flew three identical sets ofelectronics to support TESS that comprised five pri-mary MCP-based spectrographs and a sixth detectorfor a secondary instrument.23 Each set, contained inits own enclosure, consisted of two charge-sensitiveamplifier ~CSA! boards, located on opposite sides of adual pulse-position analyzer ~PPA! board ~see Fig. 8!.Each CSA converts a charge cloud deposited upon ananode by a MCP-based detector into analog voltagepulses that are passed to the PPA section of the elec-tronics. The PPA converts the three voltage pulsesinto an ~X, Y! photon location and a pulse heightsignal A that is used as a diagnostic tool for detectorcharacterization. Each of these three signals is dig-itized by a 12-bit analog-to-digital converter andforms the trio X, Y, and A.
The final stage of the PPA consists of a field-programmable gate array ~FPGA! digital logic sec-tion. A single field-programmable gate arrayhandles all the digital logic required by both PPA’sand, in addition, handles the electrical interface be-tween the PPA and a payload data interface board.The payload data interface was the interface betweenthe various TERRIERS experiments and the TERRI-ERS spacecraft processor.
996 APPLIED OPTICS y Vol. 39, No. 22 y 1 August 2000
7. Calibration
Because of constraints in the schedule and concernsabout degradation ~see Section 8 below!, we devel-ped a calibration plan that relied on both groundnd in-flight techniques. We verified the TESS’serformance on the ground in terms of sensitivity andpectral resolution; detailed calibrations of FOV andbsolute sensitivity were deferred to space-basedeasurements. These on-orbit measurements had
ome distinct advantages compared with our pre-ight calibrations. They utilized both calibratedoint sources ~stars! and sharp spatial emission fea-ures ~the limb!, which, unlike the ground measure-ents, fill the aperture and the FOV simultaneously.
n this section, however, we describe only the pre-ight calibration techniques and results.The TESS were calibrated at Boston University’s
ltraviolet calibration facility. A block diagram ofhe system used is shown in Fig. 9. The EUV–FUVight source is a hollow-cathode discharge lamp com-ined with a grazing-incidence monochromator.he test sample, full instrument or component, waslaced upon a four-axis manipulator inside the mainacuum system. A silicon photodiode calibrated by
Fig. 8. TESS readout electronics block diagram. Note that eachset of electronics supports two detectors. W, S, Z, wedge, strip,and zig, respectively.

the National Institute of Standards and Technologywas used as a standard for absolute radiometric cal-ibrations, and a secondary MCP detector was used forreflective measurements of the gratings. End-to-end measurements of the FOV and the spectral res-olution of the instruments were made.
The initial sensitivity of each of the instruments isshown in Figs. 6 and 7. The data consist of detectorquantum-efficiency measurements combined withgrating reflectance measurements at five wave-lengths. The reflectance measurements were madeat three positions on the gratings with a beam size ofapproximately 2.5 mm 3 20 mm ~dispersion 3 imag-ing!. Data for the detectors were provided by themanufacturer. The error bars are 61s and repre-sent statistical errors only.
The sensitivity measurements for the night instru-ments compare well with the theoretical curve, ex-cept at longer wavelengths, whereas the dayinstrument showed degraded sensitivity performanceat the shorter wavelengths. Measurements of theblaze efficiency of the gratings indicated that thegratings were performing as expected ~see Fig. 10!.The longer wavelength cutoff and poor day instru-ment performance were due to depressed quantumefficiencies of the MCP’s, which were traced to theintrinsic performance of the MCP’s.24
We made FOV measurements in the dispersionplane of the end-to-end instruments by making suc-cessive relative measurements at various angles tothe slit. Figure 11 shows a typical set of data. Thedouble maximum is due to the bipartite constructionof the mechanically ruled grating. The FOV mea-
Fig. 9. Block diagram of the TESS calibration setup. The instruits slits for various points in its FOV. The light source was a holloThe beam was monitored by a photodiode mounted upon an arm
surements were integrated and scaled to yield theoverall sensitivity of the instrument for that partic-ular image direction.
Using the FOV measurements described above, weshowed that the spectral resolutions of the instru-ments at a particular imaging angle near the centerof the cross-dispersion FOV were within the specified2 and 1 nm for the night and the day instruments,
t was placed upon a four-axis manipulator such that light enteredthode discharge lamp feeding a grazing-incidence monochromator.could swing in and out of the beam.
Fig. 10. Blaze efficiency of a grating in the TESS for severalwavelengths at the 0 and the 21 orders. The curves indicatecalculated blaze efficiency curves for comparison. The data indi-cate a good blaze ~as indicated by the depressed zero-order effi-ciency! near 80 nm. We computed the measured efficiencies byusing reflectivity measurements and calculated reflectivities ofSiC. The error bars are 61 s errors that are due to statistics inthe reflectivity measurements of the grating.
menw-cathat
1 August 2000 y Vol. 39, No. 22 y APPLIED OPTICS 3997

mm
3
respectively, of the TESS. We also mounted thehollow-cathode discharge source directly onto thevacuum chamber to illuminate the back wall of thetank. From images of the illuminated wall, we de-rived the spectral resolution. Figure 12 is an exam-ple of one such image. These data confirmed theFOV spectral resolution measurements describedabove and provided a picture of the detector distor-tion.
8. Sensitivity Degradation
The TESS sensitivities were vulnerable to degrada-tion during fabrication, integration, and testing.The KBr photocathodes were hygroscopic and there-fore degraded quantum efficiency,25 and the SiC op-tical coatings were susceptible to particulate andhydrocarbon contamination. Thus special care wastaken to keep the instruments dry and clean. Allfabrication was carried out in a class 100 environ-ment; integration was carried out in a class 10,000
Fig. 11. FOV data for one element of the TESS at 115.2 nm. The61s error bars that are due to counting statistics are much smallerthan the symbols shown.
Fig. 12. TESS spectrograph image of the back wall of the vacuumchamber illuminated by a hollow gas discharge source runningwith oxygen. We used the key emission features ~labeled in nano-
eters! to confirm the spectral resolution of the instruments andap out distortions in the detector and electronics.
998 APPLIED OPTICS y Vol. 39, No. 22 y 1 August 2000
environment. Whenever possible the instrumentwas purged with dry nitrogen, and we attempted tomonitor the contamination of the optics by means ofwitness samples, which were calibrated every 3months.
When delays caused the availability of our launchvehicle to slip 6 months beyond the original launchdate ~30 April 1997! and our witness samples showedsignificant degradation ~;50%!, we refurbished theinstruments. A recalibration showed a factor-of-5loss in sensitivity. Although the witness samplesshowed a 50% loss in reflectivity, we measured one ofthe gratings and found its loss to be no more than10%. We attributed this difference to the fact thatthe witness samples were subjected to significantlymore handling, including undergoing several cyclesin our vacuum calibration system.
Because there was no significant degradation inthe optics, we concluded that the photocathode quan-tum efficiency must have degraded by nearly a factorof 5. This degree of degradation is quite unusual, asprevious measurements showed that KBr is fairlystable.25 Ultimately, we decided to recoat only thedetectors, because recoating the gratings would in-volve significantly more risk to the schedule. Thenew photocathodes restored the sensitivity to within80% of the original value. Subsequently, we added ahygrometer to the system and adjusted the purge tomaintain ,5% relative humidity in the system.
9. TERRIERS Mission
The TERRIERS satellite was launched on 18 May1999. Unfortunately, the mission came to an endshortly thereafter ~;10 hours later! because of anattitude control failure. Because of constraints inthe communication system we were never able toturn on the instruments, and no flight data for theseinstruments were taken. However, slightly modi-fied spares ~slit size only! for these instruments havebeen flown successfully on two astrophysics soundingrocket missions.26
We are grateful to Steve Battel, Joe Demuze, BobGoeke, John Mangus, Oswald Siegmund, and BernieBach for their significant contributions to this project.We thank Paul Coleman for the opportunity STEDIprovided, and we dedicate this study in memory ofJack Sevier, who skillfully managed the STEDIproject. This research was supported by UniversitySpace Research Association STEDI contract 1500-05.
References and Notes1. J. L. Burch, “IMAGE mission overview,” Space Sci. Rev. 91,
1–14 ~2000!.2. D. M. Cotton, T. Cook, and S. Chakrabarti, “A single element
imaging spectrograph,” Appl. Opt. 33, 1958–1962 ~1994!.3. P. A. Bernhardt, R. P. McCoy, K. F. Dymond, J. M. Picone,
R. R. Meier, F. Kamalabadi, D. M. Cotton, S. Chakrabarti, J. S.Vickers, A. W. Stephan, L. Kersley, S. E. Pryse, I. K. Walker,J. A. T. Heaton, C. N. Mitchell, P. R. Straus, H. Na, C. Biswas,G. R. Kronschnalbl, and T. D. Raymund, “Two dimensionalmapping of the plasma density in the upper atmosphere with

computerized ionospheric tomography ~CIT!,” Phys. Plasmas recovering two-dimensional distributions of auroral emission
5, 2010–2021 ~1998!.4. J. Radon, “Uber die Bestimmung von Funktionen durch ihreIntegralwerte langs gewisser Mannigfaltigkeiten,” Math.-Phys. Kl. 69, 262–277 ~1917!.
5. F. Kamalabadi, W. C. Karl, J. L. Semeter, D. M. Cotton, T. A.Cook, and S. Chakrabarti, “A statistical framework for space-based EUV ionospheric tomography,” Radio Sci. 34, 437–447~1999!.
6. E. S. Andreeva, A. V. Galinov, V. E. Kunitsyn, Y. A.Melnichenko, E. E. Tereschenko, M. A. Filimonov, and S. M.Chernyakov, “Radio-tomographic reconstruction of ionizationtrough in the plasma near the Earth,” J. Exp. Theor. Phys.Lett. 52, 145–148 ~1990!.
7. V. E. Kunitsyn and E. D. Tereshchenko, Tomography of theIonosphere ~Nauka, Moscow, 1991!.
8. V. E. Kunitsyn and E. D. Tereshchenko, “Tomography of theionosphere,” Antennas Propag. Mag. 34~5!, 22–32 ~1992!.
9. S. E. Pryse and L. Kersley, “A preliminary experimental test ofionospheric tomography,” J. Atmos. Terr. Phys. 54, 1007–1012~1992!.
10. S. E. Pryse, L. Kersley, R. L. Rice, C. D. Russell, and I. K.Walker, “Tomographic imaging of the ionospheric mid-latitudetrough,” Ann. Geophys. 11, 144–149 ~1993!.
11. T. D. Raymund, S. E. Pryse, L. Kersley, and J. A. T. Heaton,“Tomographic reconstruction of ionospheric electron densitywith European incoherent scatter radar verification,” RadioSci. 28, 811–817 ~1993!.
12. J. C. Foster, J. A. Klobuchar, V. E. Kunitsyn, E. D. Teresh-chenko, E. S. Andreeva, M. J. Buonsanto, P. Fougere, J. M.Holt, B. Z. Khudukon, W. Pakula, and T. D. Raymund,“Russian–American tomography experiment,” Int. J. ImagingSyst. Technol. 5, 148–159 ~1994!.
13. S. C. Solomon, P. B. Hayes, and V. J. Abreu, “Tomographicinversion of satellite photometry,” Appl. Opt. 23, 3409–3414~1984!.
14. S. C. Solomon, P. B. Hayes, and V. J. Abreu, “Tomographicinversion of satellite photometry. 2,” Appl. Opt. 23, 3409–3414 ~1984!.
15. I. C. McDade and E. J. Llewellyn, “Inversion techniques for
rates from tomographic rocket photometer measurements,”Can. J. Phys. 69, 1059–1068 ~1991!.
16. I. C. McDade, N. D. Lloyd, and E. J. Llewellyn, “A rockettomography measurement of the N2
1 3914 Å emission rateswithin an auroral arc,” Planet. Space Sci. 39, 895–906 ~1991!.
17. R. A. Keski-Kuha, J. F. Osantowski, H. Herzig, J. S. Gum, andA. R. Toft, “Normal incidence reflectance of ion beam depositedSiC films in the EUV,” Appl. Opt. 27, 2815–2816 ~1988!.
18. P. Jelinsky and S. Jelinsky, “Low reflectance EUVmaterials—a comparative study,” Appl. Opt. 26, 613–615~1987!.
19. J. Tom, D. M. Cotton, B. C. Bush, R. Chung, and S.Chakrabarti, “Rigid lightweight optical bench for a spaceborneFUV spatial heterodyne interferometer,” in EUV, X-Ray, andGamma-Ray Instrumentation for Astronomy II, O. H. Sieg-mund and R. E. Roghschild, eds., Proc. SPIE 1549, 302–307~1991!.
20. S. Chakrabarti, F. Paresce, S. Bowyer, R. Kimble, and S. Ku-mar, “The extreme ultraviolet day airglow,” J. Geophys. Res.88, 4898–4904 ~1983!.
21. S. Chakrabarti, R. Kimble, and S. Bowyer, “Spectroscopy of theEUV ~350–1400 Å! nightglow,” J. Geophys. Res. 89, 5660–5664 ~1984!.
22. R. F. Malina and K. R. Coburn, “Comparative lifetesting re-sults for microchannel plates in windowless EUV photon de-tectors,” IEEE Trans. Nucl. Sci. NS-31, 404–407 ~1984!.
23. J. S. Vickers, D. M. Cotton, T. A. Cook, and S. Chakrabarti,“Gas ionization solar spectral monitor ~GISSMO!,” Opt. Eng.32, 3126–3131 ~1993!.
24. R. Hemphill, J. Edelstein, and D. Rogers, “Chemical method toincrease extreme ultraviolet microchannel-plate quantum ef-ficiency,” Appl. Opt. 36, 1421–1426 ~1997!.
25. O. H. W. Siegmund, E. Everman, J. V. Vallerga, J. Sokolowski,and M. Lampton, “Ultraviolet quantum detection efficiency ofpotassium bromide as an opaque photocathode applied to mi-crochannel plates,” Appl. Opt. 26, 3607–3614 ~1987!.
26. T. Cook, V. Taylor, S. Chakrabarti, and F. Kamalabadi arepreparing a paper to be called “A high resolution ultravioletspectral imaging system.”
1 August 2000 y Vol. 39, No. 22 y APPLIED OPTICS 3999