tom ivar barka lead planner at bergen group rosenberg bergen group [email protected]
DESCRIPTION
Proteus – Between Safran and IFS at Bergen Group Rosenberg …and more. Tom Ivar Barka Lead Planner at Bergen Group Rosenberg Bergen Group [email protected] November, 2012. Bergen Group Rosenberg. Employees. Overview of data to integrate. Activities. Act .Table. Compare. - PowerPoint PPT PresentationTRANSCRIPT

Tom Ivar BarkaLead Planner at Bergen Group Rosenberg
Bergen [email protected]
November, 2012
Proteus – Between Safran and IFSat Bergen Group Rosenberg
…and more

Bergen Group Rosenberg
Employees

Overview of data to integrate
• Activities and their R-Fields• Calendars (for timephasing)
• Activities Table (to compare)• AO Table• PO Table• DocPkg (DP) Table• Doc. Table• Oper Table• Eng. Obj. Table
Planners Workspace
Compare
AO Table
PO Table
DP Table
Activities Act .Table
[Level 5]
[Level 4]
Oper Table
Doc Table[Level 6]
Eng. Obj. Table

Logging on to «Planners Workspace»
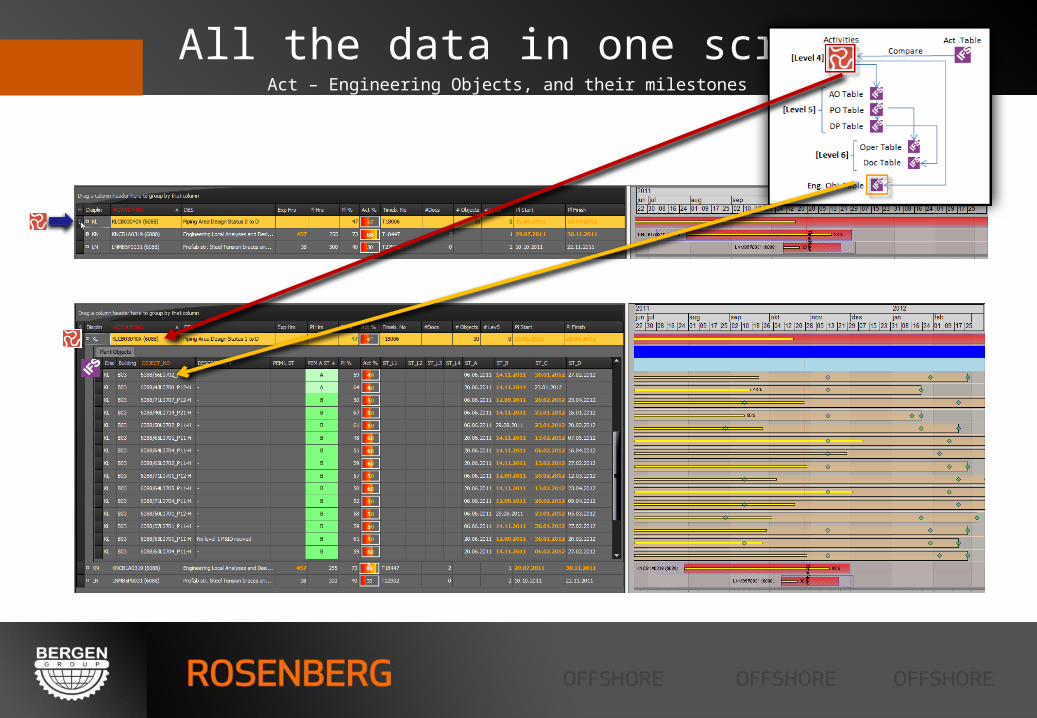
Act – Engineering Objects, and their milestones
All the data in one screen

Act – DocPkgs - DocumentsAll the data in one screen

Act – POs - OperationsAll the data in one screen

The 3 activities expanded at the same time.All the data in one screen
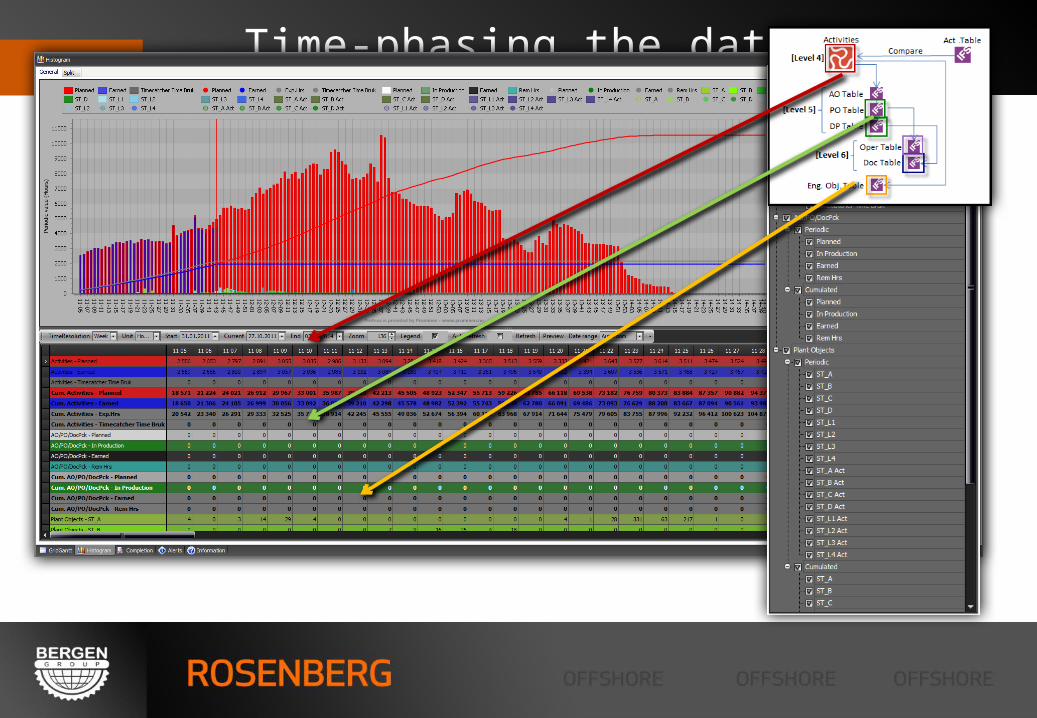
And then turn on and off what you need to seeTime-phasing the data

Can be exported to various other formats than pdfObject Statuses on a timeline

On Level 4 and Level 5 dataSplit histograms

Planners Workspace
Makes a planners life easier
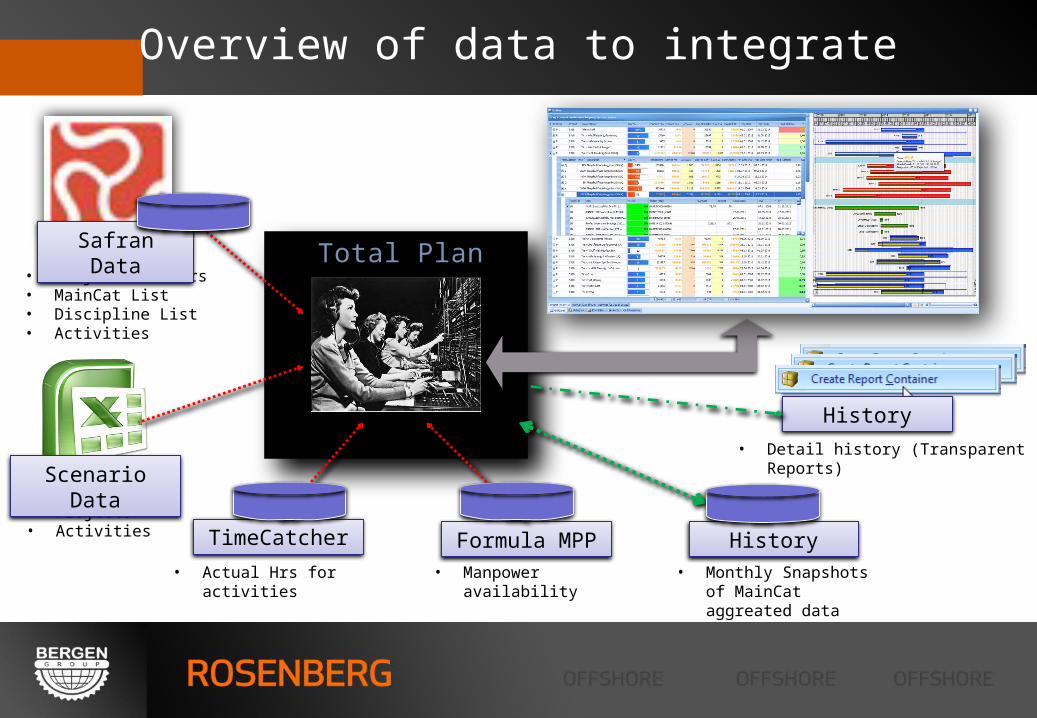
Overview of data to integrate
• Projects/Tenders• MainCat List• Discipline List• Activities
Total Plan
TimeCatcher Formula MPP
• Projects• Activities
• Actual Hrs for activities • Manpower availability
History• Monthly Snapshots of
MainCat aggreated data
History
• Detail history (Transparent Reports)
Scenario Data
Safran Data

Drill down from Project level to activity level, show changes relative last monthProject portfolio overview

Pivot on the delta to see changes (per MainCat) relative last monthProject portfolio overview

Show historic tracking as well as live forecast.Project portfolio overview

Compare resource availability with demand for a selected set of activitiesProject portfolio overview
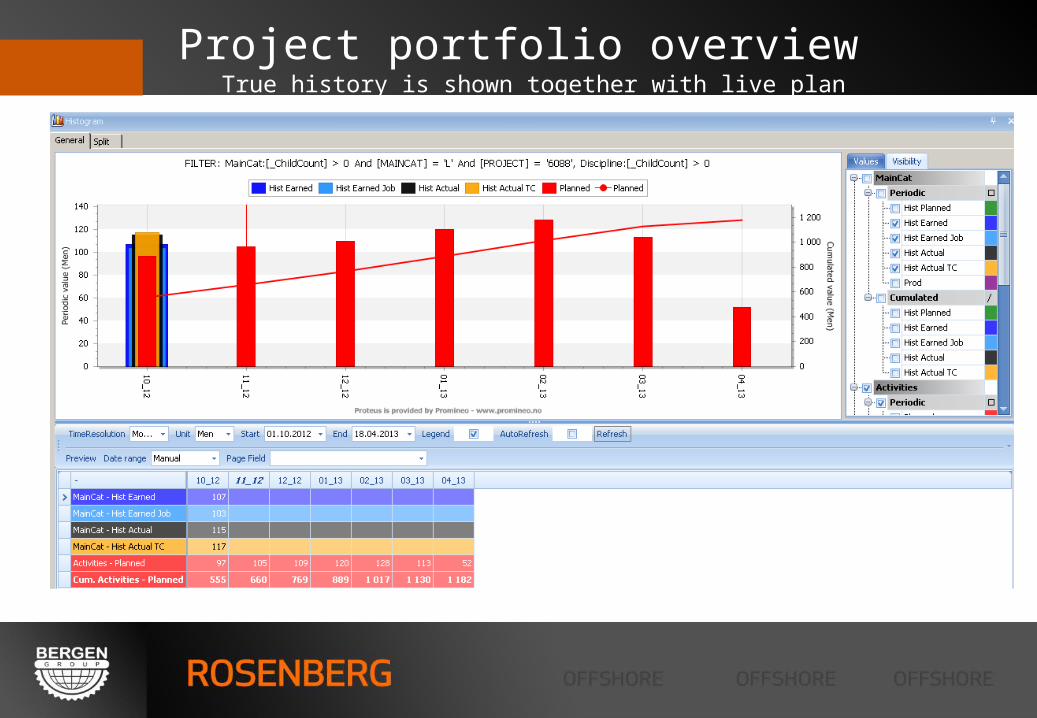
True history is shown together with live planProject portfolio overview

4 Key features of the solution:Project portfolio overview
1. Drill-Down Portfolio Overview with KPI values derived from lowest level data.2. Generate Historical Tracking of Earned Value Metrics (Scope, Actuals, Earned) at
aggregated level (*). Show in histogram together with forecast data from live plan.3. Pulling data from resident MPP (Manpower Projection System) to get correlation
between demand and supply of resources.
4. (*) A «Report Container» will be saved at each cutoff (Month) to allow revisiting detail status at later time – and create audit trails.
The concept of storing histotoric data at aggregated level makes system «lean» (adds to performance) while the option is open to revisit any point in history with the «same Proteus UI» with full details and reporting options.
Project portfolio overview

Overview of data to integrate
Cost & Weight
• Manual Items• Weight Factors
Weight Factors
User Overrides
Comp Format
PDMS Data
Manual Items
Vie
w
ADMIN

Weight and Cost Drill Down into details from project and disciplineContract follow up on weight and cost

Allows deriving costsCombining PDMS items with Comp Schedule

Raw (measurement) Data from PDMSContract follow up on weight and cost
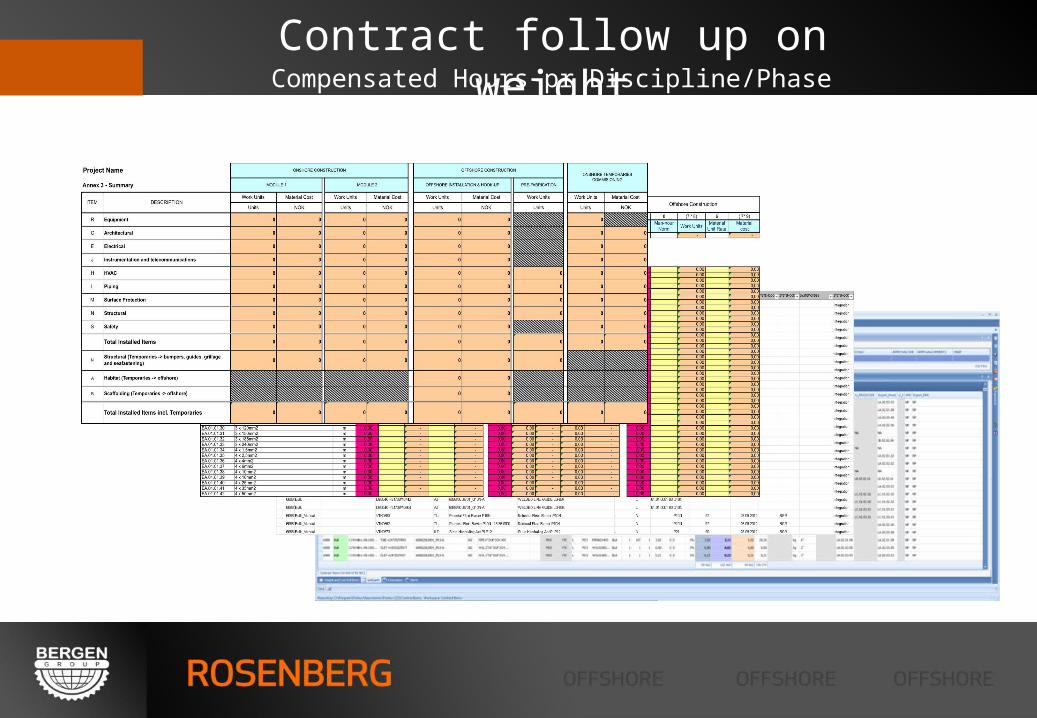
Contract follow up on weightCompensated Hours pr Discipline/Phase

Using Proteus to combine PDMS data with Comp Schedule to do cost and weight reports
Contract follow up on weight and cost
