tolerances and uncertainties in performance data of ... · tolerances and uncertainties in...
TRANSCRIPT
Published by:
2111 Wilson Blvd, Suite 500 Arlington, Virginia 22201 USA
+001 (703) 524-8800
JANUARY 2017
TOLERANCES AND UNCERTAINTIES IN PERFORMANCE DATA OF
REFRIGERANT COMPRESSORS
TABLE OF CONTENTS
SECTION PAGE Preface ............................................................................................................................................... 1 Measurement Uncertainty ................................................................................................................... 2 Lab-to-Lab Testing Reproducibility Uncertainty.................................................................................... 4 Manufacturing Uncertainty .................................................................................................................. 5 Performance Prediction Uncertainty .................................................................................................... 7 Tested vs. Rated Condition Uncertainty............................................................................................... 8 References ....................................................................................................................................... 10
1
PREFACE
The rating standards for compressor and condensing unit performance data assume publication of data representative for the average produced units. The tolerance allowed according to the AHRI and EN standards is regularly reconsidered during revisions. These standards do contain descriptions of the rating conditions and associated tolerance values. The tolerance values in AHRI 510, AHRI 520, AHRI 540, AHRI 570, EN 12900 and EN 13215 are varying with the rating conditions and are considered necessary with the present state of USA and European production and testing standards. The tolerance allowed for refrigeration capacity of compressors is down to:
-5% at high evaporating temperature (HBP)
-7.5% at medium evaporating temperature (MBP)
-10% at low evaporating temperature (LBP) The COP or EER has a tolerance of down to -10%, only -5% at specific rating points The above standards specify a single tolerance across a range of operating conditions and ranges. However, the impact of production tolerances and the testing uncertainty grows with lower evaporating temperatures namely higher pressure ratio. Testing according to ASHRAE 23 or EN 13771 is the tool to establish and also to verify the performance data. The uncertainty of the verifying method shall be significantly smaller than the tolerance to be kept, according to quality assurance methodology. This paper will discuss five (5) major compressor performance uncertainties:
Measurement uncertainty is based on measurement error in instruments used in compressor performance testing and can cause uncertainties as high as 2.1% in capacity and 1.3% in power input when testing in accordance with industry standards ASHRAE 23 and EN 13771. However, additional systematic uncertainty factors including refrigerant data, oil circulation, test point deviation, and stability of operation conditions add to these uncertainty values but are not able to be calculated statistically.
Lab to lab testing reproducibility uncertainty is based on differences in measurement points, equipment calibration, measurement method, electrical grid quality, and refrigerant properties. These can account for uncertainties as high as 2.1% in capacity and 2.3% in efficiency when testing in accordance with industry standards ASHRAE 23 and EN 13771.
Manufacturing uncertainty caused by compressor dead volume, variations in machining parts, electric motor efficiency, internal gas leaks, bearing alignments, and mechanical losses in friction surfaces will typically produce uncertainty of 1.5% in capacity .
Performance prediction uncertainty is a result of curve fitting compressor performance maps using a limited number of test points to validate calculations. Average uncertainty can be as high as 4% and 5% for mass flow rate and power prediction respectively. Maximum absolute error can be as high as 17% and 9% for mass flow rate and power prediction, respectively.
Tested vs rated condition uncertainty is a result of testing to slightly different than rated conditions within the limits of the standard that can create errors in mass flow/capacity and power of up to 1.5 % and 2% respectively.
Reaching lower than referenced uncertainty values would require the development of completely new standard test methods and set ups that most certainly will be farther away from real life refrigeration systems than present procedures.
2
MEASUREMENT UNCERTAINTY
Measurement uncertainty in test standards Compressor and condensing unit test standards do state maximum or limit values for uncertainties. The values are target measurement uncertainties for single measured quantities. The resulting uncertainty for the performance data can be calculated based on this to approximate the values for refrigeration capacity of compressors:
±1.5% at high evaporating temperature (HBP)
±2.1% at low evaporating temperature (LBP)
The resulting uncertainty for power input reaches approximately ±1.3%. The resulting uncertainty for the COP thus reaches approximately:
±2% at high evaporating temperature (HBP)
±3% at low evaporating temperature (LBP) The wording in the standards differs, as not all standards are fully aligned with the ISO/IEC Guide 98-3 (standard derived from the GUM – Guide to the expression of uncertainty in measurement) and ISO/IEC Guide 99 (derived from VIM – International vocabulary of metrology). The uncertainties stated in the test standards are for the measured quantity values, e.g., for the temperature or pressure reading of a fluid. The stated uncertainty is thus the combined uncertainty, including type A uncertainties – based on statistical determination, and type B – based on non-statistical determination. Type B includes the systematic errors or bias of instrumentation and sensor placement. As an industry standard, ASHRAE 23 and EN 13771-1 handle uncertainty in the same way as IEC standards, meaning an expanded uncertainty with a 95% level of confidence. This equals to approximately 2 times standard deviation, if only type A uncertainty values are included. Measurement uncertainty type A and B: Compressor testing standards, ASHRAE 23 and EN 13771-1, do require calibration of the instrumentation (measurement chain) used. From the repeated readings during calibration, type A uncertainties, the statistical part can be calculated. Non statistical parts of the instrumentation uncertainty, i.e. type B parts (systematic), are calculated from the deviations between average readings and reference values during the calibration process and thus can be corrected. Where type B uncertainties cannot be determined in size and direction by calibration, they shall be handled in the same manner as type A uncertainties. Measurement uncertainty limits The test standards ASHRAE 23 and EN 13771 list maximum allowed uncertainties for the measurement of the necessary quantities with the following important example values:
Temperature ±0.3 K or ±0.5 °F
Temperature differences ±1% of the difference
Pressure ±1% of value
Electrical power ±1% of value The calibration has to be traceable back to national or primary standards. Type B uncertainty based on other influence factors Additional type B uncertainty due to deviations from ideal testing can be recognized, but not determined accurately. Possible influences include:
Uncertainty of refrigerant data: Refrigerant data are calculated with software based on experimental data. They can have different sources and might differ or might be changed or improved over time. Thus data at testing time and later re-testing might differ slightly. The impact on the performance data is estimated to be greater than 1%.
Oil circulated in the system: Most types of positive displacement compressors use oil as a lubricant and transport a very small portion of it with the refrigerant mass flow. The impact can
3
only be estimated based on experience, or limited by technical means, like an oil separator. The oil influence theoretically varies depending on the test method chosen from the test standard, the oil-refrigerant mixture used, and the operating conditions. Using an oil separator reduces the impact of oil, but changes the operating conditions compared to real life systems. Thus oil separators are recommended only at oil contents above approximately 1.5% in the refrigerant. This oil content can have an impact on the performance data up to an estimated approximately 2%.
Deviation of conditions from set values: During testing, the stabilized operating conditions can differ slightly from the targeting values. The impact of this will be discussed separately.
Stability of operating conditions: The determination of refrigeration capacity via the mass flow of refrigerant assumes: that the mass flow at the measuring point in the system, e.g., an evaporator calorimeter, is identical to the mass flow through the compressor, for the testing period. This is valid, if all pressures, temperatures, and other conditions are completely stable. As this is an ideal situation, there are small deviations in heat balances, due to accumulation or drain of heat due to thermal inertia in masses, that are not detectable within the usual operating conditions. Even in test rigs, the conditions will vary slightly, covering for these inertia influences and also making it necessary to work with averaged values. Averaged values are only an approximation to a constant value, as the process does not have strictly linear influence factors only. In well-designed test rigs, these two influences should be quite small.
4
LAB-TO-LAB TESTING REPRODUCIBILITY UNCERTAINTY
Lab-to-lab reproducibility means reproducibility of a compressor test in a different lab, having the same physical product at the same operating points and with the same refrigerant, using a measurement standard such as EN13771-1. The uncertainties among laboratories are based on:
Allowed deviations of pressure, temperature, speed, and voltage.
Calibration of measurement devices
Measurement methods, such as volume flow measurement or mass flow measurement on suction or discharge side
Electrical grid quality
Refrigerant properties or refrigerant properties database In 2012, ASERCOM developed a large test program to quantify lab-to-lab reproducibility. The laboratories of seven different European compressor manufacturers, along with private, independent labs, participated in this test program. All labs had previously been audited by the TÜV Süd. A piston compressor with about 100 m³/h displacement was circulated among these labs and was measured at each lab at 14 different operating points according to EN13771-1. The measurement was done with R404A refrigerant and took into account medium and low back pressure operating points. Cooling capacity and power consumption where measured at each lab. To evaluate the results, an arithmetic mean was calculated for each operating point in power consumption and cooling capacity. Then the deviation between the arithmetic mean and the single measured values had been investigated and a normal distribution was plotted. The maximum deviation for all values within 2 times standard deviation has been determined and is the following: Low back pressure
Cooling capacity +/- 2.1%
Power consumption +/- 1.2%
COP/EER +/- 2.3% Medium back pressure
Cooling capacity +/- 1.5%
Power consumption +/- 1.5%
COP/EER +/- 1.8% The results show a larger deviation in cooling capacity in low back pressure. Due to the lower suction pressure, low back pressure cooling capacity is harder to measure. Deviations of COP/EER show that 95% of the measured values have a deviation of 2.3% or smaller to the arithmetic mean. The maximum deviation of a single point between two labs was 6.5%.
5
MANUFACTURING UNCERTAINTY
Dead Volume In the listed tolerances, especially for the refrigeration capacity, the deviation allowance for LBP operation is larger than for HBP. This allows for the typical behavior of, for example reciprocating compressors, which are often used for LBP and MBP. Reciprocating compressors do have a dead volume, which is necessary to avoid the piston hitting the valve plate. Dead volume can be 2% to 3% of the cylinder displacement and can vary in production due to machining tolerances in the chain piston - connection rod - crank shaft - housing – gasket, which together form a series. Assuming the dead volume varies by ±0.5 percentage points, a calculation shows the impact on the displacement utilization, also called the volumetric efficiency. Using rating points for AC/HBP and LBP shows, depending on the refrigerant used, the approximate impact of 0.5 % additional dead volume:
AC/HBP condition pressure ratio 3 to 4 impact 1.5 to 2% flow
LBP condition pressure ratio 10 to 15 impact 5 to 7.5% flow The efficiency of the compressor does not drop as much, as the compressed gas in the dead volume re-expands and delivers a part of the compression energy back, reduced by the losses. The compressor friction losses are not significant. Thus, the COP is reduced less than the capacity. This is why the COP tolerance is kept the same for all conditions. Product Variation The product variation stems from the variation of a multitude of independent factors each of which varies within their own tolerance limits of manufacturing and assembly. Depending on the design and the technology, the recognized factors have various impacts in force on the cooling capacity, the motor power, and COP. At least, but not limited to, these factors are:
Dead volume of reciprocating compressors versus the temperature range Variations in machining of parts Electric motor efficiency Internal gas leaks (valves of reciprocating or scroll compressor clearances) Bearing alignments Mechanical losses in friction surfaces
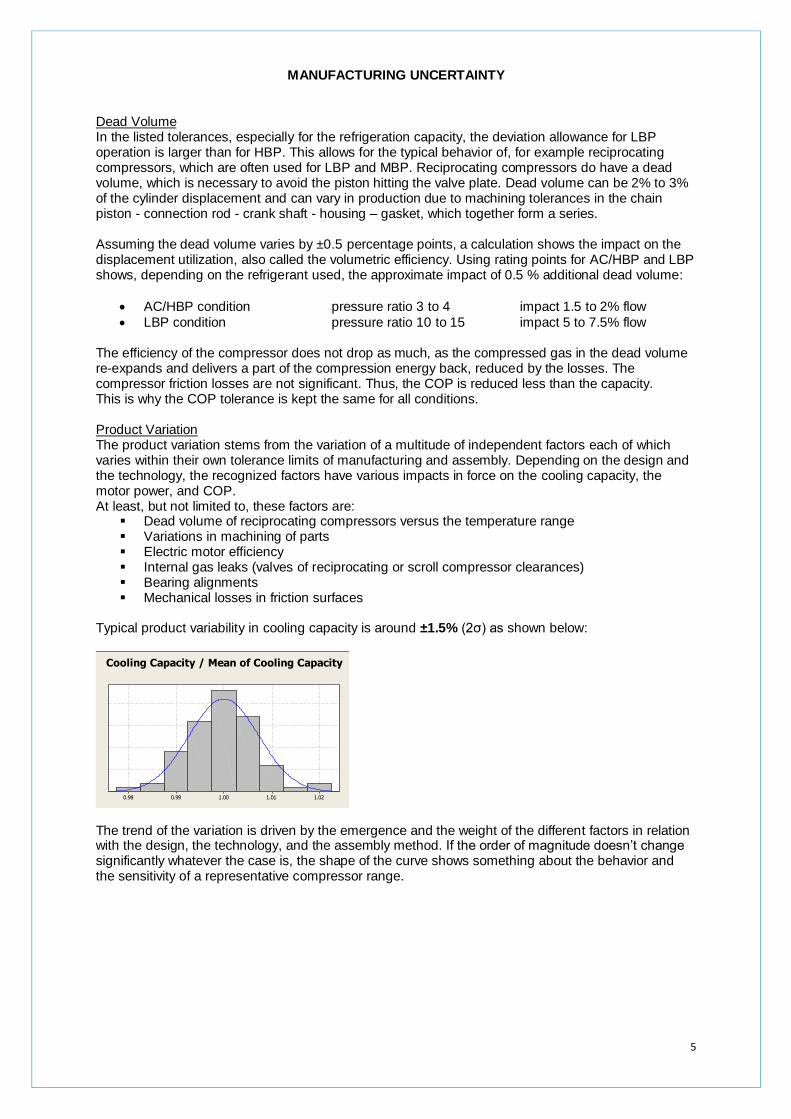
Typical product variability in cooling capacity is around ±1.5% (2σ) as shown below:
1.021.011.000.990.98
Median
Mean
1.0021.0011.0000.9990.998
1st Quartile 0.9963
Median 0.9999
3rd Quartile 1.0045
Maximum 1.0202
0.9983 1.0017
0.9981 1.0019
0.0063 0.0087
A-Squared 0.34
P-Value 0.480
Mean 1.0000
StDev 0.0073
Variance 0.0001
Skewness 0.084115
Kurtosis 0.878458
N 77
Minimum 0.9792
Anderson-Darling Normality Test
95% Confidence Interval for Mean
95% Confidence Interval for Median
95% Confidence Interval for StDev95% Confidence Intervals
Cooling Capacity / Mean of Cooling Capacity
The trend of the variation is driven by the emergence and the weight of the different factors in relation with the design, the technology, and the assembly method. If the order of magnitude doesn’t change significantly whatever the case is, the shape of the curve shows something about the behavior and the sensitivity of a representative compressor range.
6
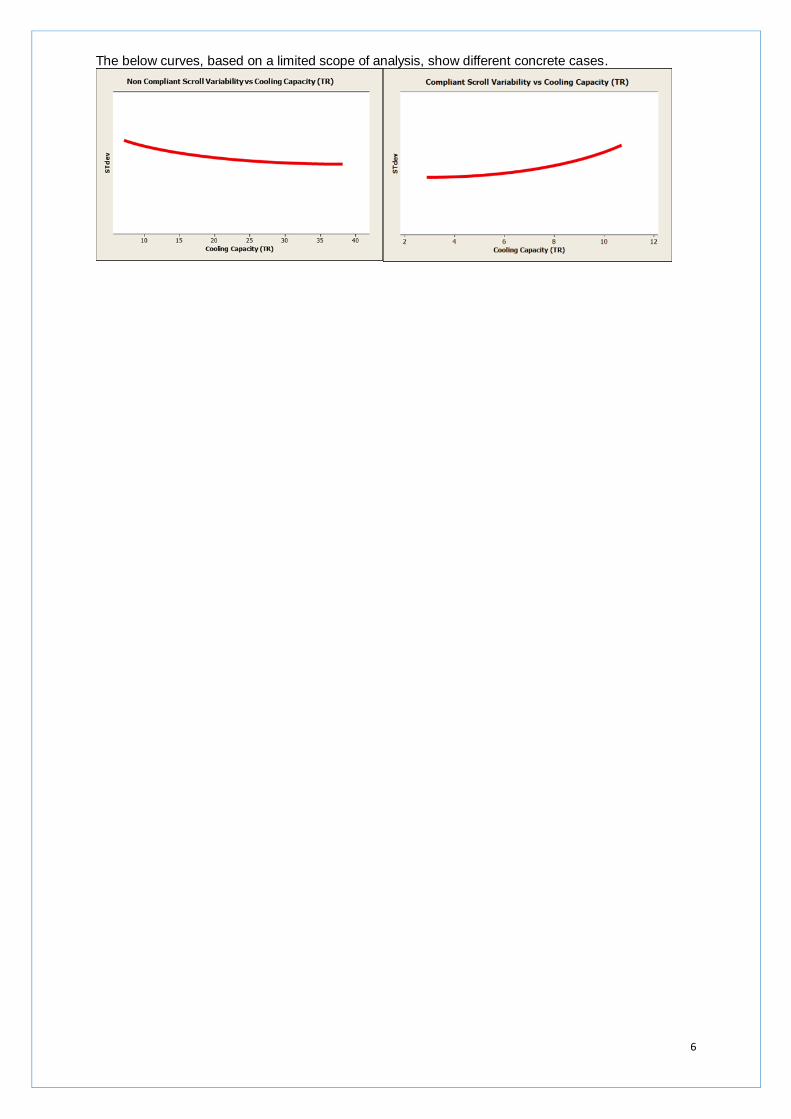
The below curves, based on a limited scope of analysis, show different concrete cases.
7
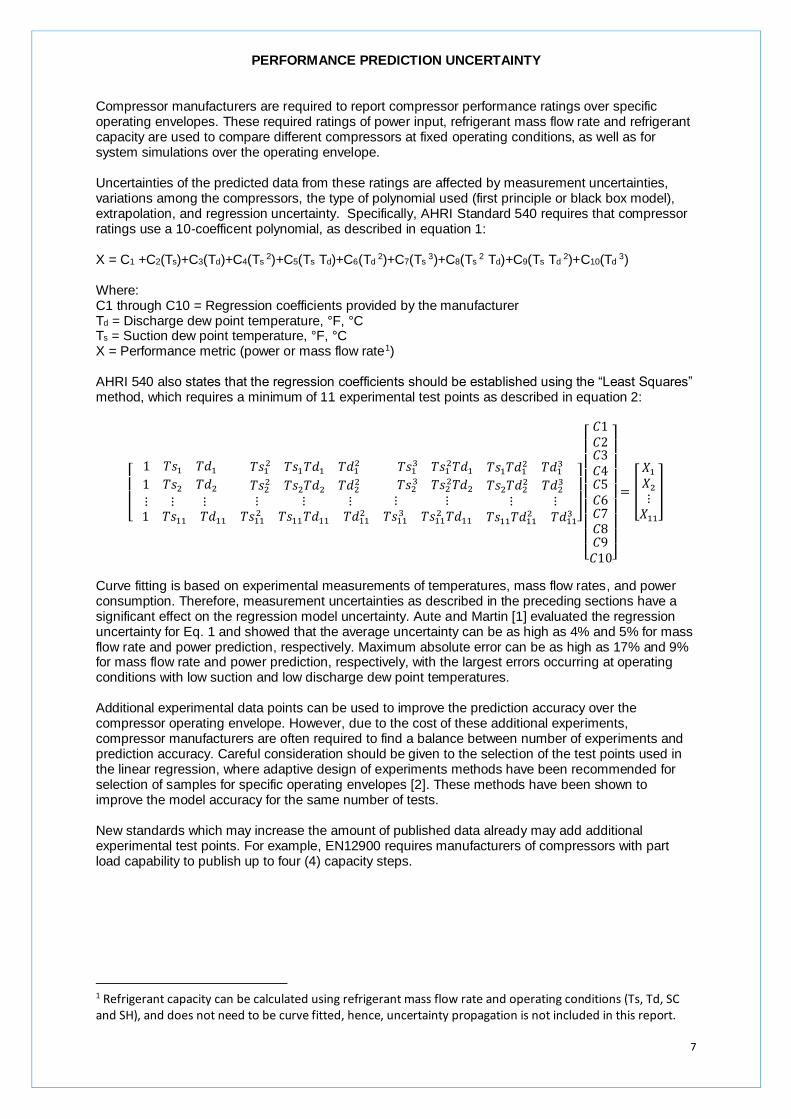
PERFORMANCE PREDICTION UNCERTAINTY Compressor manufacturers are required to report compressor performance ratings over specific operating envelopes. These required ratings of power input, refrigerant mass flow rate and refrigerant capacity are used to compare different compressors at fixed operating conditions, as well as for system simulations over the operating envelope. Uncertainties of the predicted data from these ratings are affected by measurement uncertainties, variations among the compressors, the type of polynomial used (first principle or black box model), extrapolation, and regression uncertainty. Specifically, AHRI Standard 540 requires that compressor ratings use a 10-coefficent polynomial, as described in equation 1: X = C1 +C2(Ts)+C3(Td)+C4(Ts
2)+C5(Ts Td)+C6(Td 2)+C7(Ts
3)+C8(Ts 2 Td)+C9(Ts Td
2)+C10(Td 3)
Where: C1 through C10 = Regression coefficients provided by the manufacturer Td = Discharge dew point temperature, °F, °C Ts = Suction dew point temperature, °F, °C X = Performance metric (power or mass flow rate1) AHRI 540 also states that the regression coefficients should be established using the “Least Squares” method, which requires a minimum of 11 experimental test points as described in equation 2:
[
1 𝑇𝑠1 𝑇𝑑1 𝑇𝑠12 𝑇𝑠1𝑇𝑑1 𝑇𝑑1
2 𝑇𝑠13 𝑇𝑠1
2𝑇𝑑1 𝑇𝑠1𝑇𝑑12 𝑇𝑑1
3
1 𝑇𝑠2 𝑇𝑑2 𝑇𝑠22 𝑇𝑠2𝑇𝑑2 𝑇𝑑2
2 𝑇𝑠23 𝑇𝑠2
2𝑇𝑑2 𝑇𝑠2𝑇𝑑22 𝑇𝑑2
3
⋮ ⋮ ⋮ 1 𝑇𝑠11 𝑇𝑑11
⋮ ⋮ ⋮ 𝑇𝑠11
2 𝑇𝑠11𝑇𝑑11 𝑇𝑑112
⋮ ⋮ ⋮ ⋮𝑇𝑠11
3 𝑇𝑠112 𝑇𝑑11 𝑇𝑠11𝑇𝑑11
2 𝑇𝑑113 ]
[ 𝐶1𝐶2𝐶3𝐶4𝐶5𝐶6𝐶7𝐶8𝐶9𝐶10]
= [
𝑋1
𝑋2
⋮𝑋11
]
Curve fitting is based on experimental measurements of temperatures, mass flow rates, and power consumption. Therefore, measurement uncertainties as described in the preceding sections have a significant effect on the regression model uncertainty. Aute and Martin [1] evaluated the regression uncertainty for Eq. 1 and showed that the average uncertainty can be as high as 4% and 5% for mass flow rate and power prediction, respectively. Maximum absolute error can be as high as 17% and 9% for mass flow rate and power prediction, respectively, with the largest errors occurring at operating conditions with low suction and low discharge dew point temperatures. Additional experimental data points can be used to improve the prediction accuracy over the compressor operating envelope. However, due to the cost of these additional experiments, compressor manufacturers are often required to find a balance between number of experiments and prediction accuracy. Careful consideration should be given to the selection of the test points used in the linear regression, where adaptive design of experiments methods have been recommended for selection of samples for specific operating envelopes [2]. These methods have been shown to improve the model accuracy for the same number of tests. New standards which may increase the amount of published data already may add additional experimental test points. For example, EN12900 requires manufacturers of compressors with part load capability to publish up to four (4) capacity steps.
1 Refrigerant capacity can be calculated using refrigerant mass flow rate and operating conditions (Ts, Td, SC and SH), and does not need to be curve fitted, hence, uncertainty propagation is not included in this report.
8
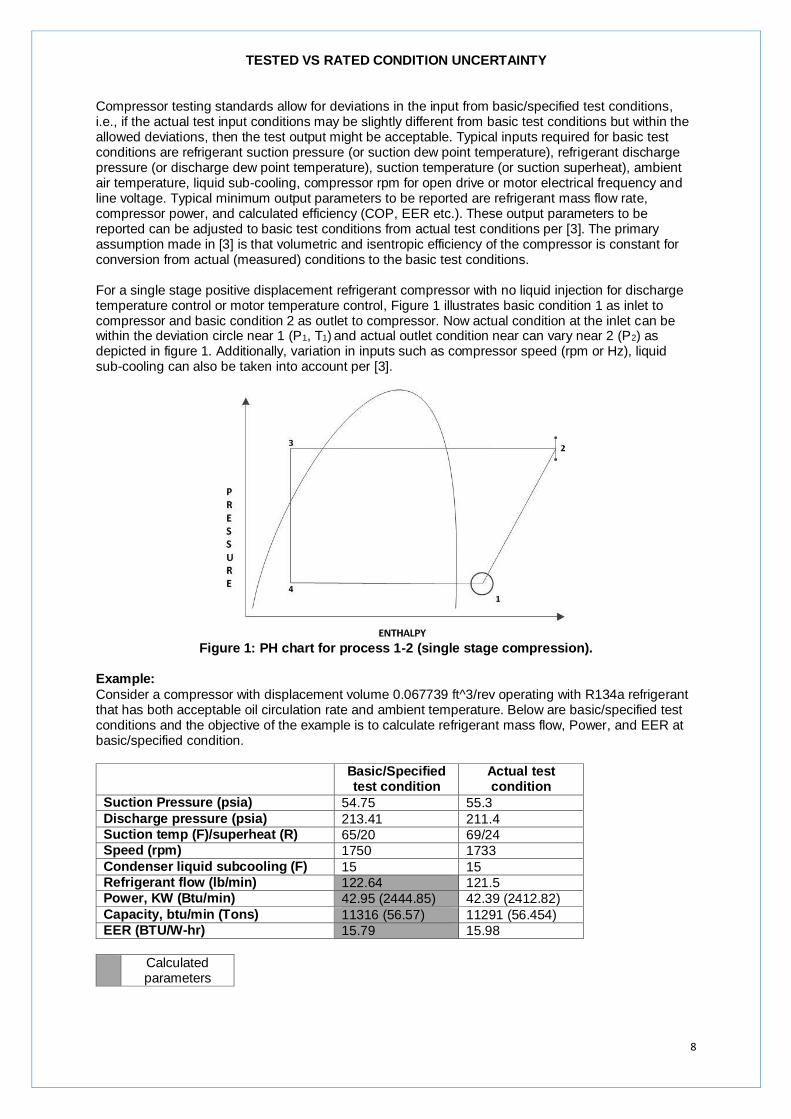
TESTED VS RATED CONDITION UNCERTAINTY Compressor testing standards allow for deviations in the input from basic/specified test conditions, i.e., if the actual test input conditions may be slightly different from basic test conditions but within the allowed deviations, then the test output might be acceptable. Typical inputs required for basic test conditions are refrigerant suction pressure (or suction dew point temperature), refrigerant discharge pressure (or discharge dew point temperature), suction temperature (or suction superheat), ambient air temperature, liquid sub-cooling, compressor rpm for open drive or motor electrical frequency and line voltage. Typical minimum output parameters to be reported are refrigerant mass flow rate, compressor power, and calculated efficiency (COP, EER etc.). These output parameters to be reported can be adjusted to basic test conditions from actual test conditions per [3]. The primary assumption made in [3] is that volumetric and isentropic efficiency of the compressor is constant for conversion from actual (measured) conditions to the basic test conditions. For a single stage positive displacement refrigerant compressor with no liquid injection for discharge temperature control or motor temperature control, Figure 1 illustrates basic condition 1 as inlet to compressor and basic condition 2 as outlet to compressor. Now actual condition at the inlet can be within the deviation circle near 1 (P1, T1) and actual outlet condition near can vary near 2 (P2) as depicted in figure 1. Additionally, variation in inputs such as compressor speed (rpm or Hz), liquid sub-cooling can also be taken into account per [3].
Figure 1: PH chart for process 1-2 (single stage compression).
Example:
Consider a compressor with displacement volume 0.067739 ft^3/rev operating with R134a refrigerant that has both acceptable oil circulation rate and ambient temperature. Below are basic/specified test conditions and the objective of the example is to calculate refrigerant mass flow, Power, and EER at basic/specified condition.
Basic/Specified test condition
Actual test condition
Suction Pressure (psia) 54.75 55.3
Discharge pressure (psia) 213.41 211.4 Suction temp (F)/superheat (R) 65/20 69/24 Speed (rpm) 1750 1733
Condenser liquid subcooling (F) 15 15 Refrigerant flow (lb/min) 122.64 121.5 Power, KW (Btu/min) 42.95 (2444.85) 42.39 (2412.82)
Capacity, btu/min (Tons) 11316 (56.57) 11291 (56.454) EER (BTU/W-hr) 15.79 15.98
Calculated parameters
9
𝜂𝑣𝑎 =𝑚𝑎 . 𝑣𝑎
𝑉.𝑁𝑎
. 100 = 121.5×0.91827
0.067739×1733×100 = 95.04%
𝑄𝑎 = 𝑚𝑎 . (ℎ1𝑎 − ℎ𝑓2𝑎) = 121.5. (178.51 − 85.58) = 11291 𝑏𝑡𝑢/𝑚𝑖𝑛
𝜂𝑖𝑎 =𝑚𝑎(ℎ2𝑖𝑎 − ℎ1𝑎)
𝑃𝑎
. 100 = 121.5×(191.38− 178.51)
2412.82×100 = 64.81%
𝐸𝐸𝑅𝑎 =𝑄𝑎 (
𝑏𝑡𝑢𝑚𝑖𝑛)
𝑃𝑎 (𝑏𝑡𝑢𝑚𝑖𝑛
)×3.412 =
11291
2412.82×3.412 = 15.98
𝑏𝑡𝑢
𝑤. ℎ𝑟
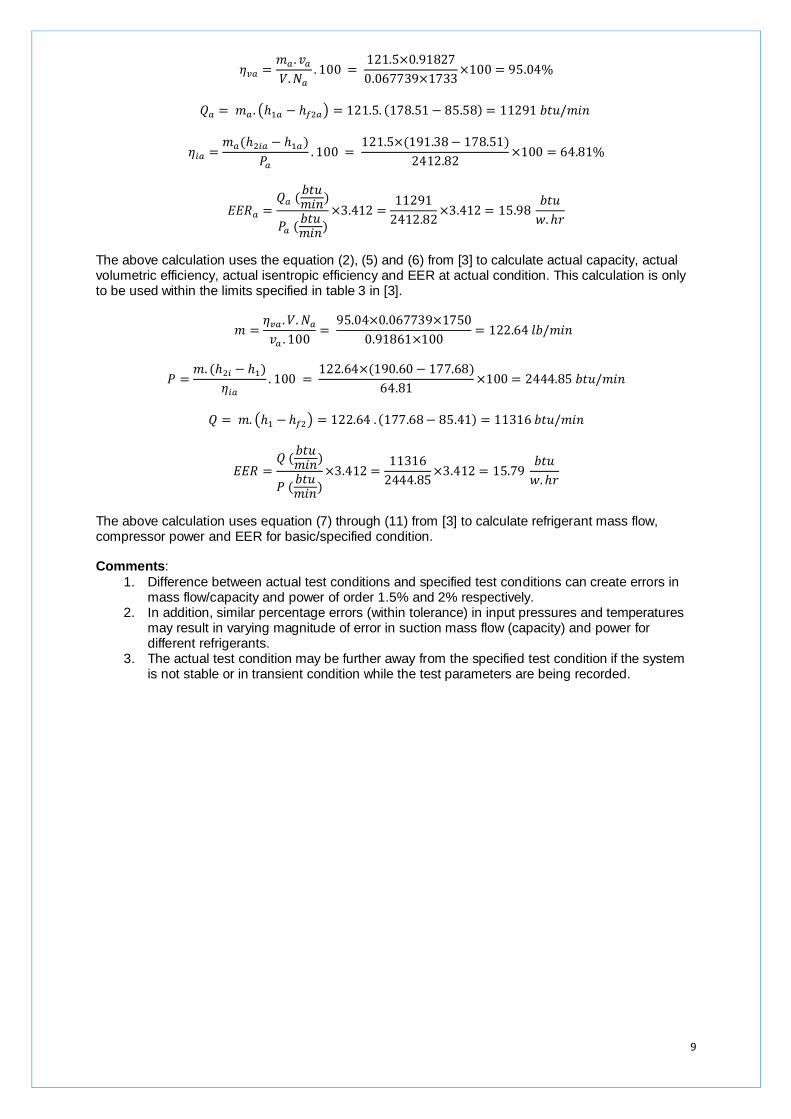
The above calculation uses the equation (2), (5) and (6) from [3] to calculate actual capacity, actual volumetric efficiency, actual isentropic efficiency and EER at actual condition. This calculation is only to be used within the limits specified in table 3 in [3].
𝑚 =𝜂𝑣𝑎 . 𝑉. 𝑁𝑎
𝑣𝑎 . 100=
95.04×0.067739×1750
0.91861×100= 122.64 𝑙𝑏/𝑚𝑖𝑛
𝑃 =𝑚. (ℎ2𝑖 − ℎ1)
𝜂𝑖𝑎
. 100 = 122.64×(190.60 − 177.68)
64.81×100 = 2444.85 𝑏𝑡𝑢/𝑚𝑖𝑛
𝑄 = 𝑚. (ℎ1 − ℎ𝑓2) = 122.64 . (177.68− 85.41) = 11316 𝑏𝑡𝑢/𝑚𝑖𝑛
𝐸𝐸𝑅 =𝑄 (
𝑏𝑡𝑢𝑚𝑖𝑛)
𝑃 (𝑏𝑡𝑢𝑚𝑖𝑛)
×3.412 =11316
2444.85×3.412 = 15.79
𝑏𝑡𝑢
𝑤. ℎ𝑟
The above calculation uses equation (7) through (11) from [3] to calculate refrigerant mass flow, compressor power and EER for basic/specified condition. Comments:
1. Difference between actual test conditions and specified test conditions can create errors in mass flow/capacity and power of order 1.5% and 2% respectively.
2. In addition, similar percentage errors (within tolerance) in input pressures and temperatures may result in varying magnitude of error in suction mass flow (capacity) and power for different refrigerants.
3. The actual test condition may be further away from the specified test condition if the system is not stable or in transient condition while the test parameters are being recorded.

10
REFERENCES
1. Aute, V. and Martin, C., A comprehensive evaluation of regression uncertainty and the effect of sample size on the AHRI-540 method of compressor performance representation. 23rd International Compressor Engineering Conference at Purdue, July 11-14, 2016.
2. Aute, V., Martin, C. and Radermacher, R., AHRI Research Project 8013: A study of methods to represent compressor performance data over an operating envelope based on a finite set of test data. AHRI 2015.
3. EN 13771-1. (2014). Compressors and condensing units for refrigeration - Performance Testing and test methods.