together: topology generation through heuristics
TRANSCRIPT

School of Electronic Engineering and Computer Science
MSc FT Wireless Networks (Networks Pathway) Final Report
TOGETHER: TOpology GEneration THrough HEuRistics
Subin Abraham Mathew
Date: 28th August 2012
1

Disclaimer
This report, with any accompanying documentation and/or implementation, is
submitted as part requirement for the degree of MSc FT Wireless Networks
(Networks Pathway) at the University of London.
It is the product of my own labour except where indicated in the text.
The report may be freely copied and distributed provided the source is
acknowledged.
Acknowledgement
I take this opportunity to sincerely show my gratitude to a number of indi-viduals who have surrounded and encouraged me during this period:
Firstly my supervisor Prof. Steve Uhlig, who has keenly looked upon meand my work providing ample motivation right from the start and constantfeedbacks and helped me understand the nature of this project and its appli-cations in details. His comments and ideas have been highly valuable to theslightest detail. I am very grateful for the openness he showed me and by themanner which he trusted me to complete the project and bring out new idea.I am so glad that encouraged me to setting my targets high and bring outthe best in me. Dr.Vindya Wijeratne who stood alongside, motivating andgetting the timely help that I needed to complete this project. She has beenthere from the start to guide me to using the right tools and giving me theright contacts to get through all roadblocks that this project encountered.
Mr Tim Kay with whom it was a pleasure discussing the topic andprogress of the project at each phase. He was able to help me time andagain to deal with the issues and bugs that occurred to JUNOS.
My Dad, Mum and Linta without whose encouragement i would nothave made it this far.They have been constantly upholding me in prayerand strengthening me with hope. I thank my sister for helping me sort outthe report in time and in a presentable manner. I owe this work and my MScto them entirely.
To Mervin and Roshen who like brothers, helped me in compiling thereport.
My colleagues Chi Qing and Syed Haider who also worked the sameproject and had helped in the evaluation of TOGETHER.
And above all to My Lord and saviour Jesus, my God who has been therethroughout, through every tear and smile, giving me wisdom and patienceto complete this project with confidence. He has been my constant light andstrength and i give Him all the glory and honour for all my achievements andsuccess.

Nomenclature
TOGETHER TOpologies GEneration THrough HEuRisticsANK AutoNetkitAS(s) Autonomous System(s)BA Barabasi-Albert ModelBGP Border Gateway ProtocolCAIDA The Cooperative Association for Internet Data AnalysisCPU Central Processing Unit (Computer)GML Graph Modelling LanguageGraphML XML based Graph Modelling LanguageIGen IGen Topology GeneratorIGP Interior Gateway ProtocolIS-IS Intermediate System To Intermediate System Routing ProtocolISP Internet Service ProviderIXP Internet exchange pointJUNOS Juniper’s Network Operating SystemNec Network cartographerOlive An identical model of JUNOSOSPF Open Shortest Path FirstPoP Points of PresenceyEd yEd, a software from yWorks
Abstract
Network Virtualization is a growing technological process that combines thehardware and software elements in the physical networks and brings it to-gether on a software level. The aim of this project is to develop the process ofdeploying virtual networks easily. The project involves a software developedby us called “TOGETHER: TOpology GEneration THrough HEuRistics"written in Perl in its simplest form without dependencies so that it could bedeployed on any environment. TOGETHER is an isomorphic graph mod-elling solution used to allow users to make use of topology generators andsoftware like AutoNetkit to make topologies that work on virtual systems.TOGETHER is designed to work in Juniper Networks Virtual Private Cloudarchitecture and has possibilities for supporting much more. TOGETHERalso manages how multiple topologies are interconnected and aims to helpresearchers work with network virtualization.

Contents
1 Introduction 11.1 Context for studying the internet . . . . . . . . . . . . . . . . 11.2 Motivation . . . . . . . . . . . . . . . . . . . . . . . . . . . . . 3
2 State of the Art 42.1 Obtaining Topology Models . . . . . . . . . . . . . . . . . . . 4
2.1.1 Using Known Maps . . . . . . . . . . . . . . . . . . . . 42.1.2 Using Traceroute . . . . . . . . . . . . . . . . . . . . . 52.1.3 Using Topology Generators . . . . . . . . . . . . . . . 6
2.2 IGen . . . . . . . . . . . . . . . . . . . . . . . . . . . . . . . . 82.3 Platforms . . . . . . . . . . . . . . . . . . . . . . . . . . . . . 11
2.3.1 Simulation . . . . . . . . . . . . . . . . . . . . . . . . . 112.3.2 Emulations . . . . . . . . . . . . . . . . . . . . . . . . 122.3.3 Virtualization . . . . . . . . . . . . . . . . . . . . . . . 12
2.4 AutoNetkit . . . . . . . . . . . . . . . . . . . . . . . . . . . . 122.5 So where does this lead us? . . . . . . . . . . . . . . . . . . . 132.6 Junos, Junosphere and Juniper . . . . . . . . . . . . . . . . . 14
3 TOGETHER 153.1 Introduction . . . . . . . . . . . . . . . . . . . . . . . . . . . . 153.2 Need of TOGETHER . . . . . . . . . . . . . . . . . . . . . . . 153.3 Understanding Isomorphic Graphs . . . . . . . . . . . . . . . . 16
3.3.1 Isomorphic Graphs . . . . . . . . . . . . . . . . . . . . 163.3.2 Generating Isomorphic models . . . . . . . . . . . . . . 17
4 Program Design 194.1 Connecting Different AS Together . . . . . . . . . . . . . . . . 21
4.1.1 Implementing Inter-domain Connectivity in TOGETHER 23
5 Evaluation of TOGETHER 245.1 Working with Isomorphic Graph Generation . . . . . . . . . . 24
1
5.1.1 Using IGen . . . . . . . . . . . . . . . . . . . . . . . . 255.1.2 Discussion . . . . . . . . . . . . . . . . . . . . . . . . . 26
5.2 Working with Multiple Topologies . . . . . . . . . . . . . . . . 275.2.1 Discussion . . . . . . . . . . . . . . . . . . . . . . . . . 27
6 Discussion and Future Work 30
7 Conclusion 32
Chapter 1
Introduction
The Internet today has brought the world closer and plays a prime contribut-ing factor to human development, knowledge transfer and globalisation. To-day, there are more products that work on the internet cloud than elsewhere.This vast internet in real is typically a huge collection of networking hard-ware elements and databases located across the globe. As the demand ofinternet increases the network providers are faced with challenges to main-tain the network service with high expectations. To alleviate the challenge,a thorough understanding of the network is required by network providers.Also, as the networks multiplies, the demand for future applications furtherincreases.This has drawn the attention from the telecommunication industryand researchers to further study the internet.
1.1 Context for studying the internetHaddadi [10]states that the need for research in the structural properties ofinternet is essential to prevent failures, correct faulty connections, improvethe routing between nodes, analyse the growth of the networks and therebyassisting in future network planning. However, its actual practise is moredifficult .Researchers classify the entire network to be made of either one ofthe two kinds of networked links, namely, transit domain and stub domain.The stubs are groups of network routers or devices that belong to a certainorganisation while the transit resembles more or less the backbone that con-nects the stubs one to another. Now, designing such a model without a clearpicture is exhausting.
One must have means and methods that tell what the internet is and howit can be studied effectively. The issue does not end in understanding theoverall picture of the internet, but furthered by the individual areas or points
1
of interests of the network. This confirms that its understanding can belimited as and when represented by a mathematical formula. This emphasisthe means to individually inspect the network elements and further modifythem in a closed environment .This translates into developing a duplicatemodel of the internet handy which is not feasible due to the costs involved.And ultimately the alternative is to have means to design a network thatrepresents the real internet. This will enable it to be workable with theability to amend in a safe manner without any effect to the real network.The predicted results would otherwise represent the actual results from thereal network.
The internet has been studied on various aspects but it is still unclear howdoes the internet functions as overall. In many studies that concentrated onthe core, the edges of the internet were not considered. Also in many studiesthat took intra Autonomous System (AS) routing into consideration did notconcentrate on the impact of core networks. But this may not be the casefor the real internet.
In a study conducted by Mühlbauer, Wolfgang et al [17], to study thestructure of internet, they discussed that the routing in the internet is a resultof policies that are decided locally by different Autonomous Systems (ASs)and the effect of router level topologies inside the Internet and structure orsize of ASs. This was done by running multiple simulations using C-BGPsimulators. In their study, they had to restrict the complexities of the networkbecause of the time constraints and the size of individual configuration files.This shows one of the main constraints of network simulators. Another keyelement the study described that was a road block to obtaining more accurateresults was the generation of complex network topologies. To be able to dothis, they had to reduce the number of ASs and had to keep rebuilding thetopologies over and over again.
From Mühlbauer, Wolfgang et al [17] it is understood that the internetis more dependent on the stubs than the transit nodes. Also, in a relatedpaper by Mühlbauer, Wolfgang et al [18], they discussed the presence ofquasi-routers which need not make routes based on how a certain transitnode sees the network, but also depend on the path taken by adjoining ASnodes. This shows that the core properties are not as simple as they werethought to be. This is an important aspect in networks. These propertieswould affect the time the packet takes to travel between ASs and also, impactbusiness policies that require a specific routing of packets.
Another factor that was assumed in the study of internet was the pres-ence of Internet Exchange Points (IXP). IXPs are sometimes assumed to bedormant in data transit, but from a study by Ager, Bernhard et al [1] in2011, showed the active presence of IXPs. This research, showed that IXPs
2

play an important role in changing the path taken by data packets. Thisalso is an important element that was overlooked for years the internet hasbeen studies. In order to study this, we cannot rely on simulations as thenature of IXPs are dependent on the nature of the ISPs and also on the veryequipments that IXPs are build on.
1.2 MotivationFrom recent studies, it is clear that to study the internet we have to considerthe overall picture of the internet. It is essential to consider the core nodes,the transit nodes, the gateway , area and the stub nodes which is a reallycomplex architecture to be simulated.
But as with any technology, there is a need means to connect the modelof the internet to the platform we wish to work on. So there is a need of aplatform converter. The need of this converter is so that any topology mapscould be run on any system.
Herein lies the potential of the software TOGETHER which can be tapped.The software TOGETHER manages to ensure that topologies that are gen-erated would work on virtual networks. TOGETHER relies on AutoNetkitto make desirable files that could be portable to virtual systems. Thus,TOGETHER enables to provide means for multiple topologies from varioussources to be deployed on virtual systems easily.
3

Chapter 2
State of the Art
2.1 Obtaining Topology ModelsIn order to study the internet, it is understandable that a model of the inter-net is required. There have been various researches done in this field to mapthe entire internet. This would have been easy in 1980’s when the internetwas less than 100,000 nodes. The internet has grown over the period of timeand now after just 3 decades the internet is prodigious and the overall archi-tecture is uncertain. However, because internet is more or less transparent atcore than at stubs, researchers have been able to predict and develop approx-imate graphs that describe the internet. There are different means to obtainthe model of the internet, but this paper concentrates on three methods thatcould be viable to obtaining the models accurately. One of the most obviousquestions a layman would ask when discussing the architecture of internet is“ Why not ask the makers?”. The internet is a product that almost everyonewho have lived or living in the 21st century have contributed. Some haveplayed very significant roles while others have answered surveys. So, there isno one who has the sole ownership.
2.1.1 Using Known MapsThe best alternative is to ask the ISPs and network management companiesto share their information about the network under their control. From thosewho contributed to providing this knowledge, collections of topologies havebeen added on to various public and research schools.
One such collection is the Internet Topology Zoo, [12]. This is main-tained by the University of Adelaide. The Intenet Topology Zoo has manytopology maps that are downloadable as GRAPHML or GML files . TheInternet Topology Zoo also maintains links to various other sources that do
4
similar work like The Internet Topology Collection [27] which is maintainedby the University of California, Los Angeles and CAIDA. Although thereare other websites, that offer similar results, the paper concentrates more onthe models that have been generated by the Internet Topology Zoo, becauseof AutoNetkit, a product described in the section 2.4 developed by SimonKnight, who is one of the “ zoo keepers". The software TOGETHER is notlimited to the topology zoo, but has been exhaustively tested with variousgraph representation from the zoo.
2.1.2 Using TracerouteThe next method is a hack or a work around model. The method to geta network information if not available is to test it exhaustively. This couldbe easily done by using the networking tool available on most consumercomputers called traceroute.
One could run traceroute for number of days from various sources toa single IP locations and generate traceroute dumps. Most of the time,traceroute dumps that have been done from an ISP end are not very reliableas the visibility of the entire network is often limited. However, there havebeen some researches that have stood out and have produced good results.
To understand this, a knowledge of traceroute is required. Traceroute isa network diagnostic tool that sends multiple Internet Control Message Pro-tocol (ICMP) packets to a destination with increasing Time To Live (TTL).The first time, the TTL is set as one and it reaches the first hop to thedestination. The TTL is reduced and an ICMP time exceeded message in aIP packet is sent to the source. Then the source increments the TTL by oneand sends it to the destination. The packet reaches the first hop in the routeto the destination and the TTL is reduced by one. Then it goes to the nexthop, the TTL is reduced by one again. In this manner, the ICMP packetproceeds in the route selected by the routers till the TTL is zero. Once it iszero, it an ICMP time exceeded packet is sent to the source. In this manner,over multiple increments of TTL, the path is discovered.
One of the most earliest tool as described by Haddadi [10] is the Mercatorintroduced by Govindan et al [8]. A few models that are considered notewor-thy was the network cartographer [14] (nec) and rocketfuel [22] models. Boththese models have adequate results. Nec and rocket fuel uses traceroute bservers to run the traceroutes.
Rocketfuel outputs could now be converted to GML or the Graph Mod-elling language model with the use of tools provided by Topology Zoo toolsets[12]. Rocketfuel also has a graphical plot of the traceroutes that map to ge-ographic location. They use “Geoplot”,a Java web applet developed by the
5

Cooperative Association for Internet Data Analysis or the CAIDA to do this.
2.1.3 Using Topology GeneratorsThere have been number of software solutions for modelling network topolo-gies. Some key software solutions that have shown significant results in re-search in generating topologies are GT-ITM [24] from Georgia Tech, Inet [11]topology Generator from University of Michigan, BRITE [16] from BostonUniversity and IGen [11] from University of Louvain-la-Neuve and Universitéde Mons.In order to better understand the generality of TOGETHER andthat of IGen, an understanding of network topology modelling is important.
Most researchers [25] consider the first software solution widely used tomaking network topology automatically was build by Waxman, [26]. TheWaxman model uses Erdos-Renyi model to generate graphs, but as Medina,Alberto et al [16] describes in their paper, the Waxman model selects theinterconnections based on the location of nodes on a reference plane that iscreated by the Waxman by using probability theorems. This is not consideredas an efficient modelling.
Another topology generator that was of interest was the GT-ITM model.This model is also called Transit-Stub model of network. In this at first somerandom graph is generated and nodes are made. Every node is consideredas a separate transit domain, and so they are replaced with a predefinedtopology of the domain. This is effective in order to see the whole networkpicture, but when elements of interest like managing between AS is concernedthe visibility of network is limited.
Tiers [5] by Doar,Matthew was another model that was similar to theWaxman model. In the Tiers topology generators, the nodes were placed ona plane and initially WAN networks were created and connected by usingminimum spanning tree theory and the edges were connected based on theEuclidean distances. Then MAN networks were created and then LAN net-works were created. This model does not capture the core features of theinternet.
Inet 1.0 had been build to generate topologies randomly for researchpurposes that satisfied real network scenarios. It relied on power law toselect nodes and determine edges. The newer model Inet 2.0 based is moreselective in choosing nodes.In the paper introducing Inet 2.0 , it is arguedthat the Waxman, Tiers and GT-ITM did not follow the power law statingthat the models generated by those models were obsolete when compared toreal networks [11] as the networks keep increasing.
BRITE is a network topology generating tool from Boston Universitythat generates topologies based on Waxman’s model in some cases and Barabasi-
6

Albert’s model in other cases trying to implement power law model thus re-lating it to growing internet topologies [16]. The Barabasi-Albert’s modelconnects new nodes to older nodes that heavily linked than nearby nodesthat are loosely linked.
Although the above two models (Inet and BRITE) propose means togenerate random topologies, they rely on probabilistic algorithms to linknodes. Tangmunarunkit, Hongsuda [23] et al argues that topologies likeBRITE that follow power law, though may be good in capturing large scalenetworks with over 1000 nodes better than structural generators like Tiers,they tend to be meaningless in case of small topologies consisting around 50nodes. They stated that it was better in cases where study of small networkswere required that structural generators were to be used.
In Highly Optimised Tolerance (HOT) [3] the generation of topologiesare said to rely on various factors such as efficiency, robustness, performanceand incorporates specialized and structured configuration. A related studyby Alderson, David et al [2] say that over the use of Highly Optimised Tol-erance models (HOT), Heuristically Optimized Trade Off (HOTo) modelsproposed by Fabrikant, Alex, et al [6] is more efficient in producing an ac-curate network representation. They state that the Heuristically OptimizedTrade Off (HOTo) model could generate various topologies from star to fromtree by modifying the relative importance between connectivity distance andnode centrality . Also, on fine tuning these parameters, they claim that thedegree of node distribution could be changed to represent more classic meansof representations like exponential and power law.
Haddadi, Hamed et al [10] state that topology generators need to capturethe dynamic nature of today’s internet such as “ peering relationships, inter-nal AS topology and routing policies ”. They state that the internet shouldnot be seen as wholly dependant on power law modelling of the network withtransit-stub models.
From the paper it is clear that on deciding a software solution to representInternet topology, some elements should be kept in mind. The first thing isthat the internet today, although had exponential growth, the architecture isnot random but a result of careful design, with some limitations like geogra-phy, technical and business constraints. The second advice is that the focusshould be given both on core nodes as well as the Points of Presence (PoP).This indicates a need to have an end-to-end topology generator, that unlikeTiers, Waxman or GT-ITM does not rely on placing nodes in random butdoes that with reason and joins the edges to the nodes with an understand-ing. Also, that this topology generator unlike BRITE or Inet, do not rely onpower law to generate topologies as these laws do not account for the naturethe networks were made and connected.
7

Other studies from Tangmunarunkit state that there is a need for struc-tural generators, but as said by Fabrikant, Alderson, Haddadi et al, thetopology generator must have some heuristic understanding of the real net-work, the location of routers, an idea of their location, interconnectivity andpoint of presence.
Quoitin, Bruno’s [21] topology generator is called IGen. Haddadi, Hamedet al [10] state that “IGen aims to realistic ISP topologies, and allows thosetopologies to be interconnected like real AS might be”, however the choiceof connecting different ASs together is not solved.
For these reasons, this paper have chosen IGen as an apt candidate forgenerating topologies that could be used to work with virtual systems andwould be beneficial to work with it in helping researchers understand thenetworks better.
2.2 IGenSo, what is IGen? In a nutshell, IGen [20] allows the user to select a location,generate N number of nodes in the area and in a heuristic manner, connectthese nodes. This is done in the following manner. Quoitin states that indesigning a network to study characteristics of the internet, the four mostfundamental elements are network design, geographical location, networkprovisioning and selection of paths. IGen is a structural topology like that ofWaxman and GT-ITM or Tiers. However, IGen is different as it is a router-level topology and takes into consideration the four parameters that Quoitinstates that are viable to real internet topology.
Let us examine those four parameters and understand the generality ofIGen. The first parameter is location. IGen could import nodes that havebeen mapped to real locations on the earth like geographic coordinate sys-tems. Another means is to generate random nodes in selective polygons thatrepresent the world in a mercator projection like manner. Another proposedmodel is using IP geolocation databases to get the approximate locations.Due to the scope of this project, I would consider the second case only. IGenselects nodes and places them on the world map. The figure below a screen-shot of the polygonal world map.
Then, IGen, selects nodes to represent PoPs and from them IGen selectsthe nodes that are to be part of the backbone network. It builds the PoPsand then the backbone network. All these could be said to be part of networkprovisioning and network design. Also IGen has methods to introduce linkcapacities from 34Mbps to over 10Gbps. Once this is done, it also allowsprovision for iBGP links. Usually, PoPs are selected in order to avoid link
8

Figure 2.1: IGen Polygons
failures and provide redundancy. The backbone network is the could beselected to be designed by the user on the basis of some heuristic models.The available models are shown in the table below 2.2 with models graphicallyrepresented in the figure 2.3 below.
Figure 2.2: Table showing various models IGen uses
A very interesting example is shown in the figure 2.4. A 10 routermodel in Africa and a 20 router model in the Eurasian region we created byIGen. Then both of these separate domains were connected internally usingminimum spanning tree model and then they were connected to each other.From the figure 2.4, it is seen that 10G backbone network has been made toconnect Eurasia internally, and the African continent internally. Then theEurasian network was connected to the African network by IGen and foundthat IGen chooses the most obvious connection that is commonly used intoday’s network, the Mediterranean region.
9

Figure 2.3: IGen Models [20] Page 5
Figure 2.4: Working of IGen
10

IGen is a Perl based program and uses the Tk module for GUI. It wasfunded by the Waloon Government and is a part of TOTEM project. TheTOTEM project was initiated to build TOols for Traffic Engineering Meth-ods. IGen saves its output in various formats, but in this project the chosenformat is GML or the Graph Modelling language model.
To summarise this chapter, it is understood that although the internet aswhole, grows exponentially, it is a result of careful planning. To study the in-ternet, we need models that follow this understanding. These are compellingreasons to select IGen, as a suitable candidate for this project in order togenerate topologies.
2.3 Platforms
2.3.1 SimulationOnce the topologies have been mapped, to study the topologies we have touse some kind of system. Today there is a large source of software that isuseful in understanding network modelling and network function. These arecalled network simulators. In a network simulator, the entire network couldbe modelled in the software. These models can be tested on various elementslike routing, performance and traffic analysis. Some of the well-known simu-lators are Network Simulator (NS), OPNET, NetSim. Software like OPNETallow users to study the devices like routers, protocols and understand theirapplications. Another well-known network simulator is NS or Network Simu-lator. NS has a large number of modules that are commercially developed forwired and wireless network and has shown considerable interest in researches.
However, there are many reasons why this is not apt for real networks.The simulation environment is often a closed environment and therefore thereis no possibility of introducing changes that the provider has not thought of.This is not ideal in cases where users want to study more than routes or pathbut work with injecting data and working with interfaces and hardware. Thisis what researchers are interested in, ie to work with data planes. From thestudy with C-BGP conducted by Mühlbauer, Wolfgang et al [17], it is clearthat to make a model of the internet, with at least 30000 nodes, there arelimitations. Therefore using simulations are not advantageous when detailedunderstanding is required.
11

2.3.2 EmulationsNetwork emulators are more better than network simulators. They containan image of the real Operating system that runs on the routers, switches andbridges and produce better results. Some common ones are Netkit, GNS3with Dynamips. GNS3 could run Cisco IOS, Juniper JUNOS and producebetter results. They allow the better use of hardware and software. Mostemulators however, do not have direct access to the hardware resources of thehost system. They mimic the hardware and run the using software simulatehardware. Also, emulations depend heavily on the emulation platform tocompute data and so may slow down the process and may give erroneousdata.
2.3.3 VirtualizationIn virtualization the system is dedicated to run virtual machines that haveaccess to the core processors and perform tasks that a real machine would do.In a virtualization environment, every virtual machine is given access to thesystem resources and monitored by the hypervisor. In this manner, not onlythe hypervisor allows the VMs to run the operating systems that run on thereal routers, but also provide ways to have them work with all the resourceslike network connections,CPU handling, data handling independently. Sinceeach VM is given independent control to the CPU, it could be said thatit less likely that if a VM crashed, it would affect the entire machine. Insome virtualization environments that run network connections, the routingis done by using VLAN tagging between each VM that is connected so that itreplicates how the actual LAN works. There may be VRF labels on interfacesso that the VLAN are properly mapped. One drawback is that since all thevirtual systems are really close, delay between networks cannot be calculated.
From these reasons, it can concluded that in order to understand the net-work characteristics properly, the best alternative is to build a mock modelof the network. However, owing to the limitations in time, effort, and moneyinvolved, the best alternative is to run Virtual Machine on a dedicated sys-tem.
2.4 AutoNetkitIt is seen from the previous sections 2.1 that various network topologiescould be generated. In the section 2.3 it is seen that in order to study theinternet, there is a need to process the network models in some network imita-tion software like simulators, emulators or virtualization platforms. Network
12

imitation software needs the files that specify the overall model rather thanthe topology maps. To make such files is time consuming and the user musttake extreme care to know the nitty-gritty of the software that they wish todeploy their network model to study on.
AutoNetkit by the University of Adelaide and the University of Loughbor-ough is a novel concept that manages this transition. In the paper by Knight,Simon et al [19] describing how AutoNetkit works, they tell about the plansto have the AutoNetkit tool (ANK) to support many network emulators andsimulators.
ANK was initially built to support Netkit in order to produce the resul-tant files that could be used on Netkit to setup a network. This was laterimproved to work with Juniper platform and they plan to develop for Cisco’sIOS platforms.
The current version of AutoNetkit supports [13] C-BGP, Dynagen/GNS3,Junosphere and Netkit and does make the relevant models and also plotsthem in HTML format using the python package "networkx". Since ANKdoes this job with ease, we have used this to generate the required configura-tion files for the Junosphere emulator. AutoNetkit is written in the pythonlanguage and is available on the python package index.
2.5 So where does this lead us?From the previous sections, it is understood that there are various sourcesthat allow us to get a map of the internet and also have seen a number ofsoftware solutions that hack the system or generate topologies based on re-searches. Once this topology is selected, it could be processed on a simulatedsystem by either drawing this topology if it is a GUI based software or withthe help of configuration files in case of emulators and virtual machines. Anexample of this is WinNet [4]. It uses GT-ITM and connects the models toNS with an independently developed module called Wave. However, due toseveral limitations in GT-ITM models and NS this model does not satisfythe need we addressed. So, TOGETHER tries to combine some of the bet-ter resources, in producing results that would benefit both researchers andenterprises in generating topologies and thereby enable better results.
So, in this project IGen is chosen as the topology generator, and the soft-ware TOGETHER is used to bridge the models from IGen to AutoNetkitwith some parameters introduced. These parameters have utilised the intel-ligence of AutoNetkit in generating topologies that work with Junosphere.The system that was used to test TOGETHER is described below. Theworking of TOGETHER is described in later chapters.
13

2.6 Junos, Junosphere and JuniperAt QMUL we have worked on a Junosphere machine that could host variousJuniper VMs. The system allows users to host up to 75 routers with ease, butthis figure could be tweaked. This is similar in the manner of design to theJuniper online product called the Juniper Classroom, which is hosted in thecloud that enables users to setup, study, modify, and run various topologies.A main feature is that the virtual machines could run multiple operatingsystems and so, we were able to run VMs that work accurately. Since thiswas an experimental model from Juniper, it was slightly different from thecommercial cloud versions. We were able to test and work with the systemafter understanding some glitches and manually overriding them.
All VMs ran the JUNOS Operating system which is a network operatingsystem. This way every VM represented a router. The images of theserouters were similar to the Olive based models. All the LAN connectionswere connected with VLAN tags.
14

Chapter 3
TOGETHER
3.1 IntroductionIt is understood that in order to have an understanding of the internet there isa need to have adequate research methods. We have discussed various meansresearchers have tried to generate models of the internet and how differentmethods of obtaining these models are relevant. We have discussed that thekey element in understanding the internet is the availability of graphs.
3.2 Need of TOGETHERThe elements that have seen discussed so far are the IGen to generate graph,Virtual Systems, and AutoNetkit to make configuration files. The need ofthis project is to bridge software solutions so that they work with each other,providing researchers a tool that could be used without them having to workwith the intricacies of managing various files or worrying about the needto convert files or amend files to have more functionality. This matter is ofconcern as some times the user would like to use topologies that are generatedby IGen, other times the user may want to study the network performanceand so may have got the models from topology zoo. Both these models arevery different and usually in order to have them work with ANK, either theuser has to manually convert line by line the files between formats or atother times modify the files to a large extend by either adding details thatare irrelevant in real networks like size or shape of the node so that programslike yEd accept the models. This is the key feature of TOGETHER. It isused to generate isomorphic models of the network. This method is describedin the following chapter.
15

Figure 3.1: Graph A and Graph B
3.3 Understanding Isomorphic Graphs
3.3.1 Isomorphic GraphsIn graph theory, two graphs are said to be isomorphic if they have nodesthat preserve their edges. This is called “edge-preserving bijection” wherethe edges between nodes are kept unchanged. This is shown in the figurebelow.
In the figure 3.1 below, (drawn in yEd), we represent two graphs. GraphA is the one on the left with alphabetical notations for nodes. Graph B isthe one the right with numerical notations. Now, both graphs look different,but on looking closely, we find that they have the same number of links andsimilar nodes are connected to each other.
Let’s observe node-1 and node-a. Node-1 is connected to node-2, node-4and node-6. Node-a is connected to nodes "b","d" and "f". So, If we wereto plot a relationship between both models, we could state that node-a issimilar to node-1. This is shown in the table 3.2 below. Now since the twomodels are said to be Isomorphic they could be represented as A ' B.
This is done by not considering some features that were in Graph Aand Graph B. When TOGETHER is executing the generation of isomorphic
16

Figure 3.2: Isomorphic Mapping
graphs, some features are not considered. This is explained in the followingsection.
3.3.2 Generating Isomorphic modelsIn the previous section we defined what isomorphic graphs are. TOGETHERtries to generate similar models. We have decided to make isomorphic modelsof the GML files they contain network topologies because the graphs couldhave been generated from various sources and may contain a lot of relevantand irrelevant data. A certain form of intelligence is required to separate thefiles into relevant and irrelevant contents.
We have taken the nodes and edges as relevant information and discardthe rest as irrelevant. This considerably reduces the size of the topology filewhile keeping the basis for Isomorphic models strictly followed.
In the generation of plots say using IGen we have used spatial notations.This was useful in placing the nodes apart do that they could be madeinto PoPs and then connected to the backbone network. But now this isgenerated, do we really need spatial locations? This decision depends onfactors such as what we are going to do with the GML file. In our case, weare trying to study the network properties by running virtual routers. So, inrunning virtual routers, the element of location would not play a major roleas virtual systems cannot at present take into consideration latency due togeographic location. Also IGen adds value like the delay and edge propertieslike bandwidth which cannot be used in VMs at present because they do notsupport.
Most models have nodes shaped as circles, squares or ellipses. This is notconsidered to be relevant as this does not impact ANK in developing goodgraphs. So, for the sake of simplicity, we have avoided these parameters.
Now, the question that would arise is if such selectiveness is done, wouldthe outputs represent faithful topology representation models that were givenat the input? We conducted a number of tests and we have taken some ofthe results and explained them in the section 5.1.
17

In Summary, we have tried to generate Isomorphic models of the real net-work topologies that are obtained. We have considered the basic elementssuch as the nodes and their respective edges as important information. De-tails introduced by various software that make GML files, like shape of nodes,etc have been overlooked as they do not impact the manner in which ANKwould generate the output. More importantly a virtual machine server thatcould run router VMs do not care about such data.
18
Chapter 4
Program Design
In this chapter we would like to explain the challenges faced in the creationof TOGETHER and the flow diagram of TOGETHER. In this section, wewould like to introduce the overall picture and explain why some choices weremade and also dive into the user support documentation of TOGETHER.In the end we also discuss some means has been used to connect multiplenetworks and the reasons behind it.
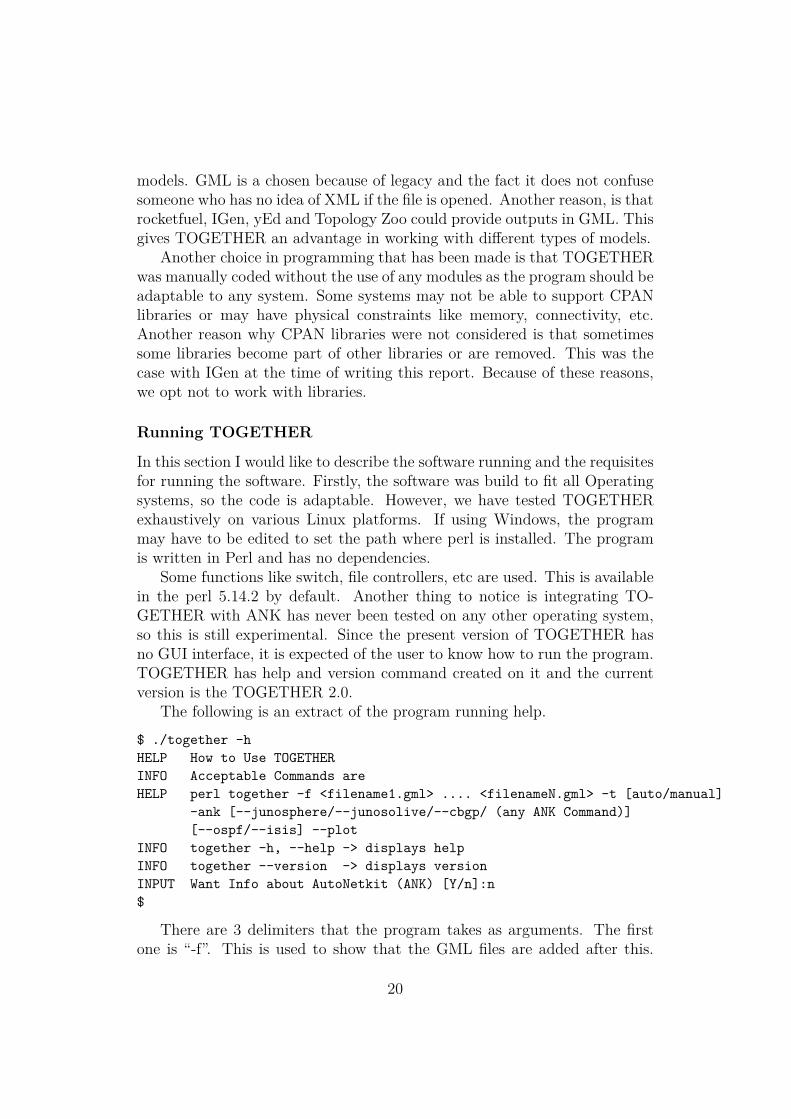
TOGETHER has also provision to run AutoNetkit automatically, basedon some commands, and currently supports the JUNOS system. TOGETHERallows users to have selective outputs to help with researchers at QMUL pro-cess the topologies, which could be expanded. Finally TOGETHER allowsuser to view the plot if they had decided to plot with ANK.
The following diagram shows the above-mentioned process. The processis explained more in the following sections.
Figure 4.1: Overview Of TOGETHER
Formats and Choices
A simple understanding of GML and GRAPHML is intended in this sec-tion. GML files are better structured graph modelling file. They are easilyreadable by any novice user. However GRAPHML is an XML based model.ANK uses a module from python called "networkx" to read and interpret the
19
models. GML is a chosen because of legacy and the fact it does not confusesomeone who has no idea of XML if the file is opened. Another reason, is thatrocketfuel, IGen, yEd and Topology Zoo could provide outputs in GML. Thisgives TOGETHER an advantage in working with different types of models.
Another choice in programming that has been made is that TOGETHERwas manually coded without the use of any modules as the program should beadaptable to any system. Some systems may not be able to support CPANlibraries or may have physical constraints like memory, connectivity, etc.Another reason why CPAN libraries were not considered is that sometimessome libraries become part of other libraries or are removed. This was thecase with IGen at the time of writing this report. Because of these reasons,we opt not to work with libraries.
Running TOGETHER
In this section I would like to describe the software running and the requisitesfor running the software. Firstly, the software was build to fit all Operatingsystems, so the code is adaptable. However, we have tested TOGETHERexhaustively on various Linux platforms. If using Windows, the programmay have to be edited to set the path where perl is installed. The programis written in Perl and has no dependencies.
Some functions like switch, file controllers, etc are used. This is availablein the perl 5.14.2 by default. Another thing to notice is integrating TO-GETHER with ANK has never been tested on any other operating system,so this is still experimental. Since the present version of TOGETHER hasno GUI interface, it is expected of the user to know how to run the program.TOGETHER has help and version command created on it and the currentversion is the TOGETHER 2.0.
The following is an extract of the program running help.
$ ./together -hHELP How to Use TOGETHERINFO Acceptable Commands areHELP perl together -f <filename1.gml> .... <filenameN.gml> -t [auto/manual]
-ank [--junosphere/--junosolive/--cbgp/ (any ANK Command)][--ospf/--isis] --plot
INFO together -h, --help -> displays helpINFO together --version -> displays versionINPUT Want Info about AutoNetkit (ANK) [Y/n]:n$
There are 3 delimiters that the program takes as arguments. The firstone is “-f”. This is used to show that the GML files are added after this.
20

The second delimiter is “-t” where the user can select if he wishes to processthe handling of topologies automatically or manually. The last delimiter is“-ank”. This is to take in the commands for ANK. This is similar to the com-mands that ANK can accept. Now the first two delimiters are compulsory,the “-ank” part can be omitted. In that case, the user needs to go to thedirectory and run ANK.
Once more than one GML files are run, TOGETHER analyses the inputfiles and starts to make the GRAPHML files that is suited for ANK. Then,if more than one topology file, TOGETHER has two means of connectingthem. One is manual connection and other is automated connection. Themanual connection is selected by entering “-t manual” and the automaticconnection is done by the command “-t auto” . The user in case of manualis presented a list of all nodes in the different files and allowed to select thenodes the user wants to work with.
In case of automated connection, there are four scenarios presented. Wehope to increase the numbers of models based on further researches. Twoof them can form multiple inter domain links between each topology. Theother two are used to provide single peering with a designated router. Inone such single peer a router from any of the topology could be selected asthe designated router, and in the second case, a new router is created as adesignated router.
In the section 4.1 we explain the other two means to connect differenttopologies. .
After the models have been saved and set, ANK is run and the requireddata is obtained. JUNOS olive-based models could be generated by using “--junosolive” in the parameters to ANK if using TOGETHER. In the JUNOSsystem that was available at QMUL, we faced some errors with installing themodels, so TOGETHER has been used to provide work around solutions.Note, this command “--junosolive" is a command that works only for thesoftware TOGETHER. The outputs are saved to a zip file and the programhas options to allow users to view the final topologies.
4.1 Connecting Different AS TogetherIn the section 4, it is seen that TOGETHER provides various means toconnect between different Autonomous Systems(ASs). The main feature thathelps AutoNetKit (ANK) to differentiate between AS in the GRAPHMLfile is the data type key that AutoNetKit identifies as “asn" [19]. This isautomatically set differently for different domains by ANK, thus separatingthem.
21

One of the challenges that have been highlighted in this paper was thefact that the topologies must be able to show a representation of the realnetworks. This is a very difficult task. Although TOGETHER is a softwaremanages the creation of isomorphic models of the internet topologies, theremay rise some situations when the user wants to connect two or more domainsin a manner.
A challenge in modelling this is the fact that since the sources that thesemodels are obtained are not predictable, some elements like location or spatialmay not be formatted to a common standard. IGen, connects the domainsbased on the proximity of the domains from one network to the other. InIGen, the nearest domains are connected. This is seen in the figure 2.4.We had generated 10 nodes in the African continent and 20 nodes in theEurasian area, and as we had described the spatial information was chosen.
Elements like location or names of the nodes or the Euclidean distancebetween nodes cannot be considered as these models may be different. Thereis a need of some elements that work with the selection that was done to makethe isomorphic models. So, our models have two elements, nodes and edges.From the above mentioned reason, it is clear that using methods such asWaxmann, dK-Seriess [15] and Inet models cannot be considered to connectbetween two domains.
This is a huge field of study and we would like to express a few models thatwe considered suitable are used. One model that interests us is the Barabasi-Albert (BA) model [9], where the new nodes are connected to nodes that havea good interconnectivity. This in some sense would be the case of today’snetwork where a new service would be linked to well-established connection.Another model is the PFP or the Positive Feedback Preference [9]. In thisnodes are connected to both the well-connected older nodes as well as tonewer nodes.
Another model is the rich club model. This was introduced by Zhouand Mondragón [28]. In this model, they select the interconnectivity by twofactors. The first factor is the rich club connectivity. In this every node issorted by the number of edges it has. If there is more than one node thathas similar number of edges, then those nodes are given an arbitrary positionamong them. The next factor is node distribution factor. This means, richnodes in one AS is connected to rich nodes in other AS.
22
4.1.1 Implementing Inter-domain Connectivity in TO-GETHER
We have two models that have been used to connect networks automatically.In the first model, every domain is considered as a node. So, if there are5 domains, they are represented as 5 nodes. If there are five nodes, theminimum number of edges required to connect them together is given by theformula n-1. But this would not mean that all nodes are connected witheach other. So, the nodes need to be deterministically selected in a mannerthat all the routers would connect to each other. So, if there are 5 nodes,namely n1,n2,n3,n4 and n5. The output would be in a form like n1-n2-n3-n4-n5. It could also be a closed model as n1-n2-n3-n4-n5-n1. Then a singlenode is selected randomly from each of the 5 topologies and the nodes arereplaced with the real nodes from the maps. This could be mapped as thenas a1-b3-c4-d8-e3 where the topologies are named as a,b,c,d,e.
The other model is an intermediate between the BA and the rich clubmodel. In this all topologies are mapped as individual nodes. If there are nnodes, at the least n-1 connections are required to map them together. Theuser could enter the number of inter domain connections they wish to deploybetween these topologies. If the number is less than n-1, the system in orderto connect the nodes by n-1 to avoid unconnected links.
In the first part, a connection is created between all the domains. This isdone in a manner that the system selects nodes from each topology makingsure this node is not selected again in this process.
So, let us say 5 domains are represented as n1,n2,n3,n4,n5. In the firststep, one of the five nodes is selected in a randomised manner and this selectednode is connected to a node in another domain. If the domains are a,b,c,d,e.After the first round, the output would be of the form a4-b2, b2-e8, e1-d2,d5-c2.
It is known that it’s best to connect to a more interconnected domainand so we set this topology as a main hub and connect other networks tothis topology. Let’s say the topology ”e" was a fully meshed model, and thenthe remaining links would most likely be e2-a5, e7-b3, e4-d3. In this mannerwe try to establish some heuristic design.
In future, this model could be built to replicate rich club, but this isbeyond the scope of this project.
23

Chapter 5
Evaluation of TOGETHER
As they say, the proof of the pudding is in the eating, in this section we wouldlike to highlight some of the key features we claimed that TOGETHER coulddo. One feature of TOGETHER is to generate isomorphic files of networktopology and represent them in an appropriate manner. For representingthe figures, we have used ANK and so have saved the isomorphic files inGRAPHML format.
It was also claimed that TOGETHER has ability to handle multiple filesand add them together to form multi domain network. This is shown in thenext section.
5.1 Working with Isomorphic Graph Gener-ation
In this section, I would like to take two examples. One drawn in yEd andanother one generated from IGen. Both are 5 nodes each. For the sake ofmaking this report simple, the input graphs and the output graphs are onlydiscussed. The first file is called 5nodeyEd.gml, while the second is called5nodeIGen.gml. Since yEd could also generate GRAPHML formats, this isused as a reference for comparison.
Drawing with yEd
In this section 5 nodes (refer 5.1), (coloured yellow) are drawn by hand, andthey are given a mesh topology, meaning that all nodes are connected to eachother and the network are fully meshed. This although may not be ideal innetworking scenarios, is used here as to show the way TOGETHER handlescomplexity. Since this is the same output if we saved it as a GRAPHML, it
24

is understood that the figure is the same. We use the GRAPHML file to bedirectly used by ANK, to generate an expected output.
Converting with TOGETHER and Processing with ANK
The GRAPHML file is processed by ANK separately and the output is dis-played in the figure 5.1.However, ANK cannot read the GML files. In thiscase TOGETHER is used to convert 5nodeyEd.gml the GML files to theGRAPHML format
Figure 5.1: 5 node model developed by yEd - 5nodeyEd.GML
5.1.1 Using IGenThe 5nodeIGen.gml file is generated from IGen. This is selected in geographiclocations in random. The IGen image is shown in figure 5.2.This is exportedto a GML format. This is converted by TOGETHER to GRAPHML and
Figure 5.2: 5 node model generated by IGen 5nodeIGen.GML
25

Figure 5.3: 5 node model drawn by yEd processed by TOGETHER and ANK
Figure 5.4: 5 node model drawn by the yEd 5 node model drawn from IGenprocessed by TOGETHER
this is processed by ANK. The output of TOGETHER is given below andthe output is given in 5.4
From these files we could see that TOGETHER is faithful in translatingthe topologies and making isomorphic models.
5.1.2 DiscussionWe have presented three figures at the start. All these have been convertedand the outputs are displayed above. We can see their similarity and un-derstand the adaptability of TOGETHER. We have tested TOGETHER tohandle the manufacturing of isomorphic models of over 7000 nodes that is
26

fully meshed. This took only 2 minutes to generate this and this is consider-ably fast. However, there are limitations of ANK that makes the generationof larger topologies difficult to implement on the Junosphere. This provesthat TOGETHER handles the manufacturing of Isomorphic graphs in anexcellent manner.
5.2 Working with Multiple TopologiesyEd by yWorks is a very good application for drawing single and multipletopologies. The multiple topologies is done by changing a data field of eachnode to "asn" and assigning different number to them. But this is timeconsuming.
TOGETHER provides topology handling means for AutoNetKit (ANK).This is shown in the examples below. For this example, I have chosen to use3 different topologies calling them 1st.gml,2nd.gml,3rd.gml. This is shown inthe figures below. The first one is 1st.gml is a five node fully meshed topologyas in the figure 5.1 as in page 25. The output was seen earlier in the figure5.3. The second topology is 2nd.gml is a 10 node delaunay triangulationmethod which is as in figure 5.5 as in page 27 and the output from ANK is inthe figure 5.7 in page 28. The third is 6 node topology described in 3rd.gmlas shown as in figure 5.6 in page 28 and the output from ANK is as in thefigure 5.8 in page 28.
Figure 5.5: The second figure -2nd.GML
5.2.1 DiscussionThe following are the outputs of the models that were read and processed byTOGETHER. The first figure 5.9 was generated manually, while the second
27

Figure 5.6: Abilene Topology -3rd.GML
Figure 5.7: Individual Output of 2nd.GML
Figure 5.8: Individual Output of 3rd.GML
28

figure 5.10 was generated automatically.
Figure 5.9: Type 1 Final Output
Figure 5.10: Type 2 Final Output
29

Chapter 6
Discussion and Future Work
From the outputs in 5.1, we could see that all the three topologies are con-nected together. This shows how efficiently TOGETHER manages to handlemultiple topologies too.This is a huge advantage in working with large scalenetworks. We were able to test this and much more on the Junosphere. Inthe future, as the support of ANK increases to Cisco and other providers, weexpect TOGETHER to be able to bridge these worlds too.
We had shown that TOGETHER could generate topologies that are faith-fully translated and the network model preserved. These files were used inJunosphere and we were able to run networks that were based on heuristicsto study the nature of the internet. The project is a success.
We had worked in generating a large number of different topologies andcomplex models and have found that under a minute TOGETHER couldmodel network topology graph models got from various sources and combinethem to form complex models that represent the internet.
Another feature of TOGETHER we discussed was that since it was buildto work well with AutoNetkit, and so as the features increases, the programTOGETHER could efficiently add capabilities to using AutoNetkit too.
We would like to however bring in more work to TOGETHER in improv-ing its output quality.TOGETHER is currently command line based software.If there was time, we could have added features like a GUI based display andmay be even GUI based topology handling. Some aspects of TOGETHERis that in making isomorphic models, some elements were discarded as irrel-evant. One such is the name the user gives to the node. One reason this wasdiscarded was this was dependent on the user and so many models that hadGML files gave different means to naming nodes. This could be included infuture models. Another feature is the current version of TOGETHER cannotread a directory as in all. We would like to add this feature and also enablemore GUI and non-GUI arguments so that the user could let TOGETHER
30

models without any intervention.In this project it is seen TOGETHER handling topologies and enabling
this to work on multiple systems. We would like to better the research on thisand have TOGETHER handle topologies using more researched methods.One such is to implement the rich club model into the program so that userscould select this model and perform studies on it. Another element that couldbe considered is weighted spectral distribution [7] so that the topologies couldbe tuned better and inter AS connections could be made with more care andease.
31

Chapter 7
Conclusion
In today’s economy, the Internet is a very valuable asset. The growth and theinfluence of the internet in the socio-economic lives of billions in the worldare unmatched. Therefore there is an urgent need to finding ways to keepthe network running, making it more efficient and resilient to attacks. Wehave discussed in our paper discussed that because of this need, there hasbeen a drive to model networks and study them.
Over the course of time, there have been many models that lay the foun-dations of good study. This project has made aware that in order to studynetworks, there is a need to work on virtual environments than working withsimulations or emulations. This would bring results that are more compara-ble to the ones that would be obtained in the real networks. Keeping thisin mind, we had introduced some studies in network topology generatorslike IGen, Topology Zoo, etc., that was efficient in plotting the model of theinternet.
Now since all these were products of different institutes and research facil-ities, we discussed the need for a solution to unify the issues in managing net-work topologies. This is the basis of this project. TOGETHER reads GMLfiles representing network topologies and exports isomorphic GRAPHML files.It was then explained in this report how AutoNetkit,could make models forvirtual network hosts. Another feature of TOGETHER was that it couldhandle multiple topologies and even use some heuristics to connect themand present them to be used as reference models for future studies. We hadfinally discussed that the output from AutoNetkit have been used and havebeen able to be deployed in Junosphere environment for research.
In this manner, TOpology GEneration THrough HEuRistics has addedanother stone towards working with models that represent Internet as awhole.
32

Bibliography
[1] Bernhard Ager, Nikolaos Chatzis, Anja Feldmann, Nadi Sarrar, SteveUhlig, and Walter Willinger. Anatomy of a large european ixp. InProceedings of the ACM SIGCOMM 2012 conference on Applications,technologies, architectures, and protocols for computer communication,SIGCOMM ’12, pages 163–174, New York, NY, USA, 2012. ACM.
[2] David Alderson and John Doyle. Toward an optimization-driven frame-work for designing and generating realistic internet topologies. In InACM HotNets-I, pages 41–46, 2002.
[3] J. M. Carlson and John Doyle. Highly optimized tolerance: a mecha-nism for power laws in designed systems. Phys. Rev. E, 60:1412–1427,Aug 1999.
[4] Sanda D and Radu D. Winnet - a network tool. In ICCCC.
[5] M.B. Doar. A better model for generating test networks. In GlobalTelecommunications Conference, 1996. GLOBECOM ’96. ’Communi-cations: The Key to Global Prosperity, pages 86 –93, nov 1996.
[6] Alex Fabrikant, Elias Koutsoupias, and Christos H. Papadimitriou.Heuristically optimized trade-offs: a new paradigm for power laws inthe internet. pages 110–122, 2002.
[7] Damien Fay, Hamed Haddadi, Andrew Thomason, Andrew W. Moore,Richard Mortier, Almerima Jamakovic, Steve Uhlig, and Miguel Rio.Weighted spectral distribution for internet topology analysis: theoryand applications. IEEE/ACM Trans. Netw., 18(1):164–176, 2010.
[8] R. Govindan and H. Tangmunarunkit. Heuristics for internet map dis-covery. In INFOCOM 2000. Nineteenth Annual Joint Conference ofthe IEEE Computer and Communications Societies. Proceedings. IEEE,volume 3, pages 1371 –1380 vol.3, mar 2000.
33

[9] Hamed Haddadi, Damien Fay, Almerima Jamakovic, Olaf Maennel, An-drew W. Moore, Richard Mortier, Miguel Rio, and Steve Uhlig. Beyondnode degree: Evaluating as topology models. CoRR, abs/0807.2023,2008.
[10] Hamed Haddadi, Steve Uhlig, Andrew Moore, Richard Mortier, andMiguel Rio. Modeling internet topology dynamics. SIGCOMM Com-puter Communication Review, 2008.
[11] Cheng Jin, Qian Chen, and Sugih Jamin. Inet: Internet topology gen-erator. Technical report, University of Michigan, 2000.
[12] S. Knight, H.X. Nguyen, N. Falkner, R. Bowden, and M. Roughan. Theinternet topology zoo. Selected Areas in Communications, IEEE Journalon, 29(9):1765 –1775, october 2011.
[13] Simon Knight, Askar Jaboldinov, Olaf Maennel, Iain Phillips, andMatthew Roughan. Autonetkit: simplifying large scale, open-sourcenetwork experimentation. In Proceedings of the ACM SIGCOMM 2012conference on Applications, technologies, architectures, and protocols forcomputer communication, SIGCOMM ’12, pages 97–98, New York, NY,USA, 2012. ACM.
[14] Damien Magoni and Mickaël Hoerdt. Internet core topology mappingand analysis. Computer Communications, 28:494–506, 2005.
[15] Priya Mahadevan, Dmitri Krioukov, Kevin Fall, and Amin Vahdat. Sys-tematic topology analysis and generation using degree correlations. SIG-COMM Comput. Commun. Rev., 36(4):135–146, August 2006.
[16] A. Medina, A. Lakhina, I. Matta, and J. Byers. Brite: an approachto universal topology generation. In Modeling, Analysis and Simulationof Computer and Telecommunication Systems, 2001. Proceedings. NinthInternational Symposium on, pages 346 –353, 2001.
[17] Wolfgang Mühlbauer, Steve Uhlig, Anja Feldmann, Olaf Maennel,Bruno Quoitin, and Bingjie Fu. Impact of routing parameters on routediversity and path inflation. Comput. Netw., 54(14):2506–2518, October2010.
[18] Wolfgang Mühlbauer, Steve Uhlig, Bingjie Fu, Mickael Meulle, and OlafMaennel. In search for an appropriate granularity to model routingpolicies. SIGCOMM Comput. Commun. Rev., 37(4):145–156, August2007.
34
[19] Hung Nguyen, Matthew Roughan, Nickolas John Gowland Knight, Si-mon Charlesand Falkner, Olaf Manuel Maennel, and R. Bush. How tobuild complex, large-scale emulated networks. In Proceedings of 6th In-ternational ICST Conference on Testbeds and Research Infrastructuresfor the Development of Networks and Communities, held in Berlin Ger-many.
[20] B. Quoitin, V. Van den Schrieck, P. Francois, and O. Bonaventure. Igen:Generation of router-level internet topologies through network designheuristics. In Teletraffic Congress, 2009. ITC 21 2009. 21st Interna-tional, pages 1 –8, sept. 2009.
[21] Bruno Quoitin. Towards more representative internet topologies. Tech-nical report, Université Catholique de Louvain, 2010.
[22] N. Spring, R. Mahajan, D. Wetherall, and T. Anderson. Measuring isptopologies with rocketfuel. Networking, IEEE/ACM Transactions on,12(1):2 – 16, feb. 2004.
[23] Hongsuda Tangmunarunkit, Ramesh Govindan, Sugih Jamin, and ScottShenker. Network topology generators: Degree-based vs. structural,2002.
[24] Megan Thomas and Ellen W. Zegura. Generation and analysis of randomgraphs to model internetworks. Technical report, College of Computing,1994.
[25] P. van Mieghem, J.M. Hernandez, T. Kleiberg, and H. Wang. A quali-tative comparison of power law generators. 2006.
[26] B.M. Waxman. Routing of multipoint connections. Selected Areas inCommunications, IEEE Journal on, 6(9):1617 –1622, dec 1988.
[27] Beichuan Zhang, Raymond Liu, Daniel Massey, and Lixia Zhang. Col-lecting the internet as-level topology. SIGCOMM Comput. Commun.Rev., 35(1):53–61, January 2005.
[28] Shi Zhou and R.J. Mondragón. The rich-club phenomenon in the in-ternet topology. Communications Letters, IEEE, 8(3):180 – 182, march2004.
35