(tofacitinib) for the treatment of psoriatic arthritis (psa) · xeljanz® (tofacitinib) for the...
TRANSCRIPT

XELJANZ® (tofacitinib)
for the Treatment of Psoriatic Arthritis (PsA)
Arthritis Advisory Committee (AAC)
August 3, 2017
FDA White Oak Campus
Silver Spring, MD
MA-1
Author: Nancy McKay
Source: SME, see author
Reviewed
Ready for QC
In QC
Date
QC Complete
Date
Slide Coordinators
(Carol Connell/Ann Wouters)
Graphics
(Crystal Huntoon)
QC Coordinator
(Ann Fairbank/Laura Brown)
QC Coordinator
(Ann Fairbank/Laura Brown)
QC Edits
QC Coordinator
(Ann Fairbank/Laura Brown)
Graphics
(Crystal Huntoon)
In RE-QC
Date
Graphics
(Crystal Huntoon)
Reviewed Ready for QC In QC
Date
25 July 2017
QC Complete
30 July 2017

Introduction
Nancy McKay
Director, Regulatory Affairs
Pfizer Inc
MA-2
Author: Nancy McKay
Source: SME, see author Reviewed Ready for QC In QC
Date
25 July 2017 QC Complete
30 July 2017

Overview of Presentation
Topic Presenter
Introduction Nancy McKay Director, Regulatory Affairs
Pfizer Inc
Psoriatic Arthritis:
A Physician’s Perspective/
Unmet Medical Need
Philip Mease, MD, MACR Director, Rheumatology Research, Swedish-Providence-St.
Joseph Health Systems
Clinical Professor, University of Washington School of Medicine,
Seattle, WA
Tofacitinib PsA Development
Program and Efficacy
Keith Kanik, MD, FACR Senior Director, Global Clinical Lead PsA
Inflammation and Immunology
Pfizer Inc
Tofacitinib PsA Safety
Daniela Graham, MD Clinician, PsA Development Program
Inflammation and Immunology
Pfizer Inc
Risk Management Thomas Jones, MD Senior Director, Safety Risk Management
Pfizer Inc
Benefit:Risk and Conclusions
Michael Corbo, PhD Senior VP, Chief Development Officer
Inflammation and Immunology
Pfizer Inc
MA-3
Author: Nancy McKay
Source: Reviewed Ready for QC In QC
Date
25 July 2017 QC Complete
30 July 2017
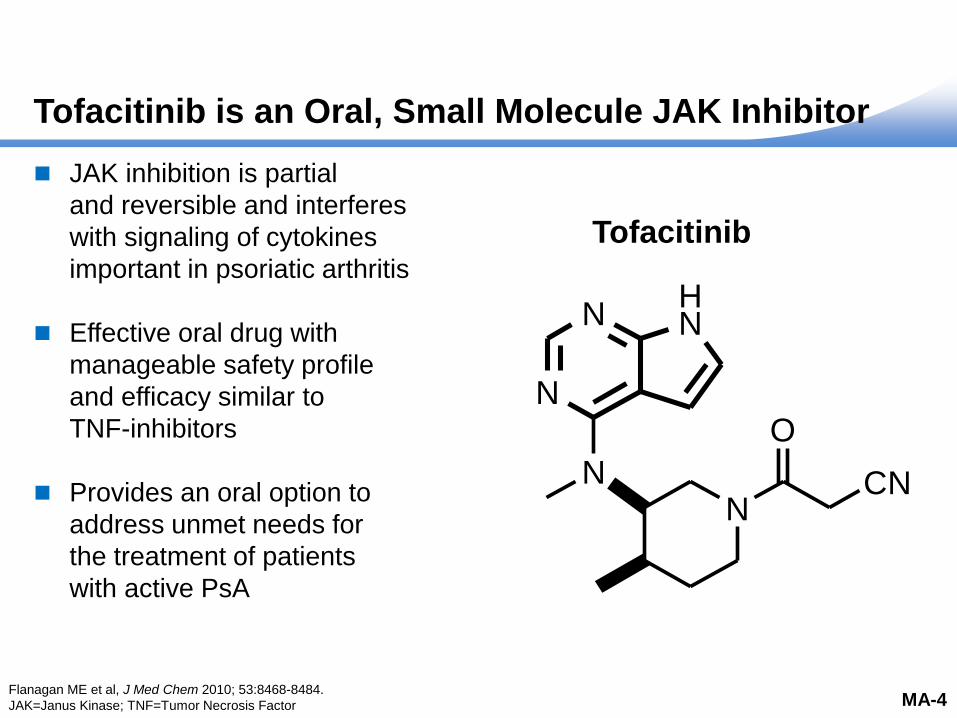
Tofacitinib is an Oral, Small Molecule JAK Inhibitor
JAK inhibition is partial
and reversible and interferes
with signaling of cytokines
important in psoriatic arthritis
Effective oral drug with
manageable safety profile
and efficacy similar to
TNF-inhibitors
Provides an oral option to
address unmet needs for
the treatment of patients
with active PsA
N
NHN
NN
O
CN
Tofacitinib
Flanagan ME et al, J Med Chem 2010; 53:8468-8484.
JAK=Janus Kinase; TNF=Tumor Necrosis Factor MA-4
Author: Jim Clark
Source: Flanagan ME et al, J
Med Chem 2010; 53:8468-8484
Reviewed Ready for QC In QC
Date
25 July 2017
QC Complete
30 July 2017
XELJANZ® (tofacitinib) Development Program
and Clinical Experience
Xeljanz studied extensively with Phase 3 clinical development programs
– Including rheumatoid arthritis, psoriasis, psoriatic arthritis, and
ulcerative colitis
Cumulatively, 22,132 patients have participated in the tofacitinib clinical
development program with patients exposed for up to 9 years
The total estimated post-marketing exposure is in excess of 83,000
patient-years (PY)
The safety of tofacitinib for the treatment of PsA is based on a clinical
development program that consists of
– 783 PsA patients that have been exposed to tofacitinib
– 775 patient-years of tofacitinib exposure as of May 10, 2016
Author: Nancy McKay
Source:
Cumulative: Safety Data
Table–T. Jones; 9 years
exposure: Mike Corbo
Post Marketing: Andrea
Shapiro – as of 6 May
2016; To be updated.
PsA Safety: SCS
MA-5
Reviewed Ready for QC In QC
Date
25 July 2017
QC Complete
30 July 2017 In RE-QC
01 Aug
2017
QC Complete
01 Aug 2017

XELJANZ® (tofacitinib) Regulatory History
Rheumatoid Arthritis (RA)
– Adult RA 5 mg BID IR NDA Approved – November 6, 2012
– Adult RA 11 mg QD XR NDA Approved – February 23, 2016
– Tofacitinib tablets are approved for RA in more than 80 countries;
including US, Canada, EU countries and Japan
Other Indications
– PsO sNDA CRL – October 9, 2015 / sNDA Withdrawn – July 26, 2016
– PsA sNDAs (IR and XR) Submitted – February 22, 2017
– UC sNDA Submitted – May 4, 2017
Author: Nancy McKay
Source: PEARL researched by
Sheila Santos and Gary Perry
MA-6
Reviewed Ready for QC
BID=twice daily; CRL=Complete Response Letter; IR=Immediate Release; mg=milligram; NDA=New Drug Application;
PsO=Psoriasis; QD=once daily; sNDA=supplemental New Drug Application; UC=Ulcerative Colitis; XR=Extended Release
In QC
Date
25 July 2017
QC Complete
30 July 2017

Tofacitinib for the Treatment of PsA
5 mg BID of tofacitinib in PsA has shown efficacy consistent with
bDMARDs in TNFi-naïve patients, while also demonstrating similar
efficacy in TNFi-Inadequate Responders (IR)
The safety profile of tofacitinib, including that in PsA patients, is well
characterized, stable and manageable. It is informed by a large and
growing safety database, with consistency between real world and
clinical safety data
The benefit:risk profile of tofacitinib 5 mg BID for PsA is positive and is
based on substantial clinical evidence
MA-7
Author: Nancy McKay
Source: Reviewed Ready for QC
bDMARD=biologic Disease-Modifying Anti-Rheumatic Drug; TNFi=Tumor Necrosis Factor inhibitor
In QC
Date
25 July 2017
QC Complete
30 July 2017

XELJANZ® (tofacitinib) for PsA
Proposed USPI: Indication and Dosage
XELJANZ is indicated for the treatment of adult patients with active psoriatic arthritis
The recommended dose of XELJANZ is 5 mg twice daily used in combination with
conventional synthetic DMARDs
Proposed Dosage in sNDA
(2. DOSAGE AND ADMINISTRATION)
Proposed Indication in sNDA
(1. INDICATIONS AND USAGE)
Author: Nancy McKay
Source: Proposed USPI
MA-8
Reviewed
USPI=United States Package Insert
Ready for QC In QC
Date
25 July 2017
QC Complete
30 July 2017

Overview of Presentation
MA-9
Topic Presenter
Introduction Nancy McKay Director, Regulatory Affairs
Pfizer Inc
Psoriatic Arthritis:
A Physician’s Perspective/
Unmet Medical Need
Philip Mease, MD, MACR Director, Rheumatology Research, Swedish-Providence-St.
Joseph Health Systems
Clinical Professor, University of Washington School of Medicine,
Seattle, WA
Tofacitinib PsA Development
Program and Efficacy
Keith Kanik, MD, FACR Senior Director, Global Clinical Lead PsA
Inflammation and Immunology
Pfizer Inc
Tofacitinib PsA Safety
Daniela Graham, MD Clinician, PsA Development Program
Inflammation and Immunology
Pfizer Inc
Risk Management Thomas Jones, MD Senior Director, Safety Risk Management
Pfizer Inc
Benefit:Risk and Conclusions
Michael Corbo, PhD Senior VP, Chief Development Officer
Inflammation and Immunology
Pfizer Inc
Author: Nancy McKay
Source: Reviewed Ready for QC In QC
26 July
2017
QC Complete
30 July 2017

Psoriatic Arthritis:
A Physician’s Perspective/
Unmet Medical Need
Philip Mease, MD, MACR
Director, Rheumatology Research, Swedish-Providence-St. Joseph
Health Systems
Clinical Professor of Medicine, University of Washington School of
Medicine, Seattle, WA
MA-10
Author: Thijs Hendriks
Source: SME, see author Reviewed Ready for QC In QC
27 July
2017
QC Complete
31 July 2017

Disclosures for Philip Mease
Research grants, consultation fees, and/or speaker
honoraria: Abbvie, Amgen, Boehringer Ingelheim, Bristol
Myers Squibb, Celgene, Crescendo, Genentech, Janssen,
Lilly, Merck, Novartis, Pfizer, SUN, UCB
MA-11
Author: Thijs Hendriks
Source: SME, see author Reviewed Ready for QC In QC
27 July
2017
QC Complete
01 Aug 2017
Professor Mease: Relevant Clinical, Research,
and Education Experience
Clinical Practice
– Clinical rheumatologist for 35 years and Clinical Professor, University of Washington,
Seattle
– Clinical experience with tofacitinib in RA patients since approval in November 2012
Research experience
– Conducted the first trial of TNFi therapy in PsA and participated in most PsA
development programs
– Involvement in tofacitinib RA studies and in tofacitinib PsA clinical trial design and data
interpretation
Relevant committees and working groups
– Founder and current executive committee member of Group for Research and
Assessment of Psoriasis and Psoriatic Arthritis (GRAPPA)
– OMERACT PsA working group, the National Psoriasis Foundation PsA task force, and
ACR-NPF PsA treatment recommendations working group
– Scientific director, Corrona PsA-SpA registry
MA-12
Speak to clinical experience as a country
doctor and currently especially specialized
in SPA
Speak about clinical research
-As a researcher I have been involved in
Phase II studies for RA and recently in the
studies for PsA.
Since the approval of tofacitinib I have
treated many of my RA patients with
tofacitinib and all together I have allmost a
decade of experience now with this drug.
Talk about commitment to the space for
education, improving science and patient
outcomes
Author: Thijs Hendriks
Source: SME, see author Reviewed Ready for QC
ACR=American College of Rheumatology; OMERACT=Outcome Measures in Rheumatology; NPF=National Psoriasis Foundation;
SpA=Spondyloarthritis
In QC
27 July
2017
QC Complete
01 Aug 2017

Peripheral Arthritis
Dactylitis
Enthesitis
Skin Psoriasis
Arthritis affecting joints such as those in hands, feet and knees
Progressive disability and joint destruction may occur
Spondylitis
Psoriatic Arthritis is a Distinct Disease
Encompassing Numerous Clinical Manifestations1
Psoriatic arthritis in the spine and sacroiliac joints is called psoriatic spondylitis. This results in back pain, stiffness, inability to move and work impairment
Enthesitis is inflammation where tendons and ligaments attach to bone. Enthesitis can occur virtually anywhere in the body. It often appears at the insertion of the Achilles tendon or plantar fascia in the heel, causing walking and standing disability
Psoriasis causes red, scaly, itchy, raised patches on the skin
Dactylitis is significant swelling in the fingers and toes, creating a sausage-like appearance. This is painful and causes stiffness and disability
MA-13
Psoriatic arthritis is a distinct disease with
5 major clinical domains
-walk through domains
-emphasize heterogenicity of the disease
Author: Thijs Hendriks
Source: Reviewed Ready for QC In QC
27 July
2017
1. Ritchlin C et al. N Engl J Med 2017;376:957-70.
QC Complete
01 Aug 2017

PsA Impacts Patient’s Health Related
Quality of Life, Physical and Mental Health
Physical
function
Role
physical
Bodily
pain
General
health
Fatigue
Social
functioning
Role
emotional
Mental
health
0
10
20
30
40
50
60
70
80
90 RA
PsA
PsO
Matched Norms
AG Norm
Taken from Strand V et al, 2012.
MA-14
PsA
PsO
Age and Gender Matched Norms
Physical
function Role
physical
Bodily
pain
General
health Fatigue
Social
functioning
Mental
health
0 10 20 30 40 50 60 70 80 90
Role
emotional
Author: Thijs Hendriks
Source: Strand V et al. Ann
Rheum Dis. 2012;71:1143-1150.
Reviewed
Comparison of Health-Related QoL in PsA and PsO using the SF-36
Ready for QC In QC
27 July
2017
QC Complete
01 Aug 2017
Strand V et al. Ann Rheum Dis 2012;71:1143-1150.
QoL=Quality of Life; SF-36=Short-Form 36-question Health Survey

PsA Impacts Patient’s Health Related
Quality of Life, Physical and Mental Health
Physical
function
Role
physical
Bodily
pain
General
health
Fatigue
Social
functioning
Role
emotional
Mental
health
0
10
20
30
40
50
60
70
80
90 RA
PsA
PsO
Matched Norms
AG Norm
Taken from Strand V et al, 2012.
MA-15
Physical
function Role
physical
Bodily
pain
General
health Fatigue
Social
functioning
Mental
health
0 10 20 30 40 50 60 70 80 90
Role
emotional
Author: Thijs Hendriks
Source: Strand V et al. Ann
Rheum Dis. 2012;71:1143-1150.
PsA
PsO
Age and Gender Matched Norms
Reviewed
Comparison of Health-Related QoL in PsA and PsO using the SF-36
Ready for QC In QC
27 July
2017
QC Complete
31 July 2017
Strand V et al. Ann Rheum Dis 2012;71:1143-1150.
QoL=Quality of Life; SF-36=Short-Form 36-question Health Survey

PsA Impacts Patient’s Health Related
Quality of Life, Physical and Mental Health
Patients with PsA reported greater
impact on physical function, pain,
and fatigue compared to patients
with PsO
Patients suffering from PsA or PsO
also experience negative mental
impact of the disease
Comparison of Health-Related QoL in PsA and PsO using the SF-36
Physical
function
Role
physical
Bodily
pain
General
health
Fatigue
Social
functioning
Role
emotional
Mental
health
0
10
20
30
40
50
60
70
80
90 RA
PsA
PsO
Matched Norms
AG Norm
Taken from Strand V et al, 2012.
MA-16
Physical
function Role
physical
Bodily
pain
General
health Fatigue
Social
functioning
Mental
health
0 10 20 30 40 50 60 70 80 90
Role
emotional
Author: Thijs Hendriks
Source: Strand V et al. Ann
Rheum Dis. 2012;71:1143-1150.
Strand V et al. Ann Rheum Dis 2012;71:1143-1150.
QoL=Quality of Life; SF-36=Short-Form 36-question Health Survey
PsA
PsO
Age and Gender Matched Norms
Reviewed Ready for QC In QC
27 July
2017
Health-Related QoL is severely affected in PsA, both for physical and mental health
QC Complete
01 Aug 2017

Existing Therapeutic Options for PsA Have Limitations:
A Need for Effective New Therapies Exists1-5
2. Marchesoni A et al. J Rheumatol.
2015;93:61-64. 3. Helliwell P et al. Arthritis
Care Res. 2014;66:1759-1766. 4. Lebwohl
et al. J Am Acad Dermatol. 2014;70:871-
881.
DMARD=disease-modifying antirheumatic
drug; MTX=methotrexate; PsA=psoriatic
arthritis; IL=interleukin;
NSAID=nonsteroidal anti-inflammatory
drug; TNF=tumor necrosis factor.
MA-17
Pharmacologic therapies for PsA include
nonbiologic and biologic disease-modifying
antirheumatic drugs (DMARDs). DMARDs
interfere with the disease process by
reducing and/or reversing the signs and
symptoms of disease, disability, quality of
life impairment, and progression of joint
damage.1
DMARDs are loosely grouped according to
their mechanism of action1
Conventional synthetic DMARDs1
Biologic DMARDs, which include both
tumor necrosis factor (TNF) inhibitors
and biologics that target other (non-
TNF) pathways1
Targeted synthetic DMARDs
(synthetic, chemical, oral drugs that
have been specifically designed to
inhibit well-defined molecules or
known structures)1,2
Author: Thijs Hendriks
Source:
Mease PJ. Ann Rheum Dis.
2011;70(suppl 1):i77-i84.
Gossec L et al. Ann Rheum Dis.
2016;75:499-510.
Mease P et al. ACR 2016,
Washington DC, #1041.
Reviewed
• Methotrexate
• Leflunomide
• Sulfasalazine
• Etanercept
• Infliximab
• Adalimumab
• Golimumab
• Certolizumab pegol
• Ustekinumab (anti-IL-12/23)
• Secukinumab (anti-IL-17A)
• Abatacept
(inhibits T-cell co-stimulation)
• Apremilast (PDE4 inhibitor)
Conventional Synthetic DMARDs
TNF Inhibitors Non-TNF Inhibitor
Biologics Targeted Synthetic
DMARDs NSAIDs and
Glucocorticoids
Ready for QC In QC
27 July
2017
1. Coates L et al. Arthirtis and Rheumatology 2016;68(5):1060-1071.; 2. Gossec L et al. Ann Rheum Dis 2016;75:499-510.; 3. Mease P et al. N Engl J
Med 2015;373:1329-39.; 4. Mease P et al Ann Rheum Dis 2017;0:1-9.; 5. Mease PJ. Ann Rheum Dis 2011;70(suppl 1):i77-i84.
csDMARD=conventional synthetic Disease-Modifying Anti-Rheumatic Drug; IL=Interleukin; MTX=Methotrexate; NSAID=Nonsteroidal Anti-
Inflammatory Drug; PDE4=Phosphodiesterase type 4
QC Complete
01 Aug 2017

Existing Therapeutic Options for PsA Have Limitations:
A Need for Effective New Therapies Exists1-5
• MTX is one of the most commonly used systemic medications in PsA, yet has demonstrated minimal clinical efficacy for PsA in studies5
• MTX and sulfasalazine have little effect on enthesitis, dactylitis, and spondylitis6
Efficacy csDMARDs
• The goal of achieving low disease activity or remission is now achievable, however
• 36%-63% of patients do not achieve an ACR20 response at 6 months7,8-17
• 45%-69% may lose response over time or may experience adverse events8,18
• This leads to the need for additional medications to switch5
Efficacy of Targeted and Biologic DMARDs
2. Marchesoni A et al. J Rheumatol.
2015;93:61-64. 3. Helliwell P et al. Arthritis
Care Res. 2014;66:1759-1766. 4. Lebwohl
et al. J Am Acad Dermatol. 2014;70:871-
881.
DMARD=disease-modifying antirheumatic
drug; MTX=methotrexate; PsA=psoriatic
arthritis; IL=interleukin;
NSAID=nonsteroidal anti-inflammatory
drug; TNF=tumor necrosis factor.
Pharmacologic therapies for PsA include
nonbiologic and biologic disease-modifying
antirheumatic drugs (DMARDs). DMARDs
interfere with the disease process by
reducing and/or reversing the signs and
symptoms of disease, disability, quality of
life impairment, and progression of joint
damage.1
DMARDs are loosely grouped according to
their mechanism of action1
Conventional synthetic DMARDs1
Biologic DMARDs, which include both
tumor necrosis factor (TNF) inhibitors
and biologics that target other (non-
TNF) pathways1
Targeted synthetic DMARDs
(synthetic, chemical, oral drugs that
have been specifically designed to
inhibit well-defined molecules or
known structures)1,2
• Methotrexate
• Leflunomide
• Sulfasalazine
• Etanercept
• Infliximab
• Adalimumab
• Golimumab
• Certolizumab pegol
• Ustekinumab (anti-IL-12/23)
• Secukinumab (anti-IL-17A)
• Abatacept
(inhibits T-cell co-stimulation)
• Apremilast (PDE4 inhibitor)
Conventional Synthetic DMARDs
TNF Inhibitors Non-TNF Inhibitor
Biologics Targeted Synthetic
DMARDs NSAIDs and
Glucocorticoids
MA-18
Author: Thijs Hendriks
Source:
1. Coates L et al. Arthirtis and Rheumatology
2016;68(5):1060-1071.; 2. Gossec L et al.
Ann Rheum Dis 2016;75:499-510.; 3. Mease
P et al. N Engl J Med 2015;373:1329-39.; 4.
Mease P et al Ann Rheum Dis 2017;0:1-9.; 5.
Mease PJ. Ann Rheum Dis 2011;70(suppl
1):i77-i84. Center for Drug Evaluation
Research, Summary Review of Otezla,
205437Orig1s000.; 6. Marchesoni A et al. J
Rheumatol 2015;93:61-64.; 7. Helliwell P et
al. Arthritis Care Res 2014;66:1759-1766.;
8. Lebwohl et al. J Am Acad Dermatol
2014;70:871-881.; 9. Otezla [package insert].
Summit, NJ: Celgene Corporation; 2014.; 10.
Stelara [package insert]. Horsham, PA:
Janssen Biotech, Inc.; 2014.; 11. Enbrel
[package insert]. Thousand Oaks, CA:
Immunex Corporation; 2015.; 12. Simponi
[package insert]. Horsham, PA: Janssen
Biotech, Inc.; 2015.; 13. Remicade [package
insert]. Horsham, PA: Janssen Biotech, Inc.;
2015.; 14. Cosentyx [package insert]. East
Hanover, NJ: Novartis Pharmaceuticals
Corporation; 2016.; 15. Cimzia [package
insert]. Smyrna, GA: UCB, Inc.; 2015.; 16.
Humira [package insert]. North Chicago, IL:
AbbVie Inc.; 2015.
17. Golmia RP et al. Rev Bras Reumatol
2014;54:247-249.; 18. Zhang HF et al.
Arthritis Res Ther 2014;16:420.
Reviewed
1. Coates L et al. Arthirtis and Rheumatology 2016;68(5):1060-1071.; 2. Gossec L et al. Ann Rheum Dis 2016;75:499-510.; 3. Mease P et al. N Engl J Med 2015;373:1329-39.; 4. Mease P et al Ann Rheum Dis 2017;0:1-9.; 5. Mease PJ. Ann Rheum Dis 2011;70(suppl 1):i77-i84.; 6. Marchesoni A et al. J Rheumatol 2015;93:61-64.; 7. Helliwell P et al. Arthritis Care Res 2014;66:1759-1766.; 8. Lebwohl et al. J Am Acad Dermatol 2014;70:871-881.; 9. Otezla [package insert]. Summit, NJ: Celgene Corporation; 2014.; 10. Stelara [package insert]. Horsham, PA: Janssen Biotech, Inc.; 2014.; 11. Enbrel [package insert]. Thousand Oaks, CA: Immunex Corporation; 2015.; 12. Simponi [package insert]. Horsham, PA: Janssen Biotech, Inc.; 2015.; 13. Remicade [package insert]. Horsham, PA: Janssen Biotech, Inc.; 2015.; 14. Cosentyx [package insert]. East Hanover, NJ: Novartis Pharmaceuticals Corporation; 2016.; 15. Cimzia [package insert]. Smyrna, GA: UCB, Inc.; 2015.; 16. Humira [package insert]. North Chicago, IL: AbbVie Inc.; 2015.; 17. Golmia RP et al. Rev Bras Reumatol 2014;54:247-249.; 18. Zhang HF et al. Arthritis Res Ther 2014;16:420.
Ready for QC In QC
27 July
2017
QC Complete
01 Aug 2017

Median Drug Survival in PsA is 2 Years on TNFi
Glintborg B et al. Arthritis Rheum 2013;65(5)1213-1223.
DANBIO=Danish Registry for Biologic Therapies in Rheumatology
Clinical Response, Drug Survival, and Predictors of Response Among 548 Patients with
Psoriatic Arthritis who Switched Tumor Necrosis Factor α Inhibitor Therapy:
Results from the Danish Nationwide DANBIO Registry
MA-19
Author: Thijs Hendriks
Source:
Arthritis & Rheumatism
Volume 65, Issue 5, pages 1213-
1223, 23 APR 2013 DOI:
10.1002/art.37876
http://onlinelibrary.wiley.com/doi/1
0.1002/art.37876/full#fig1
Reviewed Ready for QC In QC
27 July
2017
QC Complete
28 July 2017

Patients Are Dissatisfied with Current Therapies
Several key reasons why
treatment was viewed as
burdensome were1,2
– Lack/loss of effectiveness
– Adverse events
– Fear and anxiety of injections
– Pain and discomfort of injections
– Inconvenience
>50% find
current
therapies
burdensome
1. Lebwohl M et al. J Am Acad Dermatol 2014;70:871-881.
2. Menter A et al. J Am Acad Dermatol 2011;65:137-174. MA-20
More Info:
Results from the Multinational Assessment
of Psoriasis and Psoriatic Arthritis (MAPP)
survey (N=3426) showed that
More than 50% of respondents found
oral or biologic therapies to be
burdensome1
Traditional oral medications were
burdensome primarily due to
adverse events (30%),
inconvenience (14%), and
lack/loss of effectiveness (2%)1
Biologics were burdensome
primarily due to fear and anxiety
of injections and physical
preparation for self-injection such
as icing and premedication (26%),
inconvenience (15%), adverse
events (15% ), pain/discomfort
(7%), and a lack/loss of
effectiveness (2%)1
Storage
– Shorth half life, appeals to patients
concerned re. infections and ability to
wash out from drug
importance to patients
All together a new MOA that
would address many of these
issues regarding lack of response,
intolerability and patient
dissatisfaction would be very
welcome in the rheumatology
community
Author: Thijs Hendriks
Source:
1. Lebwohl et al. J Am Acad
Dermatol. 2014;70:871-881.
2. Menter A et al. J Am Acad
Dermatol. 2011;65:137-174.
Reviewed Ready for QC In QC
27 July
2017
QC Complete
28 July 2017

Pathogenic Pathways
MA-21
Author: Thijs Hendriks
Source: Reviewed Ready for QC In QC
27 July
2017
Arthritis
QC Complete
01 Aug 2017

Pathogenic Pathways
MA-22
Author: Thijs Hendriks
Source: Reviewed Ready for QC In QC
27 July
2017
Arthritis
Enthesitis
QC Complete
01 Aug 2017
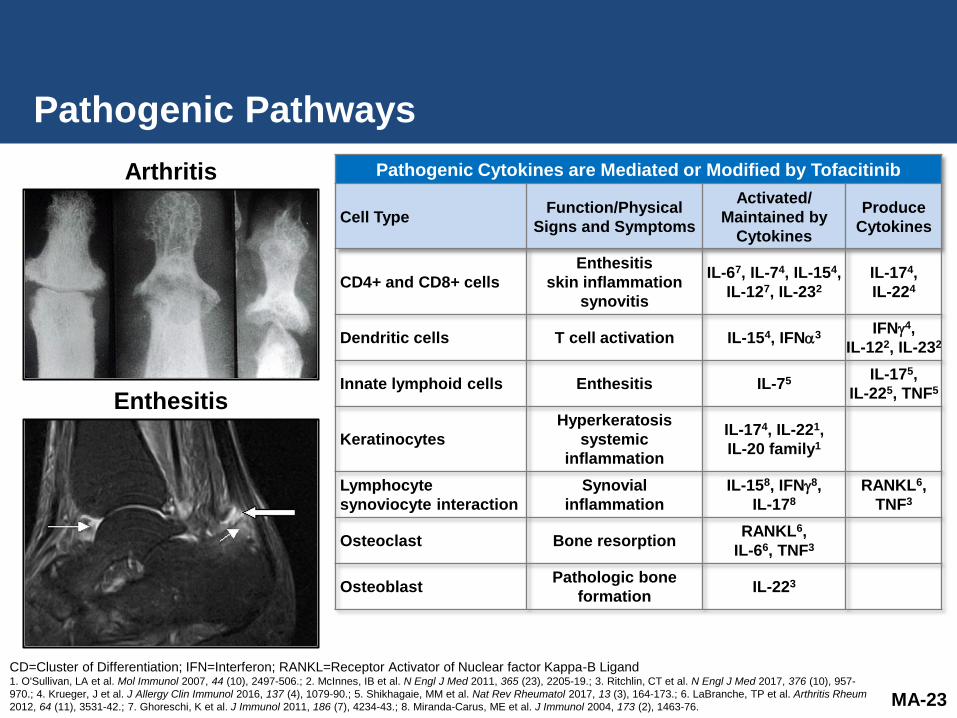
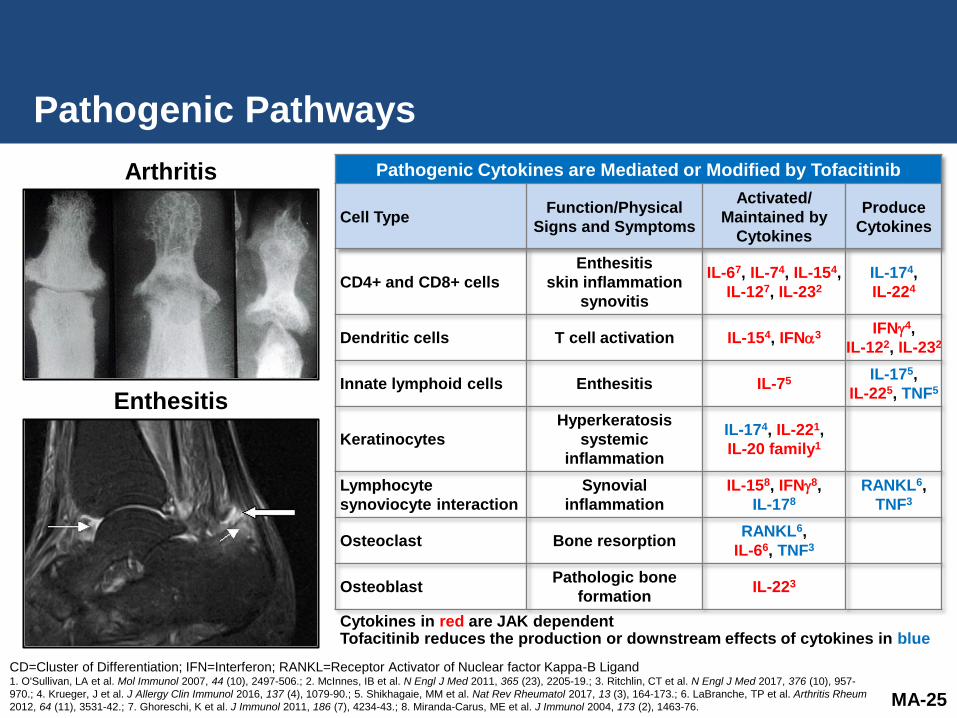
Pathogenic Pathways
Pathogenic Cytokines are Mediated or Modified by Tofacitinib
Cell Type Function/Physical
Signs and Symptoms
Activated/
Maintained by
Cytokines
Produce
Cytokines
CD4+ and CD8+ cells
Enthesitis
skin inflammation
synovitis
IL-67, IL-74, IL-154,
IL-127, IL-232
IL-174,
IL-224
Dendritic cells T cell activation IL-154, IFN3 IFN4,
IL-122, IL-232
Innate lymphoid cells Enthesitis IL-75 IL-175,
IL-225, TNF5
Keratinocytes
Hyperkeratosis
systemic
inflammation
IL-174, IL-221,
IL-20 family1
Lymphocyte
synoviocyte interaction
Synovial
inflammation
IL-158, IFN8,
IL-178
RANKL6,
TNF3
Osteoclast Bone resorption RANKL6,
IL-66, TNF3
Osteoblast Pathologic bone
formation IL-223
MA-23
Author: Thijs Hendriks
Source:
CD=Cluster of Differentiation; IFN=Interferon; RANKL=Receptor Activator of Nuclear factor Kappa-B Ligand 1. O'Sullivan, LA et al. Mol Immunol 2007, 44 (10), 2497-506.; 2. McInnes, IB et al. N Engl J Med 2011, 365 (23), 2205-19.; 3. Ritchlin, CT et al. N Engl J Med 2017, 376 (10), 957-
970.; 4. Krueger, J et al. J Allergy Clin Immunol 2016, 137 (4), 1079-90.; 5. Shikhagaie, MM et al. Nat Rev Rheumatol 2017, 13 (3), 164-173.; 6. LaBranche, TP et al. Arthritis Rheum
2012, 64 (11), 3531-42.; 7. Ghoreschi, K et al. J Immunol 2011, 186 (7), 4234-43.; 8. Miranda-Carus, ME et al. J Immunol 2004, 173 (2), 1463-76.
Reviewed Ready for QC In QC
27 July
2017
Arthritis
Enthesitis
QC Complete
01 Aug 2017

Pathogenic Pathways
Pathogenic Cytokines are Mediated or Modified by Tofacitinib
Cell Type Function/Physical
Signs and Symptoms
Activated/
Maintained by
Cytokines
Produce
Cytokines
CD4+ and CD8+ cells
Enthesitis
skin inflammation
synovitis
IL-67, IL-74, IL-154,
IL-127, IL-232
IL-174,
IL-224
Dendritic cells T cell activation IL-154, IFN3 IFN4,
IL-122, IL-232
Innate lymphoid cells Enthesitis IL-75 IL-175,
IL-225, TNF5
Keratinocytes
Hyperkeratosis
systemic
inflammation
IL-174, IL-221,
IL-20 family1
Lymphocyte
synoviocyte interaction
Synovial
inflammation
IL-158, IFN8,
IL-178
RANKL6,
TNF3
Osteoclast Bone resorption RANKL6,
IL-66, TNF3
Osteoblast Pathologic bone
formation IL-223
Cytokines in red are JAK dependent
MA-24
Author: Thijs Hendriks Source:
1. O'Sullivan, L. A.; Liongue, C.; Lewis,
R. S.; Stephenson, S. E.; Ward, A. C.,
Cytokine receptor signaling through the
Jak-Stat-Socs pathway in disease. Mol
Immunol 2007, 44 (10), 2497-506.
2. McInnes, I. B.; Schett, G., The
pathogenesis of rheumatoid arthritis. The
New England journal of medicine 2011,
365 (23), 2205-19.
3. Ritchlin, C. T.; Colbert, R. A.;
Gladman, D. D., Psoriatic Arthritis. The
New England journal of medicine 2017,
376 (10), 957-970.
4. Krueger, J.; Clark, J. D.; Suarez-
Farinas, M.; Fuentes-Duculan, J.; Cueto,
I.; Wang, C. Q.; Tan, H.; Wolk, R.;
Rottinghaus, S. T.; Whitley, M. Z.;
Valdez, H.; von Schack, D.; O'Neil, S. P.;
Reddy, P. S.; Tatulych, S.; Investigators,
A. S., Tofacitinib attenuates pathologic
immune pathways in patients with
psoriasis: A randomized phase 2 study. J
Allergy Clin Immunol 2016, 137 (4),
1079-90.
5. Shikhagaie, M. M.; Germar, K.; Bal, S.
M.; Ros, X. R.; Spits, H., Innate lymphoid
cells in autoimmunity: emerging
regulators in rheumatic diseases. Nat
Rev Rheumatol 2017, 13 (3), 164-173.
8. Miranda-Carus, M. E.; Balsa, A.;
Benito-Miguel, M.; Perez de Ayala, C.;
Martin-Mola, E., IL-15 and the initiation of
cell contact-dependent synovial
fibroblast-T lymphocyte cross-talk in
rheumatoid arthritis: effect of
methotrexate. J Immunol 2004, 173 (2),
1463-76.
Reviewed Ready for QC In QC
27 July
2017
CD=Cluster of Differentiation; IFN=Interferon; RANKL=Receptor Activator of Nuclear factor Kappa-B Ligand 1. O'Sullivan, LA et al. Mol Immunol 2007, 44 (10), 2497-506.; 2. McInnes, IB et al. N Engl J Med 2011, 365 (23), 2205-19.; 3. Ritchlin, CT et al. N Engl J Med 2017, 376 (10), 957-
970.; 4. Krueger, J et al. J Allergy Clin Immunol 2016, 137 (4), 1079-90.; 5. Shikhagaie, MM et al. Nat Rev Rheumatol 2017, 13 (3), 164-173.; 6. LaBranche, TP et al. Arthritis Rheum
2012, 64 (11), 3531-42.; 7. Ghoreschi, K et al. J Immunol 2011, 186 (7), 4234-43.; 8. Miranda-Carus, ME et al. J Immunol 2004, 173 (2), 1463-76.
Arthritis
Enthesitis
QC Complete
01 Aug 2017
Pathogenic Pathways
Pathogenic Cytokines are Mediated or Modified by Tofacitinib
Cell Type Function/Physical
Signs and Symptoms
Activated/
Maintained by
Cytokines
Produce
Cytokines
CD4+ and CD8+ cells
Enthesitis
skin inflammation
synovitis
IL-67, IL-74, IL-154,
IL-127, IL-232
IL-174,
IL-224
Dendritic cells T cell activation IL-154, IFN3 IFN4,
IL-122, IL-232
Innate lymphoid cells Enthesitis IL-75 IL-175,
IL-225, TNF5
Keratinocytes
Hyperkeratosis
systemic
inflammation
IL-174, IL-221,
IL-20 family1
Lymphocyte
synoviocyte interaction
Synovial
inflammation
IL-158, IFN8,
IL-178
RANKL6,
TNF3
Osteoclast Bone resorption RANKL6,
IL-66, TNF3
Osteoblast Pathologic bone
formation IL-223
Cytokines in red are JAK dependent Tofacitinib reduces the production or downstream effects of cytokines in blue
MA-25
Author: Thijs Hendriks
Source: 4. Krueger, J.; Clark, J. D.;
Suarez-Farinas, M.; Fuentes-Duculan, J.;
Cueto, I.; Wang, C. Q.; Tan, H.; Wolk, R.;
Rottinghaus, S. T.; Whitley, M. Z.;
Valdez, H.; von Schack, D.; O'Neil, S. P.;
Reddy, P. S.; Tatulych, S.; Investigators,
A. S., Tofacitinib attenuates pathologic
immune pathways in patients with
psoriasis: A randomized phase 2 study. J
Allergy Clin Immunol 2016, 137 (4),
1079-90.
6. LaBranche, T. P.; Jesson, M. I.; Radi,
Z. A.; Storer, C. E.; Guzova, J. A.; Bonar,
S. L.; Thompson, J. M.; Happa, F. A.;
Stewart, Z. S.; Zhan, Y.; Bollinger, C. S.;
Bansal, P. N.; Wellen, J. W.; Wilkie, D.
P.; Bailey, S. A.; Symanowicz, P. T.;
Hegen, M.; Head, R. D.; Kishore, N.;
Mbalaviele, G.; Meyer, D. M., JAK
inhibition with tofacitinib suppresses
arthritic joint structural damage through
decreased RANKL production. Arthritis
Rheum 2012, 64 (11), 3531-42.
7. Ghoreschi, K.; Jesson, M. I.; Li, X.;
Lee, J. L.; Ghosh, S.; Alsup, J. W.;
Warner, J. D.; Tanaka, M.; Steward-
Tharp, S. M.; Gadina, M.; Thomas, C. J.;
Minnerly, J. C.; Storer, C. E.; LaBranche,
T. P.; Radi, Z. A.; Dowty, M. E.; Head, R.
D.; Meyer, D. M.; Kishore, N.; O'Shea, J.
J., Modulation of innate and adaptive
immune responses by tofacitinib (CP-
690,550). J Immunol 2011, 186 (7), 4234-
43.
Reviewed Ready for QC In QC
27 July
2017
CD=Cluster of Differentiation; IFN=Interferon; RANKL=Receptor Activator of Nuclear factor Kappa-B Ligand 1. O'Sullivan, LA et al. Mol Immunol 2007, 44 (10), 2497-506.; 2. McInnes, IB et al. N Engl J Med 2011, 365 (23), 2205-19.; 3. Ritchlin, CT et al. N Engl J Med 2017, 376 (10), 957-
970.; 4. Krueger, J et al. J Allergy Clin Immunol 2016, 137 (4), 1079-90.; 5. Shikhagaie, MM et al. Nat Rev Rheumatol 2017, 13 (3), 164-173.; 6. LaBranche, TP et al. Arthritis Rheum
2012, 64 (11), 3531-42.; 7. Ghoreschi, K et al. J Immunol 2011, 186 (7), 4234-43.; 8. Miranda-Carus, ME et al. J Immunol 2004, 173 (2), 1463-76.
Arthritis
Enthesitis
QC Complete
01 Aug 2017

Summary
Psoriatic arthritis has numerous clinical manifestations
– Resulting in physical disability and psychosocial impact
Each patient with PsA is clinically unique
– The disease burden is typically high
Despite the availability of several therapeutic options
– Drugs to treat patients with active PsA all have limitations
A need exists for medications that work across the spectrum
of cytokines involved in the pathogenesis of PsA with a
convenient mode of delivery, i.e. oral
– Tofacitinib has a well-characterized efficacy and safety profile well
known to rheumatologists who have used it in RA
MA-26
Author: Thijs Hendriks
Source: Reviewed Ready for QC In QC
27 July
2017
QC Complete
01 Aug 2017

Overview of Presentation
Topic Presenter
Introduction Nancy McKay Director, Regulatory Affairs
Pfizer Inc
Psoriatic Arthritis:
A Rheumatologist’s Perspective/
Unmet Medical Need
Philip Mease, MD, MACR Director, Rheumatology Research, Swedish-Providence-St.
Joseph’s Health Systems
Clinical Professor, University of Washington School of Medicine,
Seattle, WA
Tofacitinib PsA Development
Program and Efficacy
Keith Kanik, MD, FACR Senior Director, Global Clinical Lead PsA
Inflammation and Immunology
Pfizer Inc
Tofacitinib PsA Safety
Daniela Graham, MD Clinician, PsA Development Program
Inflammation and Immunology
Pfizer Inc
Risk Management Thomas Jones, MD Senior Director, Safety Risk Management
Pfizer Inc
Benefit:Risk and Conclusions
Michael Corbo, PhD Senior VP, Chief Development Officer
Inflammation and Immunology
Pfizer Inc
MA-27
Author: Nancy McKay
Source:
Reviewed Ready for QC In QC
26 July
2017
QC Complete
30 July 2017
Tofacitinib PsA Development Program
and Efficacy
Keith Kanik, MD, FACR
Senior Director, Global Clinical Lead PsA
Inflammation and Immunology
Pfizer Inc
Author: Keith Kanik
Source:
MA-28
Reviewed Ready for QC In QC
27 July
2017
QC Complete
29 July 2017

Psoriatic Arthritis is a Complex Disease
Peripheral Arthritis
Dactylitis
Enthesitis
Psoriasis
ACR 20/50/70 response rates
Health Assessment Questionnaire-Disability Index (HAQ-DI)
Radiographic evaluation of structural damage
Spondylitis
Leeds Enthesitis Index (LEI); Enthesitis resolution (LEI)
SPARCC Enthesitis Index score; Enthesitis resolution (SPARCC)
Psoriasis Area and Severity Index (PASI)
Physician’s Global Assessment of Psoriasis (PGA-PsO)
Dactylitis Severity Score (DSS)
Dactylitis absence
Study Endpoints Associated with PsA Disease Manifestations
MA-29
Bath Ankylosing Spondylitis Disease Activity Index (BASDAI)
Author: Keith Kanik
Source: Reviewed
SPARCC=Spondyloarthritis Research Consortium of Canada
Ready for QC In QC
27 July
2017
QC Complete
29 July 2017

Psoriatic Arthritis is a Complex Disease
ACR 20/50/70 response rates
Health Assessment Questionnaire-Disability Index (HAQ-DI)
Radiographic evaluation of structural damage
Study Endpoints Associated with PsA Disease Manifestations
MA-30
Bath Ankylosing Spondylitis Disease Activity Index (BASDAI)
Leeds Enthesitis Index (LEI); Enthesitis resolution (LEI)
SPARCC Enthesitis Index score; Enthesitis resolution (SPARCC)
Psoriasis Area and Severity Index (PASI)
Physician’s Global Assessment of Psoriasis (PGA-PsO)
Dactylitis Severity Score (DSS)
Dactylitis absence
Peripheral Arthritis
Dactylitis
Enthesitis
Psoriasis
Spondylitis
Author: Keith Kanik
Source: Reviewed
SPARCC=Spondyloarthritis Research Consortium of Canada
Ready for QC In QC
27 July
2017
QC Complete
29 July 2017

CASPAR Criteria to Classify PsA
To meet the CASPAR (Classification Criteria for Psoriatic Arthritis) criteria,
a patient must have inflammatory articular disease (joint, spine, or entheseal)
with 3 points from the following 5 categories
1. Evidence of current psoriasis, a personal history of psoriasis, or a family
history of psoriasis
2. Typical psoriatic nail dystrophy including oncholysis, pitting, and
hyperkeratosis observed on current physical examination
3. A negative test result for the presence of rheumatoid factor by any method
except latex but preferably by enzyme-linked immunosorbent assay or
nephelometry, according to the local laboratory reference range
4. Either current dactylitis or a history of dactylitis recorded by a rheumatologist
5. Radiographic evidence of juxta-articular new bone formation, appearing as
ill-defined ossification near joint margins (but excluding osteophyte formation)
on plain radiographs of the hand or foot
MA-31
Author: Keith Kanik
Source: Reviewed Ready for QC In QC
27 July
2017
QC Complete
29 July 2017

Tofacitinib PsA Phase 3 Program Design
TNFi-IR
(Study 1125)
Ran
do
miz
ati
on
Tofacitinib 5 mg BID
Tofacitinib 10 mg BID
Placebo
Placebo
Tofa 10 mg BID
Tofa 5 mg BID
Author: Betsy Kudlacz
Source: SCE Figure 1
LTE
(Study 1092)
Tofa
5 mg
0 3 6
Months
9 12 1 36
Tofa 5 or 10 mg BID dosing option
Abbreviations: ADA=adalimumab;
BID=twice daily; csDMARD=
conventional synthetic
disease-modifying anti-rheumatic
drug; IR= inadequate response;
LTE=long-term extension;
Pbo=placebo; SC=subcutaneous;
SCE=summary of clinical efficacy;
TNF-IR= inadequate response to
TNFi ;Tofa=tofacitinib; 1091=Study
A3921091; 1092=Study A3921092;
1125=Study A3921125. Tofacitinib 5
mg and 10 mg were BID and
adalimumab 40 mg dosing was SC
q2wk (every 2 weeks) in Study
A3921091.
* Study A3921091 was a double-
dummy design (placebo tablets
and/or placebo injections included
in each treatment group, as
applicable). δ Study A3921091 & A3921125: All
subjects randomized to placebo
were advanced to tofacitinib 5 mg
or 10 mg BID in a blinded manner
at Month 3. † Subjects with inadequate PsA
response permitted to increase to
tofacitinib 10 mg BID; investigators
permitted to reduce dose to 5 mg
BID at any time in response to
safety findings.
No 0.5 months for LTE
MA-32
0.5 2 4
TNFi-Naïve
(Study 1091)
Ran
do
miz
ati
on
Placebo
Placebo
Adalimumab 40 mg SC Q2W
Tofacitinib 10 mg BID
Tofacitinib 5 mg BID
Tofacitinib 5 mg BID
Tofacitinib 10 mg BID
Reviewed
LTE=Long-Term Extension; Q2W=once every two weeks; SC=Subcutaneously
Ready for QC In QC
27 July
2017
QC Complete
29 July 2017

TNFi-Naïve Patient Study Design
(Study 1091)
Primary Efficacy
Endpoints (Month 3)
– ACR20
– ∆HAQ-DI
Secondary Efficacy
Endpoints (Month 3)
– PASI75
– ∆LEI
– ∆DSS
– ∆SF-36v2 PF
– ∆FACIT-F
– ACR50, ACR70:
Month 3
– ACR20: pre-Month 3
N=422
Author: Betsy Kudlacz
Source: SCE Figure 1
0 3 6 Months 9 12 1
Ran
do
miz
ati
on
Placebo
n=53
Placebo
n=52
Adalimumab 40 mg SC Q2W n=106
Tofacitinib 10 mg BID
Tofacitinib 5 mg BID
Tofacitinib 5 mg BID n=107
Tofacitinib 10 mg BID n=104
Primary Efficacy
Endpoints
Abbreviations: ADA=adalimumab; BID=twice daily; csDMARD= conventional synthetic disease-modifying anti-rheumatic
drug; IR= inadequate response; LTE=long-term extension; Pbo=placebo; SC=subcutaneous; SCE=summary of clinical
efficacy; TNF-IR= inadequate response to TNFi ;Tofa=tofacitinib; 1091=Study A3921091; 1092=Study A3921092;
1125=Study A3921125. Tofacitinib 5 mg and 10 mg were BID and adalimumab 40 mg dosing was SC q2wk (every 2
weeks) in Study A3921091.
* Study A3921091 was a double-dummy design (placebo tablets and/or placebo injections included in each treatment
group, as applicable). δ Study A3921091 & A3921125: All subjects randomized to placebo were advanced to tofacitinib 5 mg or 10 mg BID in a
blinded manner at Month 3. † Subjects with inadequate PsA response permitted to increase to tofacitinib 10 mg BID; investigators permitted to reduce
dose to 5 mg BID at any time in response to safety findings.
No 0.5 months for LTE
MA-33
Radiograph Radiograph
4 2 0.5
Reviewed
FACIT-F=Functional Assessment of Chronic Illness Therapy-Fatigue; PASI75=75% improvement in the Psoriasis Area and Severity Index;
SF-36v2 PF=Short Form-36 version 2, Physical Functioning subscale
Ready for QC In QC
27 July
2017
QC Complete
29 July 2017

Patient Disposition in TNFi-Naïve Study
(Study 1091)
Study
Placebo
Tofacitinib
5 mg BID
n (%)
Placebo
Tofacitinib
10 mg BID
n (%)
Tofacitinib
5 mg BID
n (%)
Tofacitinib
10 mg BID
n (%)
Adalimumab
40 mg SC q2w
n (%)
A3921091 A3921091 A3921091 A3921091 A3921091
Randomized
to study
treatment
52 53 107 104 106
Treated 52 (100) 53 (100) 107 (100) 104 (100) 106 (100)
Completed 44 (84.6) 43 (81.1) 96 (89.7) 96 (92.3) 94 (88.7)
Discontinued 8 (15.4) 10 (18.9) 11 (10.3) 8 (7.7) 12 (11.3)
A3921091
Create consort diagrams for both
studies; see email
Author: Betsy Kudlacz
Source: Table 14.1.1.1.1
This slide will not work for the main
deck however, please shift the order
of the boxes so discontinued comes
before completed, add back reasons
for discontinuation and we can use
for backup. A mock up of alternative
was sent via email
Placebo Tofacitinib 5 mg BID
N=52
Placebo Tofacitinib 10 mg BID
N=53
Tofacitinib 5 mg BID
N=107
Tofacitinib 10 mg BID
N=104
Adalimumab 40 mg SC
Q2W N=106
Discontinued
15.4%
Discontinued
18.9%
Discontinued
7.7%
Discontinued
10.3%
Discontinued
11.3%
Randomized N=422
Completed 84.6%
Completed 81.1%
Completed 92.3%
Completed 89.7%
Completed 88.7%
Data shown through Month 12 for Study 1091 and Month 6 for Study 1125
Percentages for the “Treated” row are calculated using the number of Assigned to Study Treatment (i.e., randomized) as the denominator. Other percentages are calculated using the number of treated
subjects in the denominator
Table 14.1.1.1.1
MA-34
Discontinued N=8 (15.4%)
• Died: n=1 • Insufficient response:
n=2 • No longer willing: n=2 • Adverse event: n=2 • Other: n=1
Discontinued N=10 (18.9%)
• No longer willing: n=2 • Adverse event: n=2 • Protocol violation:
n=3 • Other: n=3
Discontinued N=8 (7.7%)
• Insufficient response: n=1
• Lost to follow-up: n=2 • Adverse event: n=3 • Protocol violation:
n=1 • Other: n=1
Discontinued N=11 (10.3%)
• Does not meet criteria: n=1
• No longer willing; n=2 • Adverse event: n=6 • Protocol violation:
n=1 • Other: n=1
Discontinued N=12 (11.3%)
• Does not meet criteria: n=1
• Insufficient response: n=2
• Lost to follow-up: n=1 • No longer willing: n=3 • Adverse event: n=4 • Other: n=1
Reviewed Ready for QC In QC
27 July
2017
QC Complete
29 July 2017

TNFi-Inadequate Responder (TNFi-IR) Study Design
(Study 1125)
Primary Efficacy Endpoints
(Month 3)
– ACR20
– ∆HAQ-DI
Secondary Efficacy Endpoints
(Month 3)
– PASI75
– ∆LEI
– ∆DSS
– ∆SF-36v2 PF
– ∆FACIT-F
– ACR50, ACR70: Month 3
– ACR20: pre-Month 3
N=395
0 3 6 Months 1
Ran
do
miz
ati
on
Placebo
n=65
Placebo
n=66
Tofa 10 mg
BID
Tofa 5 mg
BID
Tofa 5 mg BID n=131
Tofa 10 mg BID n=132
Primary Efficacy
Endpoints
Abbreviations: ADA=adalimumab; BID=twice daily; csDMARD= conventional synthetic disease-modifying anti-rheumatic drug; IR= inadequate response; LTE=long-term
extension; Pbo=placebo; SC=subcutaneous; SCE=summary of clinical efficacy; TNF-IR= inadequate response to TNFi ;Tofa=tofacitinib; 1091=Study A3921091;
1092=Study A3921092; 1125=Study A3921125. Tofacitinib 5 mg and 10 mg were BID and adalimumab 40 mg dosing was SC q2wk (every 2 weeks) in Study A3921091.
* Study A3921091 was a double-dummy design (placebo tablets and/or placebo injections included in each treatment group, as applicable). δ Study A3921091 & A3921125: All subjects randomized to placebo were advanced to tofacitinib 5 mg or 10 mg BID in a blinded manner at Month 3. † Subjects with inadequate PsA response permitted to increase to tofacitinib 10 mg BID; investigators permitted to reduce dose to 5 mg BID at any time in response to
safety findings.
No 0.5 months for LTE
MA-35
4 2 0.5
Author: Betsy Kudlacz
Source: Reviewed Ready for QC In QC
27 July
2017
QC Edits QC Complete
29 July 2017

Patient Disposition in TNFi-IR Study
(Study 1125)
Study 1125
Study
Placebo
Tofacitinib
5 mg BID
n (%)
Placebo
Tofacitinib
10 mg BID
n (%)
Tofacitinib
5 mg BID
n (%)
Tofacitinib
10 mg BID
n (%)
Adalimumab
40 mg SC q2w
n (%)
A3921091 A3921125 A3921091 A3921125 A3921091 A3921125 A3921091 A3921125 A3921091
Randomized
to study
treatment
52 66 53 65 107 132 104 132 106
Treated 52 (100) 66 (100) 53 (100) 65 (100) 107 (100) 131 (99.2) 104 (100) 132 (100) 106 (100)
Completed 44 (84.6) 56 (84.8) 43 (81.1) 56 (86.2) 96 (89.7) 122 (93.1) 96 (92.3) 111 (84.1) 94 (88.7)
Discontinued 8 (15.4) 10 (15.2) 10 (18.9) 9 (13.8) 11 (10.3) 9 (6.9) 8 (7.7) 21 (15.9) 12 (11.3)
Study
Placebo
Tofacitinib
5 mg BID
n (%)
Placebo
Tofacitinib
10 mg BID
n (%)
Tofacitinib
5 mg BID
n (%)
Tofacitinib
10 mg BID
n (%)
Adalimumab
40 mg SC q2w
n (%)
A3921125 A3921125 A3921125 A3921125
Randomized
to study
treatment
66 65 132 132
Treated 66 (100) 65 (100) 131 (99.2) 132 (100)
Completed 56 (84.8) 56 (86.2) 122 (93.1) 111 (84.1)
Discontinued 10 (15.2) 9 (13.8) 9 (6.9) 21 (15.9)
Placebo Tofacitinib 5 mg BID
N=66
Placebo Tofacitinib 10 mg BID
N=65
Tofacitinib 5 mg BID
N=131
Tofacitinib 10 mg BID
N=132
Discontinued
15.2%
Completed 84.8%
Discontinued
13.8%
Completed 86.2%
Discontinued
15.9%
Completed 84.1%
Discontinued
6.9%
Completed 93.1%
Randomized N=395
Not treated N=1 No longer willing to participate
Author: Betsy Kudlacz
Source: Table 14.1.1.1.1
Data shown through Month 12 for Study 1091 and Month 6 for Study 1125
Percentages for the “Treated” row are calculated using the number of Assigned to Study Treatment (i.e., randomized) as the denominator. Other percentages are calculated using the number of treated subjects in the denominator
Table 14.1.1.1.1
MA-36
Discontinued N=10 (15.2%)
• Inadequate clinical response: n=4
• Medication error w/o associated AE: n=2
• No longer willing to participate: n=2
• AE related to study drug: n=1
• AE unrelated to study drug: n=1
Discontinued N=9 (13.8%)
• Inadequate clinical response: n=2
• No longer willing to participate: n=3
• Protocol violation: n=1 • AE related to study drug:
n=2 • AE unrelated to study
drug: n=1
Discontinued N=21 (15.9%)
• Insufficient clinical response: n=4
• No longer willing to participate: n=4
• Protocol violation: n=2 • AE related to study drug:
n=8 • AE unrelated to study
drug: n=2
Discontinued N=9 (6.9%)
• Insufficient clinical response: n=1
• No longer willing to participate: n=1
• Protocol violation: n=2 • AE related to study drug:
n=3 • AE unrelated to study
drug: n=2
Reviewed Ready for QC In QC
27 July
2017
QC Complete
29 July 2017

Similar Baseline Demographics and Disease
Characteristics Between PsA Studies
TNFi-Naïve
(Study 1091)
N=422
TNFi-IR
(Study 1125)
N=394
Male, n (%) 197 (46.7) 176 (44.7)
Age, mean, years (SD) 47.9 (12.1) 50.0 (12.0)
White, n (%) 409 (96.9) 363 (92.1)
Mean PsA duration, years 6.1 9.4
Patients with BSA≥3% psoriasis, % 73.9 62.7
Patients with enthesitis, LEI >0, % 66.4 69.8
Patients with dactylitis, DSS >0, % 56.2 49.2
Mean swollen joint count 11.5 11.8
Mean tender joint count 19.6 22.0
Median CRP, mg/L (ULN 2.87 mg/L) 4.89 4.73
Mean HAQ-DI 1.11 1.30
Patients with concomitant csDMARD use, % 100.0 99.0
MTX use, % 83.9 71.6
Patients with oral corticosteroid use, % 19.2 24.1
{Please order as follows:
Male
Age
White
PsA Duration
% BSA
Enthesitis
Dactylitis
Swollen/Tender
Mean CRP
MTX use
Steroid use
Geographic Region (followed by regions)
Author: Betsy Kudlacz
Source: (Safety Analysis
Set); A3921091 CSR
Table 14.1.2.1.1.1, Table
14.1.2.1.1.3; A3921125
CSR Table 14.1.2.1.1.1,
Table 14.1.2.1.1.3; SCS
Table C1.3.1.1,
Table C1.3.2.1; SCE
Table 12
Abbreviation: CSR=Clinical Study Report; SCE=Summary of Clinical Efficacy; SCS=Summary of Clinical Safety Source: A3921091 CSR Table 14.1.2.2.1, Table 14.4.2.4.1.3, Table 14.4.2.4.6.1; Table 14.4.2.1.3.1; A3921125 CSR Table 14.1.2.2.1, Table 14.4.2.4.1.3, Table 14.4.2.1.5.1; SCE Table 13; SCS Table C1.3.3.1; Ad hoc Table 00013.2, Table 00013.3.; SCE table 13 Abbreviation: BSA=Body Surface Area; CRP=C-reactive Protein; CSR=Clinical Study Report; DSS=Dactylitis Severity Score; HAQ-DI= Health assessment questionnaire disability index; LEI=Leeds Enthesitis Index ; MTX=Methotrexate; PsA=psoriatic arthritis; SCE-Summary of Clinical Efficacy; SCS=Summary of Clinical Safety MTX use was up to Month 3; Oral corticosteroid use is on Day 1 ROW= Brazil, Mexico, Taiwan
MA-37
Reviewed
BSA=Body Surface Area; CRP=C-Reactive Protein; csDMARD=conventional synthetic Disease Modifying Anti-Rheumatic Drugs;
SD=Standard Deviation; ULN=Upper Limit of Normal
Ready for QC In QC
27 July
2017
QC Edits QC Complete
29 July 2017

Significant Improvement in Peripheral Arthritis
(Month 3)
*Achieved statistical significance under Type I error control †95% CI for difference between active treatment and placebo excluded zero
FAS, MR=NR
CI=Confidence Interval; SE=Standard Error
Ada 40 mg SC Q2W Tofa 10 mg BID Tofa 5 mg BID Placebo
TNFi-Naïve (Study 1091)
33.3
9.5 4.8
50.5*
28.0*
16.8*
60.6*
40.4*
14.4*
51.9†
33.0†
18.9†
0
10
20
30
40
50
60
70
80
ACR20 ACR50 ACR70
Author: Betsy Kudlacz
Source: CSR Tables
14.2.1.1.2.1,
14.2.2.3.2.1, 14.2.2.4.2.1
MA-38
Primary Endpoint
23.7
14.5 9.9
49.6*
29.8*
16.8
47.0*
28.0*
14.4
0
10
20
30
40
50
60
70
80
ACR20 ACR50 ACR70
TNFi-IR (Study 1125) At all time points
Placebo (N=131)
Tofa 5 mg BID (N=131)
Tofa 10 mg BID (N=132)
Re
sp
on
se
Ra
te, %
(S
E)
At all time points
Placebo (N=105)
Tofa 5 mg BID (N=107)
Tofa 10 mg BID (N=104)
Ada 40 mg SC Q2W (N=106)
Reviewed Ready for QC In QC
27 July 2017 QC Complete
31 July 2017

Significant Improvement in Peripheral Arthritis
(Month 3)
TNFi-Naïve (Study 1091)
33.3
9.5 4.8
50.5*
28.0*
16.8*
60.6*
40.4*
14.4*
51.9†
33.0†
18.9†
0
10
20
30
40
50
60
70
80
ACR20 ACR50 ACR70
Author: Betsy Kudlacz
Source: CSR Tables
14.2.1.1.2.1,
14.2.2.3.2.1, 14.2.2.4.2.1
MA-39
23.7
14.5 9.9
49.6*
29.8*
16.8
47.0*
28.0*
14.4
0
10
20
30
40
50
60
70
80
ACR20 ACR50 ACR70
TNFi-IR (Study 1125)
Re
sp
on
se
Ra
te, %
(S
E)
Ada 40 mg SC Q2W Tofa 10 mg BID Tofa 5 mg BID Placebo
At all time points
Placebo (N=105)
Tofa 5 mg BID (N=107)
Tofa 10 mg BID (N=104)
Ada 40 mg SC Q2W (N=106)
At all time points
Placebo (N=131)
Tofa 5 mg BID (N=131)
Tofa 10 mg BID (N=132)
Reviewed
*Achieved statistical significance under Type I error control †95% CI for difference between active treatment and placebo excluded zero
FAS, MR=NR
CI=Confidence Interval; SE=Standard Error
Ready for QC In QC
27 July
2017
QC Complete
31 July 2017

Significant Improvement in Peripheral Arthritis
(Month 3)
TNFi-Naïve (Study 1091)
33.3
9.5 4.8
50.5*
28.0*
16.8*
60.6*
40.4*
14.4*
51.9†
33.0†
18.9†
0
10
20
30
40
50
60
70
80
ACR20 ACR50 ACR70
At all time points
Placebo (N=105)
Tofa 5 mg BID (N=107)
Tofa 10 mg BID (N=104)
Ada 40 mg SC Q2W (N=106)
Author: Betsy Kudlacz
Source: CSR Tables
14.2.1.1.2.1,
14.2.2.3.2.1, 14.2.2.4.2.1
MA-40
23.7
14.5 9.9
49.6*
29.8*
16.8
47.0*
28.0*
14.4
0
10
20
30
40
50
60
70
80
ACR20 ACR50 ACR70
TNFi-IR (Study 1125)
Re
sp
on
se
Ra
te, %
(S
E)
Ada 40 mg SC Q2W Tofa 10 mg BID Tofa 5 mg BID Placebo
At all time points
Placebo (N=131)
Tofa 5 mg BID (N=131)
Tofa 10 mg BID (N=132)
Reviewed
*Achieved statistical significance under Type I error control †95% CI for difference between active treatment and placebo excluded zero
FAS, MR=NR
CI=Confidence Interval; SE=Standard Error
Ready for QC In QC
27 July
2017
QC Complete
31 July 2017

Onset of Efficacy at 2 Weeks
AC
R2
0 R
es
po
ns
e R
ate
, %
(S
E)
0
20
40
60
80
0 1 2 3 4 5 6 7 8 9 10 11 12
Response Rates at Month 3
Study PBO Tofa
5 mg
Tofa
10 mg ADA
A3921125 23.66 49.62 46.97 -
A3921091 33.33 50.47 60.58 51.89
Integrated 27.97 50.00 52.97 -
Author: Betsy Kudlacz
Source CSR Tables
14.2.1.1.2.1; Table
14.2.1.1.2.2
MA-41
0
20
40
60
80
0 1 2 3 4 5 6
TNFi-Naïve (Study 1091)
Month
TNFi-IR (Study 1125)
*
*
* †
*
*
* *
*
*
†
*
* † *
Placebo
N
Tofa
5 mg BID
N
Tofa
10 mg BID
N
Ada 40 mg
SC Q2W
N
1091 105 107 104 106
1125 131 131 132 -
*
* *
* †
*Achieved statistical significance under Type I error control †95% CI for difference between active treatment and placebo excluded zero
FAS, MR=NR
FAS=Full Analysis Set; MR=NR=Missing Response=Non-Response; N=Number of patients in FAS
Reviewed Ready for QC In QC
27 July
2017
QC Complete
01 Aug 2017

Efficacy First Observed at 2 Weeks Continued
to Improve to Month 3
AC
R2
0 R
es
po
ns
e R
ate
, %
(S
E)
0
20
40
60
80
0 1 2 3 4 5 6 7 8 9 10 11 12
Response Rates at Month 3
Study PBO Tofa
5 mg
Tofa
10 mg ADA
A3921125 23.66 49.62 46.97 -
A3921091 33.33 50.47 60.58 51.89
Integrated 27.97 50.00 52.97 -
Author: Betsy Kudlacz
Source CSR Tables
14.2.1.1.2.1; Table
14.2.1.1.2.2
MA-42
0
20
40
60
80
0 1 2 3 4 5 6
TNFi-Naïve (Study 1091)
Month
TNFi-IR (Study 1125)
*
* *
* *
*
*
* *
† * †
* † *
* †
*
*
*
Reviewed
*Achieved statistical significance under Type I error control †95% CI for difference between active treatment and placebo excluded zero
FAS, MR=NR
FAS=Full Analysis Set; MR=NR=Missing Response=Non-Response; N=Number of patients in FAS
Ready for QC
Placebo
N
Tofa
5 mg BID
N
Tofa
10 mg BID
N
Ada 40 mg
SC Q2W
N
1091 105 107 104 106
1125 131 131 132 -
In QC
27 July
2017
QC Complete
01 Aug 2017

Efficacy Improved or Maintained Beyond Month 3
AC
R2
0 R
es
po
ns
e R
ate
, %
(S
E)
0
20
40
60
80
0 1 2 3 4 5 6 7 8 9 10 11 12
Response Rates at Month 3
Study PBO Tofa
5 mg
Tofa
10 mg ADA
A3921125 23.66 49.62 46.97 -
A3921091 33.33 50.47 60.58 51.89
Integrated 27.97 50.00 52.97 -
Author: Betsy Kudlacz
Source CSR Tables
14.2.1.1.2.1; Table
14.2.1.1.2.2
MA-43
0
20
40
60
80
0 1 2 3 4 5 6
TNFi-Naïve (Study 1091)
Month
TNFi-IR (Study 1125)
*
*
*
*
†
* *
*
*
* *
*
*
† * †
*
* † *
Reviewed
*Achieved statistical significance under Type I error control †95% CI for difference between active treatment and placebo excluded zero
FAS, MR=NR
FAS=Full Analysis Set; MR=NR=Missing Response=Non-Response; N=Number of patients in FAS
Ready for QC
Placebo
N
Tofa
5 mg BID
N
Tofa
10 mg BID
N
Ada 40 mg
SC Q2W
N
1091 105 107 104 106
1125 131 131 132 -
In QC
27 July
2017
QC Complete
01 Aug 2017

-0.14
-0.39* -0.35*
-1.0
-0.8
-0.6
-0.4
-0.2
0.0
PlaceboN=131
Tofa 5 mg BIDN=129
Tofa 10 mg BIDN=132
LS
Me
an
(S
E)
-0.18
-0.35* -0.40* -0.38†
-1.0
-0.8
-0.6
-0.4
-0.2
0.0
PlaceboN=104
Tofa 5 mg BIDN=107
Tofa 10 mg BIDN=104
Ada 40 mg SC Q2WN=106
LS
Me
an
(S
E)
Significant Improvements in ∆HAQ-DI (Month 3):
Second Primary Endpoint A3921125 Placebo
N=131
Tofacitinib
5 mg BID
N=129
Tofacitinib
10 mg BID
N=132
Baseline HAQ-DI (Mean) 1.25 1.26 1.37
LS Mean -0.14 -0.39 -0.35
Difference from placebo
Difference - -0.25 -0.22
SE - 0.06 0.06
95% CI - (-0.38, -0.13) (-0.34, -0.09)
P-value (nominal) - <0.0001 0.0009
A3921091 Placebo
(n=102)
Tofacitinib
5 mg BID
(n=103)
Tofacitinib
10 mg BID
(n=103)
Adalimumab
40 mg
(n=101)
LS Mean -0.18 -0.35 -0.40 -0.38
Difference from placebo
Difference - -0.17 -0.22 -0.20
SE - 0.06 0.06 0.06
95% CI - (-0.29, -0.05) (-0.34, -0.10) (-0.32, -0.08)
P-value (nominal) - 0.0062 0.0004 0.0012
Author: Betsy Kudlacz
Source CSR Table
14.2.1.3.3.1
Source: CSR tables
14.2.1.3.3.1
TNFi-Naïve (Study 1091)
TNFi-IR (Study 1125)
MA-44
*Achieved statistical significance under Type I error control †95% CI for difference between active treatment and placebo excluded zero
MMRM, FAS
LS=Least Square; MMRM=Mixed Model for Repeated Measures
Reviewed Ready for QC In QC
27 July 2017 QC Complete
31 July 2017

Evaluation of Radiographic Progression
Radiographs of hands and feet taken at baseline and
Month 12 (or early termination) in TNFi-naïve patients
(Study 1091)
This pre-specified analysis was performed to assess lack of
structural progression over 12 months of tofacitinib
treatment
Adalimumab 40 mg SC Q2W used as active comparator
Study designed with consideration of regulatory agency
advice
MA-45
Author: Betsy Kudlacz
A3921091 CSR Table
14.2.2.2.2; CSR=Clinical
Study Report;
Baseline info: Table
14.1.2.2.2
Number of subjects with progression: Pbo to Tofa 5=2; Tofa 5=4; Ada=2; (NormApp, FAS, Linear Extrapolation); A3921091 CSR Table 14.2.2.2.2; CSR=Clinical Study Report; FAS= Full Analysis Set; Baseline info: Table 14.1.2.2.2 mTSS range= 0-528 Erosion score range= 0-320; Joint space narrowing range=0-208 Erosion score (subjects with bsln >0) Mean (SD) Pbo to T5=13.4 (32.0) T5=10.82 (16.3) Ada=9.16 (23.2) Joint space narrowing score (subjects with bsln>0 Mean (SD) Pbo to T5=19.7 (35.4) T5=8.59 (11.5) Ada=13.7 (26.2)
Reviewed Ready for QC In QC
27 July
2017
QC Complete
31 July 2017

Change from Baseline in mTSS at Month 12
in TNFi-Naïve Patients (Study 1091)
FAS, Linear Extrapolation
mTSS=modified Total Sharp Score; N=number of subjects evaluable at Month 12 after linear extrapolation. n=number of progressors
EF-11
-4
-3
-2
-1
0
1
2
3
4
0 10 20 30 40 50 60 70 80 90 100
∆m
TS
S
(mT
SS
Ra
ng
e:
0-5
28)
Cumulative Probability
Tofa 5 mg BID Tofa 10 mg BID Ada 40 mg SC Q2W
Author: Betsy Kudlacz
Source: Figure 14.2.2.1.2.2, table at
bottom
A3921091 Table 14.2.2.2.2 and Ad
Hoc 00025.14.2.2.1.4.2
MA-46
Reviewed Ready for QC In QC
31 July
2017
QC Complete
31 July 2017

∆mTSS and Progressor Rates at Month 12
in TNFi-Naïve Patients (Study 1091)
EF-11
-4
-3
-2
-1
0
1
2
3
4
0 10 20 30 40 50 60 70 80 90 100
∆m
TS
S
(mT
SS
Ra
ng
e:
0-5
28)
Cumulative Probability
Tofa 5 mg BID Tofa 10 mg BID Ada 40 mg SC Q2W
Author: Betsy Kudlacz
Source: Figure 14.2.2.1.2.2, table at
bottom
A3921091 Table 14.2.2.2.2 and Ad
Hoc 00025.14.2.2.1.4.2
MA-47
Progressor Rate at Month 12
N ΔmTSS>0
n (%)
Difference from
Ada 40 mg SC Q2W
% (95% CI)
ΔmTSS>0.5
n (%)
Difference from
Ada 40 mg SC Q2W
% (95% CI)
Tofa 5 mg BID 98 9 (9.2) 5.0 (-2.0, 12.0) 4 (4.1) 2.0 (-2.9, 6.8)
Tofa 10 mg BID 99 7 (7.1) 2.9 (-3.6, 9.3) 5 (5.1) 3.0 (-2.3, 8.1)
Ada 40 mg SC Q2W 95 4 (4.2) - 2 (2.1) -
FAS, Linear Extrapolation
mTSS=modified Total Sharp Score; N=number of subjects evaluable at Month 12 after linear extrapolation. n=number of progressors
Reviewed Ready for QC In QC
31 July
2017 QC Complete
01 Aug 2017

0
20
40
60
80
0 1 2 3 4 5 6 7 8 9 10 11 12
†
Improvements in Psoriasis
(PASI75 Response Rate)
Response Rates at Month 3
Study PBO Tofa
5 mg
Tofa
10 mg ADA
A3921125 14.0 21.3 42.3 -
A3921091 14.6 42.7 44.3 39.0
Integrated 14.3 32.1 43.7 -
Re
sp
on
se
Ra
te, %
(S
E)
0
20
40
60
80
0 1 2 3 4 5 6
Author: Betsy Kudlacz
Source: A3921091 CSR
Table 14.2.2.6.2 Table
14.2.2.6.4; A3921125
CSR Table 14.2.2.4.2
Table 14.2.2.4.3;
Tofa 5 mg PASI75 response in TNFi-IR NS at Month 3; Tofa efficacy comparable to adalimumab in A3921091; NormApp, For Subjects with Baseline BSA≥3% and PASI >0 in FAS, MR=NR) ; Nominal *p≤0.05 vs. placebo; **p<0.001 vs. placebo; ***p<0.0001 vs. placebo; Abbreviation: CSR=Clinical Study Report; BSA= Body Surface Area; PASI=Psoriasis Area and Severity Index; MR=Missing Response; NR=Non-response Table 14.2.2.6.1.1, Table 14.2.2.6.2, 14.2.2.4.2; 14.2.2.4.3
MA-48
Month
TNFi-IR (Study 1125)
TNFi-Naïve (Study 1091)
*Achieved statistical significance under Type I error control †95% CI for difference between active treatment and placebo excluded zero
For patients with Baseline BSA≥3% and PASI>0 in FAS, MR=NR
†
†
* * †
†
*
Reviewed
Placebo
N
Tofa
5 mg BID
N
Tofa
10 mg BID
N
Ada 40 mg
SC Q2W
N
1091 82 82 70 77
1125 86 80 81 -
Ready for QC In QC
31 July
2017 QC Complete
01 Aug 2017
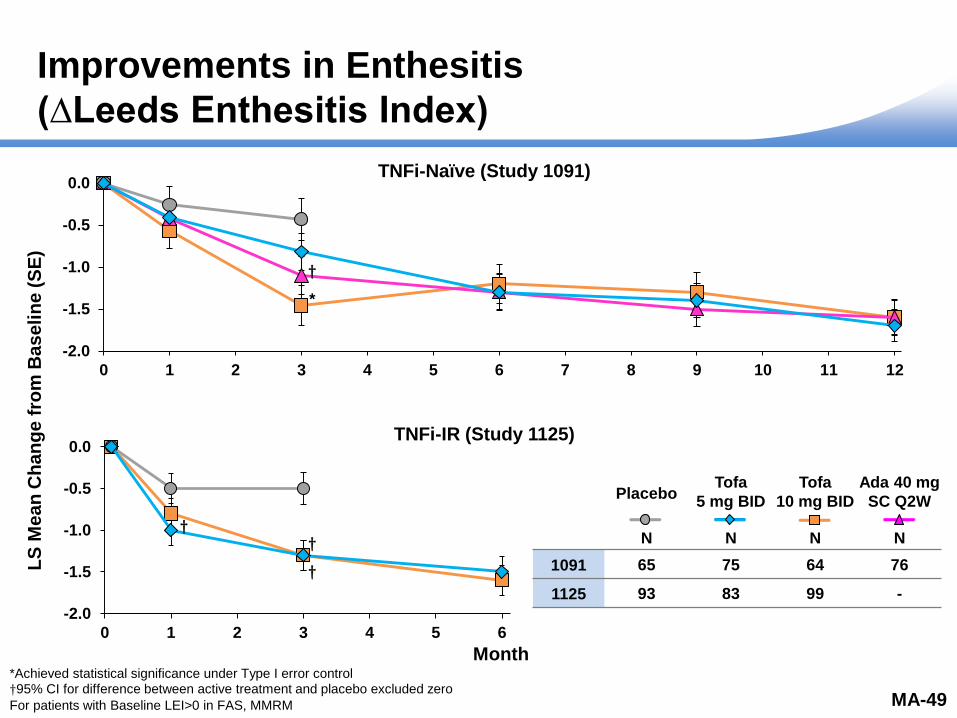
Improvements in Enthesitis
(∆Leeds Enthesitis Index)
LS Mean Change at Month 3
Study PBO Tofa
5 mg
Tofa
10 mg ADA
A3921125 -0.5 -1.3 -1.3 -
A3921091 -0.4 -0.8 -1.5 -1.1
Integrated -0.5 -1.2 -1.4 -
LS
Me
an
Ch
an
ge
fro
m B
as
eli
ne
(S
E)
Month
-2.0
-1.5
-1.0
-0.5
0.0
0 1 2 3 4 5 6
Author: Betsy Kudlacz
Source: Tables
14.2.2.16.3.1;
14.2.2.16.3.2; Baseline:
Table 14.1.2.2.1
Table 14.2.2.18.3.1,
Table 14.2.2.18.3.2
MMRM, For Subjects with Baseline LEI >0 in FAS, NI) ; Nominal *p≤0.05 vs. placebo; **p<0.001; ***p<0.0001 vs. placebo Tables 14.2.2.16.3.1; 14.2.2.16.3.2; Baseline: Table 14.1.2.2.1 Table 14.2.2.18.3.1, Table 14.2.2.18.3.2
MA-49
-2.0
-1.5
-1.0
-0.5
0.0
0 1 2 3 4 5 6 7 8 9 10 11 12
*Achieved statistical significance under Type I error control †95% CI for difference between active treatment and placebo excluded zero
For patients with Baseline LEI>0 in FAS, MMRM
†
*
†
†
†
TNFi-IR (Study 1125)
TNFi-Naïve (Study 1091)
Reviewed
Placebo
N
Tofa
5 mg BID
N
Tofa
10 mg BID
N
Ada 40 mg
SC Q2W
N
1091 65 75 64 76
1125 93 83 99 -
Ready for QC In QC
31 July
2017
QC Complete
02 Aug 2017

Improvements in Dactylitis
(∆Dactylitis Severity Score)
MA-50
LS Mean Change at Month 3
Study PBO Tofa
5 mg
Tofa
10 mg ADA
A3921125 -1.9 -5.2 -5.4 -
A3921091 -2.0 -3.5 -5.5 -4.0
Integrated -2.5 -4.6 -5.8 -
Month
-10
-8
-6
-4
-2
0
2
0 1 2 3 4 5 6
Author: Betsy Kudlacz
Source: Tables
14.2.2.15.3.1;
14.2.2.15.3.2; Baseline:
Table 14.1.2.2.1; Table
14.2.2.17.3.1, Table
14.2.2.17.3.2
LS
Me
an
Ch
an
ge
fro
m B
as
eli
ne
(S
E)
-10
-8
-6
-4
-2
0
2
0 1 2 3 4 5 6 7 8 9 10 11 12
†95% CI for difference between active treatment and placebo excluded zero
For patients with Baseline DSS>0, in FAS, MMRM
† †
†
†
† †
†
TNFi-IR (Study 1125)
TNFi-Naïve (Study 1091)
Reviewed
Placebo
N
Tofa
5 mg BID
N
Tofa
10 mg BID
N
Ada 40 mg
SC Q2W
N
1091 57 60 60 58
1125 62 65 64 -
Ready for QC In QC
31 July
2017 QC Complete
01 Aug 2017
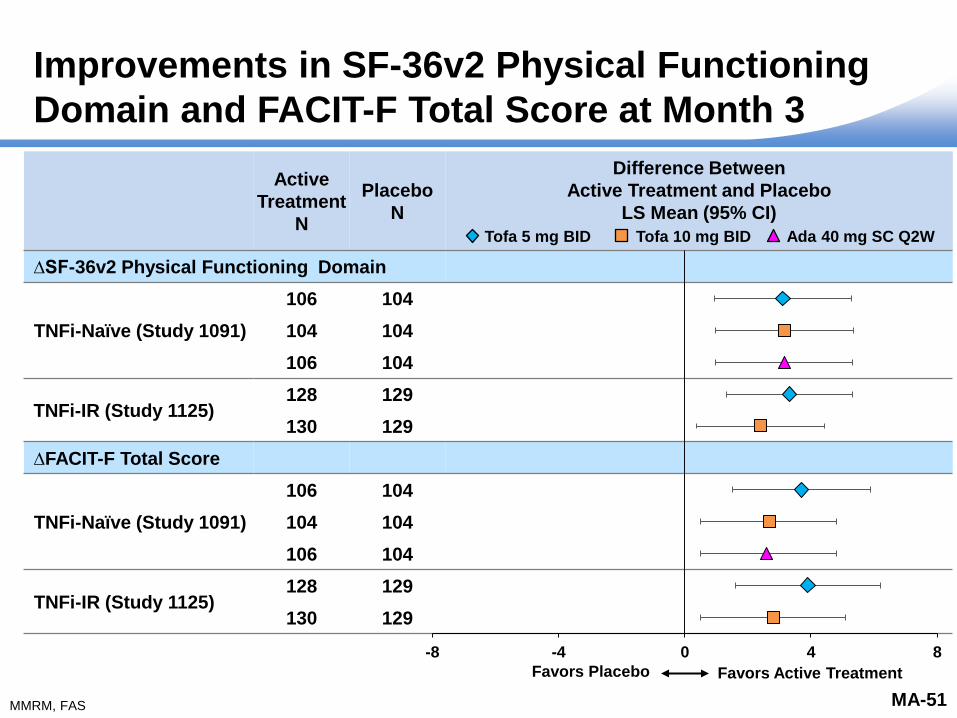
Improvements in SF-36v2 Physical Functioning
Domain and FACIT-F Total Score at Month 3
Active
Treatment
N
Placebo
N
Difference Between
Active Treatment and Placebo
LS Mean (95% CI)
∆SF-36v2 Physical Functioning Domain
TNFi-Naïve (Study 1091)
106 104
104 104
106 104
TNFi-IR (Study 1125) 128 129
130 129
∆FACIT-F Total Score
TNFi-Naïve (Study 1091)
106 104
104 104
106 104
TNFi-IR (Study 1125) 128 129
130 129
MA-51
-8 -4 0 4 8
We have been asked to create a new slide that is a forest plot for the Efficacy main deck. We will need before Wednesday’s Mock presentation. What we are looking for are forest plots: 1. For the endpoints of SF-36 Physical Function and FACIT-F Total Score 2. For the studies A3921091 and A3921125 3. For the doses of tofacitinib 5 mg BID and 10 mg BID (and in study A3921091, adalimumab) These should all be put on the same slide. Please let me know if you have any questions. I have attached the necessary tables.
Favors Placebo Favors Active Treatment
Author: Betsy Kudlacz
Source: Tables
14.2.2.19.3.1,
14.2.2.21.3.1,
14.2.2.18.3.1,
14.2.2.20.3.1
Active
Treatment
N
Placebo
N
Difference Between
Active Treatment and Placebo
LS Mean (95% CI)
SF-36v2 Physical Function
TNFi-IR (Study 1125) 128 129
130 129
TNFi Naïve (Study 1091)
106 104
104 104
106 104
FACIT-F Total Score
TNFi-IR (Study 1125) 128 129
130 129
TNFi Naïve (Study 1091)
106 104
104 104
106 104
Tofa 10 mg BID Tofa 5 mg BID Ada 40 mg SC Q2W
MMRM, FAS
Reviewed Ready for QC In QC
31 July
2017 QC Complete
01 Aug 2017

Tofacitinib 5 mg BID Demonstrated Efficacy Across PsA
Disease Manifestations in Both TNFi-Naïve and TNFi-IR
Patient Populations
MA-52
Peripheral Arthritis
Dactylitis
Enthesitis
Psoriasis
ACR 20/50/70 response rates
∆HAQ-DI
Maintenance of structural integrity
∆Leeds Enthesitis Index score (LEI)
Psoriasis Area and Severity Index (PASI)75 response rate
∆Dactylitis Severity Score
Efficacy in improving patient reported outcomes including physical functioning
and fatigue
Author:
Source: Reviewed Ready for QC In QC
31 July
2017 QC Complete
01 Aug 2017

Overview of Presentation
Author: Nancy McKay
Source:
MA-53
Topic Presenter
Introduction Nancy McKay Director, Regulatory Affairs
Pfizer Inc
Psoriatic Arthritis:
A Rheumatologist’s Perspective/
Unmet Medical Need
Philip Mease, MD, MACR Director, Rheumatology Research, Swedish-Providence-St.
Joseph’s Health Systems
Clinical Professor, University of Washington School of Medicine,
Seattle, WA
Tofacitinib PsA Development
Program and Efficacy
Keith Kanik, MD, FACR Senior Director, Global Clinical Lead PsA
Inflammation and Immunology
Pfizer Inc
Tofacitinib PsA Safety
Daniela Graham, MD Clinician, PsA Development Program
Inflammation and Immunology
Pfizer Inc
Risk Management Thomas Jones, MD Senior Director, Safety Risk Management
Pfizer Inc
Benefit:Risk and Conclusions
Michael Corbo, PhD Senior VP, Chief Development Officer
Inflammation and Immunology
Pfizer Inc
Reviewed Ready for QC In QC
26 July
2017
QC Complete
30 July 2017

Tofacitinib PsA Safety
Daniela Graham, MD
Clinician, PsA Development Program
Inflammation and Immunology
Pfizer Inc
MA-54
Author: Daniela Graham
Source: SME, see author Reviewed Ready for QC In QC
Date
26JUL2017
QC Complete
01 Aug 2017

Robust Database of Patients Studied in PsA
783 770 746
665
437
222
44 5
0
100
200
300
400
500
600
700
800
900
At least 1dose
≥1 ≥3 ≥6 ≥12 ≥18 ≥24 ≥30
Pa
tie
nts
783 Patients
775 Patient-Years
Months
MA-55
PsA N=783
PY=775
Author: Daniela Graham
Source: SCS PsA Table 2, 7
and 10
Reviewed Ready for QC In QC
Date
28JUL17 QC Complete
01 Aug 2017

Tofacitinib Clinical Trial Patient-Years of Exposure
PsA
RA
PsO
More than
80,000 PY exposure
accrued in the
Post-marketing
setting
Author: Daniela Graham
Source: SCS PsA Table 2, 7
and 10
a. IMS Health Prescribing Insights Medical and extrapolated to the end of the reporting interval
(estimated region breakdown based on Pfizer internal sales data)
b. Based on audited unit sales (SUs) of tofacitinib from IMS Health’s MIDAS Database.
- Make the pie chart a pyramid, base should be
RA, then PsO and the top is PsA
- Add text box at the bottom with the total
exposure (PsA+RA+PsO highlighted in red) up
to 9 years
- Reduce the 2 bullets on the right side to 1 short
bullet “More than 80, 000 PY exposure accured
in the Post-marketing setting”
- Turn back to black any text un red
- -On the table:add a column with the total
before the PsA column.
PsA N=783
PY=775
PsO N=3662
PY=8537
RA N=6300
PY=21,886
More than 80,000 PY
exposure accrued in the
post-marketing setting
MA-56
Total N=10,745
PY=31,199
Reviewed Ready for QC In QC
Date
28JUL17 QC Complete
01 Aug 2017

a. The investigator had the option to increase the dose to tofacitinib 10 mg BID in those subjects who were receiving tofacitinib 5 mg BID and,
in the investigator’s opinion, had PsA symptoms that are not adequately controlled. Changes in the dose were only permitted at scheduled study
visits, unless a reduction to tofacitinib 5 mg BID was required due to safety abnormalities
PsA Program Structure
Author: Daniela Graham
Source: Source: SCS
Figures 1 & 2
MA-57
Reviewed
TNFi-Naïve
(Study 1091)
TNFi-IR
(Study 1125)
LTE (Study 1092)
Months 0-3 Months 3-12
Months 3-6 0-3 Years
Placebo Tofa 5 mg BIDa LTE
Placebo Tofa 5 mg BID Tofa 5 mg BIDa LTE
Tofa 10 mg BID Tofa 10 mg BID
Tofa 5 mg BID Tofa 5 mg BID
Ada 40 mg SC Q2W Ada 40 mg SC Q2W
Tofa 5 mg BID Tofa 5 mg BID
Tofa 10 mg BID
Placebo
Placebo
Tofa 10 mg BID
Tofa 5 mg BID
Tofa 5 mg BIDa LTE
Tofa 5 mg BIDa LTE
Tofa 5 mg BIDa LTE
Tofa 5 mg BIDa LTE
Tofa 10 mg BID
Tofa 5 mg BIDa LTE
Tofa 5 mg BIDa LTE
Tofa 5 mg BIDa LTE
Tofa 10 mg BID
Ready for QC In QC
Date
28JUL17 QC Complete
01 Aug 2017

3 Month Placebo-Controlled
PsA Program Structure
Author: Daniela Graham
Source: Source: SCS
Figures 1 & 2
MA-58
Reviewed
Months 0-3 Months 3-12
Months 3-6 0-3 Years
Placebo Tofa 5 mg BIDa LTE
Placebo Tofa 5 mg BID Tofa 5 mg BIDa LTE
Tofa 10 mg BID Tofa 10 mg BID
Tofa 5 mg BID Tofa 5 mg BID
Ada 40 mg SC Q2W Ada 40 mg SC Q2W
Tofa 5 mg BID Tofa 5 mg BID
Tofa 10 mg BID
Placebo
Placebo
Tofa 10 mg BID
Tofa 5 mg BID
Tofa 5 mg BIDa LTE
Tofa 5 mg BIDa LTE
Tofa 5 mg BIDa LTE
Tofa 5 mg BIDa LTE
Tofa 10 mg BID
Tofa 5 mg BIDa LTE
Tofa 5 mg BIDa LTE
Tofa 5 mg BIDa LTE
Tofa 10 mg BID
a. The investigator had the option to increase the dose to tofacitinib 10 mg BID in those subjects who were receiving tofacitinib 5 mg BID and,
in the investigator’s opinion, had PsA symptoms that are not adequately controlled. Changes in the dose were only permitted at scheduled study
visits, unless a reduction to tofacitinib 5 mg BID was required due to safety abnormalities
TNFi-Naïve
(Study 1091)
TNFi-IR
(Study 1125)
LTE (Study 1092)
Ready for QC In QC
Date
28JUL17 QC Complete
01 Aug 2017

Up to 12 Month Dose Comparison
PsA Program Structure
Author: Daniela Graham
Source: Source: SCS
Figures 1 & 2
MA-59
Reviewed
Months 0-3 Months 3-12
Months 3-6 0-3 Years
Placebo Tofa 5 mg BIDa LTE
Placebo Tofa 5 mg BID Tofa 5 mg BIDa LTE
Tofa 10 mg BID Tofa 10 mg BID
Tofa 5 mg BID Tofa 5 mg BID
Ada 40 mg SC Q2W Ada 40 mg SC Q2W
Tofa 5 mg BID Tofa 5 mg BID
Tofa 10 mg BID
Placebo
Placebo
Tofa 10 mg BID
Tofa 5 mg BID
Tofa 5 mg BIDa LTE
Tofa 5 mg BIDa LTE
Tofa 5 mg BIDa LTE
Tofa 5 mg BIDa LTE
Tofa 10 mg BID
Tofa 5 mg BIDa LTE
Tofa 5 mg BIDa LTE
Tofa 5 mg BIDa LTE
Tofa 10 mg BID
a. The investigator had the option to increase the dose to tofacitinib 10 mg BID in those subjects who were receiving tofacitinib 5 mg BID and,
in the investigator’s opinion, had PsA symptoms that are not adequately controlled. Changes in the dose were only permitted at scheduled study
visits, unless a reduction to tofacitinib 5 mg BID was required due to safety abnormalities
TNFi-Naïve
(Study 1091)
TNFi-IR
(Study 1125)
LTE (Study 1092)
Ready for QC In QC
Date
28JUL17 QC Complete
01 Aug 2017

PsA Program Structure
Author: Daniela Graham
Source: Source: SCS
Figures 1 & 2
MA-60
Reviewed
All PsA
Months 0-3 Months 3-12
Months 3-6 0-3 Years
Placebo Tofa 5 mg BIDa LTE
Placebo Tofa 5 mg BID Tofa 5 mg BIDa LTE
Tofa 10 mg BID Tofa 10 mg BID
Tofa 5 mg BID Tofa 5 mg BID
Ada 40 mg SC Q2W Ada 40 mg SC Q2W
Tofa 5 mg BID Tofa 5 mg BID
Tofa 10 mg BID
Placebo
Placebo
Tofa 10 mg BID
Tofa 5 mg BID
Tofa 5 mg BIDa LTE
Tofa 5 mg BIDa LTE
Tofa 5 mg BIDa LTE
Tofa 5 mg BIDa LTE
Tofa 10 mg BID
Tofa 5 mg BIDa LTE
Tofa 5 mg BIDa LTE
Tofa 5 mg BIDa LTE
Tofa 10 mg BID
a. The investigator had the option to increase the dose to tofacitinib 10 mg BID in those subjects who were receiving tofacitinib 5 mg BID and,
in the investigator’s opinion, had PsA symptoms that are not adequately controlled. Changes in the dose were only permitted at scheduled study
visits, unless a reduction to tofacitinib 5 mg BID was required due to safety abnormalities
TNFi-Naïve
(Study 1091)
TNFi-IR
(Study 1125)
LTE (Study 1092)
Ready for QC In QC
Date
28JUL17 QC Complete
01 Aug 2017
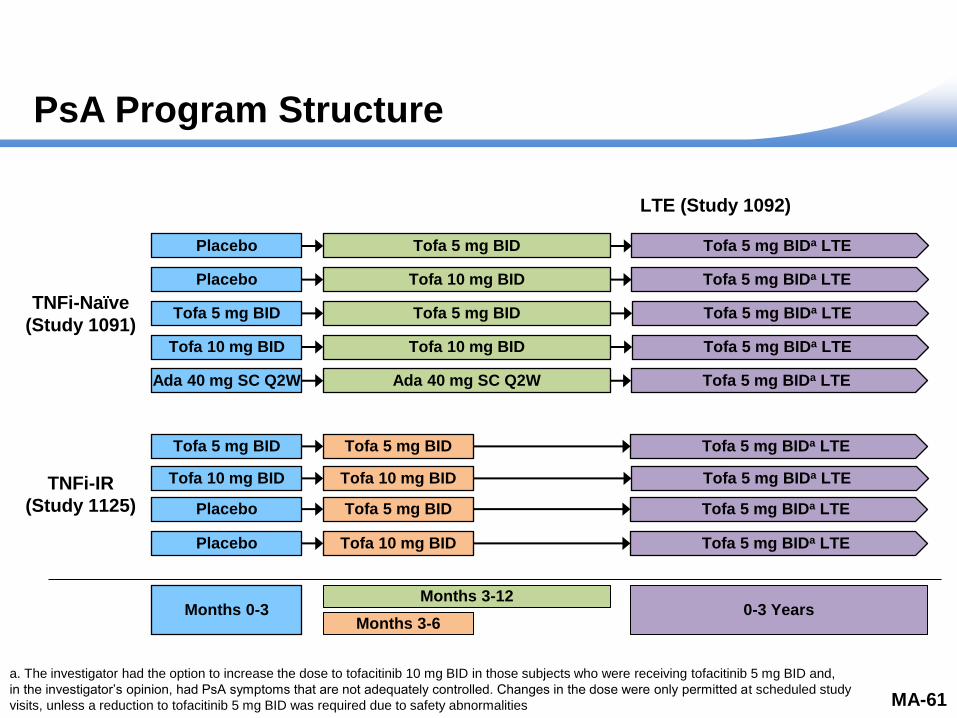
PsA Program Structure
Author: Daniela Graham
Source: Source: SCS
Figures 1 & 2
MA-61
Reviewed
Months 0-3 Months 3-12
Months 3-6 0-3 Years
Placebo Tofa 5 mg BIDa LTE
Placebo Tofa 5 mg BID Tofa 5 mg BIDa LTE
Tofa 10 mg BID Tofa 10 mg BID
Tofa 5 mg BID Tofa 5 mg BID
Ada 40 mg SC Q2W Ada 40 mg SC Q2W
Tofa 5 mg BID Tofa 5 mg BID
Tofa 10 mg BID
Placebo
Placebo
Tofa 10 mg BID
Tofa 5 mg BID
Tofa 5 mg BIDa LTE
Tofa 5 mg BIDa LTE
Tofa 5 mg BIDa LTE
Tofa 5 mg BIDa LTE
Tofa 10 mg BID
Tofa 5 mg BIDa LTE
Tofa 5 mg BIDa LTE
Tofa 5 mg BIDa LTE
Tofa 10 mg BID
a. The investigator had the option to increase the dose to tofacitinib 10 mg BID in those subjects who were receiving tofacitinib 5 mg BID and,
in the investigator’s opinion, had PsA symptoms that are not adequately controlled. Changes in the dose were only permitted at scheduled study
visits, unless a reduction to tofacitinib 5 mg BID was required due to safety abnormalities
TNFi-Naïve
(Study 1091)
TNFi-IR
(Study 1125)
LTE (Study 1092)
Ready for QC In QC
Date
28JUL17 QC Complete
01 Aug 2017

Discontinuations During the 3 Month
Placebo-Controlled Period
(Pooled Data)
Placebo
N=236
n (%)
Tofa
5 mg BID
N=238
n (%)
Tofa
10 mg BID
N=236
n (%)
Ada 40 mg SC Q2W
(Study 1091 Only)
N=106
n (%)
Discontinuations
(any reason) 20 (8.5) 11 (4.6) 11 (4.7) 4 (3.8)
Subjects died 0 0 0 0
Adverse event 6 (2.5) 5 (2.1) 4 (1.7) 2 (1.9)
Insufficient clinical
response 4 (1.7) 1 (0.4) 2 (0.8) 0
Subject no longer willing
to participate in study 6 (2.5) 2 (0.8) 2 (0.8) 1 (0.9)
Other 4 (1.7) 3 (1.3) 3 (1.3) 1 (0.9)
MA-62
Related to Study Drug 1 (0.4) 4 (1.7) 1 (0.9) 4 (1.7) 18 (2.6)
Not Related to Study Drug 4 (1.7) 0 1 (0.9) 2 (0.8) 10 (1.4)
Should this be
(All PsA, Pooled Data)
Author: Daniela Graham
Source: Table 11
Not All PsA, only
Pooled Data
Reviewed Ready for QC In QC
Date
28JUL17 QC Complete
01 Aug 2017

Discontinuations During the 3 Month
Placebo-Controlled Period
(Pooled Data)
Placebo
N=236
n (%)
Tofa
5 mg BID
N=238
n (%)
Tofa
10 mg BID
N=236
n (%)
Ada 40 mg SC Q2W
(Study 1091 Only)
N=106
n (%)
Discontinuations
(any reason) 20 (8.5) 11 (4.6) 11 (4.7) 4 (3.8)
Subjects died 0 0 0 0
Adverse event 6 (2.5) 5 (2.1) 4 (1.7) 2 (1.9)
Insufficient clinical
response 4 (1.7) 1 (0.4) 2 (0.8) 0
Subject no longer willing
to participate in study 6 (2.5) 2 (0.8) 2 (0.8) 1 (0.9)
Other 4 (1.7) 3 (1.3) 3 (1.3) 1 (0.9)
MA-63
Related to Study Drug 1 (0.4) 4 (1.7) 1 (0.9) 4 (1.7) 18 (2.6)
Not Related to Study Drug 4 (1.7) 0 1 (0.9) 2 (0.8) 10 (1.4)
Should this be
(All PsA, Pooled Data)
Author: Daniela Graham
Source: Table 11
Not All PsA, only
Pooled Data
Reviewed Ready for QC In QC
Date
28JUL17 QC Complete
01 Aug 2017

Discontinuations During the 3 Month
Placebo-Controlled Period
(Pooled Data)
Placebo
N=236
n (%)
Tofa
5 mg BID
N=238
n (%)
Tofa
10 mg BID
N=236
n (%)
Ada 40 mg SC Q2W
(Study 1091 Only)
N=106
n (%)
Discontinuations
(any reason) 20 (8.5) 11 (4.6) 11 (4.7) 4 (3.8)
Subjects died 0 0 0 0
Adverse event 6 (2.5) 5 (2.1) 4 (1.7) 2 (1.9)
Insufficient clinical
response 4 (1.7) 1 (0.4) 2 (0.8) 0
Subject no longer willing
to participate in study 6 (2.5) 2 (0.8) 2 (0.8) 1 (0.9)
Other 4 (1.7) 3 (1.3) 3 (1.3) 1 (0.9)
MA-64
Related to Study Drug 1 (0.4) 4 (1.7) 1 (0.9) 4 (1.7) 18 (2.6)
Not Related to Study Drug 4 (1.7) 0 1 (0.9) 2 (0.8) 10 (1.4)
Should this be
(All PsA, Pooled Data)
Author: Daniela Graham
Source: Table 11
Not All PsA, only
Pooled Data
Reviewed Ready for QC In QC
Date
28JUL17 QC Complete
01 Aug 2017

Summary of Adverse Events in the 3 Month
Placebo-Controlled Period
(Pooled Data)
40.3
1.7
47.9
1.7
49.6
1.7
46.2
0.9 0
10
20
30
40
50
60
70
80
90
100
Adverse Events Serious Adverse Events
Pe
rce
nt
of
Pa
tie
nts
PlaceboN=236
Tofa 5 mg BIDN=238
Tofa 10 mg BIDN=236
Ada 40 mg SC Q2WN=106
MA-65
Most frequent AEs
– Nasopharyngitis
– Upper respiratory tract
infections
– Headache
Most frequent SAEs
were infections
Author: Daniela Graham
Source: SCS Table C1.1.1.1;
Should this be
(All PsA, Pooled Data)
Reviewed
AE=Adverse Event; SAE=Serious Adverse Event
Ready for QC In QC
Date
28JUL17 QC Complete
01 Aug 2017

7.57 8.81
7.76
5.73
10.06
0
5
10
15
20
25
All Tofa
5 mg BID
All Tofa
10 mg BID
All Tofa
5 mg BID
All Tofa
10 mg BID
Ada
40 mg SC Q2W
N 347 344 159 154 106
n 15 15 11 7 9
PY of
Exposure 198.1 193.4 124.8 122.2 89.5
- Add a graph
instead of table
- Small table at
the bottom with
the numbers
and other
details
Author: Daniela Graham
Source: SCS Table 25
C2a.10.1.2.3
Treatment Group N PY n (%) IR (95% CI) Treatment
Comparison HR (95% CI)
Cohort 2a
Tofa 5 mg BID 238 151.44 12 (5.0) 7.92
(4.09, 13.84) 10 mg vs 5 mg 1.03 (0.46, 2.30)
Tofa 10 mg BID 236 147.98 12 (5.1) 8.11
(4.19, 14.17) - -
A3921091 Alone (12 month data)
Tofa 5 mg BID 107 91.72 8 (7.5) 8.72
(3.77, 17.19)
5 mg vs
adalimumab 0.86 (0.33, 2.44)
Tofa 10 mg BID 104 90.56 4 (3.8) 4.42
(1.20, 11.31)
10 mg vs
adalimumab 0.45 (0.14, 1.46)
Adalimumab 106 89.48 9 (8.5) 10.06
(4.60, 19.09)
14.77
7.92 8.72
14.85
8.11
4.42
10.06
0
5
10
15
20
25
30
35
Cohort 1 Study 1091 Alone
(12 month data)
Inc
ide
nc
e R
ate
/10
0 P
Y (
95
% C
I)
N 238 236 107 104 106
n 12 12 8 4 9
PY of
Exposure 151.44 147.98 91.72 90.56 89.48
Tofacitinib
5 mg BID
Tofacitinib
10 mg BID
Tofacitinib
5 mg BID
Tofacitinib
10 mg BID
Adalimumab
40 mg SC
Tofacitinib
5 mg BID
Tofacitinib
10 mg BID
Cohort 2a
Incidence Rate of SAEs Similar Between
Tofacitinib Doses and Adalimumab
MA-66
Up to 12 Month
Dose Comparison
(Pooled Data)
TNFi-Naïve (Study 1091)
(12 Month Data)
Inc
ide
nc
e R
ate
/10
0 P
Y (
95
% C
I)
- GENERAL COMMENT
FOR ALL SLIDES
USING C2a: For the 2
tofacitinib IR on the left,
use the arm “All tofa 5”
and “All tofa 10” instead
of tofa 5 and tofa 10.
The same source table
has all the treatment
arms just need to choos
the one that says all tofa
5/10
Should this the “up to
12” be
(All PsA, Pooled Data)
Not All PsA, only
Pooled Data
Reviewed Ready for QC In QC
Date
28JUL17
In RE-QC
01 Aug
2017
QC Complete
01 Aug 2017
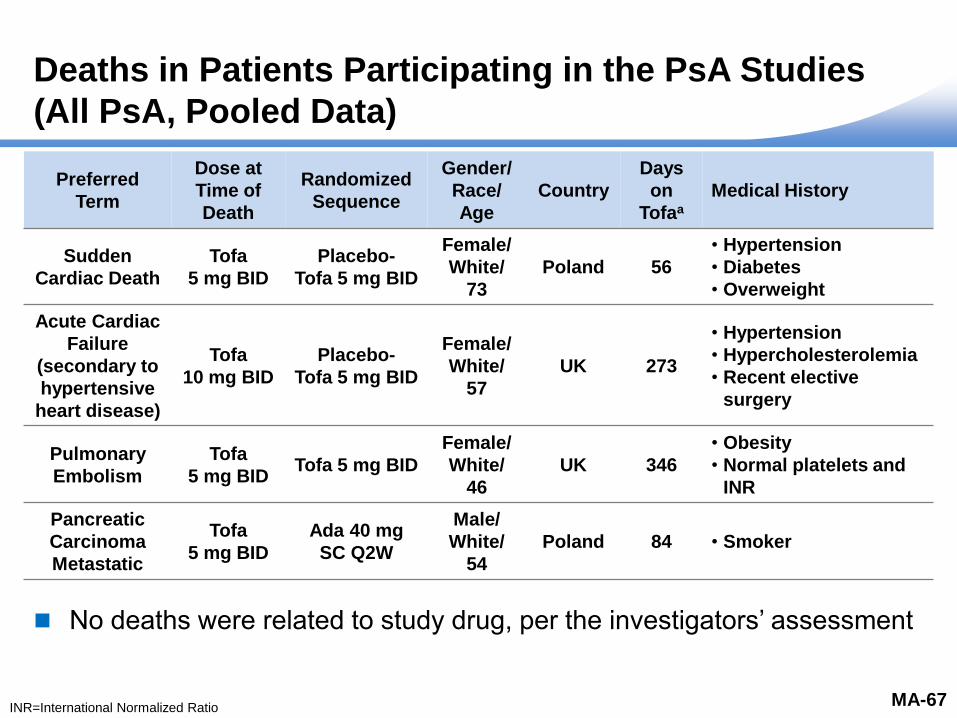
Deaths in Patients Participating in the PsA Studies
(All PsA, Pooled Data)
Preferred
Term
Dose at
Time of
Death
Randomized
Sequence
Gender/
Race/
Age
Country
Days
on
Tofaa
Medical History
Sudden
Cardiac Death
Tofa
5 mg BID
Placebo-
Tofa 5 mg BID
Female/
White/
73
Poland 56
• Hypertension
• Diabetes
• Overweight
Acute Cardiac
Failure
(secondary to
hypertensive
heart disease)
Tofa
10 mg BID
Placebo-
Tofa 5 mg BID
Female/
White/
57
UK 273
• Hypertension
• Hypercholesterolemia
• Recent elective
surgery
Pulmonary
Embolism
Tofa
5 mg BID Tofa 5 mg BID
Female/
White/
46
UK 346
• Obesity
• Normal platelets and
INR
Pancreatic
Carcinoma
Metastatic
Tofa
5 mg BID
Ada 40 mg
SC Q2W
Male/
White/
54
Poland 84 • Smoker
MA-67
No deaths were related to study drug, per the investigators’ assessment
Author: Daniela Graham
Source: Reviewed
INR=International Normalized Ratio
Ready for QC In QC
Date
28JUL17 QC Complete
01 Aug 2017

Adverse Events of Special Interest
Serious Infections
Herpes Zoster
Opportunistic Infections
Major Adverse Cardiovascular Events
MA-68
Malignancies
Gastrointestinal (GI) Perforations
Hepatic Events
Interstitial Lung Disease
Author: Daniela Graham
Source: SME, see author Reviewed Ready for QC In QC
Date
26JUL2017
QC Complete
Date 28JUL17

External Comparison Cohort For Risk Contextualization:
Truven MarketScan Claims Database
Observational database comprised of US medical claims
Cohort of PsA patients in a real-world clinical setting
– Defined as ≥1 inpatient or ≥2 outpatient diagnosis codes of PsA
– Moderate-severe disease
– Exclusion criteria from the tofacitinib global Phase 3 PsA studies
applied
– Included 5799 patients
Comparison with Phase 3 trial data should be made with
consideration of the differences between the two distinct
data sources
MA-69
Author: Daniela Graham
Source: Reviewed Ready for QC In QC
Date
26JUL17 QC Complete
30 July 2017

All Tofa
5 mg BID
All Tofa
10 mg BID
All Tofa
5 mg BID
All Tofa
10 mg BID
Ada
40 mg SC Q2W
N 347 344 159 154 106
n 4 3 2 1 1
PY of
Exposure 200.7 196.5 127.1 124.3 92.6
1.99 1.57
1.53
0.80 1.08
0
1
2
3
4
5
6
7
Serious Infections and Incidence Rate Similar
to Adalimumab
Serious infections were pneumonia, oral candidiasis, influenza, pyelonephritis, parotitis,
herpes simplex/pyoderma streptococcal
All resolved after treatment
Author: Daniela Graham
Source: SCS Table 34
Inc
ide
nc
e R
ate
/10
0 P
Y (
95
% C
I)
Demographics Day of
Event
Day of
Last Dose Treatment Group Preferred Term Outcome
Female/27/white/Russian Fed 166 172 Tofacitinib 5 mg BID Pneumonia Resolved
Female/33/white/United States 135 135 Tofacitinib 5 mg BID Oral Candidiasis Resolved
Female/50/white/United States 132 336 Tofacitinib 10 mg BID Influenza Resolved
Male/46/white/United Kingdom 10 12 Tofacitinib 10 mg BID Pyelonephritis Resolved
Female/50/white/Germany 69 87 Tofacitinib 10 mg BID Parotitis Resolved
Female/54/white/
Russian Federation 170 168
Adalimumab 40 mg
SC q 2 weeks
Herpes simplex/
pyoderma streptococcal Resolved
-Use all tofa
5 and all
tofa 10
MA-70
Should this the “up to
12” be
(All PsA, Pooled Data)
Reviewed
Up to 12 Month
Dose Comparison
(Pooled Data)
TNFi-Naïve (Study 1091)
(12 Month Data)
Ready for QC In QC
Date
28JUL17
QC Complete
Date 28JUL17 In RE-QC
01 Aug
2017
QC Complete
01 Aug 2017

1.37
2.77
1.30
2.24
0.0
1.0
2.0
3.0
4.0
5.01.30
2.65
1.68 2.00
2.67 2.57
0
1
2
3
4
5
6
7
8
Serious Infections Incidence Rate in PsA
Similar to Other Tofacitinib RCT Programs
MA-71
Psoriasis
Up to 12 Months
Rheumatoid Arthritis
Up to 24 Months
Psoriatic Arthritis
Up to 12 Months
Author: Daniela Graham
Source: Table C2.1.1.1.2
Psoriasis Data
777.s18.1 for RA
MAA Resubmission Table
167 and 168 (Data as of
APR 2014), RA Data Table
1182.8.1 P3ALL
Data as of 10MAY2016)
Truven: Tofa PSA Truven
Standing Cohort Final Report
– Table 4 V3
Inc
ide
nc
e R
ate
/10
0 P
Y (
95
% C
I)
N 1217 1219 1589 1611 238 236
n 11 21 48 47 2 3
PY of
Exposure 800.5 867.2 1733.8 1797.5 154.1 150.4
Tofacitinib
5 mg BID
Tofacitinib
10 mg BID
Tofacitinib
5 mg BID
Tofacitinib
10 mg BID
Tofacitinib
5 mg BID
Tofacitinib
10 mg BID
Inc
ide
nc
e R
ate
/10
0 P
Y (
95
% C
I)
Psoriasis
(Up to 12 Months)
Tofa 5 mg BID
Rheumatoid Arthritis
(Up to 24 Months)
Tofa 5 mg BID
Psoriatic Arthritis
(Up to 12 Months)
Tofa 5 mg BID
PsA
Truvena
Any bDMARDs
N 1217 1589 238 5075
n 11 48 2 58
PY of
Exposure 800.8 1733.8 154.1 2589.5
a. Hospitalizations only
RCT=Randomized Controlled Trial
Reviewed Ready for QC In QC
Date
28JUL17
QC Complete
Date 28JUL17

1.50 1.59 2.04
1.61
0.00 0
1
2
3
4
5
6
7
Herpes Zoster Incidence Rate Similar Between
Tofacitinib Doses
MA-72
Author: Daniela Graham
Source: SCS Table C2.2.1.1; C2a 2.1.1 ; C2 IRs for 5
BID and 10 BID were 2.53 (0.52, 7.39) and 1.71 (0.21,
6.19) and in A3921091 only, 2.16 (0.26, 7.79), 2.17
(0.26, 7.85)
C2a.2.1.1
-Use all tofa
5 and all
tofa 10
Should this the “up to
12” be
(All PsA, Pooled Data)
Reviewed
Not All PsA, only
Pooled Data
All Tofa
5 mg BID
All Tofa
10 mg BID
All Tofa
5 mg BID
All Tofa
10 mg BID
Ada
40 mg SC Q2W
N 347 344 159 154 106
n 3 4 2 2 0
PY of
Exposure 199.6 196.4 126.0 124.5 92.6
Inc
ide
nc
e R
ate
/10
0 P
Y (
95
% C
I)
One case was a multidermatomal HZ and was considered an
opportunistic infection
Up to 12 Month
Dose Comparison
(Pooled Data)
TNFi-Naïve (Study 1091)
(12 Month Data)
Ready for QC In QC
Date
28JUL17
QC Complete
Date 28JUL17
HZ=Herpes Zoster
In RE-QC
01 Aug
2017
QC Complete
01 Aug 2017

1.00
3.35
1.96
1.26
0.0
1.0
2.0
3.0
4.0
5.0
6.0
7.0
Inc
ide
nc
e R
ate
/10
0 P
Y (
95
% C
I)
Tofacitinib 5 mg BID Tofacitinib 10 mg BID
Author: Daniela Graham
Source: Table 2.1.1.2, 777.s18.17,
C2a.2.1.1
Truven: Tofa PSA Truven Standing Cohort Final
Report – Table 9
Psoriasis
(First Year Experience) Rheumatoid Arthritis
P3 ALL
Psoriatic Arthritis
Cohort 2
N 1217 1219 1589 1611 238 236
n 8 20 57 72 3 4
PY of
Exposure 800.8 868.9 1702.7 1750.9 152.7 150.3
Tofacitinib
5 mg BID
Tofacitinib
10 mg BID
Tofacitinib
5 mg BID
Tofacitinib
10 mg BID
Tofacitinib
5 mg BID
Tofacitinib
10 mg BID
1.00
3.27
1.96 2.32
4.02
2.66
0
1
2
3
4
5
6
7
8
Inc
ide
nc
e R
ate
/10
0 P
Y (
95
% C
I)
Herpes Zoster Incidence Rate in PsA Similar to
Those in Other Tofacitinib RCT Programs
MA-73
Reviewed In
cid
en
ce R
ate
/10
0 P
Y (
95
% C
I)
Psoriasis
(Up to 12 Months)
Tofa 5 mg BID
Rheumatoid Arthritis
(Up to 24 Months)
Tofa 5 mg BID
Psoriatic Arthritis
(Up to 12 Months)
Tofa 5 mg BID
PsA
Truven
Any bDMARDs
N 1217 1589 238 5075
n 8 57 3 42
PY of
Exposure 800.8 1702.7 152.7 3343.0
Ready for QC In QC
Date
28JUL17
QC Complete
Date 28JUL17

Incidence of Major Adverse Cardiovascular Events
(All PsA, Pooled Data)
Major Adverse Cardiovascular Events (MACE)
– MACE is a composite CV endpoint comprised of cardiovascular
deaths and non-fatal CV events of myocardial infarction and
cerebrovascular events
3 cases of MACE
– Sudden cardiac death
– Non-fatal MI
– Non-fatal ischemic stroke
Author: Daniela Graham
Source: SCS Table C3.2.5.1, C3.2.5.1.C;
Treatment Group N n (%) PY IR (95% CI)
All Tofacitinib 783 3 (0.4) 790.5 0.38 (0.08, 1.11)
MA-74
Reviewed
CV=Cardiovascular; MI=Myocardial Infarction
Ready for QC In QC
Date
28JUL17
QC Complete
Date 28JUL17

0.24
0.38 0.38
0.0
0.2
0.4
0.6
0.8
1.0
1.2
MACE Incidence Rate in PsA is Similar to Other
Tofacitinib Long Term Study Data
MA-75
Incid
en
ce R
ate
/100 P
Y
(95
% C
I)
Author: Daniela Graham
Source: Table C3.2.5.1 for PsA
SCS for RA MAA Resubmission Table
167
Truven: Tofa PSA Truven Standing Cohort
Final Report – Table 21
N 3662 5856 783
n 21 80 3
PY of
Exposure 8759.3 21,285.9 790.5
Psoriasis
All PsO
Rheumatoid Arthritis
All RA
Psoriatic Arthritis
All PsA
Use a different
color for the IR
from C3 (slides
16,18 and 20
- Add the truven
estiamte point
Reviewed
Psoriasis
(All PsO)
All Tofa Doses
Rheumatoid Arthritis
(All RA)
All Tofa Doses
Psoriatic Arthritis
(All PsA)
All Tofa Doses
Truven
Any bDMARDs
(PsA)
N 3662 5856 783 5057
n 21 80 3 17
PY of
Exposure 8759.3 21,285.9 790.5 4467.8
Inc
ide
nc
e R
ate
/10
0 P
Y (
95
% C
I)
0.24
0.38 0.38 0.38
0.0
0.2
0.4
0.6
0.8
1.0
1.2
Ready for QC In QC
Date
28JUL17
QC Complete
01 Aug 2017

0.0
0.5
1.0
1.5
2.0
2.5
3.0
Inc
ide
nc
e R
ate
(9
5%
CI)
Incidence Rates for MACE Risk Over Time
(All PsA and PsO Pooled, and RA)
Months
0-6 6-12 12-18 18-24 24-30 30-36 36-42 42-48 48-54 54-60
b c a
60-66 66-72 72-78 >78
a. Upper CI=7.42; b. Upper CI=114.18; c. Upper CI=769.92
design based on SA-128
SA-137
Author: Daniela Graham
Source: PsA SCS Table
C3.2.5.13, RA SCS Table
1182.5.19, PsO SCS Table
198.3.1.6
MA-76
All RA Pooled All PsA Pooled All PsO Pooled
Confidence intervals for PsA data are not shown
Reviewed Ready for QC In QC
Date
28JUL17
QC Complete
28 Jul 2017

Malignancies Excluding NMSC
(All PsA, Pooled Data)
Malignancy Type
Randomization Sequence
LTE Dose at Time of Onset
Gender/ Race/ Agea
Country Days on
Tofacitinib Comments
Urothelial carcinoma
Tofa 5 mg BID
No Tofa
5 mg BID
Male/ White/
58 Poland 48
Hematuria at baseline
Renal cell carcinoma
Ada 40 mg SC
Q2W Yes
Tofa 5 mg BID
Male/ Other/
44 Mexico 32 Smoker
Pancreatic duct adenocarcinoma
metastatic
Ada 40 mg SC
Q2W Yes
Tofa 5 mg BID
Male/ White/
52 Poland 84 Smoker
Squamous cell carcinoma of
the vulva
Tofa 5 mg BID
No Tofa
5 mg BID
Female/White/
65 Mexico 65
Abnormal urinalysis since
Study Day 11
Breast ductal carcinoma
Tofa 5 mg BID
No Tofa
5 mg BID
Female/White/
67 USA 244
Postmenopausal, Biopsy: ER (+),
PgR (+), HER2 (-), Stage II
MA-77
Author: Daniela Graham
Source: Source: SCS Table C3.2.2.1
Briefing document pf 87, table 28
- Move the
table to a
backup slide
- Add a list of
the Prefered
terms
Treatment Group N n (%) PY IR (95% CI)
All Tofacitinib 783 5 (0.6) 790.5 0.63 (0.21, 1.48)
Malignancy Type Days on Tofacitinib at Diagnosis
Urothelial carcinoma 48
Renal cell carcinoma 43
Squamous cell carcinoma of the vulva 66
Pancreatic duct adenocarcinoma metastatic 91
Breast ductal carcinoma 244
Reviewed Ready for QC
a. Age at screening
ER=Estrogen Receptors; HER2=Human Epidermal growth factor Receptor 2; NMSC=Non-Melanoma Skin Cancer; PgR=Progesterone Receptor
In QC
Date
28JUL17
QC Complete
01 Aug 2017

1.00
0.75
0.63
0.51
0.0
0.2
0.4
0.6
0.8
1.0
1.2
1.4
1.6
Malignancies (Excl. NMSC) Incidence Rate in PsA within
Range of Those Reported in Other Tofacitinib Long Term
Study Data
MA-78
Inc
ide
nc
e R
ate
/10
0 P
Y
(95
% C
I) 1.00
0.75
0.63
0.0
0.2
0.4
0.6
0.8
1.0
1.2
1.4
1.6
N 3623 6300 783
n 52 160 5
PY of
Exposure 5203.6 22,353.7 709.5
Author: Daniela Graham
Source: Table C3.2.2.1 for PsA
2.1.2.1.3 for Psoriasis
1182.2.6 for RA
Truven: Tofa PSA Truven Standing Cohort Final
Report – Table 13 QC Ready Source on bottom.
http://gdms.pfizer.com/gdms/drl/objectId/090177e189
9abc44 for PsO data. For RA. Use P123LTE Data as
of May 2016
source is the briefing document pg 90 figure 9
Psoriasis
(All PsO)
All Tofa Doses
Rheumatoid
Arthritis (P123LTE)
All Tofa Doses
Psoriatic
Arthritis (Cohort 3)
All Tofa Doses
Use a different
color for the IR
from C3 (slides
16,18 and 20
- Add the truven
estiamte point
Reviewed
Psoriasis
(All PsO)
All Tofa Doses
Rheumatoid Arthritis
(All RA)
All Tofa Doses
Psoriatic Arthritis
(All PsA)
All Tofa Doses
Truven
Any bDMARDs
(PsA)
N 3623 6300 783 5075
n 52 168 5 28
PY of
Exposure 5203.6 22,353.7 790.5 5499.1
Inc
ide
nc
e R
ate
/10
0 P
Y (
95
% C
I)
Ready for QC
Excl.=Excluding
In QC
Date
28JUL17
QC Complete
01 Aug 2017

0.0
0.5
1.0
1.5
2.0
2.5
3.0
Inc
ide
nc
e R
ate
(9
5%
CI)
Rate of Malignancies (Excl. NMSC) Over Time
(All PsA and PsO Pooled, and RA)
MA-79
Patients 6194 5306 4852 4450 4143 3681 3407 3030 2640 1999
Patients with
Events 18 15 23 19 17 19 12 16 14 20
Total pt-yrs of
Exposure for
Event
2810.25 2497.05 2275.25 2118.81 1903.59 1738.69 1584.37 1397.02 1126.74 1933.01
Months
0-6 6-12 12-18 18-24 24-30 30-36 36-42 42-48 48-54 54-60
a. Upper CI=4.38; b. Upper CI=114.18; c. Upper CI=769.92
b c a
Author: Daniela Graham
Source: SCS Figure 15; Table
1.11.1.2.A
http://gdms.pfizer.com/gdms/d
rl/objectId/090177e186eab5bf
Table C3.2.2.11
0.6 0.6
1.0 0.9 0.9
1.1
0.8
1.1 1.2
1.0 1.18
0.4
0 0 0 0 0.0
0.5
1.0
1.5
2.0
2.5
3.0
3.5
4.0
Inc
ide
nc
e R
ate
(9
5%
CI)
0.64 0.60
1.01 0.90 0.89
1.09
0.76
1.15 1.24
1.04
0
1
2
3
0-6 6-12 12-18 18-24 24-30 30-36 36-42 42-48 48-54 >54
Inc
ide
nc
e R
ate
pe
r 1
00
pt-
yrs
(9
5%
CI)
Months
Rheumatoid Arthritis
Confidence intervals for PsA data are not shown
All RA Pooled All PsA Pooled All PsO Pooled
Reviewed Ready for QC In QC
Date
28JUL17
QC Complete
02 Aug 2017

Incidence of Non-Melanoma Skin Cancer
(All PsA, Pooled Data)
Author: Daniela Graham
Source: Change source to
PsA SCS pg 128 There were 4 reported NSMC cases; 2 of basal cell and 2 squamous cell carcinoma. IR is also in range of that reported in PsO and RA
Basal cell carcinoma (n=2)
Squamous cell carcinoma (n=2)
All cases occurred in sun exposed areas of fair skinned
individuals
Treatment Group N n (%) PY IR (95% CI)
All Tofacitinib 783 4 (0.5) 789.2 0.51 (0.14, 1.30)
MA-80
Reviewed Ready for QC In QC
Date
28JUL17
QC Complete
01 Aug 2017

0.59 0.55 0.51
1.40
0.0
0.2
0.4
0.6
0.8
1.0
1.2
1.4
1.6
1.8
2.0
NMSC Incidence Rate in PsA are within Range of Those
Reported in Other Programs
(All PsA, Pooled Data)
MA-81
Inc
ide
nc
e R
ate
/10
0 P
Y
(95
% C
I)
0.74
0.55 0.51
0.0
0.2
0.4
0.6
0.8
1.0
1.2
1.4
Author: Daniela Graham
Source: Table C3.2.2.1, Psoriasis Data SCS
for RA MAA Resubmission Table 169, RA
Data 1182.2.13 P123LTE
1182.5.13 for RA
C3.2.2.1 for PsA
Truven: Tofa PSA Truven Standing Cohort
Final Report – Table 19 V2
PsO: Document Name: Table 198.2.1.2
Proportion and Incidence Rates for
Malignancies - Phase 2/3/LTE (PsO) - All
Tofa Version: 1.0;CURRENT Status: Fin
al
Location: /Compounds/CP/CP-
690550/Clinical/Summary/Tables and
Figures/Tofa Oral Psoriasis Additional
Analyses - scsa3920198a
http://gdms.pfizer.com/gdms/drl/objectId/0901
77e18a92b13f
Psoriasis
(All PsO)
All Tofa Doses
Rheumatoid
Arthritis (All RA)
All Tofa doses
Psoriatic
Arthritis (All PsA)
All Tofa Doses
N 3623 6300 783
n 38 121 4
PY of
Exposure 5203.6 22,131.5 789.24
Use a different
color for the IR
from C3 (slides
16,18 and 20
- Add the truven
estiamte point
Reviewed
Psoriasis
(All PsO)
All Tofa Doses
Rheumatoid Arthritis
(All RA)
All Tofa Doses
Psoriatic Arthritis
(All PsA)
All Tofa Doses
Truven
Any bDMARDs
(PsA)
N 3662 6300 783 5075
n 51 121 4 76
PY of
Exposure 8689.7 22,131.5 789.2 5447.8
Inc
ide
nc
e R
ate
/10
0 P
Y (
95
% C
I)
Ready for QC In QC
Date
28JUL17
QC Complete
28 Jul 2017

Laboratory Parameters Showed Similar Trends
to Those Observed in Other Programs
Modest dose dependent decreases in neutrophils and hemoglobin
– Absolute neutrophil counts were not associated with an increased incidence
of infections
Modest decreases in the absolute lymphocyte counts in the long term
extension study
Modest dose dependent increases in high density lipoprotein (HDL)
and low density lipoprotein (LDL)
Transaminase changes
– Liver transaminase elevations >3X ULN were infrequent and not
dose-dependent
– One patient had ≥5X ULN elevation of ALT
– No patients with ≥10X ULN
Modest dose dependent increases in serum creatinine
Author: Daniela Graham
Source: SCS Table
C3.6.5.2, C3.6.4.1, C3.6.1.2,
C3.6.7.10.1, C3.6.7.11.1,
C3.2.1.13, C3.2.1.14;
MA-82
Reviewed Ready for QC
ALT=Alanine Aminotransferase
In QC
Date
28JUL17
QC Complete
2 Aug 2017

Other AEs of Special Interest
(All PsA, Pooled Data)
Gastrointestinal perforations
– 1 event of appendicitis with perforation
Interstitial lung disease
– No events
Tuberculosis
– No events
Hepatic events
– No events of hepatic failure, fibrosis or cirrhosis
– No subjects met Hy’s Law criteria
Author: Daniela Graham
Source: SCS Table C3.2.8.1, C3.2.10.1,
C3.2.1.1, C3.2.15.1, C3.12.6.1; C3.12.8.1
C3.10.2.1, C3.10.3.2
Subject ID Dose at
Time of Death
Index Rand.
Sequence
Gender/
Race/
Age
Country Days on
Tofaa Preferred Term
Event
Occurred
in LTE
Out of
Risk Period
(Days)
10621004 Tofacitinib
5 mg BID Adalimumab M/W/54 Poland 84
Pancreatic
carcinoma
metastatic
Yes Yes (40)
10781015 Tofacitinib
5 mg BID
Placebo-
Tofa 5mg BID F/W/73 Poland 56 Cardiac Arrest No No
10421005 Tofacitinib
10 mg BID
Placebo-
Tofa 5mg BID F/W57 UK 273
Cardiac failure
acute/hyperten
sive
heart disease
Yes Yes (65)
11591002 Tofacitinib
5 mg BID Tofa 5mg BID F/W/46 UK 346
Pulmonary
Embolism Yes No
MA-83
Reviewed Ready for QC In QC
Date
28JUL17
QC Complete
02 Aug 2017

Overarching Safety Conclusions
Safety profile of tofacitinib is well characterized, stable and
manageable
Author: Daniela Graham
Source: SME, see author
MA-84
Reviewed Ready for QC In QC
Date
26JUL2017
QC Complete
Date 28JUL17

Overarching Safety Conclusions
Safety profile of tofacitinib is well characterized, stable and
manageable
No new signals have been identified in the PsA program
MA-85
Reviewed Ready for QC Author: Daniela Graham
Source: SME, see author
In QC
Date
26JUL2017
QC Complete
Date 28JUL17

Overarching Safety Conclusions
Safety profile of tofacitinib is well characterized, stable and
manageable
No new signals have been identified in the PsA program
Rates of adverse events of special interest in the PsA
program are similar to those observed in biologic DMARDs
(except herpes zoster)
MA-86
Reviewed Ready for QC Author: Daniela Graham
Source: SME, see author
In QC
Date
26JUL2017
QC Complete
Date 28JUL17

Overarching Safety Conclusions
Safety profile of tofacitinib is well characterized, stable and
manageable
No new signals have been identified in the PsA program
Rates of adverse events of special interest in the PsA
program are similar to those observed in biologic DMARDs
(except herpes zoster)
Safety profile in the PsA program is consistent with those
observed in the RA and PsO safety databases
MA-87
Reviewed Ready for QC Author: Daniela Graham
Source: SME, see author
In QC
Date
26JUL2017
QC Complete
Date 28JUL17

Overview of Presentation
MA-88
Topic Presenter
Introduction Nancy McKay Director, Regulatory Affairs
Pfizer Inc
Psoriatic Arthritis:
A Physician’s Perspective/
Unmet Medical Need
Philip Mease, MD, MACR Director, Rheumatology Research, Swedish-Providence-St.
Joseph Health Systems
Clinical Professor, University of Washington School of Medicine,
Seattle, WA
Tofacitinib PsA Development
Program and Efficacy
Keith Kanik, MD, FACR Senior Director, Global Clinical Lead PsA
Inflammation and Immunology
Pfizer Inc
Tofacitinib PsA Safety
Daniela Graham, MD Clinician, PsA Development Program
Inflammation and Immunology
Pfizer Inc
Risk Management Thomas Jones, MD Senior Director, Safety Risk Management
Pfizer Inc
Benefit:Risk and Conclusions
Michael Corbo, PhD Senior VP, Chief Development Officer
Inflammation and Immunology
Pfizer Inc
Author: Nancy McKay
Source: Reviewed Ready for QC In QC
Date
26JUL2017
QC Complete
30 July 2017

Risk Management
Thomas Jones, MD
Senior Director, Safety Risk Management
Pfizer Inc
MA-89
Author: Tom Jones
Source: SME, see author Reviewed Ready for QC In QC
Date
26JUL2017
QC Complete
Date 28JUL17

Effective Approach to Risk Management for
Tofacitinib
MA-90
Risk Management
Pharmacovigilance Risk Mitigation
Risk Assessment Reporting
Author: Tom Jones
Source: SME, see author Reviewed Ready for QC In QC
Date
26JUL2017
QC Complete
Date 28JUL17

Risk Management for Tofacitinib in PsA: Building on
Effective Approach in RA and Consistent Safety Profile
Risks and Other Safety Information Mitigation
Pharmacovigilance:
Assessment and Reporting
Routine
monitoring/
reporting
A3921092
PsA LTE Study
Indirectly via
RA studies
Serious infections including TB,
viral reactivation
Risk
mitigation
through
product
labeling
proposed for
PsA same as
for RA
√ √ √
Malignancy including LPD √ √ √
NMSC √ √ √
GI Perforations √ √ √
Abnormal labs (lymphocytes,
neutropenia, anemia, liver enzyme
and lipid elevations)
√ √ √
Vaccinations (avoid use of live
vaccines while on tofacitinib) √ √ √
Drug-drug interactions (DDI),
concomitant immunosuppressants √ √ √
Specific populations (pregnancy,
pediatric, geriatric, diabetic, renal
and hepatic impairment)
√ √ Pregnancy
registry
MA-91
Author: Tom Jones
Source:
Risks and other safety
information shown on
leftmost column of the slide
is the Package Insert (the
USPI, which was last
updated 2/2016, available
in Pfizer labeling central:
http://wvpartner.pfizer.com/
webviewer/labelcentral/defa
ult.aspx; or at Xeljanz.com:
http://ra.xeljanz.com)
Reviewed Ready for QC In QC
Date
28JUL17
LPD=Lympho-Proliferative Disorders; TB=Tuberculosis
QC Complete
Date 02AUG17

Risk Management for Tofacitinib in PsA: Building on
Effective Approach in RA and Consistent Safety Profile
MA-92
Risks and Other Safety Information Mitigation
Pharmacovigilance:
Assessment and Reporting
Routine
Monitoring/
Reporting
A3921092
PsA LTE Study
Indirectly via
RA studies
Serious infections including TB,
viral reactivation
Risk
mitigation
through
product
labeling
proposed for
PsA same as
for RA
√ √ √
Malignancy including LPD √ √ √
NMSC √ √ √
GI Perforations √ √ √
Abnormal labs (lymphocytes,
neutropenia, anemia, liver enzyme
and lipid elevations)
√ √ √
Vaccinations (avoid use of live
vaccines while on tofacitinib) √ √ √
Drug-drug interactions (DDI),
concomitant immunosuppressants √ √ √
Specific populations (pregnancy,
pediatric, geriatric, diabetic, renal
and hepatic impairment)
√ √ Pregnancy
registry
Author: Tom Jones
Source:
Risks and other safety
information shown on
leftmost column of the slide
is the Package Insert (the
USPI, which was last
updated 2/2016, available
in Pfizer labeling central:
http://wvpartner.pfizer.com/
webviewer/labelcentral/defa
ult.aspx; or at Xeljanz.com:
http://ra.xeljanz.com)
Reviewed Ready for QC In QC
Date
28JUL17
LPD=Lympho-Proliferative Disorders; TB=Tuberculosis
QC Complete
Date 02AUG17

Risk Management for Tofacitinib in PsA: Building on
Effective Approach in RA and Consistent Safety Profile
MA-93
Risks and Other Safety Information Mitigation
Pharmacovigilance:
Assessment and Reporting
Routine
Monitoring/
Reporting
Study 1092
PsA LTE Study
Indirectly via
RA Studies
Serious infections including TB,
viral reactivation
Risk
mitigation
through
product
labeling
proposed for
PsA same as
for RA
√ √ √
Malignancy including LPD √ √ √
NMSC √ √ √
GI Perforations √ √ √
Abnormal labs (lymphocytes,
neutropenia, anemia, liver enzyme
and lipid elevations)
√ √ √
Vaccinations (avoid use of live
vaccines while on tofacitinib) √ √ √
Drug-drug interactions (DDI),
concomitant immunosuppressants √ √ √
Specific populations (pregnancy,
pediatric, geriatric, diabetic, renal
and hepatic impairment)
√ √ Pregnancy
registry
Author: Tom Jones
Source:
Risks and other safety
information shown on
leftmost column of the slide
is the Package Insert (the
USPI, which was last
updated 2/2016, available
in Pfizer labeling central:
http://wvpartner.pfizer.com/
webviewer/labelcentral/defa
ult.aspx; or at Xeljanz.com:
http://ra.xeljanz.com)
Reviewed
LPD=Lympho-Proliferative Disorders; TB=Tuberculosis
Ready for QC In QC
Date
28JUL17
QC Complete
Date 02AUG17

Study 1133 Study Design
Prospective, Randomized, Open-label,
Blinded Endpoint Study (PROBE)
Phase 3b/4 Event-driven trial
(FDA PMR study)
Co-primary endpoints: MACE and
malignancies
Population: Adults with rheumatoid
arthritis
4372 subjects randomized
External Steering Committee
External DSMB
Endpoint Adjudication Committees
– CV, malignancy, hepatic, opportunistic
infections, GI perforation, ILD
Ra
nd
om
iza
tio
n 1
:1:1
Adalimumab 40 mg
SC Q2W or Etanercept
50 mg Weekly
Tofacitinib 5 mg BID
Tofacitinib 10 mg BID
0 5 Years
MT
X-I
R –
Mo
de
rate
-
Se
ve
re R
A w
ith
CV
Ris
k F
ac
tors
Sc
ree
nin
g
MA-94
Author: Carol Connell
Source: Document
Name: A3921133 Protocol
Amendment 7, 12 January
2015 Version: 1.0;CUR
RENT Status: Approved
Location: /Compounds/C
P/CP-
690550/Clinical/IV/A392113
3/Protocol and Analysis
Plan
http://gdms.pfizer.com/gdm
s/drl/objectId/090177e1860
ac74f
Subjects Randomized:
Impala
Reviewed
DSMB=Data and Safety Monitoring Board; ILD=Interstitial Lung Disease; PMR=Postmarketing Requirement
Ready for QC In QC
Date
28JUL17
QC Complete
28 Jul 2017

Effective Approach to Risk Management for
Tofacitinib
MA-95
Risk Management
Pharmacovigilance Risk Mitigation
Risk Assessment Reporting
Author: Tom Jones
Source: SME, see author Reviewed Ready for QC In QC
Date
26JUL2017
QC Complete
Date 28JUL17

Overview of Presentation
MA-96
Topic Presenter
Introduction Nancy McKay Director, Regulatory Affairs
Pfizer Inc
Psoriatic Arthritis:
A Physician’s Perspective/
Unmet Medical Need
Philip Mease, MD, MACR Director, Rheumatology Research, Swedish-Providence-St.
Joseph Health Systems
Clinical Professor, University of Washington School of Medicine,
Seattle, WA
Tofacitinib PsA Development
Program and Efficacy
Keith Kanik, MD, FACR Senior Director, Global Clinical Lead PsA
Inflammation and Immunology
Pfizer Inc
Tofacitinib PsA Safety
Daniela Graham, MD Clinician, PsA Development Program
Inflammation and Immunology
Pfizer Inc
Risk Management Thomas Jones, MD Senior Director, Safety Risk Management
Pfizer Inc
Benefit:Risk and Conclusions
Michael Corbo, PhD Senior VP, Chief Development Officer
Inflammation and Immunology
Pfizer Inc
Author: Nancy McKay
Source: Reviewed Ready for QC In QC
26 July
2017
QC Complete
30 July 2017

Benefit:Risk and Conclusions
Michael Corbo, PhD
Senior VP, Chief Development Officer
Inflammation and Immunology
Pfizer Inc
MA-97
Author:
Source: Reviewed Ready for QC In QC
28 July
2017
QC Complete
31 July 2017

XELJANZ® (tofacitinib) for PsA
Proposed USPI: Indication and Dosage
XELJANZ is indicated for the treatment of adult patients with active psoriatic arthritis
The recommended dose of XELJANZ is 5 mg twice daily used in combination with
conventional synthetic DMARDs
Proposed Dosage in sNDA
(2. DOSAGE AND ADMINISTRATION)
Proposed Indication in sNDA
(1. INDICATIONS AND USAGE)
Author: Nancy McKay
Source: Proposed USPI
MA-98
Reviewed Ready for QC In QC
28 July
2017
QC Complete
31 July 2017

Endpoint
Difference Tofacitinib 5 mg BID – Placebo
% Responders (95% CI)
ACR20
ACR50
ACR70
∆HAQ-DI ≥0.35 (MCID)a
PASI75b
Resolution of Enthesitis (LEI=0)c
Resolution of Dactylitis (DSS=0)c
Efficacy of Tofacitinib 5 mg BID at Month 3 Across
Multiple PsA Manifestations
MA-99
0 10 20 30 40
Hernan is asking to add the individual study level data to pooled data to the forest plot portion of the graph (ie, 3 bars in the order of 1125, 1091 and pooled from the top to bottom for each endpoint) and add pooled response rates to the table on the left portion of the graph. please remove the data columns on the right. In the revised plot, each endpoint will
have 3 bars in the order of 1125, 1091 and pooled from the top to bottom. We should
keep the study column with 3 values (1125, 1091, pooled).
-20 -10 0 10 20 30 40 50
Author: Hernan Valdez
Source: 1125 and 1091:
Table 14.2.1.1.2.1,
14.2.2.4.2, 14.2.2.6.2, 14.
2.2.2.2.1 etc. See tables at
right
Reviewed
a. For patients with baseline HAQ-DI≥0.35
b. For patients with baseline BSA≥3% and baseline PASI>0
c. For patients with baseline value>0
MCID=Minimal Clinically Important Difference
Favors
Placebo
Favors
Tofacitinib
Ready for QC In QC
28 July
2017 QC Complete
31 July 2017
In RE-QC
01 Aug
2017
QC Complete
01 Aug 2017
TNFi Naïve (Study 1091) TNFi-IR (Study 1125) Pooled

Endpoint
Difference Tofacitinib 5 mg BID – Placebo
% Responders (95% CI)
ACR20
ACR50
ACR70
∆HAQ-DI ≥0.35 (MCID)a
PASI75b
Resolution of Enthesitis (LEI=0)c
Resolution of Dactylitis (DSS=0)c
Efficacy of Tofacitinib 5 mg BID at Month 3 Across
Multiple PsA Manifestations
0 10 20 30 40
Hernan is asking to add the individual study level data to pooled data to the forest plot portion of the graph (ie, 3 bars in the order of 1125, 1091 and pooled from the top to bottom for each endpoint) and add pooled response rates to the table on the left portion of the graph. please remove the data columns on the right. In the revised plot, each endpoint will
have 3 bars in the order of 1125, 1091 and pooled from the top to bottom. We should
keep the study column with 3 values (1125, 1091, pooled).
-20 -10 0 10 20 30 40 50
TNFi Naïve (Study 1091) TNFi-IR (Study 1125) Pooled
MA-100
Author: Hernan Valdez
Source: 1125 and 1091:
Table 14.2.1.1.2.1,
14.2.2.4.2, 14.2.2.6.2, 14.
2.2.2.2.1 etc. See tables at
right
Reviewed
a. For patients with baseline HAQ-DI≥0.35
b. For patients with baseline BSA≥3% and baseline PASI>0
c. For patients with baseline value>0
MCID=Minimal Clinically Important Difference
Favors
Placebo
Favors
Tofacitinib
Ready for QC In QC
28 July
2017
QC Complete
31 July 2017
In RE-QC
01 Aug
2017
QC Complete
01 Aug 2017

Endpoint
Difference Tofacitinib 5 mg BID – Placebo
% Responders (95% CI)
ACR20
ACR50
ACR70
∆HAQ-DI ≥0.35 (MCID)a
PASI75b
Resolution of Enthesitis (LEI=0)c
Resolution of Dactylitis (DSS=0)c
Efficacy of Tofacitinib 5 mg BID at Month 3 Across
Multiple PsA Manifestations
0 10 20 30 40
Hernan is asking to add the individual study level data to pooled data to the forest plot portion of the graph (ie, 3 bars in the order of 1125, 1091 and pooled from the top to bottom for each endpoint) and add pooled response rates to the table on the left portion of the graph. please remove the data columns on the right. In the revised plot, each endpoint will
have 3 bars in the order of 1125, 1091 and pooled from the top to bottom. We should
keep the study column with 3 values (1125, 1091, pooled).
-20 -10 0 10 20 30 40 50
TNFi Naïve (Study 1091) TNFi-IR (Study 1125) Pooled
MA-101
Author: Hernan Valdez
Source: 1125 and 1091:
Table 14.2.1.1.2.1,
14.2.2.4.2, 14.2.2.6.2, 14.
2.2.2.2.1 etc. See tables at
right
Reviewed
a. For patients with baseline HAQ-DI≥0.35
b. For patients with baseline BSA≥3% and baseline PASI>0
c. For patients with baseline value>0
MCID=Minimal Clinically Important Difference
Favors
Placebo
Favors
Tofacitinib
Ready for QC In QC
28 July
2017 QC Complete
31 July 2017
In RE-QC
01 Aug
2017
QC Complete
01 Aug 2017

Endpoint
Difference Tofacitinib 5 mg BID – Placebo
% Responders (95% CI)
ACR20
ACR50
ACR70
∆HAQ-DI ≥0.35 (MCID)a
PASI75b
Resolution of Enthesitis (LEI=0)c
Resolution of Dactylitis (DSS=0)c
Efficacy of Tofacitinib 5 mg BID at Month 3 Across
Multiple PsA Manifestations
0 10 20 30 40
Hernan is asking to add the individual study level data to pooled data to the forest plot portion of the graph (ie, 3 bars in the order of 1125, 1091 and pooled from the top to bottom for each endpoint) and add pooled response rates to the table on the left portion of the graph. please remove the data columns on the right. In the revised plot, each endpoint will
have 3 bars in the order of 1125, 1091 and pooled from the top to bottom. We should
keep the study column with 3 values (1125, 1091, pooled).
-20 -10 0 10 20 30 40 50
TNFi Naïve (Study 1091) TNFi-IR (Study 1125) Pooled
MA-102
Author: Hernan Valdez
Source: 1125 and 1091:
Table 14.2.1.1.2.1,
14.2.2.4.2, 14.2.2.6.2, 14.
2.2.2.2.1 etc. See tables at
right
Reviewed
a. For patients with baseline HAQ-DI≥0.35
b. For patients with baseline BSA≥3% and baseline PASI>0
c. For patients with baseline value>0
MCID=Minimal Clinically Important Difference
Favors
Placebo
Favors
Tofacitinib
Ready for QC In QC
28 July
2017
QC Complete
31 July 2017 In RE-QC
01 Aug
2017
QC Complete
01 Aug 2017

Endpoint
Difference Tofacitinib 5 mg BID – Placebo
% Responders (95% CI)
ACR20
ACR50
ACR70
∆HAQ-DI ≥0.35 (MCID)a
PASI75b
Resolution of Enthesitis (LEI=0)c
Resolution of Dactylitis (DSS=0)c
a. For patients with baseline HAQ-DI≥0.35
b. For patients with baseline BSA≥3% and baseline PASI>0
c. For patients with baseline value>0
MCID=Minimal Clinically Important Difference
Efficacy of Tofacitinib 5 mg BID at Month 3 Across
Multiple PsA Manifestations
MA-103
0 10 20 30 40
Hernan is asking to add the individual study level data to pooled data to the forest plot portion of the graph (ie, 3 bars in the order of 1125, 1091 and pooled from the top to bottom for each endpoint) and add pooled response rates to the table on the left portion of the graph. please remove the data columns on the right. In the revised plot, each endpoint will
have 3 bars in the order of 1125, 1091 and pooled from the top to bottom. We should
keep the study column with 3 values (1125, 1091, pooled).
-20 -10 0 10 20 30 40 50
TNFi Naïve (Study 1091) TNFi-IR (Study 1125) Pooled
Author: Hernan Valdez
Source: 1125 and 1091:
Table 14.2.1.1.2.1,
14.2.2.4.2, 14.2.2.6.2, 14.
2.2.2.2.1 etc. See tables at
right
Reviewed
Favors
Placebo
Favors
Tofacitinib
Ready for QC In QC
28 July
2017
QC Complete
31 July 2017 In RE-QC
01 Aug
2017
QC Complete
01 Aug 2017

Active
Treatment
N
Placebo
N
Difference Between
Active Treatment and Placebo
Response Rate (95% CI)
SF-36v2 Physical Functioning Domain (MCID=3.5)
TNFi-IR (Study 1125) 124 117
120 117
TNFi Naïve (Study 1091)
102 102
103 102
101 102
HAQ-DI (MCID=0.35)
TNFi-IR (Study 1125) 116 116
123 116
TNFi Naïve (Study 1091)
96 94
92 94
96 94
FACIT-F Total Score (MCID=4)
TNFi-IR (Study 1125) 124 117
120 117
TNFi Naïve (Study 1091)
102 102
102 102
101 102
-40 -20 0 20 40
Improvement in Health Related Quality of Life
with Tofacitinib at Month 3
Tofa 10 mg BID Tofa 5 mg BID Ada 40 mg SC Q2W
Favors Placebo Favors Tofacitinib
1) Slide 2: Response rate based on clinically important change (CIC) from baseline at Month 3 by Treatment for HAQ-DI, SF-36v2 PF Domain, and FACIT-F
SF-36 Physical Functioning: Table 00037.1 Page 3 CIC 3.5 for Physical Functioning Domain
and Table 00037.2 Page 3 CIC 3.5 for Physicial Functioning Domain Post-Hoc Analysis Tables for SF-36v2 (see attach tables)
HAQ-DI: response tables – using 0.35 cut-off
A3921091 CSR Table 14.2.1.3.7.2 (HAQ-DI 0.35) A3921125 CSR Table 14.2.1.3.7.2 (HAQ-DI 0.35)
FACIT-Fatigue: response tables – The post-hoc tables below that were ran a few months ago show many cut-off’s—pls use 4 for the FACIT-F total score. The published literature ranges from 3 to 4 points in PsA. For the ACR abstract we used 4 pts. See below GDMS Links page 7 for 1091 Page 5 for 1125
1091: Document Name: Table 00010.14.2.2.20.2.2 1125: Document Name: Table 00011.14.2.2.18.2.2
Data shown are patients achieving MCID MA-104
Author:
Source: Reviewed Ready for QC In QC
28 July
2017
QC Complete
31 July 2017

Difference (95% CI)
ACR20
Response Rate
ACR50
Response Rate
ACR70
Response Rate
PASI75
Response Rate
Non-Progressors,
∆mTSS≤0.5
-30 -20 -10 0 10 20 30
-0.4 -0.2 0 0.2 0.4
-1 -0.5 0 0.5 1
-4 -2 0 2 4
-30 -20 -10 0 10 20 30
-30 -20 -10 0 10 20 30
-30 -20 -10 0 10 20 30
Comparison Between Tofacitinib 5 mg BID and
Adalimumab in TNFi-Naïve Patients (Study 1091) Across
Multiple PsA Disease Manifestations (Month 12)
ACR20
Response
Rate
∆LEI
∆DSS
ACR50
Response
Rate
Favors Ada Favors Tofa 5
Favors Tofa 5 Favors Ada
∆HAQ-DI
ACR70
Response
Rate
Difference (95% CI)
Difference (95% CI)
-30 -20 -10 0 10 20 30
PASI75
Response
Rate
EF-62
Favors
Ada 40 mg
SC Q2W
Favors
Tofa 5 mg BID
Difference (95% CI)
∆HAQ-DI
∆LEI
∆DSS
Favors
Tofa 5 mg BID
Favors
Ada 40 mg
SC Q2W
-0.4 -0.2 0 0.2 0.4
-3 -2 -1 0 1 2 3
I agree with Ann we need to plot the non-progressor rate in order to be on the same favorable/non-favorable scale, ie change ‘progressor rate’ to ‘Non-progressor rate (≤0.5)’ and the underlying data accordingly (ie, difference=-1.98 with 95% CI: -6.98 and 2.89 converted from Table 14.2.2.2.2). Also, for the responder (left) column, please use -30 to 30 as the range with tick marks by an increment of 10. For the right column, use tick marks by an increment of 1.
EF-62
MA-105
Author:
Source:
PASI: 14.2.2.6.4
ACR70: 14.2.2.4.2.2
mTSS: 14.2.2.2.2
HAQ: 14.2.1.3.3.2
Enth: 14.2.2.18.3.2
Dac: 14.2.2.17.3.2
Reviewed
-1 -0.5 0 0.5 1
Ready for QC In QC
28 July
2017
QC Complete
31 July 2017 In RE-QC
01 Aug
2017
QC Complete
01 Aug 2017

Risk Assessment
MA-106
Author:
Source: Reviewed Ready for QC In QC
28 July
2017
QC Complete
31 July 2017

Foundation of Safety Database for Tofacitinib
MA-107
Extent of Exposure in Tofacitinib Development Programs
PsO and RA
Clinical Trials RA 6300 patients and
21,886 PY exposure
Up to 9 years of exposure
PsO 3662 patients and
8537 PY exposure
Author:
Source:
See sources MA-57
Reviewed Ready for QC In QC
28 July
2017
QC Complete
31 July 2017

Foundation of Safety Database for Tofacitinib
MA-108
Extent of Exposure in Tofacitinib Development Programs and Marketed Drug
PsO and RA
Clinical Trials
Real World
Since 2012
Experience with >80,000 PY of exposure
with marketed tofacitinib
Corrona Registry: 1261 patients with
1478 PY of exposure
RA 6300 patients and
21,886 PY exposure
Up to 9 years of exposure
PsO 3662 patients and
8537 PY exposure
Author: Ann Wouters
Source: SCS PsA tables
2,7,10; Corrona update
report 30 June Table 3, IMS
report Page 2, paragraph 4
(Executive Summary) of
PSUR/PBRER (May 2017)
See sources MA-57
Reviewed Ready for QC In QC
28 July
2017
QC Complete
01 Aug 2017

Overall Tofacitinib Safety Database Exposure to Tofacitinib Supporting Safety in PsA
MA-109
PsA
Clinical Trials
RA 6300 patients and
21,886 PY exposure
Up to 9 years of exposure
PsO 3662 patients and
8537 PY exposure
Experience with >80,000 PY of exposure
with marketed tofacitinib
Corrona Registry: 1261 patients with
1478 PY of exposure
783
patients
775 PY
of exposure
PsO and RA
Clinical Trials
Real World
Since 2012
Reviewed Ready for QC In QC
28 July
2017
Author: Ann Wouters
Source: SCS PsA tables
2,7,10; Corrona update
report 30 June Table 3, IMS
report Page 2, paragraph 4
(Executive Summary) of
PSUR/PBRER (May 2017)
QC Complete
01 Aug 2017
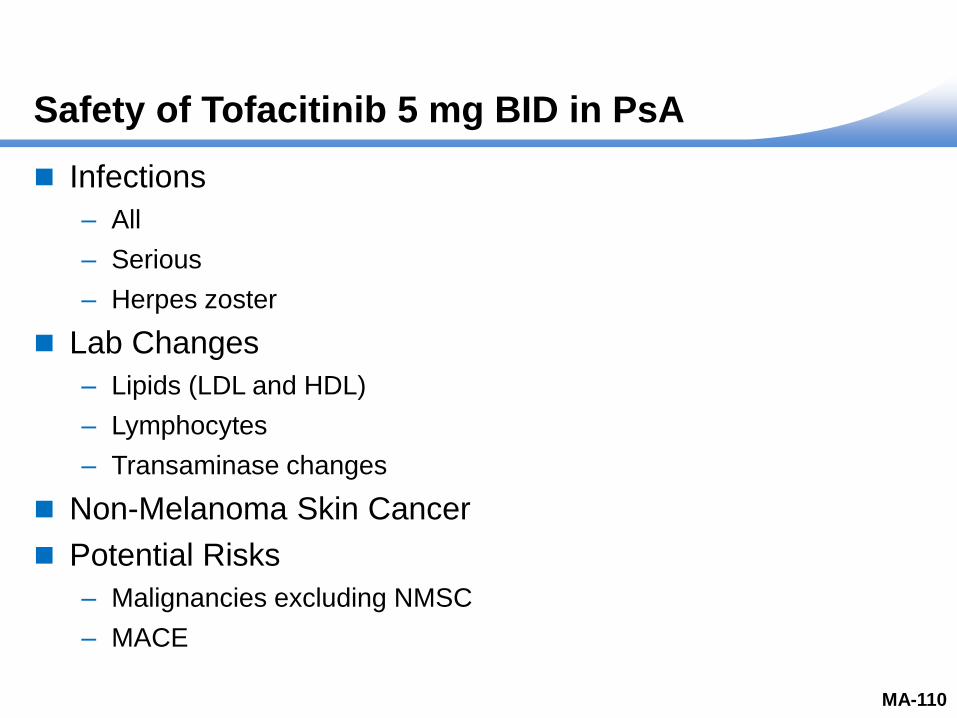
Safety of Tofacitinib 5 mg BID in PsA
Infections
– All
– Serious
– Herpes zoster
Lab Changes
– Lipids (LDL and HDL)
– Lymphocytes
– Transaminase changes
Non-Melanoma Skin Cancer
Potential Risks
– Malignancies excluding NMSC
– MACE
MA-110
Author:
Source: Reviewed Ready for QC In QC
28 July
2017
QC Complete
31 July 2017

Risks with Tofacitinib Treatment are Consistent
Across Diseases
MA-111
1.37
2.77
1.30
0.0
0.5
1.0
1.5
2.0
2.5
3.0
3.5
4.0
4.5
5.0
Inc
ide
nc
e R
ate
/10
0 P
Y (
95
% C
I)
Serious Infections Tofa 5 mg BID
PsO ≤12
Months
RA ≤24
Months
PsA ≤12
Months
N 1217 1589 238
n 11 48 2
PY of Exposure
800.8 1733.8 154.1
Author:
Source: Reviewed Ready for QC In QC
28 July
2017
QC Complete
31 July 2017

Risks with Tofacitinib Treatment are Consistent
Across Diseases
MA-112
1.37
2.77
1.30
0.0
0.5
1.0
1.5
2.0
2.5
3.0
3.5
4.0
4.5
5.0
Inc
ide
nc
e R
ate
/10
0 P
Y (
95
% C
I)
1.00
0.75
0.63
0.0
0.2
0.4
0.6
0.8
1.0
1.2
1.4
1.6
0.24
0.38 0.38
0.0
0.2
0.4
0.6
0.8
1.0
1.2
Serious Infections Tofa 5 mg BID
Malignancies (Excl. NMSC) All Tofa Doses
MACE All Tofa Doses
PsO ≤12
Months
RA ≤24
Months
PsA ≤12
Months
N 1217 1589 238
n 11 48 2
PY of Exposure
800.8 1733.8 154.1
PsO All PsO
RA All RA
PsA All PsA
3623 6300 783
52 168 5
5203.6 22,353.7 790.5
PsO All PsO
RA All RA
PsA All PsA
3662 5856 783
21 80 3
8759.3 21,285.9 790.5
Author:
Source: Reviewed Ready for QC In QC
28 July
2017
QC Complete
31 July 2017

Scope and Effectiveness of Risk Management
of Tofacitinib
Overlapping risks with RA
Proven signal detection/assessment/reporting
Addition of PsA-specific measures including
– Labeling
– Long term safety assessment in clinical trial setting up to 4 years
• More detailed understanding of long-term events in PsA
MA-113
Author:
Source: Reviewed Ready for QC In QC
28 July
2017
QC Complete
31 July 2017
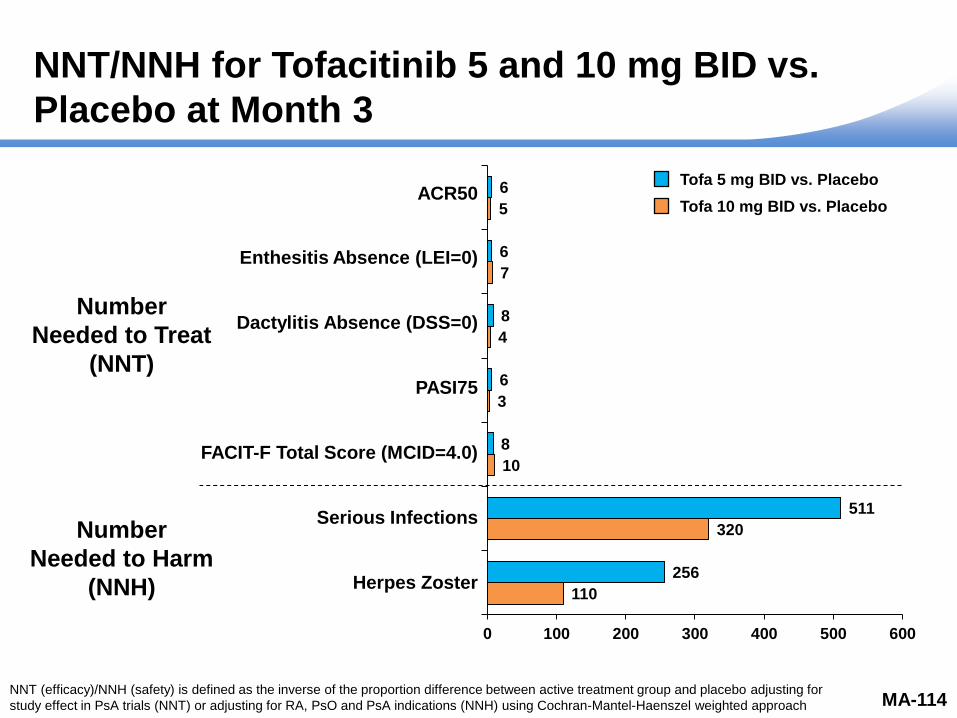
NNT/NNH for Tofacitinib 5 and 10 mg BID vs.
Placebo at Month 3
110
320
10
3
4
7
5
256
511
8
6
8
6
6
0 100 200 300 400 500 600
ACR50
Enthesitis Absence (LEI=0)
Dactylitis Absence (DSS=0)
PASI75
FACIT-F Total Score (MCID=4.0)
Serious Infections
Herpes Zoster
Number
Needed to Treat
(NNT)
Author: Huaming Tan
Source: Tofa PsA Ad
Hoc 00007.1, 00007.3,
00059.1, 00059.2,
00059.3, C1.2.17.1
MA-114
Number
Needed to Harm
(NNH)
Tofa 5 mg BID vs. Placebo
Tofa 10 mg BID vs. Placebo
NNT (efficacy)/NNH (safety) is defined as the inverse of the proportion difference between active treatment group and placebo adjusting for
study effect in PsA trials (NNT) or adjusting for RA, PsO and PsA indications (NNH) using Cochran-Mantel-Haenszel weighted approach
The following is the NNH for serious infection and herpes zoster for tofa 5
mg and 10 mg BID in placebo controlled period (only included the placebo
controlled studies) across RA, PsO and PsA., weighted by sample size of
each indication.
Serious infections
5 mg NNH: 511
10 mg NNH 320
Herpes zoster:
5 mg NNH: 256
10 mg NNH: 110
Please update the NNT/NNH slide with these number for the NNH, and
please also remove most of the footnotes, except for the definition of NNT
and NNH. Please also modify the footnote as following:
NNT (efficacy)/NNH (safety) is defined as the inverse of the proportion
difference between active treatment group and placebo adjusting for study
effect in PsA trials (NNT) or adjusting for RA, PsO and PsA indications
(NNH) using Cochran-Mantel-Haenszel weighted approach.
Please let me know if you have any questions. thanks!
238
118
10
3
4
7
5
119
8
6
8
6
6
0 50 100 150 200 250
ACR50
Enthesitis Absence (LEI=0)
Dactylitis Absence (DSS=0)
PASI75
FACIT-F Total Score (MCID=4.0)
Serious Infections
Herpes Zoster
Number
Needed to Treat
(NNT)
Number
Needed to Harm
(NNH)
NNH is undefined when proportion difference is zero
Opportunistic Infections=0; MACE=0; NMSC=0; Malignancies=2 (on days 48 and 66, respectively)
NNT (Efficacy)/NNH (Safety) is defined as the inverse of proportion difference between active
treatment and placebo adjusting for study using Cochran-Mantel-Haenszel weighted approach
Reviewed Ready for QC In QC
01 August
2017 QC Complete
02 Aug 2017

Tofacitinib: Favorable Benefit:Risk in the
Treatment of PsA Patients
MA-115
Author:
Source: Reviewed
PRO=Patient Reported Outcome
Clinical effect across key manifestations
Benefits
Ready for QC In QC
28 July
2017
QC Complete
31 July 2017

Tofacitinib: Favorable Benefit:Risk in the
Treatment of PsA Patients
MA-116
Author:
Source: Reviewed
PRO=Patient Reported Outcome
Clinical effect across key manifestations
Benefits
Efficacy in csDMARD IR and anti-TNF IR
Ready for QC In QC
28 July
2017
QC Complete
31 July 2017

Tofacitinib: Favorable Benefit:Risk in the
Treatment of PsA Patients
MA-117
Author:
Source: Reviewed
PRO=Patient Reported Outcome
Clinical effect across key manifestations
Benefits
Efficacy in csDMARD IR and anti-TNF IR
Effects demonstrated as early as 2 weeks
Ready for QC In QC
28 July
2017
QC Complete
31 July 2017

Tofacitinib: Favorable Benefit:Risk in the
Treatment of PsA Patients
MA-118
Author:
Source: Reviewed
PRO=Patient Reported Outcome
Clinical effect across key manifestations
Benefits
Intracellular mechanism of action
Efficacy in csDMARD IR and anti-TNF IR
Effects demonstrated as early as 2 weeks
Oral, small molecule without anti-drug antibody formation
Ready for QC In QC
28 July
2017
QC Complete
31 July 2017

Tofacitinib: Favorable Benefit:Risk in the
Treatment of PsA Patients
MA-119
Author:
Source: Reviewed
PRO=Patient Reported Outcome
Clinical effect across key manifestations
Benefits
Intracellular mechanism of action
Efficacy in csDMARD IR and anti-TNF IR
Effects demonstrated as early as 2 weeks
Oral, small molecule without anti-drug antibody formation
Positive results across suite of PROs at the population and patient level
Ready for QC In QC
28 July
2017
QC Complete
31 July 2017
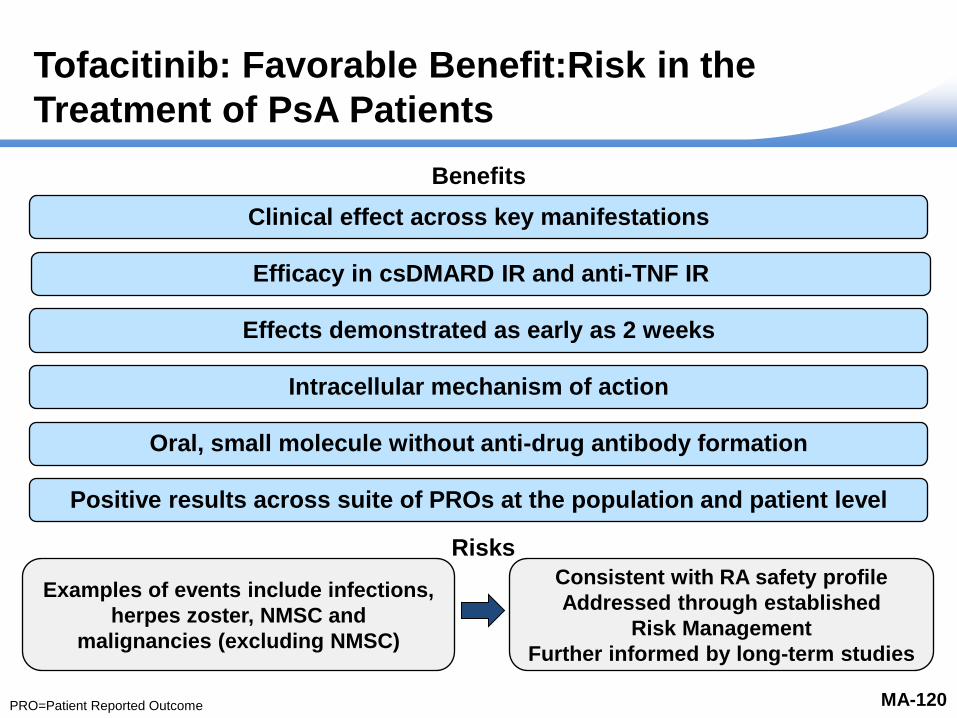
Tofacitinib: Favorable Benefit:Risk in the
Treatment of PsA Patients
MA-120
Clinical effect across key manifestations
Benefits
Intracellular mechanism of action
Efficacy in csDMARD IR and anti-TNF IR
Effects demonstrated as early as 2 weeks
Oral, small molecule without anti-drug antibody formation
Positive results across suite of PROs at the population and patient level
Examples of events include infections,
herpes zoster, NMSC and
malignancies (excluding NMSC)
Risks
Consistent with RA safety profile
Addressed through established
Risk Management
Further informed by long-term studies
Author:
Source: Reviewed
PRO=Patient Reported Outcome
Ready for QC In QC
28 July
2017
QC Complete
31 July 2017
Backup Slides Shown
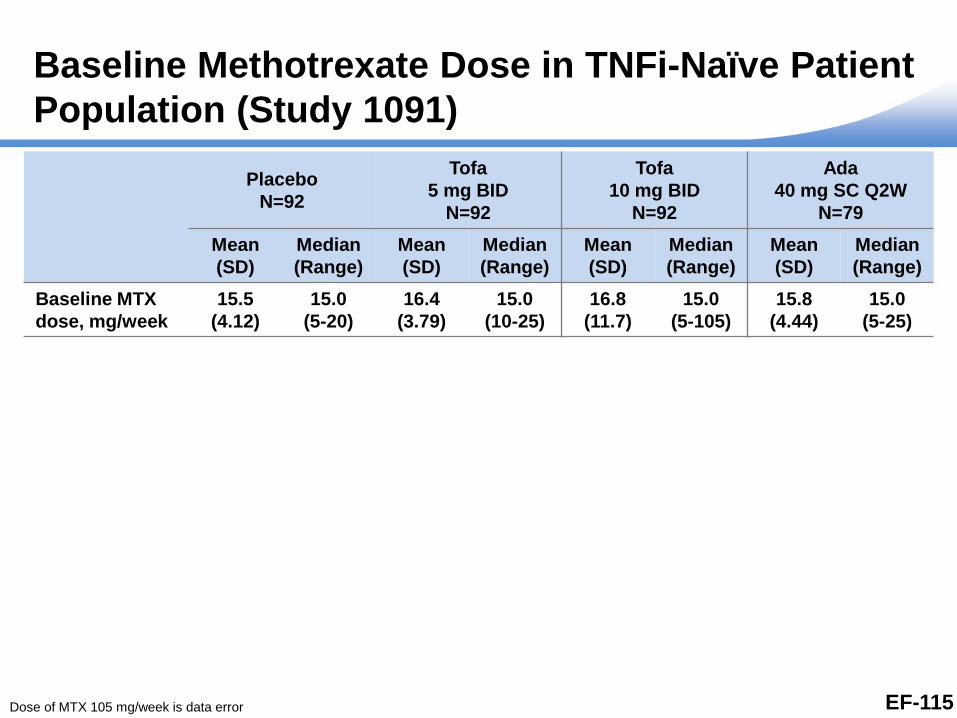
Baseline Methotrexate Dose in TNFi-Naïve Patient
Population (Study 1091)
Placebo
N=92
Tofa
5 mg BID
N=92
Tofa
10 mg BID
N=92
Ada
40 mg SC Q2W
N=79
Mean
(SD)
Median
(Range)
Mean
(SD)
Median
(Range)
Mean
(SD)
Median
(Range)
Mean
(SD)
Median
(Range)
Baseline MTX
dose, mg/week
15.5
(4.12)
15.0
(5-20)
16.4
(3.79)
15.0
(10-25)
16.8
(11.7)
15.0
(5-105)
15.8
(4.44)
15.0
(5-25)
Dose of MTX 105 mg/week is data error EF-115

Immune Response to LZV in Zoster Vaccine
Study 1237 in RA Patients
RA patients starting Tofacitinib 5 mg BID had similar
VZV-specific humoral and cell-mediated immune responses
to LZV as compared to placebo-treated patients
Immunogenicity assessment Study 1237
Change in VZV IgG at week 6
(IgG fold-rise)
Tofa 5 mg BID Placebo
2.11 fold rise
80% CI=(1.87, 2.37)
1.74 fold rise
80% CI=(1.55, 1.95)
Absolute Value of VZV IgG titer
at week 6 (ELISA Units/mL)
Baseline: 201
Week 6: 403
Baseline: 182
Week 6: 323
Change in VZV ELISPOT at
week 6 (SFC fold-rise)
(SFCs/106 PBMCs)
1.5
80% CI=(1.31, 1.70)
1.29
80% CI=(1.14, 1.46)
Absolute Value of VZV SFCs/106
PBMCs
Baseline: 48
Week 6: 70
Baseline: 43
Week 6: 56
ELISA=Enzyme-Linked Immunosorbent Assay; ELISPOT=Enzyme-Linked ImmunoSpot; LZV=Live Zoster Vaccine;
PBMC=Peripheral Blood Mononuclear Cell; SFC=Spot Forming Cells; VZV=Varicella Zoster Virus SA-119