tobacco products university of maryland … · i.2 reduced-risk review project: objectives and ......
TRANSCRIPT

The LSRO Report on
EditorKara D. Lewis, Ph.D.
Exposure A
ssessment
LSR
O R
eport
EXPOSURE ASSESSMENT IN THEEVALUATION OF
POTENTIAL REDUCED-RISKTOBACCO PRODUCTS
LSRO Report on
EXPOSURE ASSESSMENT IN THEEVALUATION OF
POTENTIAL REDUCED-RISKTOBACCO PRODUCTS
Expert Committee
Richard Dalby, Ph.D.Department of Pharmaceutical Sciences
University of MarylandBaltimore, MD
Karl Olav Fagerström, Ph.D.Fagerström Consulting AB and Smokers Information Center
Helsingborg, Sweden
Jerold Last, Ph.D.University of California at Davis
School of MedicineDavis, CA
Robert Orth, Ph.D.Apis Discoveries, LLC
Gerald, MO
William Waddell, M.D.Department of Pharmacology and Toxicology
University of LouisvilleSchool of Medicine
Louisville, KY
The Life Sciences Research Office
The Life Sciences Research Office (LSRO) is a non-profit organization thatbenefits society by providing information, analysis, and advice to decisionmakers in the government and the private sector. LSRO reports addressscientific issues in biomedicine, health care, nutrition, food safety, health riskanalysis, and the environment.
www.LSRO.org

For internal use of Philip Morris personnel only.
EXPOSURE ASSESSMENT IN THEEVALUATION OF POTENTIAL REDUCED-RISK
TOBACCO PRODUCTS
LSRO
Life Sciences Research Office9650 Rockville PikeBethesda, Maryland
Kara D. Lewis, Ph.D.Editor

For internal use of Philip Morris personnel only.
In Memoriam: Catherine L. St. Hilaire
The Life Sciences Research Office dedicates this report to the memory ofCatherine L. St. Hilaire, Ph.D. Her leadership, vision, and resolve were criticalto the successful completion of this project. She will be greatly missed byher many friends and colleagues.
Copyright © 2007 Life Sciences Research Office
No part of this document may be reproduced by any mechanical,photographic, or electronic process, or in form of a phonographic recording,nor may it be stored in a retrieval system, transmitted, or otherwise copiedfor public or private use, without written permission from the publisher, exceptfor the purposes of official use by the U.S. Government.
Copies of the publication may be obtained from the Life Sciences ResearchOffice. Orders and inquiries may be directed to: LSRO, 9650 RockvillePike, Bethesda, MD 20814-3998. Tel: 301-634-7030; Fax 301-634-7876;web site: www.LSRO.org
ISBN: 978-0-9753167-9-5Library of Congress Catalog Number: 2007941730

For internal use of Philip Morris personnel only.
FOREWORD
The Life Sciences Research Office, Inc., (LSRO) provides scientificassessments of topics in the biomedical sciences. Reports published byLSRO are based on comprehensive literature reviews and the scientificopinions of knowledgeable investigators engaged in work in relevant areasof science and medicine.
This report, one of three from the LSRO Reduced-Risk Review Project(RRRP), was developed under a contract between Philip Morris USA, Inc.,(Philip Morris) and LSRO. The findings, conclusions, and recommendationscontained in this report were developed independently of Philip Morris andare not intended to represent the views of Philip Morris or any of itsemployees.
Several Expert Advisory Committees provided scientific oversight anddirection for the RRRP. LSRO independently appointed members of theExpert Advisory Committees on the basis of their qualifications, experience,judgment, and freedom from conflict of interest, with due considerations forbalance and breadth in the appropriate professional disciplines. Committeemembers were selected with the concurrence of the LSRO Board ofDirectors.
This report provides the findings and recommendations of LSRO on oneaspect of the RRRP—methods to assess exposures associated withpotential reduced-risk tobacco products. The Exposure Assessment (EA)Committee provided primary oversight of this report’s development; thisoversight was supplemented by input from the RRRP Core Committee.Appendix A provides biographical and professional information on each EAand Core Committee member.
The EA Committee held four meetings and one conference call betweenJune 2005 and November 2006 to assess the available data. LSRO invitedand accepted written, electronic, and oral submission of data, information,and views bearing on the topic under study. Information about the process,including critical literature and presentations on which the EA Committeebased its deliberations, was made publicly available on the LSRO web sitewww.lsro.org/rrrvw.
LSRO staff drafted this report on the basis of available information and thedeliberations and recommendations of the RRRP EA and Core Committees.The draft LSRO EA report was submitted to experts in relevant disciplines

iv Exposure Assessment
For internal use of Philip Morris personnel only.
for independent peer review, and their comments were considered forincorporation by LSRO staff, RRRP EA and Core Committees, and LSROBoard of Directors. Philip Morris reviewed the final report for technicalaccuracy with respect to its products or other possible factual errors. TheEA and Core Committees and LSRO Board of Directors reviewed andapproved the final report. Upon approval, LSRO published the report withno additional input or review.
Participation in the preparation of this report or membership on an ExpertAdvisory Committee, or the LSRO Board of Directors, does not implyendorsement of all statements in the report. LSRO accepts full responsibilityfor the study conclusions and accuracy of the report.
Michael Falk, Ph.D.Executive Director
Life Sciences Research Office, Inc.December 11, 2007

Table of Contents v
For internal use of Philip Morris personnel only.
TABLE OF CONTENTS
FOREWORD ............................................................................................. iiiEXECUTIVE SUMMARY .......................................................................... 1I. INTRODUCTION ................................................................................. 6
I.1 TOBACCO PRODUCT HARM REDUCTION ............................ 6I.2 REDUCED-RISK REVIEW PROJECT: OBJECTIVES AND
APPROACH ............................................................................... 6I.3 SMOKING-RELATED EXPOSURES ......................................... 9
II. ASSESSMENT OF EXPOSURE FROM POTENTIALREDUCED-RISK TOBACCO PRODUCTS ....................................... 11II.1 PRODUCT CHARACTERIZATION .......................................... 11II.2 CHEMISTRY ............................................................................ 13
II.2.1 Control Tobacco Products ................................................ 13II.2.1.1 Kentucky reference cigarettes ................................... 13II.2.1.2 Conventional cigarettes ............................................ 13II.2.1.3 Recommendations for control cigarettes .................. 14
II.2.2 Mainstream Tobacco Smoke ........................................... 14II.2.2.1 Cigarette smoking machine parameters ................... 14
II.2.2.1.1 Emerging cigarette smoking machine protocols ... 17II.2.2.1.2 Recommendations for cigarette smoking
machine protocols ................................................ 18II.2.2.2 Selection of smoke analytes ..................................... 19
II.2.2.2.1 Recommendations for selection of smokeanalytes ................................................................ 19
II.2.2.3 Selection of analytical methods ..................................... 20II.2.2.3.1 Recommendations for selection of analytical
methods ................................................................ 21II.2.2.3.2 Emerging analytical methods and research gaps ... 21
II.2.2.4 Other mainstream tobacco smoke exposures........... 22II.2.3 Sidestream Tobacco Smoke ............................................ 22
II.2.3.1 Sidestream smoke collection .................................... 23II.2.3.2 Selection of sidestream smoke analytes................... 23
II.2.4 Environmental Tobacco Smoke ....................................... 24II.2.4.1 Human-smoker-generated ETS ................................ 24
II.2.5 Relative Contributions of Tobacco Product and SmokeChemistry to Assessing PRRTPs .................................... 24
III. CLINICAL STUDIES OF POTENTIAL REDUCED-RISKTOBACCO PRODUCTS ................................................................... 26III.1 SELECTION OF BIOLOGICAL SAMPLES .............................. 26
III.1.1 Blood ............................................................................... 26III.1.2 Urine ................................................................................ 26III.1.3 Saliva ............................................................................... 27

vi Exposure Assessment
For internal use of Philip Morris personnel only.
III.1.4 Hair .................................................................................. 27III.1.5 Exhaled Air ...................................................................... 27III.1.6 Toenail ............................................................................. 28
III.2 STUDY PARTICIPANT SELECTION ........................................ 28III.3 APPROPRIATE CONTROL TOBACCO PRODUCTS .............. 28III.4 BIOMARKERS OF TOBACCO PRODUCT AND SMOKE
EXPOSURE ............................................................................. 29III.4.1 Nicotine and Metabolites ................................................. 37
III.4.1.1 Nicotine ..................................................................... 37III.4.1.2 Cotinine ..................................................................... 39III.4.1.3 Nicotine + metabolites .............................................. 40
III.4.2 Carbon Monoxide ............................................................ 40III.4.3 Urine Mutagenicity ........................................................... 44III.4.4 N-Nitrosamine Biomarkers .............................................. 46
III.4.4.1 Tobacco-specific nitrosamines .................................. 46III.4.4.1.1 4-(Methylnitrosamino)-1-(3-pyridyl)-1-butanol
and metabolites .................................................... 47III.4.4.1.2 4-Hydroxy-1-(3-pyridyl)-1-butanone-DNA
adducts in lung ..................................................... 51III.4.4.1.3 4-Hydroxy-1-(3-pyridyl)-1-butanone-hemoglobin
adducts ................................................................. 52III.4.4.2 N′-Nitrosonornicotine adducts ................................... 53III.4.4.3 N′-Nitrosonornicotine, N′-Nitrosoanatabine,
N′-Nitrosoanabasine, and their pyridineN-Glucuronides in urine ............................................ 53
III.4.4.4 N-Nitrosoproline and other nitrosamino compounds . 53III.4.5 Aromatic Amine Biomarkers ............................................ 54
III.4.5.1 Aromatic amine-hemoglobin adducts........................ 54III.4.5.1.1 4-Aminobiphenyl-hemoglobin adducts ................. 54III.4.5.1.2 Other aromatic amine-hemoglobin adducts.......... 56
III.4.5.2 4-Aminobiphenyl-DNA adducts ................................. 57III.4.5.3 Urinary aromatic amines ........................................... 57
III.4.6 Benzene Biomarkers ....................................................... 58III.4.6.1 Benzene .................................................................... 58III.4.6.2 trans,trans-Muconic acid
(trans,trans-2,4-hexadienedioic acid) ........................ 59III.4.6.3 S-Phenylmercapturic acid
(N-acetyl-S-phenyl-L-cysteine) ................................. 60III.4.7 1,3-Butadiene Biomarkers ............................................... 61
III.4.7.1 Monohydroxybutenyl mercapturic acids anddihydroxybutyl mercapturic acid ................................ 61
III.4.7.2 1,3-Butadiene adducts .............................................. 62

Table of Contents vii
For internal use of Philip Morris personnel only.
III.4.8 Acrolein Biomarker .......................................................... 62III.4.8.1 3-Hydroxypropylmercapturic acid.............................. 63
III.4.9 Acrylonitrile Biomarkers ................................................... 63III.4.9.1 N-(2-Cyanoethyl)valine-hemoglobin adducts ............ 63
III.4.10 Polycyclic Aromatic Hydrocarbon Biomarkers ................. 64III.4.10.1 1-Hydroxypyrene ....................................................... 64III.4.10.2 3-Hydroxybenzo[a]pyrene and 3-hydroxybenz
[a]anthracene ............................................................ 66III.4.10.3 Benzo[a]pyrene-hemoglobin adducts ....................... 67III.4.10.4 Benzo[a]pyrene-albumin adducts .............................. 68III.4.10.5 Naphthols .................................................................. 68III.4.10.6 Hydroxyphenanthrenes and phenanthrene
dihydrodiols ............................................................... 69III.4.10.7 Polycyclic aromatic hydrocarbon-DNA adducts ........ 70
III.4.11 Acetonitrile Biomarkers.................................................... 72III.4.12 Minor Tobacco Alkaloids (Anatabine and Anabasine) ..... 73III.4.13 Cadmium ......................................................................... 74III.4.14 Acrylamide Biomarkers ................................................... 75
III.4.14.1 N-Acetyl-S-(2-carbamoylethyl)-L-cysteine andN-(R,S)-Acetyl-S-(2-carbamoyl-2-hydroxyethyl)-L-cysteine ................................................................. 75
III.4.14.2 N-(2-Carbamoylethyl)valine-hemoglobin adducts ..... 76III.4.15 Hydrogen Cyanide Biomarker ......................................... 77III.4.16 Alkylation Biomarkers ...................................................... 78
III.4.16.1 3-Methyladenine ....................................................... 78III.4.16.2 3-Ethyladenine .......................................................... 78III.4.16.3 N-Ethylvaline-hemoglobin adducts............................ 79III.4.16.4 N-(2-Hydroxyethyl)valine-hemoglobin adducts ......... 79III.4.16.5 N-Methylvaline-hemoglobin adducts ......................... 80
III.4.17 Thioether Biomarkers ...................................................... 80III.4.18 Other Biomarkers ............................................................ 81
III.4.18.1 7-Methylguanine-DNA adducts ................................. 81III.4.18.2 8-Hydroxy-2′-deoxyguanosine .................................. 82III.4.18.3 2,5-Dimethylfuran ...................................................... 82III.4.18.4 5-Hydroxymethyluracil ............................................... 83III.4.18.5 F2-isoprostanes ......................................................... 83III.4.18.6 Etheno-DNA adducts ................................................ 84III.4.18.7 Bulky DNA adducts ................................................... 84
III.4.19 Analysis of Exhaled Breath Condensate as a Measureof Tobacco Smoke Exposure ........................................... 86
III.4.20 LSRO Recommendations for Biomarkers ................. 87

viii Exposure Assessment
For internal use of Philip Morris personnel only.
III.4.20.1 Biomarkers recommend for inclusion inassessment of all PRRTPs ....................................... 87
III.4.20.2 Additional biomarkers ............................................... 87III.4.20.3 Relative contribution of biomarkers of exposure
to assess PRRTPs .................................................... 88III.5 BEHAVIOR RELATED TO TOBACCO PRODUCT USE .......... 89
III.5.1 Smoking Topography ....................................................... 89III.5.2 Measures of Cigarette Consumption ............................... 90
III.6 FILTER ANALYSIS ................................................................... 90III.7 DEPOSITION AND RETENTION OF TOBACCO SMOKE
PARTICLES ............................................................................. 91III.8 “OMICS”................................................................................... 92
IV. CONCLUSIONS ................................................................................ 93
V. LITERATURE CITATIONS ................................................................ 95
VI. APPENDICES ................................................................................. 147VI.A THE LIFE SCIENCES RESEARCH OFFICE ........................ 147
VI.A.1 Exposure Assessment Committee ................................ 147VI.A.2 Reduced-Risk Review Project Core Committee ............ 150VI.A.3 The Life Sciences Research Office Staff ....................... 154VI.A.4 The Life Sciences Research Office Board of Directors ... 158
VI.B GLOSSARY/ACRONYMS AND ABBREVIATIONS................ 159VI.B.1 Glossary ........................................................................ 159VI.B.2 Acronyms and Abbreviations ......................................... 167
INDEX ................................................................................................... 169
TABLES
Table II-1. Examples of Potential Reduced-Risk Tobacco Products ..... 12Table II-2. Alternative Smoking Regimens Considered by the ISO
Working Group ..................................................................... 18Table III-1. Biomarkers of Tobacco Smoke Exposure Recommended
for Routine Use .................................................................... 32Table III-2. Biomarkers of Tobacco Smoke Exposure Not
Recommended for Routine Use ........................................... 34

Table of Contents ix
For internal use of Philip Morris personnel only.
FIGURES
Figure III.1 Biomarkers of exposure and biomarkers of effect. ............... 29

For internal use of Philip Morris personnel only.

For internal use of Philip Morris personnel only.
EXECUTIVE SUMMARYCigarette smoking causes cardiovascular disease, chronic obstructivepulmonary disease, and lung cancer (Centers for Disease Control andPrevention, 2005a). Although cigarette smoke contains thousands ofconstituents that are of biological concern, some of which have been linkedto disease development, the components that are most responsible forspecific cigarette smoking-related diseases and the exposure thresholdsfor disease development are unknown.
Tobacco product manufacturers have developed products with modificationsintended to reduce exposure to tobacco smoke and/or selected tobaccosmoke constituents and, ultimately, disease risk. In 2004, Philip Morris USA,Inc., requested that the Life Sciences Research Office (LSRO) identify thetypes of scientific information necessary for studying the risk reductionpotential of tobacco products; establish criteria to evaluate the scientificinformation, including identification of comparison products; and define areview process for the scientific information.
LSRO’s overall findings and recommendations were published in the reportScientific Methods to Evaluate Potential Reduced-Risk Tobacco Products(2007b). LSRO also published the report Biological Effects Assessment inthe Evaluation of Potential Reduced-Risk Tobacco Products (2007a) whichprovided an in-depth review of assays, models, and biomarkers of humandisease that could be used during premarket evaluation to arrive at scientificconclusions regarding the comparative risks of potential reduced-risk tobaccoproducts (PRRTPs) and conventional cigarettes for smokers who cannot orwill not quit. This report, Exposure Assessment in the Evaluation of PotentialReduced-Risk Tobacco Products, provides findings, conclusions andrecommendations of the Exposure Assessment (EA) State-of-the-ScienceReview Committee, which included scientists with the appropriate expertise.
SPECIFIC OBJECTIVES OF THE EA COMMITTEE
The specific objectives of the EA Committee were to:
• Identify and evaluate methods for assessing exposure of smokers(and other individuals in the smoking environment);
• Identify product characteristics and use behaviors that influencetobacco-product-related exposure; and
• Recommend methods to assess exposure.

2 Exposure Assessment
For internal use of Philip Morris personnel only.
The EA Committee was also asked to identify benchmark cigarettes forPRRTP studies and to consider the strengths, limitations, quality, and quantityof the evidence related to exposure assessment methods when evaluatingthem as tools for assessing PRRTPs. The EA Committee’s conclusions andrecommendations are provided below. In the rest of this report, the EACommittee and other Expert Advisory Committees of the RRRP and LSROstaff will be referred to as LSRO.
CONCLUSIONS AND RECOMMENDATIONS
LSRO concluded that the state-of-the-science is adequate for assessing whethera PRRTP is likely to reduce exposure to tobacco product and smoke toxinscompared with exposure received from using conventional cigarettes. LSROrecommended consideration of product characteristics, studies of tobaccoproduct or smoke chemistry, and studies of biomarkers of exposure as criticalfor assessment of PRRTPs. LSRO took a weight of evidence approach toevaluate the relative usefulness of each assessment method. Biomarker studieswere identified as the approach in which LSRO has the most confidence. Othertypes of studies, such as smoking topography, particle deposition and retention,filter analysis, and microarray studies, can supplement biomarker studies.
PRECLINICAL STUDIES
Product characterization
LSRO recommends that a PRRTP evaluation begin with an analysis of thedifferences in composition, design, and function between the PRRTP andconventional cigarettes. The possible effects of these differences should bedescribed and used to guide later studies of PRRTPs. A consideration ofthe differences between cigarettes is an initial step in determining whetherthe user of the PRRTP or individuals in the use environment will be exposedto lower levels of tobacco smoke toxins compared to smokers of conventionalcigarettes. Smoke chemistry studies should follow the analyses of differencesin product characteristics.
Chemistry of tobacco products and tobacco smoke
Differences in product emissions indicate potential differences in exposurebetween PRRTPs and conventional cigarettes. LSRO recommendsconducting broad analytical screens on smoke from cigarette-like PRRTPsand conventional cigarettes to measure as many constituents as possible.LSRO does not recommend using one smoke constituent as representativeof a class of compounds, because substances in the same chemical class

Executive Summary 3
For internal use of Philip Morris personnel only.
do not necessarily change in the same direction. Product characteristicsshould guide prioritization of analytes, and investigators should provide arationale for selection or exclusion of tobacco smoke constituents for analysis.
LSRO recommends using Kentucky reference cigarettes as analytical controlsand at least two conventional cigarettes, each from a separate tar category,as consumer product sample controls. Although no regimen using a cigarettesmoking machine can predict actual exposure of smokers to tobacco smokeconstituents, LSRO recommends using the smoking machine regimen of theInternational Organization for Standardization and the US Federal TradeCommission (see Section II.2.2.1) and at least one other method (e.g., theMassachusetts method or Canadian “intense” smoking method) to assesssmoke chemistry profiles of PRRTPs and conventional cigarettes. Utilizingmore than one method of smoke generation should provide information aboutthe potential range of smoke constituent exposure from PRRTPs.
LSRO recommends using validated non-standard approaches to assesslevels of substances in smoke when standardized approaches areunavailable. These new or non-standard methods should be described inadequate detail to allow independent replication and should be publishedin a peer-reviewed journal. Tobacco product and smoke chemistry studiesshould guide the clinical studies of tobacco products.
CLINICAL STUDIES
Clinical studies will play a critical role in comparisons of exposure fromPRRTPs and conventional cigarettes. The LSRO report Biological EffectsAssessment in the Evaluation of Potential Reduced-Risk Tobacco Products(2007a) details guidelines for investigators who conduct such clinical studies.LSRO considers biomarker studies to be the most useful type of clinical studiesfor PRRTP assessment. LSRO identified biomarkers of exposure1 used tostudy tobacco products and ranked them in terms of their usefulness, whichwas determined by how well they met the following desirable characteristics:
• Tobacco specificity or a substantial difference between smokers andnonsmokers;
• Intra-individual variation that mirrors variation in smoking behavior;• Existing database on its pharmacokinetics;• Low analytical method variation;• Sensitivity and chemical specificity of analytical method(s); and• Existence of other biomarkers that can confirm the exposure.
1 A biomarker of exposure is a constituent or metabolite that is measured in a biological fluid ortissue and/or is measured after it has interacted with critical subcellular, cellular, or target tissues.

4 Exposure Assessment
For internal use of Philip Morris personnel only.
LSRO also considered the invasiveness of the sample acquisition techniquein ranking biomarkers. Detailed discussions of biomarkers of exposure arefound in Chapter III of this report.
LSRO recommends using a battery of biomarkers to assess PRRTPs.Because of nicotine’s role in smoking maintenance, all PRRTP evaluationsshould include measurement of nicotine and at least five of its majormetabolites, including cotinine. Investigators should select other biomarkerson the basis of information from product characteristics, smoke chemistry,and other studies. The battery of biomarkers chosen should reflect exposureto both particulate and vapor phase smoke components. LSRO identifiedbiomarkers in which it has the most confidence as “Category A” biomarkers.These biomarkers have been sufficiently studied and provide reliableexposure measurements. LSRO also identified “Category B” biomarkers asthose in which it has less confidence but for which there are sufficient datato support their use in exposure studies. LSRO would still recommendinclusion of Category B biomarkers in PRRTP evaluations. Other thannicotine and five of its major metabolites, including cotinine, LSRO doesnot specify a defined set of biomarkers that should be measured for allPRRTP assessments. Categorization of a biomarker as A or B is not meantto be prescriptive (see Section III.4).
LSRO determined that it has the lowest level of confidence in a third groupof biomarkers “Category C”, as measures of tobacco product or smokeexposure (see Section III.4). Category C biomarkers are those that are notconsidered sufficiently reliable for routine use in exposure studies. However,if smoke chemistry or other studies indicate a significant difference in levelsof a specific smoke constituent, biomarkers that measure exposure to theconstituent of interest should be used in evaluation of the PRRTP regardlessof category. Other types of clinical studies, such as smoking topography,filter analysis, and microarray studies, can supplement biomarker studies.
LSRO determined that the state-of-the-science is adequate for studyingexposure assessment but acknowledges considerable limitations in the state-of-the-science. For example, additional biomarkers should be identified,validated, and used to compare exposure from PRRTPs with exposure fromconventional cigarettes.
LSRO’s recommendations about scientific methods for assessing exposureare limited to what is possible at present. Advancements in the state-of-the-science for exposure assessment will influence recommendations aboutexposure assessment of PRRTPs. Exposure assessment is an important

Executive Summary 5
For internal use of Philip Morris personnel only.
step in the evaluation of PRRTPs, but ultimately, the biological effects arisingfrom these exposures play the crucial role in determining risk.

For internal use of Philip Morris personnel only.
IINTRODUCTION
I.1 TOBACCO PRODUCT HARM REDUCTION
Tobacco products intended to decrease morbidity and mortality fromdiseases associated with cigarette smoking by reducing exposure to tobaccoproduct and smoke toxicants are currently on the market as well as underdevelopment. A critical question concerning these products is whether theydo in fact reduce risks of such diseases for individuals who use them andfor other individuals in the environment.
In 1999, the US Food and Drug Administration commissioned the Institute ofMedicine (IOM) to assess the state of the science for determining whethertobacco-based and non-tobacco-based potential reduced-exposure products(PREPs) are likely to reduce tobacco-product-related harm. The IOMconcluded, in part, that “for many diseases attributable to tobacco use, reducingrisk of disease by reducing exposure to tobacco toxicants is feasible,” and that“currently available PREPS have been or could be demonstrated to reduceexposure to some of the toxicants in most conventional tobacco products”(Institute of Medicine, 2001). The report further noted that PREPs “have notyet been evaluated comprehensively enough (including for a sufficient time)to provide a scientific basis for concluding that they are associated with areduced risk of disease compared to conventional tobacco product use.” Sincethe publication of the IOM report, significant efforts have been made to developmethods and frameworks for assessing tobacco products that may pose lowerhealth risks than conventional cigarettes (Hatsukami et al., 2005a, 2006a).
I.2 REDUCED-RISK REVIEW PROJECT:OBJECTIVES AND APPROACH
In 2004, Philip Morris USA, Inc., requested that Life Sciences ResearchOffice (LSRO):
• Identify the types of scientific information needed to assess riskreduction;
• Establish criteria to evaluate the scientific information, includingidentification of comparison products; and
• Define a review process for the scientific information.

Introduction 7
For internal use of Philip Morris personnel only.
Because LSRO’s charge was to assess the risk-reduction potential of tobaccoproducts, LSRO used the term “potential reduced-risk tobacco products”(PRRTPs) and named the project the Reduced-Risk Review Project.
LSRO’s overall findings and recommendations were published in the reportScientific Methods to Evaluate Potential Reduced-Risk Tobacco Products(2007b). LSRO also published the Biological Effects Assessment State-of-the-Science Review Committee’s report Biological Effects Assessment inthe Evaluation of Potential Reduced-Risk Tobacco Products (2007a) whichprovides a detailed review of various assays, models, and biomarkers ofhuman disease that could be used during premarket evaluation to drawscientific conclusions regarding the comparative risks of PRRTPs andconventional cigarettes for smokers who cannot or will not quit. This reportprovides detailed findings and recommendations of the ExposureAssessment (EA) State-of-the-Science Review Committee.
The reason for studying exposure assessment is that epidemiological studieshave related biological effects of smoking to the duration and dose of cigarettesmoke exposure, usually measured as pack-years2 (Doll & Hill, 1954; Doll &Peto, 1976; Doll et al., 2004; Stampfer et al., 2000; Wynder & Graham, 1950).People who quit smoking reduce their number of pack-years and significantlylower their risk of lung cancer compared with continuing smokers. Their riskdeclines further with additional years of abstinence (Peto et al., 2000).
Reducing the number of cigarettes smoked per day by heavy smokers is anapproach used in an attempt to decrease the dose of cigarette smoke toxinsand reduce risks associated with cigarette smoking (Bolliger et al., 2002;Hatsukami et al., 2005b). However, such “cigarette reducers” (former heavysmokers who switch to smoking fewer than 15 cigarettes/day) have significantlyhigher levels of exposure to a tobacco smoke carcinogen than do consistentlight smokers when exposure is measured at the point when cigarettes smokedper day is equal (Hatsukami et al., 2006b). Light smokers are individuals whohave smoked fewer than 15 cigarettes/day for an extended period of time.Compared with continuous heavy smokers, cigarette reducers who decreasecigarette consumption by at least 50% do not lower their risk of hospitalizationfor chronic obstructive pulmonary disease (Godtfredsen et al., 2002b),myocardial infarction (Godtfredsen et al., 2003, 2005), or all-cause mortality(Godtfredsen et al., 2002a). Although these reducers decrease their risk oflung cancer compared with continuing heavy smokers, the risk reduction issubstantially lower than the related smoking reduction, and the risk is higher
2 Pack-year is a unit of measure of smoking exposure. One pack-year represents theconsumption of 20 cigarettes (one pack) per day for one year by one person.
8 Exposure Assessment
For internal use of Philip Morris personnel only.
than the risk to light smokers (Godtfredsen et al., 2005). Other approaches tolowering the dose of cigarette smoke constituents involve altering the cigaretteby means of design changes, such as inclusion of filters, puffed tobacco,reconstituted tobacco sheets, and different blends of tobacco (Burns &Benowitz, 2001).
Cigarette smoke contains a particulate phase and a vapor phase. Theparticulate phase is that part of the smoke retained on a Cambridge filter pad3
when smoke is pulled through the pad (Baker, 1999). Cambridge filter padstrap smoke particles larger than 0.1 μm with 99.9% efficiency (Baker, 1999).The total particulate matter (TPM), which includes alkaloids and water, is alsoknown as wet particulate matter or cigarette smoke condensate. Tar is definedas the particulate matter from which alkaloids (such as nicotine) and waterhave been subtracted (Federal Trade Commission, 1967b). TPM producestumors when applied to the skin of mice (Curtin et al., 2006; Meckley et al.,2004; Wynder et al., 1953, 1957). The vapor phase of cigarette smoke includesvolatile organic compounds and gases of toxicological concern (Fowles &Dybing, 2003) and is associated with lung tumors in mice (Leuchtenberger &Leuchtenberger, 1971; Witschi et al., 1997; Witschi, 2005, 2006).
Filters were added to cigarettes to decrease smoke delivery to smokers.Filter cigarettes were widely introduced in the 1950s and by the 1990saccounted for 97% of cigarettes sold in the US (Hoffmann et al., 2001).Although some epidemiological studies reported a reduced risk for lungcancer for smokers of low-tar or low-yield cigarettes compared with smokersof high-tar cigarettes, overall mortality rates from lung cancer did not declinefor low-tar cigarette smokers to the extent expected (Burns et al., 2001).Furthermore, the influence of filter cigarettes on mortality differed in the UKand the US. The reduction in mortality from lung cancer for men after filtercigarettes were introduced occurred earlier and the decline was greater inthe UK than in the US (Burns et al., 2001; Peto et al., 2000).
One factor that likely contributed to this lower than expected decline inmortality rate from lung cancer was an altered puffing behavior when smokersswitched from smoking high-yield cigarettes to smoking low-yield cigarettes(Peach et al., 1986; Robinson et al., 1983). In support of this idea, uptake ofcigarette smoke constituents for smokers of low-tar cigarettes wasdetermined to be equal to uptake for smokers of high-tar cigarettes(Hecht et al., 2005). Some smokers also blocked filter ventilation holes while
3 A Cambridge filter pad is “a glass fiber filter stabilized by an organic binder” originallymade by the Cambridge Filter Corporation in Syracuse, NY. It is used in the FTC methodto separate the vapor and particulate phases of cigarette smoke.
Introduction 9
For internal use of Philip Morris personnel only.
smoking. Filter ventilation was intended to dilute MS, reducing the amountof smoke in the burning cone of the cigarette (Kozlowski & O’Connor, 2002).Filter ventilation holes are not blocked when low-yield cigarettes are machine-smoked according to a standard protocol for testing cigarettes, the USFederal Trade Commission (FTC) protocol (see Section II.2.2.1).
Lee and Sanders (2004) reviewed whether any reduced risk associated withswitching to lower tar products is decreased when relative risks are adjustedfor the number of cigarettes smoked per day. Based on an examination ofepidemiological data they reported that the risk reductions for low tar cigarettesmokers were maintained irrespective of gender, race, study location period,study design, and for adjusted and unadjusted estimates.
The natural experiment on the effect of switching to lower tar cigarettes onmortality underscores the need for an integrated approach to assessingexposure to tobacco product and smoke constituents, one that involveschemical analyses, clinical studies, and other types of studies.
Elimination of all toxicants from cigarette smoke is not possible. PRRTPsare intended to reduce disease risk by decreasing the dose of smokeconstituents for individuals who cannot or will not quit smoking cigarettes orfor those who are in the smoking environment.
The specific objectives of the EA Committee were to:• Identify and evaluate methods for assessing exposure of smokers
(and other individuals in the smoking environment);• Identify product characteristics and use behaviors that influence
tobacco-product-related exposure; and• Recommend methods to assess exposure.
The EA Committee considered the strengths, limitations, quality, and quantityof the evidence related to these methods when evaluating them as tools forassessing PRRTPs.
I.3 SMOKING-RELATED EXPOSURES
Some tobacco products generate smoke when used as intended and somedo not. PRRTPs include modified cigarettes, such as those incorporatingnovel filters, genetically modified tobacco, or tobacco grown or processedunder altered conditions; cigarette-like products that mostly or only heattobacco and therefore yield significantly lower levels of combustion orpyrolysis products in aerosols they produce compared to conventional
10 Exposure Assessment
For internal use of Philip Morris personnel only.
cigarettes and smokeless tobacco products. Therefore, exposures differdepending on the type of PRRTP. This report focuses on exposures fromsmoked tobacco products.
Cigarette smoking generates mainstream smoke (MS), sidestream smoke(SS), and environmental tobacco smoke (ETS). MS is drawn by smokersfrom the butt end of a cigarette into the mouth. SS is emitted directly intothe air from the burning end of a cigarette largely during the smolder intervalbetween puffs. Although SS and MS contain essentially the sameconstituents, SS has higher absolute quantities of most smoke constituentscompared with MS (Baker & Proctor, 1990; Guerin et al., 1992). One reasonfor this is the higher burning temperature during smoke inhalation (U.S.Environmental Protection Agency, 1992). Some smoke constituents occurpredominantly in the particulate phase of smoke, some partition mostly inthe vapor phase of smoke, and others occur at similar levels in both phases.The smoke constituent’s primary phase may differ for different types ofsmoke. For example, nicotine is found primarily in the particulate phase ofMS but mostly in the vapor phase of ETS (Baker, 1999). The relative yieldper cigarette of compounds in MS and SS varies for smoke constituents.
ETS is defined as a mixture of aged diluted SS and exhaled MS. SS releasedfrom the tip of the burning cigarette is the major contributor to ETS (Baker &Proctor, 1990), accounting for more than 50% of particulate phaseconstituents and almost all vapor phase constituents (Baker, 1999; U.S.Environmental Protection Agency, 1992).
Exposures of concern from smoked tobacco products include MS andETS constituents; therefore, exposure reduction relates to decreasedexposure to MS and ETS constituents for the smoker and to ETS forother individuals in the smoking environment.

For internal use of Philip Morris personnel only.
II.1 PRODUCT CHARACTERIZATION
Manufacturers of potential reduced-risk tobacco products (PRRTPs) haveemployed diverse strategies intended to reduce exposure to toxicants foundin the smoke from conventional cigarettes. These include modifyingcomposition, design, engineering, and manufacturing of the tobacco product(World Health Organization, 2003b). Table II-1 provides examples of smokedPRRTPs, their modifications, and their market status in the US. Assessingstructural, chemical, and functional differences between PRRTPs andconventional cigarettes is a useful starting point for PRRTP evaluation.Consideration of the possible effects of identified PRRTP modifications ontobacco-product-related exposure should guide the design of further studies.Examples of PRRTP modifications and some implications for exposureassessment are described below.
PRRTPs that expose tobacco to a lower temperature, such as Accord® andEclipse®, could heat the tobacco instead of burning it (ECLIPSE ExpertPanel, 2000; Stabbert et al., 2003). These PRRTPs may generate lowerlevels of combustion and pyrolysis products than tobacco-burningconventional cigarettes. Exposure-related concerns about such productsinclude whether it in fact produces significantly lower levels of pyrolysis andcombustion products in mainstream smoke (MS) and environmental tobaccosmoke (ETS) compared with conventional cigarettes, whether it producessignificantly higher levels of substances not found in smoke from conventionalcigarettes, and whether levels of biological markers that measure exposureto smoke constituents after PRRTP use differ significantly from levelsoccurring after conventional cigarette use.
Inclusion of a modified filter in a cigarette may reduce levels of targetedsmoke constituents compared with levels found for conventional cigaretteswith standard filters. Evaluation of a PRRTP with a modified filter shouldexamine whether amounts of targeted smoke constituents declinesignificantly, levels of other smoke constituents increase significantly,biomarkers of exposure reflect lower amounts of targeted smoke constituents,
IIASSESSMENT OF EXPOSURE FROMPOTENTIAL REDUCED-RISK TOBACCOPRODUCTS

12 Exposure Assessment
For internal use of Philip Morris personnel only.
other biomarkers reflect increased levels of other smoke constituents, andusers are exposed to significant levels of filter components.
Product design and composition can also affect ETS exposure. A PRRTPthat produces substantially lower sidestream smoke (SS) than conventionalcigarettes has the potential for reducing ETS levels. In contrast, a PRRTPthat produces lower levels of MS constituents may not necessarily producelower levels of SS constituents. Cigarettes with filters that reduce MSconstituent yields may have no effect on SS yields of the same constituents(U.S. Environmental Protection Agency, 1992).
aPremier® was an earlier version of Accord®.
TSNAs: tobacco-specific nitrosamines (suspected human carcinogen)
Table II-1. Examples of Potential Reduced-Risk Tobacco Products
PRRTP Modification US Market Status Smoked Products Accord®/Premier®a Heats but does not burn tobacco.
Heating occurs only when the cigarette is puffed while inserted into a microchip-controlled, battery-operated, hand-held device (Philip Morris USA, 2001)
In test market: Richmond, VA
Advance® Includes a 3-part “Trionic” filter containing cellulose acetate, a carbon compound, and an ion exchange resin. Contains Star-cure™ tobacco, which has reduced levels of TSNAs (Brown & Williamson Tobacco, 2002)
Not on the market
Eclipse® Primarily heats tobacco. “Eclipse is designed to burn only 3% as much tobacco as other cigarettes” (R.J. Reynolds Tobacco Company, 2006)
On the market
Omni® Contains tobacco cured under modified conditions and treated with catalysts to reduce levels of carcinogens; uses a carbon filter (Vector Tobacco Inc., 2001a,b)
Not on the market
Quest® Contains genetically modified tobacco lacking an important gene for nicotine synthesis. (Vector Tobacco Inc., 2006)
On the market: NY, NJ, PA, OH, IN, IL, MI and AZ
Marlboro UltraSmooth® Cigarette contains a novel carbon filter (Beran, 2005)
In test market: Atlanta, GA; Tampa, FL; and Salt Lake City, UT

Assessment of Exposure from Potential Reduced-Risk Tobacco Products 13
For internal use of Philip Morris personnel only.
A significant behavioral component is associated with ETS exposure.Exposure can increase if smoking continues for extended periods, if morepeople smoke, or if toxicants in SS or exhaled MS increase (World HealthOrganization, 2003b).
II.2 CHEMISTRY
Assessment of tobacco smoke chemistry is a useful next step in PRRTPevaluation.
II.2.1 Control Tobacco Products
An important element of product chemistry studies is defining appropriatetobacco products for control and comparison purposes.
II.2.1.1 Kentucky reference cigarettes
Kentucky reference cigarettes, developed jointly by the US National CancerInstitute, the Agricultural Research Service of the US Department ofAgriculture, and the Tobacco and Health Research Institute of the Universityof Kentucky, serve as research standards for chemical and biological studiesof cigarettes (Davies & Vaught, 1990). These cigarettes are designed toreflect characteristics of cigarettes with various tar levels. The Kentuckyreference 3R4F cigarette (which replaced 1R4F and 2R4F cigarettes whensupplies were exhausted) approximates the tar delivery of the sales-weightedaverage of US low-tar cigarettes. The Kentucky reference 1R5F cigaretteapproximate ultra-low-tar cigarettes (Chepiga et al., 2000).
II.2.1.2 Conventional cigarettes
Conventional cigarettes are commercial cigarettes that incorporate materialsand designs typical of those that have been used in cigarette manufacturingfor a number of years (Counts et al., 2006), but they do not constitute astatic group. Hoffmann and Hoffmann (2001) described design changes incigarettes now available, such as inclusion of cellulose acetate filters (withor without perforations), charcoal filter tips, additives, or porous cigarettepaper; and changes in physical parameters of cigarettes (e.g., length,circumference, and width of cut of the tobacco filler). Manufacturers havealso included different types of tobacco (e.g., flue-cured, air-cured, light air-cured, dark air-cured, or sun-cured) and have incorporated reconstituted orexpanded tobacco in cigarettes (Hoffmann & Hoffmann, 2001).

14 Exposure Assessment
For internal use of Philip Morris personnel only.
Conventional cigarettes fall into three categories based on nicotine and taryields when cigarettes are machine-smoked according to the US FederalTrade Commission (FTC) method: full flavor (“regular”); full flavor, low tar(“light”); and ultra-low tar (“ultra-light”). The amount of tar per cigaretteproduced by each cigarette type is higher than 14.5 mg for regular, 6.5–14.5mg for light, and less than 6.5 mg for ultra-light (Chepiga et al., 2000).
A recent toxicological assessment in a comparative subchronic inhalationstudy of 1R4F and 2R4F reference cigarettes indicated that there was nobiologically significant difference when rats were exposed to smoke fromeach type of cigarette (Higuchi et al., 2004). MS yields of total particulatematter (TPM) and nicotine were 11.7 mg TPM and 0.83 mg nicotine percigarette for the 1R4F cigarette and 9.2 mg TPM and 0.75 mg nicotine percigarette for the 2R4F cigarette.
II.2.1.3 Recommendations for control cigarettes
For a PRRTP evaluation, the Life Sciences Research Office (LSRO)recommends comparing smoke constituent yields for a PRRTP with at leastone Kentucky reference cigarette and at least two conventional cigarettes.Kentucky reference cigarettes serve as analytical controls. LSRO does notrecommend specific control conventional cigarettes for PRRTP studies butdoes recommend that investigators provide their rationale for selecting thecontrol cigarettes. The selection of specific conventional control cigarettesshould be based on study design and goals (e.g., researchers may want touse each subject’s brand of cigarettes as a control product). Conventionalcigarettes and PRRTPs should be tested concurrently.
II.2.2 Mainstream Tobacco Smoke
A recent review by Borgerding and Klus (2005) summarized some principalissues associated with smoke chemistry analyses, and that review has guideddevelopment of this section.
II.2.2.1 Cigarette smoking machine parameters
The FTC developed a cigarette smoking machine protocol for comparingsmoke yields when cigarettes are smoked using the same machine settingunder the same prescribed conditions (Federal Trade Commission, 1967a,1967b, 1980). The FTC method, implemented in 1967, stipulates howcigarettes are to be sampled and conditioned before being machine-smoked,defines the machine parameters to be used (puff volume = 35 ml, puff duration= 2 seconds, interpuff interval = 60 seconds), and specifies the butt length towhich the cigarette should be smoked (the larger of 23 mm or the length of

Assessment of Exposure from Potential Reduced-Risk Tobacco Products 15
For internal use of Philip Morris personnel only.
the filter and overwrap + 3 mm). The FTC method also stipulates methods forMS collection, analysis for smoke constituents, and chemical measurementsto be obtained for nicotine, carbon monoxide (CO), and tar. The FTC laterproposed using both the “lower tier” existing protocol and a new “upper tier”protocol (55 ml puff volume, 2 second puff duration, 30 second puff interval),but the proposal was not adopted (Federal Trade Commission, 1997).
The International Organization for Standardization (ISO) developed astandard method for assessing smoke yields that specifies the same puffvolume, puff duration, and interpuff interval as the FTC method. The ISO4387 method requires different smoking machine equipment, productsampling, and product conditioning methods than the FTC method(Borgerding & Klus, 2005).
The Commonwealth of Massachusetts and the State of Texas mandate athird cigarette smoking machine protocol with the intent to predict nicotineintake of the average smoker (Massachusetts Department of Public Health,2005; Texas Administrative Code, 1998). These methods both define a largerpuff volume (45 ml) and shorter puff interval (every 30 seconds) but thesame puff duration (2 seconds) as the FTC method.
Cigarette ventilation is an engineering feature aimed at reducing tar yield. Itcan be achieved by using a porous wrapping paper on the cigarette so thatsmoke can be mixed with air, or by including a ring of ventilation holes in thecigarette’s paper wrapper. However, some cigarette smokers negate or reducesmoke dilution by covering ventilation holes with their fingers during puffing(Kozlowski et al., 1996; Kozlowski & O’Connor, 2002; Zacny et al., 1986).Blocking these holes can lead to no differences in exposure to smoketoxicants between ventilated and unventilated cigarettes, or even to increasedtoxicant exposure for cigarettes with ventilation holes (Djordjevic et al., 2000;Kozlowski & O’Connor, 2004).
In an attempt to address potential alterations in smoke exposure related tothis product use behavior, the Massachusetts-Texas method stipulatesblockage of 50% of filter ventilation holes during machine smoking ofcigarettes.
The Canadian federal government requires manufacturers of cigarettes soldin Canada to test smoke from their cigarettes according to both the ISO4387 method and a “maximum emission” testing protocol intended to “providedata that reflects the emissions that are actually available to the consumer”(Health Canada & Losos, 1998). This maximum emission testing protocol

16 Exposure Assessment
For internal use of Philip Morris personnel only.
mandates a 55-ml puff volume and a 2-second puff every 30 seconds, with100% blocking of cigarette ventilation holes (Health Canada, 2000a).
Bernstein (2004) reviewed studies that examined the effects of cigarettedesign and smoking behavior on smoke particle size. He concluded that thesize range of particles in smoke from cigarettes with or without filters andwith ventilation holes open or blocked are the same. While varyingconcentrations of smoke particles are taken into the mouth, the subsequentinhalation pattern does not seem to change significantly during smoking ofdifferent types of cigarettes and under different smoking conditions. As aresult, the smoke particle deposition pattern within the lung is not likely tochange significantly when comparing lower delivery or ventilated cigarettesto higher delivery or non-ventilated cigarettes.
Many studies have shown that regular smokers of cigarettes that yield lowerlevels of nicotine and tar when machine-smoked according to the FTCregimen, tend to take larger and more frequent puffs (Benowitz, 2001; Bridgeset al., 1990; Djordjevic et al., 1997; U.S. Department of Health and HumanServices, 1988). Kozlowski and O’Connor (2000) developed a“compensatory” approach to machine smoking of cigarettes that betterapproximates human smoking behavior. For example, light cigarettes wouldbe machine-smoked more intensely than regular cigarettes, because manysmokers compensate for lower levels of nicotine and tar in light cigarettes(Voncken et al., 1998) by more intense smoking (Kozlowski & O’Connor,2000). Other attempts to develop more realistic cigarette smoking machineregimens involve studying human smoking behavior and then developingmachine regimens that mimic average smoking behavior of one smoker or agroup of smokers such as the “human mimic” protocol (Hammond et al.,2006).
A recent study by Hammond et al. (2006) compared the total puff volumes,and nicotine, tar, and CO yields from cigarettes when they were machine-smoked according to five testing regimens: ISO, Massachusetts/Texas,Canadian “intense”, compensatory, and human mimic. These investigatorsrecorded smoke volumes and cigarette puffing behavior for 51 cigarettesmokers during three smoking trials in a 2-month period. Each smoking triallasted 1 week. During Trials 1 and 2, which were 6 weeks apart, subjectssmoked their regular brand of cigarettes each day for 5 days through aClinical Research Support System (CreSS) micro-smoking apparatus, whichrecorded puff volume, puff count, puff duration, peak flow, interpuff interval,time, and date. For machine-smoked cigarettes, investigators blocked 50%of cigarette ventilation holes to approximate the percentage blocked by

Assessment of Exposure from Potential Reduced-Risk Tobacco Products 17
For internal use of Philip Morris personnel only.
smokers in a study by Kozlowski and coworkers (1989). During Trial 3, whichtook place the week after Trial 2, subjects smoked either their usual brandor a lower yield cigarette with the same length and diameter as their usualbrand. At the end of the week, investigators measured levels of cotinine, amajor nicotine metabolite, in subjects’ saliva samples. This study found thatsmokers’ total puff volumes (product of the total number of puffs and meanpuff volume) were significantly higher after the switch to the lower tarcigarettes compared with those found when subjects smoked their regularbrand of cigarettes. Hammond et al. (2006) also used a linear regressionmodel to study the association between smoking machine yields andsmokers’ salivary cotinine levels. They “adjusted for measure of intake anddemographic variables” and found that the human mimic protocol was theonly regimen that showed a significant association with salivary cotinineconcentration (p = 0.02, r 2 = 0.51, where r 2 is the coefficient of determination).
The authors noted a number of limitations of the study. Only smokers whoseregular brand of cigarettes fell within a specific tar range participated;therefore, the study sample did not represent all smokers. Also, the averagenumber of puffs taken by smokers differed from the average number takenby the machine during the human mimic protocol. Finally, no informationabout ventilation hole blocking was obtained from human smokers (Hammondet al., 2006).
II.2.2.1.1 Emerging cigarette smoking machine protocols
The WHO Study Group on Tobacco Product Regulation (TobReg)recommends generating smoke according to the ISO/FTC protocols inaddition to another protocol during which the cigarette is smoked moreintensely (WHO Study Group on Tobacco Product Regulation (TobReg),2004). The recommended intense protocol mandates a 55-ml puff volume,30-second puff interval, and 2-second puff duration, with 100% of filterventilation holes blocked while the cigarette is smoked down to the filterplus 3 mm (same as the Canadian intense method). However, TobRegacknowledged that changes in the more intense protocol may be necessaryif smokers change their smoking patterns or the intense protocol no longergenerates what is considered to be the maximum possible exposure for thesmoker.

18 Exposure Assessment
For internal use of Philip Morris personnel only.
An ISO Working Group (ISO/TC126/WG9) considered developing a smokingmachine regimen that will better reflect human smoking behavior (Hammondet al., 2007). They evaluated four alternative smoking regimens as detailedin Table II-2. The Working Group recently concluded that none of the potentialalternative smoking regimens adequately predicted human exposure totobacco smoke constituents and recommended additional work to identifyalternative smoking machine regimens (Hammond et al., 2007).
II.2.2.1.2 Recommendations for cigarette smoking machine protocols
LSRO recommends using at least two smoking machine regimens togenerate smoke from PRRTPs and control cigarettes. Use of multiple smokegeneration methods approximates a range of human puffing behavior.Because of the availability of extensive historical data on cigarette smokeyields of substances generated by the FTC cigarette smoking machineprotocol, LSRO recommends the inclusion of this method. A smokingmachine protocol based on actual human smoking of PRRTPs (a smokingtopography study) can provide additional information about potentialtobacco smoke exposure (Djordjevic et al., 2000). PRRTPs containingsignificantly higher or lower levels of nicotine than control cigarettes couldprove especially appropriate for such a study because of potentially alteredcigarette puffing behavior and resulting differences in exposure to smokeconstituents. However, as stated by the FTC (1967b), no standard methodof machine-smoking cigarettes can reflect exposure of an individual smokeror population of smokers because of variations in intra- and inter-individualsmoking behavior.
aEach smoking machine regimen has a puff duration of 2 seconds, and a butt length offilter + 8mm. (Adapted from Hammond et al. 2007).
Table II-2. Alternative Smoking Regimens Considered by the ISOWorking Group (ISO/TC126/WG9)
Possible regimena
Puff volume (ml)
Puff frequency (s)
Blocked filter percentage
Flow rate (ml/s)
Option A 55 30 50 27.5
Option B 60 30 50 30
Option C 45 30 100 22.5
Option D 55 30 100 27.5

Assessment of Exposure from Potential Reduced-Risk Tobacco Products 19
For internal use of Philip Morris personnel only.
II.2.2.2 Selection of smoke analytes
Fresh MS contains more than 4,000 constituents (Baker, 1999), some ofwhich are categorized as toxic to humans (Smith et al., 1997, 2000c, 2001;World Health Organization, 2004). Lists of smoke toxicants have beenpublished in the scientific literature (Hoffmann & Hoffmann, 1998, 2001;Rodgman & Green, 2002; Smith et al., 1997; U.S. Consumer Product SafetyCommission, 1993; U.S. Department of Health, Education, and Welfare, 1964;World Health Organization, 1986). Various groups of investigators havemeasured selected smoke toxicants from these lists (ECLIPSE Expert Panel,2000; Hoffmann & Hoffmann, 1998).
The specific chemicals or classes of chemicals responsible for cigarettesmoking-related diseases are not known, and lists of toxicants are likelyincomplete (Rodgman & Green, 2002). Furthermore, available analyticalmethodology does not allow for detection and quantification of all identifiedsmoke analytes. Aging of tobacco smoke and type of tobacco used alsoaffect smoke composition.
II.2.2.2.1 Recommendations for selection of smoke analytes
Because the specific toxicants in cigarette smoke causing smoking-relateddiseases have not been identified, LSRO recommends measuring as manygas and particulate phase smoke constituents as possible from PRRTP andcontrol cigarette smoke to determine whether analyte yields for these productsdiffer significantly. LSRO considered the advantages and disadvantages ofdeveloping a list of required smoke analytes. A list of recommended smokeanalytes may allow for better comparison between smoke constituent yieldsof PRRTPs and control cigarettes. The Centre de Coopération pour lesRecherches Scientifiques Relatives au Tabac (CORESTA), an organizationfounded to “promote international cooperation in scientific research relativeto tobacco,” or a similar organization could develop such a list. LSRO alsoconsidered recommending that investigators measure the “Hoffmannanalytes,” an evolving list of smoke constituents developed by DietrichHoffmann and his colleagues (Hoffmann & Hoffmann, 1998, 2001). However,some regulatory authorities consider only a subset of these analytes to playa role in diseases associated with cigarette smoking. Although the Hoffmannanalytes may be important to smoking-related diseases, they represent onlya fraction of toxic smoke components, and methods do not exist for measuringall these analytes (Baker, 2006). A potential disadvantage of any list is thatinvestigators may interpret it as representing the only smoke analytes thatrequire analysis. Thus, LSRO considers it best to recommend measurementof as many smoke constituents as possible.

20 Exposure Assessment
For internal use of Philip Morris personnel only.
Product design and composition should guide the prioritization of smokeanalytes, and investigators should provide the rationale for selection orexclusion of analytes. LSRO does not recommend using selected smokeconstituents as surrogate compounds to reflect changes in levels of entireclasses of compounds because such compounds may not accurately reflectchanges for all members of a class. For example, formaldehyde levels insmoke from an electrically heated cigarette were higher than those in smokefrom a conventional cigarette, but levels of other aldehydes (acetaldehyde,acrolein, and propionaldehyde) were significantly lower (Stabbert et al., 2003).Therefore, formaldehyde would not be a good representative of otheraldehydes.
If substances not previously detected in smoke from cigarettes are identifiedin smoke from the PRRTP, an approach to addressing the novel compoundsmay involve determining the identity of the substance, measuring levels ofthe substance in smoke, considering structure-activity relationships, anddetermining whether the change in levels of the substance is likely to be ofbiological concern. Structure-activity relationships reflect associationsbetween chemical (sub)structures of compounds or classes of compoundsand biological effects of chemicals with that substructure (Simon-Hettich etal., 2006). Information from in vitro and in vivo studies and clinical trials isthe basis of these relationships (Simon-Hettich et al., 2006). It is importantto weight structure-activity relationships appropriately, because similarity ofchemical structure does not necessarily indicate similar toxicity (Simon-Hettich et al., 2006).
II.2.2.3 Selection of analytical methods
Standardization of analytical methods can address concerns that differencesin smoke analyte yields may be due to variations in analytical methods ratherthan to differences in product design. ISO methods undergo extensive intra-and inter-laboratory validation and are updated periodically (InternationalOrganization for Standardization, 2000c). ISO methods for determining tar,nicotine, and CO levels are the only standard methods that have been publishedto date (International Organization for Standardization, 1995, 1999, 2000a,2000b). However, ISO is developing methods for measuring additional Hoffmannanalytes in smoke, and CORESTA has published recommended methods forquantifying benzo[a]pyrene and tobacco-specific nitrosamines (TSNAs) in MS(CORESTA, 2004, 2005).
Official methods for cigarette smoke analysis were developed by Health Canada.In contrast to CORESTA/ISO methods, Health Canada methods did not undergointer-laboratory validation and therefore were not assessed for repeatability or

Assessment of Exposure from Potential Reduced-Risk Tobacco Products 21
For internal use of Philip Morris personnel only.
reproducibility when instituted in 2000 (Borgerding & Klus, 2005; Rickert & Wright,2002). Rickert and Wright (2002), using the Kentucky reference 1R4F cigarette,assessed the variability of Health Canada methods for 45 Hoffmann analytes.This 8-month single-laboratory study revealed that the coefficient of variationfor Hoffmann analytes ranged from 5% to 15%, with a few analytes rangingbetween 20% and 80%. Considerable variability in measurements wasreported for smoke from the 1R4F cigarette when different laboratoriesmeasured smoke constituents with their various in-house methods (Bakeret al., 2004b; Purkis et al., 2003).
LSRO recommends publication, in appropriate peer-reviewed journals, ofnew or modified methods for assessing smoke chemistry at the same levelof detail as that used in a typical standardization process. Such methodscan serve to evaluate smoke yields from PRRTPs and conventional cigarettes.
II.2.2.3.1 Recommendations for selection of analytical methods
Standardized analytical methods are ideal for comparing cigarette smokeyields within and between laboratories, but validated standardized methodsdo not exist for all smoke analytes. One disadvantage of internationallystandardized procedures is that they are slow and focus on only a fewselected compounds. In the absence of standard methods for measuringsmoke constituents, LSRO recommends use of any validated method tomeasure smoke constituent yields from control cigarettes and PRRTPs. TheInternational Conference on Harmonisation is one of a number of entitiesthat have developed guidelines for validation of analytical methodologies(International Conference on Harmonisation, 1996). The use of referencestandards and controlling for blanks and spikes in recoveries are importantfeatures of such studies. Investigators should note whether they usedstandard or non-standard methods and provide the rationale for methodselection. LSRO further recommends publication, in peer-reviewed literature,of non-standardized analytical methods used to analyze smoke constituentyields in extensive detail.
II.2.2.3.2 Emerging analytical methods and research gaps
The most common smoke analysis techniques are gas and liquidchromatography. With development of new methods and modification ofexisting methods, it is likely that, in the future, substances that are not nowdetectable in smoke will become measurable. Assay of such additional smokeconstituents is encouraged as technology improves and new and bettervalidated analytical methods become available.

22 Exposure Assessment
For internal use of Philip Morris personnel only.
Analytical methods for measuring tobacco and smoke chemistry in nearreal-time have been reported. Faster analytical methods, higher throughputmethods, and techniques that allow more detailed analyses are beingdeveloped (Adam et al., 2006; Mitschke et al., 2005). Mitschke et al. (2005)described using time-of-flight mass spectrometry with laser-basedphotoionization methods for time-resolved on-line analysis of MS, whichallows puff-by-puff analyses of smoke constituent yields and can measure alarge number of smoke constituents. The study showed that yields of smokeconstituents vary throughout the smoking of a cigarette. Yields of someconstituents gradually increase at a constant rate. Others are produced inlarge amounts during the first puff, with the second puff containing a markedlylower yield, and successive puffs having gradually increasing yields. A thirdgroup of smoke constituents shows an inconsistent pattern of yields. Suchcompounds may, for example, decrease slowly in the initial 3 puffs and thenincrease slowly in the following puffs.
Methods for examining large arrays of compounds (e.g., principal componentanalysis and hierarchical cluster analysis) and instuments with increasedsensitivity are now in use and have been reported (Adam et al., 2007; Crispinoet al., 2007). One challenge associated with expanding technology is theinterpretation of results. LSRO recommends emphasizing the constituentspresent in the largest amounts in smoke that are known to have biologicalactivity.
II.2.2.4 Other mainstream tobacco smoke exposures
Tobacco product users are potentially exposed to various types of particlessuch as hardened adhesives, flakes of packaging and cigarette tipping inks,hardened casings, fibers from cigarette papers and cigarette packs, andtobacco fines (e.g., stem fibers, lamina, and reconstituted tobacco) (Agyei-Aye et al., 2004). Investigators should describe potential exposures toparticles or shards during use of PRRTPs. LSRO recommends both physicaland chemical characterizations of the tobacco smoke aerosol. A comparisonof the amount and composition of the TPM from the PRRTP and controlcigarettes would also provide useful information.
II.2.3 Sidestream Tobacco Smoke
Because SS is the major contributor to ETS, investigators have measuredSS to provide information about ETS composition. However, SS should notbe taken to reflect ETS because the composition and physical characteristicsof SS changes as the smoke ages, is diluted by air, and is mixed with exhaledMS. A major challenge associated with SS studies is collection of SS. Drafts

Assessment of Exposure from Potential Reduced-Risk Tobacco Products 23
For internal use of Philip Morris personnel only.
and convection can disperse SS from the site of smoke generation as thecigarette burns (Proctor et al., 1988).
II.2.3.1 Sidestream smoke collection
Many devices for SS collection have been described in the literature(Brunnemann & Hoffmann, 1974; Johnson et al., 1973; Neurath & Ehmke,1964; Proctor et al., 1988; Sakuma et al., 1983). Proctor et al. (1988) describeddesign criteria for an SS collection apparatus. The most useful collectionmethods do not alter the normal combustion of the cigarette during puffingor smoldering. To accomplish this, the apparatus must permit the cigaretteto burn at ambient temperature in an atmosphere of air. With the ISO methodfor smoke generation, the airflow range should be 4–7 linear feet per minute.The sampling device should allow easy recovery of escaped smokecomponents and should be readily adaptable to a standard cigarette-smokingmachine. The apparatus should permit multiple measurements of MS andSS at an appropriate rate and allow collection of both phases of smoke.Automation of insertion and lighting of the cigarette should be accomplishedeasily. In addition, measurement of cigarette butt length is recommended. Ifyields of more than one cigarette are measured, the total yield should be thesum of yields for several cigarettes (Proctor et al., 1988).
Proctor et al. (1988) designed a fishtail chimney for SS collection, whichserved as the basis for the chimney for SS collection reported by Shi et al.(2003). Shi et al. (2003) collected smoke from two different cigarettes andmeasured ammonia, ethylene, and nitric oxide. The chimney described byShi et al. (2003) was positioned around the cigarette with the open bottomof the container approximately 3 mm above the surface of a table to minimizesmoke escaping into the environment. The collection device was connectedto a fast-response infrared spectrometer using pulsed quantum cascadelasers. This method permitted real time measurements of gases in SS andMS and showed that levels of these substances differ prior to, during, andafter puffs.
II.2.3.2 Selection of sidestream smoke analytes
Health Canada recommended measurement of specific SS analytes andpublished recommended analytical methods (Health Canada, 2000b).Distribution of gas and particulate phase smoke constituents can changedepending on product characteristics (Guerin, 1987). Although filters mayreduce MS yields of smoke constituents, SS yields may be unaltered (Adamset al., 1987). Because SS is the major contributor to ETS, a PRRTP thatproduces significantly lower levels of SS has the potential to reduce ETSexposure.

24 Exposure Assessment
For internal use of Philip Morris personnel only.
II.2.4 Environmental Tobacco Smoke
Current technology allows MS and SS chemistry analyses. SS analyses canbe performed after analysis of MS, if the results of the MS studies indicatethe potential for reduced exposure or reduced risk in smokers. Room levelsof some ETS tracers such as ultraviolet-absorbing particulate matter,fluorescent particulate matter, solanesol, nicotine, and CO have beenmeasured (Daisey, 1999). Environmental chambers that allow control overtemperature, relative humidity, and air circulation, and workplace offices havebeen used for ETS studies (Jenkins et al., 2001; Suarez et al., 2005). Studiesproviding evidence are necessary to support a claim of reduced ETS exposure.
II.2.4.1 Human-smoker-generated ETS
Chemical exposure from human-smoker-generated ETS has been assessedin various unpublished studies; these are discussed in cited references inBaker and Proctor (1990) and Roethig et al. (2005). Using methods basedon light scattering of particles and infrared spectrometry of gases, Roethiget al. (2005) measured respirable suspended particulates (RSP), CO, andtotal volatile organic compounds (TVOC) for 15 minutes before, 1 hour during,and 1 hour after smoking. Measurements were made at two locations in theroom after smokers exited the room. No smoking and electrically heatedcigarette smoking systems (EHCSSs) which are marketed as Accord® andOasis®, produced levels of RSP 90% lower than those produced byconventional cigarettes. RSP measurements in the no-smoking group locationwere 95% lower than levels in the room where conventional cigarettes weresmoked. Room air where no smoking occurred or EHCSS were smokedcontained 40–50% lower levels of TVOCs compared with levels found aftersmoking conventional cigarettes (Roethig et al., 2005). CO was not detectedin the no smoking and EHCSS rooms.
II.2.5 Relative Contributions of Tobacco Product and SmokeChemistry to Assessing PRRTPs
Smoke chemistry analysis is an important early step in evaluation of a PRRTPand can be useful for characterizing differences between PRRTPs and controlcigarettes. Because of individual variation in human puffing behavior, areduction in the cigarette smoking machine yield of smoke analytes for thePRRTP compared with that for conventional cigarettes will not necessarilytranslate into either reduced exposure for users of the PRRTP or a reductionin risk of cigarette smoking-related diseases. Although smoke chemistryalone cannot predict internal exposure of individuals to substances in smoke,it can guide further testing by, for example, indicating which biomarkers maybe important to measure.

Assessment of Exposure from Potential Reduced-Risk Tobacco Products 25
For internal use of Philip Morris personnel only.
Constituent analyses can determine whether yields of smoke analytes insmoke from control cigarettes differ significantly from yields for a PRRTPand whether a PRRTP exposes people to substances not measured in smokefrom control cigarettes. LSRO recommends conducting and describingappropriate statistical analyses to determine whether smoke constituentyields from PRRTPs and control cigarettes differ significantly. The power ofthe study is an important consideration. Investigators should evaluate, interms of possible increases in exposure to users, any significant increase inPRRTP smoke constituent yields compared with appropriate reference andcommercially available cigarettes. Analysis of exposure to particles or shardsis a component of a PRRTP evaluation.

For internal use of Philip Morris personnel only.
IIILife Sciences Research Office (LSRO) previously described generalconsiderations for clinical study design for potential reduced-risk tobaccoproduct (PRRTP) evaluations (Life Sciences Research Office, 2007a).
III.1 SELECTION OF BIOLOGICAL SAMPLES
An important consideration is selection of the appropriate biological samplefor biomarker measurement. Biomarkers have been measured in urine, saliva,blood, hair, exhaled breath condensate (EBC), toenail, exhaled air, and otherbiological materials. Measurement of biomarkers in each type of biologicalmatrix has advantages and disadvantages, some of which are discussedbelow (Al Delaimy et al., 2002; Al Delaimy, 2002; American Conference ofGovernmental Industrial Hygienists, 2005).
III.1.1 Blood
According to the American Conference of Governmental Industrial Hygienists(2005), blood sampling has the advantage of low inter-individual variation inblood constituents that affect the amounts of most blood determinants. Otheradvantages include simplicity of the sampling technique and relatively fewchances for contamination. Disadvantages include invasiveness of thesampling method, requirement for trained medical personnel, and rapidsample deterioration under inadequate sample storage and transportationconditions (American Conference of Governmental Industrial Hygienists,2005). Blood sampling may also be more expensive than other biologicalsampling methods.
III.1.2 Urine
Urine sampling has the advantage of being non-invasive and likely to producesufficient sample volume for biomarker measurement. Urine levels of somebiomarkers (e.g., nicotine) are typically higher than levels in plasma andsaliva (Benowitz et al., 2002). Sample clean up is simpler than that for otherbiological specimens. A disadvantage of urine sampling is variability in urineproduction because of behavioral factors, such as fluid intake and meat
CLINICAL STUDIES OF POTENTIALREDUCED-RISK TOBACCO PRODUCTS

Clinical Studies of Potential Reduced-Risk Tobacco Products 27
For internal use of Philip Morris personnel only.
consumption, and biological factors, such as secretion and absorption byrenal tubules and urine pH.
Twenty four-hour urine collection is a highly regarded method for collectingurine, because it correlates better with the intensity of exposure than dospot or grab urine samples. Concerns related to 24-hour urine samplinginclude sample integrity, inconvenience of collection, and subject non-compliance. Spot urine samples, such as first-morning voids or other samplescollected at the study participants’ convenience, are also subject to variabilityin sample volume and concentration of endogenous and exogenous urinecomponents (Barr et al., 2005).
Urine output is expressed as concentration (mg/L), excretion rate (mg/h) orin relation to constituents whose levels change less than water excretion(e.g., total solids, expressed as specific gravity, or creatinine). Creatinine-adjusted measures reportedly correlate better with serum or plasma samples(Barr et al., 2005).
III.1.3 Saliva
The saliva collection method can influence biomarker levels. For example,cotinine levels in unstimulated saliva samples are higher than levels instimulated saliva samples (Schneider et al., 1997). Differences in saliva flowrate can alter pH and biomarker levels. Biomarker levels are also influencedby the last meal and the time when the last cigarette was smoked (Stevens& Munoz, 2004).
III.1.4 Hair
Hair sampling is a non-invasive method that is generally less subject tovariability compared with sampling urine, saliva, and blood, because of theslow rate of hair growth (~1 ± 0.3 cm/month) (Al Delaimy, 2002). Hair samplescan be stored easily without rapid degradation. Hair sampling is not consideredreliable, however, because chemical and physical processing can cause lossof nicotine from the hair shaft. Furthermore, some cultures are against cuttinghair, and some individuals have little scalp hair available.
III.1.5 Exhaled Air
Exhaled air is a potential biological sample matrix for measurement of volatilesmoke constituents. The method of measurement is convenient, and chemicalanalysis is generally simple (American Conference of Governmental IndustrialHygienists, 2005). However, careful sampling is required, and changes inbiomarker concentration during exhalation can occur.

28 Exposure Assessment
For internal use of Philip Morris personnel only.
III.1.6 Toenail
Toenail samples are easy to store and have the advantage of being obtainedvia non-invasive means. Growth rates of toenails are approximately 0.1 cm/month (Palmeri et al., 2000). Toenail biomarker levels reflect nicotine exposureduring 3–5 months and have several advantages to hair samples (Stepanovet al., 2006). Toenails have a lower limit of detection for nicotine than hairand are less likely to be contaminated with the analyte of interest fromsubstances in the environment. Because toenails also grow more slowlythan hair, biomarker values reflect cumulative levels and are less subject toirregular growth and variable axial distribution of the biomarker (Stepanovet al., 2006). Stepanov et al. (2006) reported measuring nicotine and thetobacco-specific nitrosamine (TSNA) metabolite 4-(methylnitrosamino)-1-(3-pyridyl)-1-butanol (NNAL), in human toenails.
III.2 STUDY PARTICIPANT SELECTION
The goal of the study should be well defined. The effect of criteria used toselect study participants on applicability of information from that study to thegeneral population is an important consideration. In some cases, the studyobjective may be to include a range of smokers; in other cases, to developand get a representative sample. Studies should include individuals mostlikely to use the product.
All studies should follow good clinical practice guidelines. An appropriateInstitutional Review Board should review the protocol and informed consentdocuments. Study participants should provide informed consent before thestudy begins and they should be told that they may withdraw from the studyat any time.
III.3 APPROPRIATE CONTROL TOBACCO PRODUCTS
LSRO considers commercially available, conventional cigarettes to be themost appropriate control tobacco products in biomarker studies involvingsmoked tobacco products. Investigators should describe their rationale forselecting specific control cigarettes. LSRO does not consider Kentuckyreference cigarettes to be appropriate control products for biomarker studiesof PRRTPs because they are not commercially available and people generallydo not enjoy smoking reference cigarettes. LSRO recommends developingsmoke chemistry data for control cigarettes and PRRTPs.

Clinical Studies of Potential Reduced-Risk Tobacco Products 29
For internal use of Philip Morris personnel only.
Clinical studies to assess exposure include those evaluating biomarkers,tobacco product use behavior, filter analysis, and deposition and retentionof particles from smoke. LSRO evaluated and reviewed these methods forassessing exposure, as detailed below.
III.4 BIOMARKERS OF TOBACCO PRODUCT ANDSMOKE EXPOSURE
Exposure to compounds related to tobacco products and smoke is influencedby the level of toxicants in the tobacco product or smoke from the product,the metabolism and absorption of these toxins, and the pattern of productuse (Hatsukami et al., 2004a). Numerous studies have shown that smokechemistry studies are inadequate for predicting exposure of individuals tosmoke toxins (Djordjevic et al., 1998, 2000). Because biomarkers reflectintegration of exposure-determining factors, LSRO considers them to bemost useful for assessing internal exposure to smoke constituents.
LSRO has adapted definitions for different types of biomarkers from thoseused by the National Research Council (1987), the Institute of Medicine(IOM) Clearing the Smoke Committee (2001), and Hatsukami et al. (2006a)(Figure III.1).
Biomarkers are biological response variables that are measured in biologicalfluids, tissues, cells, and subcellular components and are indicative ofexposure and/or effect. A “biomarker of exposure” is a constituent ormetabolite that is measured in a biological fluid or tissue, or that is measuredafter it has interacted with critical subcellular, or target tissues (“biologicallyeffective dose”). Examples of biomarkers of a biologically effective doseinclude carboxyhemoglobin (COHb), DNA adducts, and protein adducts.A “biomarker of effect” is a measured effect including an early subclinical
Figure III.1 Biomarkers of exposure and effect. Broken lines indicate that the biomarkersused may or may not be directly related to the final disease or condition.
Adapted and reprinted with permission from Biologic Markers in Reproductive Toxicology.Copyright 1989 by the National Academy of Sciences, courtesy of the National AcademiesPress, Washington, DC.
OutcomeExternal
Exposure
Biomarkers of Exposure Biomarkers of Effect
External
exposure
Disease
(harm)Internal dose
Biologically
effective dose
Early
biological
effects
Alterations in
morphology,
structure, and
function

30 Exposure Assessment
For internal use of Philip Morris personnel only.
biological effect; alteration in morphology, structure, or function; or clinicalsymptom(s) consistent with the development of health impairment or disease.Figure III.1 shows the relationships between exposure, biomarkers, anddisease. Biomarkers of exposure are discussed in this report and biomarkersof effect are discussed in the Biological Effects Assessment in the Evaluationof Potential Reduced-Risk Tobacco Products report (Life Sciences ResearchOffice, 2007a).
Various biomarkers have been used to assess exposure to tobacco productand smoke constituents (Benowitz et al., 2002, 2005; Hecht, 2002; Phillips,2002; Scherer, 2005). LSRO considered biomarker characteristics andanalytical methods of greatest value in measuring exposure to suchconstituents and developed the list of desirable biomarker characteristicsgiven below.
Biomarkers of greatest value in assessing exposure would have the followingattributes:
• Tobacco specificity or substantial difference between smokers andnonsmokers;
• Intra-individual variation that mirrors variation in smoking behavior;• Existing database on its pharmacokinetics;• Low analytical method variation;• Sensitivity and chemical specificity of analytical method(s); and• Existence of other biomarkers that can confirm the exposure.
LSRO also discussed the need for biomarker validation. Methods forsystematic validation of biomarkers have been published (U.S. Food andDrug Administration, 2001; World Health Organization, 2000).
LSRO reviewed information in the scientific literature about biomarkersused to assess tobacco-product-related exposure and ranked them in termsof potential usefulness in PRRTP exposure assessment studies. In rankingbiomarkers, LSRO considered whether the biomarker had the desirablecharacteristics, the invasiveness of the sample acquisition method, andthe phase of smoke in which the biomarker or its precursor in smoke isfound.
LSRO developed three categories of biomarkers, with different levels ofutility for tobacco product or smoke exposure. LSRO considers “CategoryA” biomarkers to be sufficiently studied, reliable tools for estimatingexposure (Table III-1). Category A biomarkers are mostly urinarymetabolites of tobacco product and smoke constituents, but two adducts

Clinical Studies of Potential Reduced-Risk Tobacco Products 31
For internal use of Philip Morris personnel only.
of hemoglobin (Hb) (4-aminobiphenyl [ABP]-Hb and N-(2-cyanoethyl)valine-Hb) are also included. Hb adducts are easier to measure than DNA adducts,and because their amounts are proportional to those of DNA adducts theyare sometimes used as biomarkers of exposure. The mere presence ofDNA adducts alone is not evidence of mutation. Furthermore, at present,no certain threshold or quantitative correlation exists between DNA adductsand production of tumors (Pottenger et al., 2004). Available evidencesuggests that there is no threshold for DNA adduct formation but that athreshold for tumor formation exists (Waddell, 2006). This result maysuggest that at some point DNA repair is overwhelmed and tumorigenesisbegins. However, scientists almost universally agree that DNA adductformation is necessary for tumorigenesis induced by alkylating chemicalcarcinogens.
LSRO considers “Category B” biomarkers to be promising but deficient inone or more desirable characteristics; therefore, LSRO has a lower level ofconfidence in Category B biomarkers than in Category A biomarkers(Table III-1). LSRO recommends consideration of Category A and Bbiomarkers for routine use in PRRTP studies.
LSRO has the lowest level of confidence in “Category C” biomarkers anddoes not recommend their routine use in PRRTP exposure assessment(Table III-2). However, if smoke chemistry or other studies provide reason tosuspect elevated levels of biomarkers for a specific chemical after use of thePRRTP or exposure to smoke from the PRRTP, LSRO recommendsmeasurement of the relevant biomarker(s), regardless of category.
LSRO acknowledges that the biomarkers discussed do not constitute acomprehensive collection and that there is flexibility to add to the list ofuseful biomarkers. If necessary, analytical methods and techniques shouldbe developed and validated. These rankings reflect LSRO’s judgment basedon the current state-of-the-science. Identification of new validatedbiomarkers and advances in analytical methodology could affect biomarkerrankings.
This report organizes biomarkers of exposure according to theirprecursors. Discussions of the utility of using biomarkers to assesscigarette smoke exposure, including selected studies comparingbiomarker levels after use of PRRTPs with levels after use of conventionalcigarettes are found below.

32 Exposure Assessment
For internal use of Philip Morris personnel only.
Tab
le II
I-1.
Bio
mar
kers
of T
ob
acco
Sm
oke
Exp
osu
re R
eco
mm
end
ed fo
r R
ou
tin
e U
se in
Clin
ical
Stu
die
s
Cat
ego
ry A
B
iom
arke
r P
recu
rso
r B
iolo
gic
al
mat
rix
Co
mm
ents
/ se
lect
ed r
efer
ence
s
Nic
otin
e an
d at
leas
t 5 m
ajor
ni
cotin
e m
etab
olite
s, in
clud
ing
cotin
ine
Nic
otin
e U
rine
Rec
omm
ende
d fo
r in
clus
ion
in a
ll ex
posu
re s
tudi
es o
f PR
RT
Ps
(Bal
int e
t al.,
200
1; B
yrd
et a
l.,
1992
; Roe
thig
, et a
l., 2
005)
C
arbo
n m
onox
ide
(CO
);
carb
oxyh
emog
lobi
n (C
OH
b)
CO
E
xhal
ed b
reat
h;
bloo
d (C
unni
ngto
n &
Hor
mbr
ey, 2
002;
H
ughe
s &
Kee
ly, 2
004;
Sm
ith e
t al
., 19
98; W
ald
et a
l., 1
981)
U
rine
mut
agen
icity
M
utag
ens,
ca
rcin
ogen
s U
rine
(Bow
man
et a
l., 2
002;
Roe
thig
et
al.,
2005
)
1-H
ydro
xypy
rene
(1-
HO
P)
Pyr
ene
Urin
e S
urro
gate
for
poly
cycl
ic a
rom
atic
hy
droc
arbo
ns (
PA
H)
(Hat
suka
mi e
t al
., 20
04b;
Mur
phy
et a
l., 2
004)
3-
Hyd
roxy
prop
ylm
erca
ptur
ic
acid
(3-
HP
MA
) A
crol
ein
Urin
e (M
asch
er e
t al.,
200
1)
tran
s,tr
ans-
Muc
onic
aci
d (t
,t-M
A)
Ben
zene
U
rine
(Sch
erer
et a
l., 1
998)
S
-Phe
nylm
erca
ptur
ic a
cid
(S-
PM
A)
Ben
zene
U
rine
(Boo
gaar
d &
van
Sitt
ert,
1995
)
Mon
ohyd
roxy
bute
nyl
mer
capt
uric
aci
ds (
MH
BM
A, o
r M
II)
1,3-
But
adie
ne
Urin
e (U
rban
et a
l., 2
003;
van
Sitt
ert e
t al
., 20
00)

Clinical Studies of Potential Reduced-Risk Tobacco Products 33
For internal use of Philip Morris personnel only.
Tabl
e III
-1. B
iom
arke
rs o
f Tob
acco
Sm
oke
Exp
osur
e R
ecom
men
ded
for R
outin
e U
se in
Clin
ical
Stu
dies
(con
tinue
d)
Cat
ego
ry A
B
iom
arke
r P
recu
rso
r B
iolo
gic
al
mat
rix
Co
mm
ents
/ se
lect
ed r
efer
ence
s 4-
(Met
hyln
itros
amin
o)-1
-(3-
pyrid
yl)-
1-bu
tano
l (N
NA
L) a
nd
its g
lucu
roni
de
Tob
acco
-spe
cific
ni
tros
amin
es
(TS
NA
s)
Urin
e (B
rela
nd e
t al.,
200
3; H
ughe
s et
al
., 20
04)
4-A
min
obip
heny
l-hem
oglo
bin
(Hb)
add
ucts
4-
Am
inob
iphe
nyl
Blo
od
(Bar
tsch
et a
l., 1
990)
N-(
2-C
yano
ethy
l)val
ine-
Hb
addu
cts
Acr
ylon
itrile
B
lood
(F
enne
ll et
al.,
200
0; P
érez
et a
l.,
1999
; Sch
ettg
en e
t al.,
200
2)
Cat
ego
ry B
A
ceto
nitr
ile
Ace
toni
trile
E
xhal
ed b
reat
h
(Hou
eto
et a
l., 1
997;
Lirk
et a
l.,
2004
) A
nata
bine
, ana
basi
ne
Min
or to
bacc
o al
kalo
ids
Urin
e (J
acob
, III
et a
l., 1
999,
200
2)
Dih
ydro
xybu
tyl m
erca
ptur
ic a
cid
(DH
BM
A, o
r M
I)
1,3-
But
adie
ne
Urin
e (U
rban
et a
l., 2
003;
van
Sitt
ert e
t al
., 20
00)
3-H
ydro
xybe
nz[a
]ant
hrac
ene
Ben
z[a]
anth
race
ne
Urin
e (G
ünde
l & A
nger
er, 2
000;
Sim
on
et a
l., 2
000)
3-
Hyd
roxy
benz
o[a]
pyre
ne
Ben
zo[a
]pyr
ene
Urin
e (G
ünde
l & A
nger
er, 2
000;
Sim
on
et a
l., 2
000)
Cat
ego
ry A
: Bio
mar
kers
that
hav
e be
en s
uffic
ient
ly s
tudi
ed a
nd p
rovi
de re
liabl
e ex
posu
re m
easu
rem
ents
. Cat
ego
ry B
: Bio
mar
kers
that
hav
esu
ffici
ent
data
to
supp
ort
thei
r us
e in
exp
osur
e st
udie
s bu
t al
so h
ave
limita
tions
rel
ated
to
one
or m
ore
desi
rabl
e bi
omar
ker
char
acte
rist
ics.
PR
RT
Ps:
pot
entia
l red
uced
-ris
k to
bacc
o pr
oduc
ts (
Life
Sci
ence
s R
esea
rch
Offi
ce, 2
007b
).

34 Exposure Assessment
For internal use of Philip Morris personnel only.
Tab
le II
I-2.
Bio
mar
kers
of T
ob
acco
Sm
oke
Exp
osu
re N
ot
Rec
om
men
ded
for
Ro
uti
ne
Use
in C
linic
al S
tud
ies
Cat
ego
ry C
B
iom
arke
r P
recu
rso
r R
efer
ence
s N
-Ace
tyl-S
-(2-
carb
amoy
leth
yl)-
L-cy
stei
ne (
AA
MA
) an
d N
-(R
,S)-
acet
yl-
S-(
2-ca
rbam
oyl-2
-hyd
roxy
ethy
l)-L-
cyst
eine
(G
AM
A)
Acr
ylam
ide
(Boe
ttche
r et
al.,
200
5b; B
oettc
her
&
Ang
erer
, 200
5)
1-, 2
-, 3
-, a
nd 4
- A
min
onap
htha
lene
s A
rom
atic
am
ines
(G
rimm
er e
t al.,
200
0; R
iffel
man
n et
al
., 19
95)
Ben
zene
B
enze
ne
(Jor
dan
et a
l., 1
995)
C
adm
ium
C
adm
ium
(J
ärup
et a
l., 1
998;
Sat
arug
et a
l.,
2004
) 2,
5-D
imet
hylfu
ran
2,5-
Dim
ethy
lfura
n (A
shle
y et
al.,
199
6; P
erbe
llini
et a
l.,
2003
) 1-
and
2-N
apht
hols
N
apht
hols
(N
an e
t al.,
200
1; Y
ang
et a
l., 1
999)
T
hioc
yana
te
Hyd
roge
n cy
anid
e (D
egia
mpi
etro
et a
l., 1
987;
Tor
ano
&
van
Kan
, 200
3)
1-, 2
-, 3
-, a
nd 4
-H
ydro
xyph
enan
thre
nes
Phe
nant
hren
es
(Heu
dorf
& A
nger
er, 2
001;
Jac
ob e
t al
., 19
99)
Thi
oeth
ers
Ele
ctro
phili
c co
mpo
unds
(F
eng
et a
l., 2
006)
3-
Met
hyla
deni
ne in
urin
e M
ethy
latin
g su
bsta
nces
(P
revo
st e
t al.,
199
0)

Clinical Studies of Potential Reduced-Risk Tobacco Products 35
For internal use of Philip Morris personnel only.
Tabl
e III
-2. B
iom
arke
rs o
f Tob
acco
Sm
oke
Exp
osur
e N
ot R
ecom
men
ded
for R
outin
e U
se in
Clin
ical
Stu
dies
(con
tinue
d)
Cat
ego
ry C
B
iom
arke
r P
recu
rso
r R
efer
ence
s 3-
Eth
ylad
enin
e in
urin
e E
thyl
atin
g su
bsta
nces
(K
oppl
in e
t al.,
199
5; P
revo
st &
S
huke
r, 1
996)
5-
Hyd
roxy
met
hylu
raci
l R
efle
cts
DN
A d
amag
e by
oxy
gen
free
rad
ical
s (P
ourc
elot
et a
l., 1
999)
Nitr
osat
ed p
rote
ins
Nitr
ic o
xide
(H
offm
ann
& B
runn
eman
n, 1
983;
La
dd e
t al.,
198
4)
1,3-
But
adie
ne a
dduc
ts
1,3-
But
adie
ne
(Fus
tinon
i et a
l., 2
002)
B
enzo
[a]p
yren
e (B
[a]P
)-al
bum
in
addu
cts
B[a
]P
(Aut
rup
et a
l., 1
995;
Cra
wfo
rd e
t al.,
19
94; S
hers
on e
t al.,
199
0; T
as e
t al.,
19
94)
B[a
]P-h
emog
lobi
n (H
b) a
dduc
ts
B[a
]P
(Grim
mer
et a
l., 1
987;
Hof
fman
n &
H
offm
ann,
199
7)
Bul
ky D
NA
add
ucts
La
rge,
prim
arily
apo
lar
com
poun
ds
i.e.,
poly
cycl
ic a
rom
atic
hy
droc
arbo
ns (
PA
H),
aro
mat
ic
amin
es, a
nd o
ther
s
(Phi
llips
, 200
2)
Eth
eno-
DN
A a
dduc
ts
Vin
yl c
hlor
ide,
lipi
d pe
roxi
datio
n-de
rived
pro
duct
s (A
lber
tini e
t al.,
200
3)
F2-
Isop
rost
anes
A
rach
idon
ic a
cid
pero
xida
tion
(Che
hne
et a
l., 2
002;
Pilz
et a
l., 2
000;
R
eilly
et a
l., 1
996)
A
rom
atic
am
ine-
DN
A a
dduc
ts
Aro
mat
ic a
min
es
(Fla
min
i et a
l., 1
998;
Hsu
et a
l., 1
997)

36 Exposure Assessment
For internal use of Philip Morris personnel only.
Tabl
e III
-2. B
iom
arke
rs o
f Tob
acco
Sm
oke
Exp
osur
e N
ot R
ecom
men
ded
for R
outin
e U
se in
Clin
ical
Stu
dies
(con
tinue
d)
Cat
ego
ry C
B
iom
arke
r P
recu
rso
r R
efer
ence
s 4-
Hyd
roxy
-1-(
3-py
ridyl
)-1-
buta
none
(H
PB
)-D
NA
add
ucts
T
obac
co-s
peci
fic n
itros
amin
es
(TS
NA
s)
(Foi
les
et a
l., 1
991)
HP
B-H
b ad
duct
s T
SN
As
(Fal
ter
et a
l., 1
994;
Hec
ht e
t al.,
199
1)
8-H
ydro
xy-2
'-deo
xygu
anos
ine
Mar
ker
of h
ydro
xyl r
adic
al d
amag
e to
DN
A
(Dau
be e
t al.,
199
7)
N-(
2-H
ydro
xyet
hyl)v
alin
e-H
b ad
duct
s E
thyl
ene
or e
thyl
ene
oxid
e (F
enne
ll et
al.,
200
0; S
chet
tgen
et a
l.,
2002
) 7-
Met
hylg
uani
ne a
dduc
ts
Met
hyla
ting
agen
ts s
uch
as 4
-(M
ethy
lnitr
osam
ino)
-1-(
3-py
ridyl
)-1-
buta
none
(N
NK
) an
d N
itros
odim
ethy
lam
ine
(ND
MA
)
(Mus
tone
n et
al.,
199
3; M
usto
nen
&
Hem
min
ki, 1
992)
N-(
2-C
arba
moy
leth
yl)v
alin
e-H
b ad
duct
s A
cryl
amid
e (B
ergm
ark,
199
7; H
agm
ar e
t al.,
20
05)
PA
H-D
NA
add
ucts
P
AH
(K
riek
et a
l., 1
998;
Moo
ney
et a
l.,
1995
; Tan
g et
al.,
199
5)
N-E
thyl
valin
e-H
b ad
duct
s N
ot k
now
n, p
ossi
bly
nitr
osat
ion
of
ethy
lam
ine,
ace
toni
trile
(C
arm
ella
et a
l., 2
002)
N-M
ethy
lval
ine-
Hb
addu
cts
ND
MA
, NN
K m
ethy
l hal
ides
, and
ot
her
subs
tanc
es
(Bad
er e
t al.,
199
5; C
arm
ella
et a
l.,
2002
) Cat
ego
ry C
: Bio
mar
kers
that
are
con
side
red
insu
ffici
ently
relia
ble
for r
outin
e us
e in
exp
osur
e st
udie
s. (L
ife S
cien
ces
Res
earc
h O
ffice
, 200
7b).

Clinical Studies of Potential Reduced-Risk Tobacco Products 37
For internal use of Philip Morris personnel only.
III.4.1 Nicotine and Metabolites
III.4.1.1 Nicotine
Nicotine is the primary alkaloid in tobacco and is found in mainstream smoke(MS) at levels of 1–2 mg/cigarette (Dhar, 2004). Nicotine levels differ indifferent parts of a single plant and within and among tobacco strains(Benowitz et al., 1990). The desire to maintain a certain level of nicotine isthought to be the key motivation for continuing the smoking habit (Benowitzet al., 1994; U.S. Department of Health and Human Services, 1988), althoughreinforcing motor and non-nicotine sensory components of the smokingprocess, packaging, and other factors also influence maintenance of thehabit (Rose, 2006). Nicotine is a highly specific marker of tobacco smokeexposure and has been widely used as a measure of tobacco product orsmoke exposure. The major disadvantage of using nicotine is its short half-life. Because of nicotine’s pharmacokinetic properties, many investigatorsinstead measure cotinine, its primary metabolite (Heinrich-Ramm et al.,2002). LSRO recommends routine measurement of nicotine in PRRTPevaluations but advises concurrent measurement of at least five majornicotine metabolites, including cotinine, to better estimate nicotine exposure.
Smokers’ nicotine levels are influenced by cigarette design, cigarette puffingand smoke inhalation behaviors, pregnancy, mucosal membrane pH, andgenetic polymorphisms in nicotine-metabolizing enzymes (Byrd et al., 1995).Genetic polymorphisms can contribute to large inter-individual variations innicotine metabolism (Benowitz & Jacob, III, 1997). Certain vegetables andother foods also serve as non-tobacco nicotine sources (Davis et al., 1991).Tomatoes, potatoes, and cauliflower contain nicotine, as do black tea andinstant tea. However, the contribution of dietary sources of nicotine to bodylevels is considered to be negligible.
Smokers absorb approximately 1–1.4 mg nicotine/cigarette (Benowitz &Jacob, III, 1984, 1994; Fagerström, 2005), and their arterial blood nicotinelevels typically range from less than 1 ng/ml to more than 50 ng/ml (Byrd etal., 2005). However, some studies reported arterial blood levels of 100 ng/ml (Henningfield et al., 1993). Approximately 5–9% of nicotine taken intothe body is excreted unmetabolized in urine (Benowitz et al., 1994). Becauseof its relatively short half-life (1–2 hours), blood nicotine levels fluctuatethroughout the day. As a result, these levels depend to a great degree ontime of sampling and are often measured in the afternoon, when they aresomewhat more stable (Benowitz, 1983; Benowitz & Jacob, III, 1994 ).

38 Exposure Assessment
For internal use of Philip Morris personnel only.
A smoker’s nicotine dose depends on cigarette smoking behavior and,potentially, nicotine dependence level, gender, race, level of nicotine sought,pulmonary condition, and characteristics of the specific cigarette (Bridgeset al., 1986; Clark et al., 1998; McCarthy et al., 1992; Patterson et al., 2003;Zacny et al., 1987).
Many analytical methods have been used to assess nicotine exposure, eachwith associated advantages and disadvantages. Radioimmunoassays (RIAs),which had historically been used, have been replaced by other methodsbecause of limitations such as the potential for cross-reactivity with matrixcomponents, the measurement of only one component at a time, therequirement for radioactive materials and antisera for each metabolite, andthe need to dispose of radioactive material (Byrd et al., 2005). An enzyme-linked immunosorbent assay (ELISA) does not require costly equipment andreagents or radioactive material. Furthermore, ELISA requires a shorter timefor analysis (less than 5 hours) compared with the more than 48 hoursrequired for the RIA (Dhar, 2004).
Various chromatography methods with different detection limits have beenused to measure nicotine and its metabolites. Rapid liquid chromatography(LC)-tandem mass spectrometry permits simultaneous measurement ofnicotine and cotinine. According to Byrd et al. (2005), this technique requiresvery little sample, is based on solid phase extraction in a 96-well plate format,and uses normal phase chromatography that increases sample throughput.The method is also more accurate and precise and has fewer matrix effectsthan does RIA. LC-tandem mass spectrometry has increased accuracy andprecision compared with RIA, but instrumentation is more expensive andmore complicated (Byrd et al., 2005).
High-performance liquid chromatography (HPLC) allows measurement ofnicotine and cotinine in plasma and saliva (Dhar, 2004). Gas chromatography(GC)-mass spectrometry has been used to measure nicotine in urine, saliva,and hair. This method has been described as relatively simple, quick, andcapable of simultaneous assay of nicotine and cotinine (James et al., 1998).LC-tandem mass spectrometry with atmospheric pressure chemicalionization in the positive ion mode was used to measure nicotine, cotinine,trans-3′-hydroxycotinine, and their respective glucuronides (Meger et al.,2002). Nicotine-N-oxide, cotinine-N-oxide, and norcotinine, which accountfor 12% of nicotine metabolites, were also measured. This method is fast,allows for high sample throughput, is less expensive and more precise thannitrogen-phosphorus GC, does not require sample extraction, and measuresglucuronides directly, which reduces analytical variation.

Clinical Studies of Potential Reduced-Risk Tobacco Products 39
For internal use of Philip Morris personnel only.
Colorimetry is a simple, inexpensive procedure that can estimate total nicotinemetabolites (Dhar, 2004). A disadvantage is its non-specificity, because drugswith a pyridine nucleus, such as isoniazid and nicotinamide, can affectmeasurement (Dhar, 2004).
III.4.1.2 Cotinine
Approximately 70–80% of nicotine taken into the body is converted to cotinine(Benowitz & Jacob, III, 1994). Cotinine is further metabolized into trans-3′hydroxycotinine, cotinine glucuronide, cotinine-N-oxide, norcotinine, and othersubstances. Approximately 10–15% of cotinine is excreted unchanged inurine (Benowitz et al., 1983). LSRO recommends routine measurement ofcotinine concurrently with nicotine and at least four major nicotine metabolites.
Cotinine has been measured in blood, serum, saliva, urine, amniotic fluid,cervical mucus, and hair (Binnie et al., 2004; Chetiyanukornkul et al., 2004;Dahlström et al., 1990; Thomas et al., 2006). Its half-life is approximately 16hours. It would take approximately 80 hours for an abstaining smoker with astarting cotinine level of 300 ng/ml to reach the cotinine level of a nonsmoker(Benowitz et al., 2002). Ethnicity and pregnancy influence cotinine’s half-life(Benowitz et al., 2002). Higher concentrations of cotinine than nicotine occurin blood after a few hours (Benowitz et al., 1983). Saliva cotinine and nicotineconcentrations are approximately 25% higher than the plasma cotinine andnicotine concentrations (Jarvis et al., 2003), but the saliva cotinineconcentration can vary with age and method of saliva sample collection.Stimulated saliva samples yield lower levels of cotinine than unstimulatedsamples (Schneider et al., 1997). Urinary cotinine concentration is generallytwice as high as salivary and plasma cotinine concentrations (Watts et al.,1990).
Smokers’ cotinine levels rise incrementally throughout the day, reach theirhighest levels at the end of the day, and remain high overnight. A typicalcutoff level for cotinine in smokers is any value higher than 15 ng/ml in plasmaand saliva and higher than 50 ng/ml in urine (Benowitz et al., 2002).
Large inter-individual differences occur in the rate of renal cotinine clearance(19–75 ml/min) and in the percentage of nicotine metabolized to cotinine(Benowitz et al., 1983; Benowitz & Jacob, III, 1994). The half-life of cotininein Black American and Chinese American individuals is longer than in WhiteAmerican individuals (Benowitz et al., 1999). Cotinine clearance duringpregnancy is faster than clearance in the non-pregnant state (Dempsey etal., 2002). Clearance of nicotine, both total and non-renal, is reduced inindividuals with kidney failure or liver cirrhosis (Molander et al., 2000).

40 Exposure Assessment
For internal use of Philip Morris personnel only.
Methods used to measure cotinine include enzyme immunoassays, HPLC,RIA, IMMULITE®, GC-, LC-mass spectrometry (Dhar, 2004). Using rapidLC-mass spectrometry-mass spectrometry Byrd et al. (2005) measurednicotine and cotinine. Nicotine and cotinine levels for nonsmokers were belowthe limit of quantitation for the assay. LC-tandem mass spectrometry hasincreased accuracy and precision compared with RIA. Disadvantages arethat the instrumentation is more expensive and more complicated than thatfor RIA (Byrd et al., 2005).
III.4.1.3 Nicotine + metabolites
Whereas cotinine alone accounts for 15% or less of total nicotine intake, thesum of nicotine, cotinine, and trans-3′-hydroxycotinine and their respectiveglucuronides accounts for 80–85% of the total nicotine taken into the body(Benowitz et al., 1994). Simultaneous measurement of these substances(nicotine and at least five major metabolites, including cotinine) moreaccurately reflects total nicotine exposure and metabolism than measurementof only one metabolite, and this assay can be done non-invasively, by usingurine (Roethig et al., 2005; Xu et al., 2004).
LSRO therefore recommends that nicotine and at least five of its majormetabolites, including cotinine, be measured routinely in PRRTP evaluations(Category A biomarker).
III.4.2 Carbon Monoxide
Carbon monoxide (CO) is an incomplete combustion product found in thegas phase of tobacco smoke. CO binds to Hb to form COHb with an affinity240-fold greater than that of oxygen binding to Hb (Douglas et al., 1912).Although environmental sources (e.g., motor vehicle emissions, gas heaters,and cookers) and endogenous sources of CO compromise its usefulnessas a biomarker of exposure to tobacco smoke, CO is particularly useful as ameasure of a gas phase constituent of cigarette smoke and has been usedas such a biomarker in PRRTP studies. These studies showed differencesin CO levels after subjects smoked conventional cigarettes and after theysmoked some PRRTPs. LSRO recommends routine measurement of CO inPRRTP studies (“Category A”).
CO exposure has been measured as both COHb levels and CO in exhaledair. Cunnington and Hormbrey (2002) reported a positive dose-responserelationship between the number of cigarettes smoked per day and exhaledCO levels (p = 0.01). Wald et al. (1981) showed a strong correlation(correlation coefficient, r = 0.97) between CO in exhaled air and COHb levels.

Clinical Studies of Potential Reduced-Risk Tobacco Products 41
For internal use of Philip Morris personnel only.
Measurement of CO in exhaled breath is simple and non-invasive and yieldsimmediate results (Deveci et al., 2004). Exhaled breath CO can be measuredby using a monitor that determines the rate of conversion of CO to carbondioxide as CO passes over a catalytically active electrode (Benowitz et al.,2002; Wald et al., 1981). The monitors are inexpensive and portable and donot require trained medical personnel for operation (Togores et al., 2000).CO levels in exhaled air are less than 3 ppm for nonsmokers in a smokelessenvironment and higher than 8 ppm for active smokers (Benowitz et al.,2002). Measurement of exhaled CO is more likely to be acceptable to subjectsthan measurement of COHb (World Health Organization, 2003a) because itis less invasive.
COHb values depend on the time of day of sampling, number of cigarettessmoked before sampling, extent of exposure to CO from sources other thancigarette smoking, medical status and demographics of study participants,and assay methods (Smith et al., 1998). Other factors influencing COHblevels are exercise, ambient temperature, and individual rates of COmetabolism (World Health Organization, 2003a).
Use of CO as a biomarker of exposure to tobacco smoke involves certainconsiderations. As mentioned, the timing of CO measurement is criticalbecause of the short half-life of the biomarker. Physical activity also influencesCO levels: the half-life of CO is as short as 1 hour for active individuals, 2–3hours for sedentary individuals, and 4–8 hours during sleep (Benowitz etal., 2002; Coburn et al., 1965). Blood samples for COHb measurement aretypically obtained by standard venipuncture, with COHb usually measuredsoon after sample acquisition (Smith et al., 1998). Samples of blood plus ananticoagulant should be housed in a closed container and can be kept, at4°C in the dark, for a number of days before analysis. COHb can be measuredvia spectrophotometry (Leone, 2005). COHb levels in nonsmokers arebetween 0.3% and 0.7% (World Health Organization, 2003a). Active smokershave mean levels of 4% COHb, with a range of 3–8% (World HealthOrganization, 2003a).
CO has been used as a biomarker of tobacco smoke exposure in a numberof PRRTP studies. Sutherland et al. (1993) measured expired air CO levelsfor 20 smokers who switched from their usual cigarette brand to a cigarette-like PRRTP, brand name Premier® that heats but does not burn tobacco.Mean expired air CO levels increased by 19% (p = 0.018) after subjectssmoked Premier® for 3 days. Smith et al. (1998) measured COHb and expiredair CO levels for 14 smokers who used their usual brand of cigarette for 5days after which 12 of these subjects smoked a research cigarette prototype

42 Exposure Assessment
For internal use of Philip Morris personnel only.
that heats rather than burns tobacco (TOB-HT) for 5 days. Although subjectssmoked the same numbers of usual brand and TOB-HT cigarettes, use ofthe TOB-HT increased levels of COHb by 24.4% and expired air CO by30.6% compared with the smokers’ usual cigarette.
The Omni® cigarette is a type of PRRTP that contains tobacco treated witha palladium catalyst to increase burning efficiency. In a crossover study,Hughes et al. (2004) measured the difference between expired air CO levelsbefore and after smoking for 19 light/ultra-light cigarette smokers and 15regular cigarette smokers. Subjects used their usual brand or Omni®
cigarettes for 6 weeks and then smoked the other type of cigarette for 6weeks. Omni® cigarettes produced a significantly larger CO increase (21%higher; 95% confidence interval [CI 3–38% higher]) than did the subjects’own brand of cigarettes (F [variance ratio] = 5.74, p = 0.02). Cigarette machinesmoking showed that Omni® cigarettes produced 16% less to 10% moreCO than conventional cigarettes with which they were compared4. This findingmay have been due to differences between Omni® and conventional cigarettefilters, type of tobacco, or vent blocking (Hughes et al., 2004).
Breland et al. (2002a) compared exhaled air CO levels after subjects smokedtheir own cigarette brand, denicotinized cigarettes, Eclipse®, or Accord®.Eclipse® and Accord® are cigarette-like PRRTPs that primarily heat, insteadof burning tobacco. Twenty smokers abstained from smoking overnight, andthe following day puffed 1 type of cigarette 8 times within a 30-minute period.Smoking sessions for each type of cigarette were separated by 24 hours,and all subjects smoked each type of cigarette. Smoking Eclipse® cigarettesincreased CO levels in air exhaled by smokers by an average of 33%compared with their own brand of cigarettes, whereas smoking Accord®
cigarettes reduced these levels compared with their own brand. In anotherstudy, Breland et al. (2002b) measured expired air CO levels when subjectssmoked their own brand of cigarettes or Advance® (a PRRTP) or when theysham-smoked unlit conventional cigarettes. Filter ventilation holes of allcigarettes were blocked. Twenty subjects abstained from smoking the nightbefore the study began. In this crossover study, subjects participated in 2.5-hour sessions during which they took 8 puffs of 1 type of cigarette in 4 differentblocks of time. Different kinds of cigarettes were smoked on different days.Advance® cigarettes delivered 11% less CO than their own brand of cigarettes.
In a later study, Breland et al. (2003) measured expired air CO levels for 12individuals after they smoked their own brand of light or ultra-light cigarettes
4 Hughes et al. (2004) cited www.omni.cigs.com as the source of this information, but thisweb site is no longer active.
Clinical Studies of Potential Reduced-Risk Tobacco Products 43
For internal use of Philip Morris personnel only.
(mean Federal Trade Commission (FTC) yields of 0.75 mg of nicotine, 11.3mg of CO, and 10.3 mg of tar). They then compared these levels with thoseobtained after subjects smoked Advance® cigarettes (mean FTC yields of0.8 mg of nicotine, 9.1 mg of CO, and 9.8 mg of tar) or abstained fromsmoking. Each type of cigarette was smoked for 5 days. Expired air COlevels were significantly lower after smoking Advance® cigarettes comparedwith levels after subjects smoked their own brand of cigarettes on days 2, 4,and 5 (p < 0.05).
Lee et al. (2004) reported an increase in exhaled CO for 10 smokers afterthey smoked Eclipse® or their own brand of cigarettes. The mean FTC yieldsof their own brand of cigarettes were 1.1 mg of nicotine and 14.5 mg of tar.Testing sessions were held 24 hours apart. Study participants smoked thecigarette while holding it in their hand, or they smoked it through a mouthpiececonnected to a smoking topography device. Cigarettes were smoked inrandom order. Smoking Eclipse® cigarettes resulted in statistically non-significant increases in exhaled breath CO (6.6 ± 0.6 ppm) compared withthe level of 4.5 ± 0.6 ppm obtained after smoking their own brand of cigarettes(Lee et al., 2004).
Fagerström et al. (2000) studied the effects of smokers switching from theirown brand of cigarettes to Eclipse® cigarettes or a nicotine inhaler on COlevels. Subjects were randomly assigned either to smoke Eclipse® or to usethe Nicotrol® nicotine inhaler for 2 weeks and then to switch to the othermethod. Subjects were asked to smoke as few of their own brand of cigarettesas possible during the study and use the substitute product as needed.Expired air CO values were determined prior to switching to the first product.Smoking Eclipse® cigarettes increased the exhaled breath CO value to33 ppm compared with 21 ppm when subjects smoked their own cigarettes(p = 0.001; n = 40). CO levels after smokers used the inhaler were significantlyreduced (12.7 ppm; p = 0.001; n = 40) compared with when subjects smokedtheir own brand.
In another study of Eclipse®, 38 subjects from the study just described wereasked to use Eclipse® or the Nicorette® inhaler for 8 weeks to help themlower the number of cigarettes they smoked per day (Fagerström et al.,2002). Subjects were allowed to choose between using Eclipse® (n = 10)and the inhaler (n = 15), or, if they liked neither product, to continue smokingtheir own brand of cigarettes (n = 13). When subjects used Eclipse®, theirexhaled breath CO levels increased by 45% (32.5 ppm) compared withbaseline (22.2 ppm). Use of the inhaler resulted in a 47% decrease in exhaledbreath CO levels (12.5 ppm). Exhaled breath CO levels after smoking Eclipse®

44 Exposure Assessment
For internal use of Philip Morris personnel only.
were significantly higher than levels after using the inhaler (p = 0.05), butthey were not significantly higher than levels for those who continued tosmoke cigarettes. Subjects who used Eclipse® also had significantly higherlevels of COHb (7.7%) than subjects who used the inhaler (3.5%; p = 0.05).
Roethig et al. (2005) measured expired air CO and blood COHb levels in110 smokers divided into 5 groups. Subjects switched from smoking theirusual brand of cigarette to smoking an electrically heated cigarette (EHC)either Accord® or Oasis® or a conventional cigarette (Marlboro Lights® orMarlboro Ultra Lights®). Twenty subjects smoked each type of cigarette; 30subjects abstained from smoking. CO yields of these EHCs have reportedlybeen approximately 90% lower than the yield of the University of Kentucky1R4F reference cigarette (Stabbert et al., 2003). Subjects were allowed toacclimate to the clinical setting for 1 day, during which their smoking wasmonitored. Subjects were not permitted to smoke more cigarettes than theysmoked on their acclimation day plus 20%. The CO value was obtainedwithin 1 minute of cigarette consumption. The exhaled CO level decreasedby 93% for people who abstained from smoking, by 80% for smokers of theelectrically heated cigarettes, and by 18% in the afternoon and 30% in theevening for individuals who smoked Marlboro Ultra Lights® cigarettes. TheCOHb level decreased by 95% for subjects who abstained from smoking, by93% for smokers of Accord® and Oasis®, and by 39% for smokers of MarlboroUltra Lights® cigarettes (Roethig et al., 2005).
III.4.3 Urine Mutagenicity
Cigarette smoke contains many carcinogenic and mutagenic substances.Urine mutagenicity has been used as an integrated indicator of genotoxicexposure. The mutagenicity of smokers’ urine has reportedly been higherthan that of nonsmokers’ urine (Bartsch et al., 1990; Granella et al., 1996;Pavanello et al., 2002a; Yamasaki & Ames, 1977). Urine mutagenicity is nota specific biomarker of tobacco exposure, because occupational exposureto carcinogens (Dolara et al., 1981), chemotherapy (Speck et al., 1976),and diet can increase it (Baker et al., 1982; Baker et al., 1986). The half-lifeof mutagenic activity in the Salmonella urine mutagenicity assay isapproximately 7 hours (Kado et al., 1985; Scherer, 2005). PRRTP studieshave assessed urine mutagenicity, which has shown significant differencesbetween PRRTPs and conventional cigarettes. LSRO ranks urinemutagenicity as a Category A biomarker.
Mure et al. (1997) compared the mutagenicity of urine of 32 smokers withthat of urine of 37 nonsmokers. Smokers’ urine showed significantly higherlevels of mutagenic activity than nonsmokers’ urine (p < 0.05). Although one
Clinical Studies of Potential Reduced-Risk Tobacco Products 45
For internal use of Philip Morris personnel only.
study reported a dose-response relationship between number of cigarettessmoked and urine mutagenicity (Mure et al., 1997), other studies have notdemonstrated such a relationship (Einistö et al., 1990; Kado et al., 1985).
Bowman et al. (2002) compared urine mutagenicity for nonsmokers (n = 31)with that for regular smokers of ultra-low-tar (n = 11), full-flavor low-tar(n = 41), and full-flavor tar cigarettes (n = 15) who switched to smokingEclipse® cigarettes for 1 week and then returned to smoking their own brandof cigarettes. The study participants avoided consuming pan-fried, broiled,and pre-cooked meats because mutagenic pyrolysis products are presentin such foods (Doolittle et al., 1989; Nagao et al., 1977a; Nagao et al., 1977b;Smith et al., 1996). Subjects consumed cigarettes ad libitum. Nonsmokers’urine samples were significantly less mutagenic (approximately 15-fold) thansmokers’ urine samples (p < 0.05) and had 4-fold lower mutagenicity thanurine samples from Eclipse® smokers. All smokers’ urine samples weresignificantly less mutagenic after switching to Eclipse® cigarettes (p < 0.05).Reductions in urine mutagenicity ranged between 70% and 77% across theusual brand tar categories when the Salmonella typhimurium strains TA98and YG1024 were used in the test.
Smith et al. (1996) reported reduced urine mutagenicity when smokers usedcigarettes that mostly heat tobacco compared with using their usual brandof conventional cigarette. In this crossover study, each subject smoked boththeir own brand of cigarette and the cigarette that primarily heats tobacco.The 24-hour urine samples, collected twice weekly from smokers, were testedfor urine mutagenicity and compared with mutagenicity of urine of 14nonsmokers. Subjects were not permitted to eat pan-fried and broiled meats.Urine mutagenicity decreased by 74% after subjects smoked the cigarettethat mostly heats tobacco when the test utilized the bacterial strain YG1024and by 72% when the strain was TA98. The YG1024 strain is more sensitivethan its parent TA98 strain to aromatic nitro, amino, and hydroxylaminocompounds (Watanabe et al., 1990).
Roethig et al. (2005) compared urine mutagenicity for regular smokers ofMarlboro Lights® cigarettes who switched to smoking Accord®, Oasis®, orMarlboro Ultra Lights® cigarettes with that of subjects who continued to smokeMarlboro Lights® or who stopped smoking for 8 days. On Day 8 of the study,urine mutagenicity declined by 53% for those who switched to Accord®
(n = 20), by 66% for those who switched to Oasis® (n = 18), by 26% for thosewho switched to Marlboro Ultra Lights® cigarettes (n = 19), and by 58% forthe no-smoking group (n = 29), but urine mutagenicity for subjects whocontinued to smoke Marlboro Lights® did not decrease (n = 20).

46 Exposure Assessment
For internal use of Philip Morris personnel only.
Urine mutagenicity has been assessed by using tools such as C18 resincolumns (Yamasaki & Ames, 1977), XAD-2 resin (Mohtashamipur et al.,1985), HPLC (Rannug et al., 1988), blue rayon extraction (Einistö et al.,1990), and liquid/liquid extraction of mutagens with dichloromethane orchloroform. The XAD-2 method was described as time-consuming andlaborious. Furthermore, high background mutagenicity of XAD-2 watersample concentrates has been reported (Curvall et al., 1987).
Diet and occupational and environmental exposures influence urinemutagenicity. Elevated cytochrome P450 1A2 (CYP1A2) enzyme activityhas been associated with increased mutagenicity (Pavanello et al., 2002b).Pavanello et al. (2002a) assessed mutagenic activity of urine samples from118 healthy smokers who had been asked to avoid consuming charcoal-grilled and pan-fried meat for 24 hours prior to beginning the study. Theyreported that although various investigators have found differences in urinemutagenicity between smokers and nonsmokers, they have not always showna relationship between urine mutagenicity and daily cigarette consumptionor the amount of nicotine or tar in the smoke from cigarettes (Einistö et al.,1990). Pavanello et al. (2002a) also noted that studies with a small samplesize and not controlled for diet have not shown a relationship between dailycigarette consumption and/or nicotine content of cigarettes.
III.4.4 N-Nitrosamine Biomarkers
III.4.4.1 Tobacco-specific nitrosamines
TSNAs are present only in tobacco products but can be formed in productsthat contain nicotine. They are produced during tobacco drying, fermentation,and pyrolysis (Hoffmann et al., 1994; Spiegelhalder & Bartsch, 1996). Nitratelevels during growth, curing, fermenting, and aging of tobacco influence TSNAlevels (Burton et al., 1992).
The TSNA 4-(methylnitrosamino)-1-(3-pyridyl)-1-butanone (NNK) is formedby nitrosation of nicotine or another tobacco alkaloid, pseudonicotine 4-(methylamino)-1-(3-pyridyl)-1-butanone (Hecht, 2002). N′-Nitrosonornicotine(NNN), another TSNA present in tobacco smoke, is formed via nitrosation ofnicotine, nornicotine, and myosmine (Hecht et al., 1977; Klus & Kuhn, 1975;Zwickenpflug, 2000). The International Agency for Research on Cancer(IARC) categorized NNN and NNK as human carcinogens (in Group 1)(International Agency for Research on Cancer, 2007). N′-Nitrosoanabasine(NAB), a weak carcinogen, and N′-nitrosoanatabine (NAT), which is not aknown carcinogen, have also been measured as biomarkers of tobaccoproduct exposure (Hecht, 1998). Some tobacco companies modified their
Clinical Studies of Potential Reduced-Risk Tobacco Products 47
For internal use of Philip Morris personnel only.
curing processes to reduce TSNA levels, for example, by applying amicrowave curing process (Star Scientific Inc., 1999).
NNK is found in tobacco, MS, and sidestream smoke (SS) (World HealthOrganization, 2004). Tobacco contains 100–960 ng of NNK/cigarette (Trickeret al., 1991). MS yields of NNK were 100–200 ng/cigarette (Chepiga et al.,2000; Hoffmann et al., 1994, 1995; Spiegelhalder & Bartsch, 1996), whereasSS yields of NNK were 386–1444 ng/cigarette (Adams et al., 1987). NNKand NNAL (4-(methylnitrosamino)-1-(3-pyridyl)-1-butanol) induce lungadenocarcinoma in rodents, and NNK has been proposed as a cause ofhuman lung cancer (Hecht & Hoffmann, 1988, 1989). NNN is present intobacco at 400–5340 ng/cigarette and in tobacco MS at 19–855 ng/cigarette(Tricker et al., 1991). It is not known whether reduced exposure to TSNAswould lower tobacco-related morbidity and mortality (Breland et al., 2002b).
III.4.4.1.1 4-(Methylnitrosamino)-1-(3-pyridyl)-1-butanol and metabolites
NNK undergoes extensive metabolism and is not present in urine (Hecht etal., 1999). Its metabolites NNAL, NNAL glucuronides (NNAL-N-Gluc andNNAL-O-Gluc), and total NNAL (the sum of NNAL and its glucuronidemetabolites), have been well studied as biomarkers of tobacco product andsmoke exposure. Consumption of cruciferous vegetables, such as watercress(Nasturtium officinale), inhibits oxidative metabolism of NNK. TSNAs arehighly specific biomarkers of tobacco and nicotine exposure, are directlyrelevant to carcinogen uptake, and can be measured consistently in personswho are exposed to tobacco smoke or who use tobacco products (Carmellaet al., 2003). Given their specificity and ability to show differences betweenPRRTPs and conventional cigarettes, NNAL and NNAL-Gluc are highly usefulbiomarkers of exposure to NNK and LSRO recommends them for routinemeasurement in PRRTP studies (Category A biomarkers).
The elimination half-life of NNAL and NNAL-Gluc is 40–45 days and thedistribution life is 3–4 days (Hecht et al., 1999). Carmella et al. (1993) firstreported higher TSNA metabolites levels for smokers than for nonsmokers.Byrd and Ogden (2003) determined that the mean free NNAL concentrationranges from 101–256 pg/ml and that of NNAL-Gluc, from 247–566 pg/ml.
Carmella et al. (1995) assessed intra-individual variation in urine levels ofNNAL and NNAL-Gluc and found relatively constant excretion from day today and over the long term. They measured levels of NNAL and its NNAL-O-Gluc in the urine of 61 smokers and discovered a 16-fold variation in theNNAL-Gluc:NNAL ratio (Carmella et al., 1995). Inter-individual variability inthese measures was much higher than intra-individual variability. They
48 Exposure Assessment
For internal use of Philip Morris personnel only.
categorized study participants into two phenotypes based on the NNAL-Gluc:NNAL ratio, which they proposed may reflect an ability to metabolizeNNK. NNAL-Gluc is a probably a detoxification product of NNAL and NNK,although this has not been proved. Eighty-five percent of subjects had NNAL-Gluc:NNAL ratios lower than 6, whereas the remaining subjects had ratiosof 6–11. Carmella et al. (1995) suggested that individuals with higher ratiosmay be better protected against cancer than individuals with lower ratios.
Richie, Jr., et al. (1997) showed that Black smokers were more likely thanWhite smokers to fall into the “poor metabolizer” group (NNAL-Gluc:NNALratio < 6) but believed this phenotype unlikely to be due to dietary orsocioeconomic differences or differences in exposure. Furthermore, absolutelevels of NNAL and NNAL-Gluc were higher for Black smokers than for Whitesmokers, although the former tended to smoke fewer cigarettes (Richie, Jr.,et al., 1997).
Breland et al. (2003) measured TSNAs in urine of individuals who smokedtheir own brand of cigarettes, Advance® cigarettes, or no cigarettes. TheAdvance® cigarette, which has a 3-part ionic filter, was developed bycollaboration of Brown and Williamson Tobacco Company and Star ScientificTobacco Company. Marketing information in the Advance® Lights Kings packonsert included a statement that tobacco in Advance® was manufactured byusing a “patented tobacco curing process [that] significantly inhibits theformation of tobacco specific nitrosamines” (Brown & Williamson Tobacco,2002). In this crossover study, 15 light and ultra-light cigarette smokerssmoked their own brand of cigarettes, switched to Advance®, or abstainedfrom smoking for 5 days. Urinary NNAL levels decreased by 51% when theysmoked Advance® and 70% when smokers abstained from smokingcompared with when they smoked their own brand.
In another crossover study, a group of 10 men and 7 women (group A)initially smoked Advance® cigarettes for 4 weeks and then switched to theirusual brand of light cigarette. Another group of 10 men and 6 women (groupB) first used their usual brand for 4 weeks and then switched to Advance®
cigarettes (Melikian et al., 2003). Twelve-hour urine samples were collectedat baseline (week 0), at crossover time (week 4), and at the final visit (week8). Urine samples were analyzed for levels of NNAL, S-phenylmercapturicacid (S-PMA), and trans,trans-muconic acid (t,t-MA) (metabolites of volatilebenzene); 1-hydroxypyrene, a marker for polycyclic aromatic hydrocarbons);thiocyanate, a metabolite of hydrogen cyanide (HCN); cotinine; and creatinine.After 4 weeks of smoking the Advance® cigarette, levels of urinary NNALwere reduced by approximately 60%, those of S-PMA and t,t-MA were

Clinical Studies of Potential Reduced-Risk Tobacco Products 49
For internal use of Philip Morris personnel only.
respectively about 46% and 40% lower, that of 1-hydroxypyrene was reducedby 45%, and that of thiocyanate was reduced by 20% (Melikian et al., 2003).
Omni® cigarettes yield 53% lower TSNA values than conventional cigaretteswhen smoked using the FTC cigarette machine-smoking regimen. Hugheset al. (2004) conducted a 12-week randomized crossover study in which 19smokers of light or ultra-light cigarettes smoked either their own cigarettesor Omni® cigarettes for 6 weeks and then switched to smoking the type ofcigarette they had not smoked in the first part of the study. Total NNAL levelsshowed no significant reduction when subjects used Omni® cigarettescompared with their own brand. The authors noted that the small samplesize (34 study participants) may have contributed to this finding.
Hatsukami et al. (2004b) reported significant decreases in urine TSNA levelsfor 38 individuals who switched from their own brand of conventionalcigarettes to Omni® cigarettes (p = 0.003) or the nicotine patch (p < 0.001)for 4 weeks. The mean NNAL concentration before switching to Omni®
cigarettes for 4 weeks was 2.4 pmol total NNAL/mg creatinine (95% CI = 1.8to 3.0). After 4 weeks, the level decreased to 1.5 pmol/mg creatinine (95%CI = 1.1 to 1.9) (Hatsukami et al., 2004b). Since the number of cigarettessmoked per day changed with use of the Omni® cigarettes, ratios of totalNNAL/cigarettes per day and total NNAL/cotinine level were calculated andshowed significant reductions (p < 0.001 and p = 0.009).
Levels of NNAL and NNAL-Gluc for individuals attempting to quit smokinghave also been analyzed. Hecht et al. (1999) measured urine levels of freeNNAL and NNAL-O-Gluc in 27 smokers before and after smoking cessation.NNAL means ± SD and ranges were, respectively, 944 ± 517 and 180 ±2080 pmol/ml; those for NNAL-O-Gluc were 2200 ± 1130 and 280 ± 4970pmol/ml. At 1, 3, and 6 weeks after smoking cessation, NNAL levels(expressed as a percentage of levels before smoking cessation) were 34.5%,15.3%, and 7.6%, respectively. At 281 days after quitting, NNAL and NNAL-Gluc levels were not detectable in the urine of 3 of 5 former smokers whowere called back; however, urine NNAL concentrations for 2 of 5 subjectsremained above those of 2 nonsmokers. Mean ± SD urine NNAL levels forthe two former smokers and 21 nonsmokers were 0.025 ± 0.029 pmol/mland 0.016 ± 0.029 pmol/ml, respectively (Hecht et al., 1999).
The utility of NNAL and NNAL-Gluc as measures of decreased daily cigaretteconsumption has also been assessed. Hecht et al. (2004b) quantified NNALand NNAL-Gluc for individuals who reduced their daily cigarette consumptionby 40–70% for up to 26 weeks. They reported overall modest decreases in

50 Exposure Assessment
For internal use of Philip Morris personnel only.
NNAL and NNAL-Gluc that were sometimes not maintained. The authorsproposed that smokers may have compensated for fewer cigarettes per dayby smoking cigarettes differently, thereby changing NNK delivery.
Interindividual differences in metabolism and exposure intensity may alsocontribute to a lower than expected reduction in exposure to tobacco smokecarcinogens for given changes in cigarette design. Melikian et al. (2007a)measured yields of NNK, nicotine, and benzo[a]pyrene (B[a]P) in MS thatwas generated by using cigarette smoking machine settings that mimickedindividual puffing behavior of each of 257 smokers of low-, medium-, andhigh-yield cigarettes and compared them to metabolite levels. Although thedelivered dose of smoke toxins to smokers of low-yield cigarettes was lowerthan that to smokers of high-yield cigarettes, the amount of metabolite perparent smoke constituent was higher for smokers of low-yield cigarettes.Gender and race may also modify urinary biomarker levels (Benowitz et al.,2004, 2006; Melikian et al., 2004, 2007b).
Exposure to ETS is consistently associated with increased urine levels ofNNAL and NNAL-Gluc in nonsmokers (Anderson et al., 2001; Hecht et al.,1993, 2001; Meger et al., 2000; Parsons et al., 1998). The mean ± SD oftotal NNAL concentration for nonsmokers exposed to ETS (n = 18) was0.042 ± 0.20 pmol/mg creatinine (Carmella et al., 2003). Hecht et al. (2001)measured NNAL and NNAL-Gluc levels in urine samples from elementaryschool age children and reported significantly higher levels (mean = 0.05pmol/ml urine) of these substances with ETS exposure (reported by children’scaregivers) than without it.
Tulunay et al. (2005) analyzed NNAL and NNAL-Gluc in 24-hour urinesamples collected from hospital workers who were nonsmokers. The meantotal NNAL was 0.066 pmol/ml urine, and most study participants had levelsof total NNAL above 0.01 pmol/ml; a concentration generally seen in non-exposed individuals. Women whose husbands smoked had approximately 6times higher levels of total NNAL than women with non-smoking husbands:0.045 pmol/mg creatinine (95% CI = 0.027–0.073) versus 0.007 pmol/mgcreatinine (95% CI = 0.004–0.010) (Anderson et al., 2001). (See Table 4 inHecht et al. (2001) for a summary of NNAL and NNAL-Gluc levels in variousnon-smoking populations.)
Various methods can quantitate TSNA levels. Different groups have usedGC coupled to a thermal energy analyzer (GC-TEA) (Benowitz et al., 2002;Carmella, 1995, 2003; Meger, 2000; Muscat, 2005; Parsons, 1998). TheGC-TEA method used by Carmella and others (2003) has twice the analytical

Clinical Studies of Potential Reduced-Risk Tobacco Products 51
For internal use of Philip Morris personnel only.
speed of the older method (GC-tandem mass spectrometry), is moresensitive, produces cleaner samples, and includes an internal standard.However, Carmella et al. (2003) also found that GC-tandem massspectrometry, with mass spectrometry operating in the positive ion chemicalionization mode, a transition of m/z 282→162, and resolution set at 0.5amu, used to measure the urine analytes had a lower limit of detection forNNAL (30 fmol) compared with that for GC-TEA (120 fmol).
LC-tandem mass spectrometry involves one solid-phase extraction step andtandem mass spectrometry monitoring after electrospray ionization and hasbeen used for simultaneous analysis of NNAL and its glucuronides in urine(Byrd & Ogden, 2003). Byrd and Ogden (2003) described this method asbeing simpler to perform than GC-TEA but having adequate specificity formeasuring TSNA metabolites. Compared with GC, the method is faster,requires less sample analysis time, has greater sample throughput capacity,and requires a small sample volume. The method was validated using theFood and Drug Administration, Center for Drug Evaluation and Researchvalidation criteria (U.S. Food and Drug Administration, 2001).
Carmella et al. (2005) also used an LC-based technique (LC-electrosprayionization-tandem mass spectrometry) to measure total NNAL (NNAL +NNAL-Gluc) in plasma. This method required a 1-ml plasma sample, whereasthe Hecht et al. (1999, 2002) method needed a 5- to 10-ml sample.
NNAL + NNAL-Gluc levels and cotinine excretion are correlated [correlationcoefficient (r) = 0.90] but not NNAL + NNAL-Gluc levels and the numberof cigarettes smoked on the day of urine collection (Meger et al., 1996).NNAL + NNAL-Gluc concentrations are a most useful measure of tobaccoproduct and smoke exposure.
III.4.4.1.2 4-Hydroxy-1-(3-pyridyl)-1-butanone-DNA adducts in lung
Nitrosation of NNN and NNK leads to creation of an intermediate that canform adducts with DNA and Hb. Adducts of 4-hydroxy-1-(3-pyridyl)-1-butanone (HPB) and DNA in lung reflect exposure to NNK and are biomarkersof particulate phase exposure (Carmella & Hecht, 1987). HPB-DNA adductsreflect an exposure time of more than 1 month (Scherer, 2005). Given theease of sampling and established differences between smokers andnonsmokers and PRRTP studies that exist for TSNA urinary metabolites,LSRO considers measurement of urinary TSNA metabolites the preferredmethod and therefore does not recommend routine analysis of HPB-DNAadduct formation in PRRTP studies (Category C biomarker).

52 Exposure Assessment
For internal use of Philip Morris personnel only.
Levels of HPB-DNA adducts in smokers are approximately 10-fold thelevels in nonsmokers (Scherer, 2005). Foiles et al. (1991) measured HPB-DNA adducts in autopsy samples from the peripheral lung andtracheobronchial tree of smokers and nonsmokers. Mean ± SD adductlevels in peripheral lung tissue were 11 ± 16 fmol/mg DNA for 9 smokersand 0.9 ± 2.3 fmol/mg DNA for 8 nonsmokers. Corresponding values ofadduct levels in tracheobronchi were 16 ± 18 fmol/mg DNA for 4 smokersand 0.9 ± 1.7 fmol/mg DNA for 8 nonsmokers. Considerable inter-individualvariation exists in HPB-DNA adduct levels, which limits the usefulness ofthis indicator as a measure of exposure to tobacco smoke (Foiles et al.,1991).
In a more recent study, Hölzle et al. (2007) used GC-mass spectrometry inthe negative ion chemical ionization mode, based on the method used byFoiles et al. (1991), to evaluate HPB-releasing DNA adducts in peripherallung tissue samples. They reported that adduct levels in 21 smokers’ lungs(404 ± 258 fmol HPB/mg DNA) were significantly higher than levels in 11nonsmokers’ lungs (59 ± 56 fmol HPB/mg DNA) (p < 0.0001). Although theGC-mass spectrometry method allows detection of approximately 7-folddifferences in levels between smokers and nonsmokers, analysis of NNALand NNAL-Gluc in urine, with reported 100-fold differences between smokersand nonsmokers, is considered a better measure of TSNA exposure.
III.4.4.1.3 4-Hydroxyl-1-(3-pyridyl)-1-butanone-hemoglobin adducts
HPB-Hb adducts are biomarkers of particulate phase exposure. Theseadducts persist over the lifetime of the erythrocyte. Levels in smokers areapproximately twice as high as those in nonsmokers.
Carmella et al. (1990) measured HPB-Hb adduct levels in smokers (n = 40)and nonsmokers (n = 21). Mean adduct levels were 0.080 pmol/g Hb forsmokers, and 0.0293 pmol/g Hb for nonsmokers.
Analytical methods for HPB-Hb adducts include GC-mass spectrometry(Hecht et al., 1991) and capillary column GC with detection by negative ionchemical ionization (Carmella et al., 1990). The small difference (2- to 3-fold) in adduct levels between smokers and nonsmokers is a majordisadvantage of this biomarker as a measure of tobacco smoke exposure(Hölzle et al., 2007; Wilp et al., 2002).
Because of the better quantification of urinary metabolites of TSNAs(Category A biomarkers), LSRO ranks HPB-Hb adducts as Category Cbiomarkers.

Clinical Studies of Potential Reduced-Risk Tobacco Products 53
For internal use of Philip Morris personnel only.
III.4.4.2 N′′′′′-Nitrosonornicotine adducts
NNN is metabolized via two mechanisms to produce electrophiles that formadducts with DNA (Hecht, 1998). Upadhyaya et al. (2006) recently reportedthe identification of deoxyguanosine and DNA adducts from the 5′-hydroxylation pathway of NNN metabolism and noted that these adductsare potential biomarkers of metabolic activation for smokers. Thesebiomarkers will require additional study and LSRO does not recommendtheir routine measurement as biomarkers of exposure to TSNAs in PRRTPstudies.
III.4.4.3 N′′′′′-Nitrosonornicotine, N′′′′′-Nitrosoanatabine, N′′′′′-Nitrosoanabasine,and their pyridine N-Glucuronides in urine
NNN, NAT, NAB, and their pyridine N-glucuronides in urine are newermeasures of TSNA exposure. NAT and NAB are formed via nitrosation ofanatabine and anabasine, respectively. Specific analysis of NNN uptake waspreviously difficult, because NNN metabolites in urine are also metabolitesof alkaloids found at higher levels in tobacco than NNN. Stepanov and Hecht(2005) first measured these substances in urine samples from smokers (n =14). The mean ± SD values for NNN, NNN-N-Gluc, NAT, and NAB were0.086 ± 0.12 pmol/mg creatinine, 0.096 ± 0.11 pmol/mg creatinine, 0.19 ±0.20 pmol/mg creatinine, and 0.04 ± 0.039 pmol/mg creatinine, respectively(Stepanov & Hecht, 2005).
These biomarkers may have future application, but at present, LSRO doesnot recommend these biomarkers for routine use in PRRTP studies andcategorizes them as Category C biomarkers.
III.4.4.4 N-Nitrosoproline and other nitrosamino compounds
N-Nitrosoproline (NPRO), N-Nitrosarcosine (NSAR), N-Nitrosothiazolidine-4-carboxylic acid (NTCA), and N-Nitroso-2-methylthiazolidine-4-carboxylicacid (NMTCA) are the major non-volatile nitrosamines found in urine.Endogenous nitrosation of proline has been studied in smokers andnonsmokers after ingestion of nitrate and proline. Hoffmann and Brunnemann(1983) reported that NPRO levels in smokers’ urine was significantly higherthan levels in nonsmokers’ urine when study participants ate a restricted diet.
Ladd et al. (1984) reported no significant difference between baseline levelsof NPRO in urine of smokers and nonsmokers when study participants hadnot ingested nitrate or proline. Ingestion of proline alone did not producedifferent NPRO levels, but consumption of nitrate and proline resulted inapproximately 2.5 higher levels of NPRO in smokers’ 24-hour urine samples.

54 Exposure Assessment
For internal use of Philip Morris personnel only.
NTCA and NMTCA have been detected in urine of smokers and nonsmokers(Ohshima et al., 1984). Although some studies reported an effect of smokingon levels of total non-volatile nitrosamines (NSAR, NPRO, NTCA, andNMTCA) (Malaveille et al., 1989; Tsuda et al., 1986), others showed noeffect of smoking (Knight et al., 1991; Nair et al., 1986; Ohshima et al.,1984). Nitrosodimethylamine (NDMA) levels in urine are significantly higherfor individuals who consume alcohol but do not smoke and individuals whoconsume alcohol and smoke than for non-smoking non-drinkers (Cooneyet al., 1986).
LSRO does not recommend routine measurement of these N-nitrosocompounds (Category C biomarkers) and, as noted previously, recommendsthat NNAL and its metabolites be used as markers of TSNA exposure fromtobacco smoke.
III.4.5 Aromatic Amine Biomarkers
III. 4.5.1 Aromatic amine-hemoglobin adducts
III.4.5.1.1 4-Aminobiphenyl-hemoglobin adducts
IARC categorized the aromatic amine 4-ABP as a human bladdercarcinogen (Group 1). The most widely used method for analysis isGC-mass spectrometry in the negative ion chemical ionization mode(Richter & Branner, 2002). 4-ABP is found in MS at levels of 1–100 ng/cigarette (Patrianakos et al., 1979), but levels in ETS are 20–30 times higherthan those in MS. 4-ABP-Hb adducts reflect exposure to the particulatephase of tobacco smoke. Most studies have reported higher 4-ABP-Hbadduct levels in smokers than in nonsmokers (Bryant et al., 1987; Pereraet al., 1987; Weston & Bowman, 1991), in fact by 3- to 8-fold (Bryant et al.,1987; Coghlin et al., 1991; Dallinga et al., 1998; Falter et al., 1994; Hammondet al., 1993; Perera et al., 1987; Stillwell et al., 1987). A representative ratioof 4-ABP-Hb adducts in smokers compared with nonsmokers is 5.5(Scherer, 2005). The half-life of 4-ABP-Hb adducts is 7–9 weeks (Maclureet al., 1990; Mooney et al., 1995). They reflect a cumulative 4-monthexposure.
Various studies reported a dose-response relationship between smokingand 4-ABP-Hb adducts (Bartsch et al., 1990; Vineis et al., 1990; Yu et al.,1994). These adducts have been used as biomarkers of exposure in PRRTPstudies and have revealed differences between conventional cigarettes andPRRTPs. Because of the relative consistency of 4-ABP-Hb adducts indistinguishing between smokers and nonsmokers, LSRO ranks themCategory A biomarkers.
Clinical Studies of Potential Reduced-Risk Tobacco Products 55
For internal use of Philip Morris personnel only.
Cigarette tobacco type influences 4-ABP levels (Bryant et al., 1988). Smokersof black tobacco have 40–50% higher 4-ABP-Hb levels than smokers ofblond tobacco. Vineis et al. (1996) measured 4-ABP adducts in exfoliatedbladder cells from 50 nonsmokers, 31 flue-cured tobacco smokers, and16 air-cured tobacco smokers. Means ± SE for these adducts were 28 ± 3,103 ± 9.9, and 146 ± 11 pg/g Hb, respectively.
Mooney et al. (1995) measured 4-ABP-Hb adducts in 16 individuals whosmoked more than 20 cigarettes/day and who were trying to quit smoking.Mean ± SD adduct levels measured before quitting and at 10 weeks,8 months, and 14 months after smoking cessation were 18.9 ± 8.7 nM/mHb(n = 16), 8.1 ± 5.0 nM/mHb (n = 16), 4.7 ± 3.5 nM/mHb (n = 16), and4.8 ± 2.3 nM/mHb (n = 15), respectively. Adduct levels were significantlydifferent from values before quitting at every time point measured afterbaseline, but no significant difference was found between adduct levels at8 and 14 months.
Maclure et al. (1990) showed that smoking cessation reduces 4-ABP-HB adductlevels. They measured adduct levels for 34 smokers on the day that they quitsmoking, at 3 weeks after quitting, and at 2 months after quitting. Adductlevels decreased from a mean ± SD at baseline of 120 ± 7 to a3-week value of 82 ± 6 pg/g Hb. For 15 subjects who continued to refrain fromsmoking, levels declined further to 34 ± 5 pg/g Hb at 2 months after cessation.
4-ABP-Hb adducts have also been measured in individuals who reduceddaily cigarette consumption. Smokers of more than 40 cigarettes/day wereprovided with nicotine inhalers and asked to decrease the number ofcigarettes smoked to 30 cigarettes/day by the end of week 4 of the study, to20 cigarettes/day by the end of week 8, and to 10 cigarettes/day by the endof week 24 (Hurt et al., 2000). Mean ± SD values for 4-ABP-Hb adductsmeasured at baseline and at weeks 12 and 24 were, respectively, 10.4 ± 2.7nmol/mol Hb; (range = 7.0 17.2 nmol/mol Hb; n = 16), 11.3 ± 4.4 nmol/molHb (range = 5.6 22.0; n = 15), and 9.5 ± 2.5 (range = 5.3 14.3; n = 16). In thisstudy, 4-ABP-Hb adduct levels at weeks 12 and 24 showed no significantreduction from baseline.
There are limitations to the use of 4-ABP as a measure of tobacco smokeexposure. One such limitation is potential confounding from trace amountsof aromatic amines in the environment (Richter & Branner, 2002). Non-tobacco sources of 4-ABP exposure include diesel fuel exhaust, heatedcooking fuels, hair dyes, and diet. 4-Nitrobiphenyl, a product of incompletecombustion of diesel fuels, can be metabolized to 4-ABP. 4-ABP-Hb adduct
56 Exposure Assessment
For internal use of Philip Morris personnel only.
levels are also influenced by N-acetyltransferase 2 and CYP1A2 status.Individuals who are slow acetylators and extensive N-hydroxylators haveelevated adduct levels (Bartsch et al., 1990; Riffelmann et al., 1995; Vineiset al., 1990; Yu et al., 1994). Ethnic and racial differences may be accountedfor by differences in numbers of slow acetylators between groups (Vineis etal., 1990; Yu et al., 1994). Slow acetylators were reported to have highermean levels of 4-ABP-Hb adducts (Vineis et al., 1990; Yu et al., 1994). Yu etal. (1994) studied the prevalence of the slow acetylator phenotype in 47Black men, 44 White men, and 42 Asian men; 34%, 54%, and 14%,respectively, were slow acetylators.
III.4.5.1.2 Other aromatic amine-hemoglobin adducts
Stillwell et al. (1987) reported that levels of Hb adducts of o-toluidine,p-toluidine, 2-naphthylamine, and 4-ABP were elevated in smokers (n = 12)as compared with nonsmokers (n = 10). Although smokers had 2- to 3-foldhigher values for Hb adducts of o-toluidine, p-toluidine, and 2-naphthylaminecompared with nonsmokers, 4-ABP-Hb adduct levels were 6-fold higher thanthose of nonsmokers. Levels of Hb adducts of m-toluidine, another aromaticamine, were not different for smokers and nonsmokers. LSRO recommends4-ABP-Hb adducts for assessing aromatic amine exposure, and does notrecommend routine measurement of other aromatic amines in Category C.
Richter et al. (1995) compared Hb adduct levels of the aromatic aminesaniline, o-toluidine, m-toluidine, p-toluidine, 2-ethylaniline, 2,4-dimethylaniline,o-anisidine, 3-aminobiphenyl (3-ABP), and 4-ABP in smoking women(n = 27) and non-smoking women who were pregnant (n = 73) in Germany.Compared with nonsmokers, smokers had significantly elevated levelsof adducts of Hb with o-toluidine (p < 0.0001), p-toluidine (p < 0.001),2,4-dimethylaniline (p < 0.018), 3-ABP (p < 0.001), and 4-ABP (p < 0.0001).
Riffelmann et al. (1995) also measured urinary aromatic amines and 4-ABP-Hb adducts for men with occupational exposure to aromatic amines andmen who were not known to have such exposure. They reported significantdifferences in urinary 2-aminonaphthalene for 22 exposed smokers and 21exposed nonsmokers (mean ± SD = 3.9 ± 2.2 versus 2.1 ± 2.8 ug/L,respectively; p = 0.0116), as well as for 8 non-occupationally exposedsmokers and 8 nonsmokers (mean ± SD = 3.1 ± 2.1 versus 0.5 ± 0.7 ug/L,respectively; p = 0.0128). Significant differences (p = 0.0001) existed in means± SD for 4-ABP-Hb adducts for 22 occupationally exposed smokers(19.9 ± 7.1 ng/L) and 21 occupationally exposed nonsmokers (7.3 ± 3.6 ng/L).

Clinical Studies of Potential Reduced-Risk Tobacco Products 57
For internal use of Philip Morris personnel only.
III.4.5.2 4-Aminobiphenyl-DNA adducts
4-ABP exposure has been measured as 4-ABP-DNA adducts. Analyticalmethods include immunoassays, 32P-postlabeling–HPLC, and GC-massspectrometry (Skipper & Tannenbaum, 1994). Hsu et al. (1997) analyzedimmunoperoxidase to quantify 4-ABP-DNA adduct levels in oral mucosaand exfoliated urothelial cells of smokers. Mean ± SD relative staining intensityof urothelial cells was significantly greater (~1.7-fold) for 20 smokers thanfor nonsmokers (517 ± 137 versus 313 ± 79; p < 0.0005). The relative stainingintensity of oral mucosa cells was also significantly higher for smokers thanfor nonsmokers (552 ± 157 versus 326 ± 101; p < 0.0005. A 3-fold variationin staining intensity for smokers and nonsmokers was observed.
Flamini et al. (1998) measured 4-ABP-DNA adduct levels in laryngeal tissuesby using 3C8 monoclonal antibody, which is highly specific for 4-ABP. Forsmokers and nonsmokers, a significant difference was found in adduct levelsin polyps and surrounding tissue but not tumor tissues. The variation in4-ABP levels was approximately 6-fold for smokers and 5-fold for nonsmokers(Flamini et al., 1998).
4-ABP-Hb adducts are more useful than 4-ABP-DNA adducts for PRRTPstudies. 4-ABP-Hb adducts are the best studied aromatic amine-Hb adductand reflect exposure to a Group 1 carcinogen. LSRO recommendsmeasurement of 4-ABP-Hb adducts rather than 4-ABP-DNA adducts.
III.4.5.3 Urinary aromatic amines
Grimmer et al. (2000) reported that mean ± SD values for total aromaticamines (1-aminonaphthalene, 2-aminonaphthalene, 2-aminobiphenyl, and4-ABP) in urine of 12 smokers were more than 2-fold higher than levels inurine of 14 nonsmokers (736 ± 911 versus 303 ± 516 ng/24 hours) and 22passive smokers (272 ng/24 hours). This difference was mainly due toincreased 1-aminonaphthalene. The authors reported no significantdifferences in levels of urinary aromatic amines for nonsmokers and passivesmokers and in levels of 2-aminonaphthalene and 4-ABP between groups.LSRO recommends measurement of 4-ABP-Hb adducts rather than urinelevels of aromatic amines.

58 Exposure Assessment
For internal use of Philip Morris personnel only.
III.4.6 Benzene Biomarkers
III.4.6.1 Benzene
Benzene is a component of the gas phase of tobacco smoke and is abiomarker of exposure to aromatic hydrocarbons. Benzene is a known humancarcinogen (IARC Group 1) that is found in MS at 54–73 μg (47–67 ppm)per cigarette (Wallace et al., 1987). Vehicular travel, pumping gasoline intoautomobiles, gas vapors from from attached garages, and emissions frommaterials such as latex paint, tapes, marking pens, and other consumerproducts are other sources of benzene (Wallace, 1989). Benzene is alsoproduced as a component of vehicle exhaust, by petrochemical industryprocesses, and by organic material pyrolysis (Scherer et al., 1998). Benzenehas been measured in blood, breath, and urine. LSRO considers benzenein biological fluids to be a Category C biomarker because other benzene-related biomarkers (S-PMA and t,t,-MA) are more reliable for measuringbenzene exposure. Measurement of benzene and other volatile organiccompounds in breath is a promising technique that may be used routinelyfor PRRTP studies, however.
Wallace and Pellizari (1986) showed that breath benzene concentrationsfor 198 smokers were significantly higher than those for 322 nonsmokers(16 versus 2.5 μg/m3; p < 0.001). They found a significant dose-responserelationship between the number of cigarettes smoked and breath benzenelevels (p < 0.01). Breath benzene levels decreased to those of nonsmokerswithin an hour of smoking a cigarette (Jordan et al., 1995). Gordon et al.(2002) used a real-time approach to measure breath levels of volatileorganic compounds as indicators of active and passive smoking. Theyreported the mean ± SD value of benzene in nonsmokers’ breath to be25.7 ± 12.9 μg/m3 (n = 4) and the value in smokers’ breath to be 478 ± 144μg/m3 (n = 5).
Brugnone et al. (1998) measured blood benzene levels for 167 individualswho had occupational exposure to benzene and 243 individuals who did nothave such exposure (general population). Smokers in the general populationhad significantly higher blood benzene concentrations (264 ± 178 ng/L) thannonsmokers (123 ± 74 ng/L). Smokers who had occupational exposure tobenzene also had significantly higher blood benzene values (584 ± 372 ng/L)than occupationally exposed nonsmokers (289 ± 307 ng/L).
Perbellini et al. (2002) also measured benzene levels in blood and urine of10 individuals who smoked 3–20 cigarettes/day and 15 nonsmokers. Allsubjects were woodworkers who lived in a rural area. Smokers’ urine samples

Clinical Studies of Potential Reduced-Risk Tobacco Products 59
For internal use of Philip Morris personnel only.
had significantly higher amounts of benzene than did nonsmokers’ urinesamples (median = 125 versus 77 ng/L; p < 0.05). Blood levels of benzenewere also significantly higher for smokers than for nonsmokers (246 versus87 ng/L). Benzene levels in blood were approximately 2.7-fold higher thanlevels in urine (Perbellini et al., 2002). Other researchers found higher levelsof benzene in urine than in blood, however, and benzene levels varyconsiderably when measured by different investigators (Perbellini et al.,2002). Benzene levels are typically higher in smokers than in nonsmokers;however, urinary benzene levels vary widely for similar benzene exposures(Ong et al., 1995, 1996).
The headspace technique with GC-mass spectrometry has been used toquantify benzene in blood and urine (Perbellini et al., 2002). Toluene,ethylbenzene, and xylene can also be measured. Advantages of thismethod include easy sample preparation, a requirement for small volumes,and good repeatability and linearity in the range of interest (Perbellini etal., 2002). Urine samples are thought to have slightly higher sensitivitythan blood samples. Solid phase microextraction for sampling chemicalsfrom the headspace of urine with GC-mass spectrometry for selectiveanalysis of chemicals has also served to measure benzene levels(Fustinoni et al., 1999).
III.4.6.2 trans,trans-Muconic acid (trans,trans-2,4-hexadienedioic acid)
Approximately 2–25% of total benzene is found as t,t-MA in urine (Boogaard& van Sittert, 1995; Inoue et al., 1989; Scherer et al., 1998). The eliminationhalf-life of t,t-MA is estimated at 5 ± 2.3 hours (Scherer et al., 1998). Ong etal. (1994) showed a dose-response relationship for cigarette smoking andt,t-MA levels (r = 0.47). LSRO recommends routine measurement of t,t-MAin PRRTP evaluations (Category A biomarker).
Sorbic acid (trans,trans-2,4-hexadienoic acid), a preservative found in foodproducts, can be converted to t,t-MA, which contributes to background levelsof t,t-MA and reduces its specificity as a biomarker of tobacco smokeexposure (Hecht, 2002; Scherer et al., 1998). Lee et al. (2005) reported thatthis interference was not significant, however. Coexposure to toluene inhibitsformation of t,t-MA from benzene in rats and humans. Genetic polymorphismsmay influence conversion of benzene to t,t-MA (Gobba et al., 1997; Rossiet al., 1999).
Melikian et al. (1993) measured t,t-MA levels in urine of 42 smokers and 42nonsmokers and found approximately 3-fold higher levels for smokers(mean ± SE = 0.29 ± 0.04 mg/g creatinine, range = 0.02–1.3) than for

60 Exposure Assessment
For internal use of Philip Morris personnel only.
nonsmokers (mean ± SE = 0.09 ± 0.02 mg/g creatinine, range = not detectable[ND]–0.52; p = 0.0001). Ong et al. (1994) reported higher t,t-MA levels in urinefor smokers (mean ± SD = 0.19 ± 0.09 mg/g creatinine; n = 46) than fornonsmokers (mean ± SD = 0.14 ± 0.07 mg/g creatinine; n = 40,p = 0.04), but this difference was not significant.
Liquid chromatography has been used for spectrophotometric determinationof t,t-MA. The authors describe this method as being more cost-effective,easy to perform, and convenient than mass spectrometry.
III.4.6.3 S-Phenylmercapturic acid (N-acetyl-S-phenyl-L-cysteine)
S-Phenylmercapturic acid (S-PMA) or phenylhydroxyethylmercapturic acid(PheMA), another benzene metabolite, is thought to form via enzymaticdegradation of the glutathione adduct (Farmer et al., 2005). A relatively lowpercentage of benzene (0.005–0.3%) is converted to S-PMA (Boogaard &van Sittert, 1995; Melikian et al., 2002). The half-life of S-PMA is approximately9 hours (Boogaard & van Sittert, 1995, 1996). As noted previously, multiplesources of benzene exposure exist; therefore, benzene is not a specificbiomarker of tobacco smoke exposure. However, significantly higher levelsof S-PMA, which is considered a highly specific marker of benzene exposure(Ghittori et al., 1995), were reported in smokers than in nonsmokers(Boogaard & van Sittert, 1996; Scherer et al., 2001). Melikian et al. (2002)considered S-PMA to be a more sensitive biomarker of benzene exposurecompared with t,t-MA. LSRO ranks S-PMA as a Category A biomarker.
Boogaard and van Sittert (1996) determined the urinary S-PMA concentrationfor 38 nonsmokers and 14 smokers. Mean ± SE concentrations of S-PMAfor smokers and nonsmokers were significantly different (1.71 ± 0.27 versus0.94 ± 0.15 mol/mol creatinine, respectively; p = 0.013).
S-PMA levels in nonsmokers and individuals who do not have occupationalexposure to benzene range between 1 and 2 μg/g creatinine (Farmer et al.,2005).
Rossi et al. (1999) showed that differences in genetic polymorphisms ofCYP2D6, glutathione S-transferase 1, and NAD(P)H:quinone oxidoreductasemay play a role in variation in metabolism of benzene. (See Farmer et al.(2005) for a summary of analytical methods for S-PMAs.)
For benzene levels less than 1 ppm, S-PMA does not indicate benzeneexposure as effectively as do other benzene biomarkers (Kivistö et al., 1997).
Clinical Studies of Potential Reduced-Risk Tobacco Products 61
For internal use of Philip Morris personnel only.
Farmer et al. (2005) did not consider S-PMA to provide a valid measure ofexposure to low benzene concentrations.
Feng et al. (2006) measured urinary S-PMA and t,t-MA levels for 110 regularsmokers of a conventional cigarette that delivered approximately 11 mg tar/cigarette. Thirty subjects were assigned to a stop smoking group; 80 smokerswere randomly divided into 4 smoking groups of 20 each: to continue smokingtheir own brand of conventional cigarette, to switch to smoking a conventionalcigarette that delivered 3 mg tar/cigarette, or to change to using one of twoelectrically heated smoking systems (EHCSSs) for 8 days. Both t,t-MA andS-PMA distinguished between benzene exposure from smoking conventionalcigarettes and the different EHCSSs. Although S-PMA was more variablethan t,t-MA, Feng et al. (2006) considered it to be a better biomarker ofbenzene exposure than t,t-MA because of higher background levels of t,t-MA from sorbic acid.
III.4.7 1,3-Butadiene Biomarkers
III.4.7.1 Monohydroxybutenyl mercapturic acids and dihydroxybutylmercapturic acid
Monohydroxybutenyl mercapturic acids (MHBMA, or MII) and dihydroxybutylmercapturic acid (DHBMA, or MI) are the major urinary metabolites of1,3-butadiene. 1,3-Butadiene is classified by IARC as “probably carcinogenicto humans” (Group 2A) (International Agency for Research on Cancer, 1999),and by the US National Toxicology Program as a “known human carcinogen”(National Toxicology Program, 2005). The range of 1,3-butadiene in MS is16–75 μg/cigarette; that in SS is 205–361 μg/cigarette (Brunnemann et al.,1990). 1,3-Butadiene is found in the gas phase of cigarette smoke and is nota specific biomarker of tobacco smoke exposure because of occupationaland other exposures. 1,3-Butadiene is used for rubber resin and latexmanufacturing and is a component of motor vehicle exhaust (Fustinoni etal., 2002). LSRO categorizes MHBMA as a Category A biomarker andDHBMA as a Category B biomarker.
Half-lives of DHBMA and MHBMA are approximately 12 hours (Scherer, 2005).Urban et al. (2003) reported a significant difference in urine levels of MHBMAof 10 nonsmokers and 10 smokers: mean ± SE values (μg/24 hours)were 12.5 ± 1.0 (range = 7.0–18.0) in nonsmokers and 86.4 ± 14.0(range = 15.2–145.1) in smokers (p < 0.001). No significant differencein excreted DNBMA was found between nonsmokers and smokers:mean ± SE values (μg/24 hours) were 459 ± 72 (range = 209–898) and644 ± 90 (range = 116–1084), respectively.

62 Exposure Assessment
For internal use of Philip Morris personnel only.
GC tandem mass spectrometry with negative ion chemical ionization (vanSittert et al., 2000) has been utilized to analyze MHBMA and DHBMA inurine. A strength of this assay is the small sample volume required (1 ml).Rapid LC-tandem mass spectrometry has been used for the same purpose(Urban et al., 2003). This method is faster than the GC method and stillrequires only a small sample volume (5 ml).
A weak correlation has been noted between MHBMA and DHBMA levelsand other biomarkers of exposure (e.g., exhaled air and salivary cotinine)possibly because of the small sample size (Urban et al., 2003). van Sittert etal. (2000) determined that MHBMA was better than DHBMA at measuringlower exposures to 1,3-butadiene. They reported relatively high backgroundconcentrations of DHBMA in urine.
III.4.7.2 1,3-Butadiene adducts
Other biomarkers of 1,3-butadiene exposure include Hb adducts of 1,3-butadiene and 1- and 2-hydroxy-3-butenyl valine (MHBVal). MHBVal adductshave been measured in blood samples via GC-tandem mass spectrometry(Richardson et al., 1996). In unexposed men, MHBVal levels ranged between0.1 and 1.2 pmol/g Hb; levels in exposed men ranged from 0.6 to 3.8 pmol/g Hb. MHBVal has been described by van Sittert et al. (2000) as a sensitivetool for measuring cumulative environmental exposure to 1,3-butadiene butthey reported no effect of smoking on MHBVal levels.
Cigarette smokers had significantly higher levels of N-(2,3,4-trihydroxybutyl)valine-Hb adducts than nonsmokers (Fustinoni et al., 2002).
LSRO does not recommend routine measurement of these adducts inPRRTP studies because assays of MHBMA and DHBMA are simpler. LSROranks 1,3-butadiene adducts as Category C biomarkers.
III.4.8 Acrolein Biomarker
Acrolein is found in the gas phase of cigarette smoke. Sources of acroleinexposure other than tobacco smoke include motor vehicle exhaust, burningfatty food, occupational exposure, and treatment with the drugcyclophosphamide (Linhart et al., 1996; Mascher et al., 2001; Sanduja etal., 1989). Acrolein is also a product of endogenous lipid peroxidation (Kaye,1973; Linhart et al., 1996; Sanduja et al., 1989). Its half-life is approximately12 hours (Scherer, 2005).

Clinical Studies of Potential Reduced-Risk Tobacco Products 63
For internal use of Philip Morris personnel only.
III.4.8.1 3-Hydroxypropylmercapturic acid
3-Hydroxypropylmercapturic acid (3-HPMA) is a biomarker of exposure toacrolein in tobacco smoke. HPLC-tandem mass spectrometry as been usedto measure urine levels of 3-HPMA, as an indicator of acrolein. 3-HPMA isstable in urine at 37°C for 24 hours. This analytical method is said to be fast,sensitive, and specific (Mascher et al., 2001). Mascher and co-workers (2001)compared urinary 3-HPMA levels for 27 smokers (11 of whom smoked morethan 20 cigarettes per day) with levels for 41 nonsmokers. 3-HPMA excretionwas significantly higher for smokers (2809 ± 385 μg/24 hours) than fornonsmokers (812 ± 123 μg/24 hours). Other studies showed that smokingleads to elevated levels of 3-HPMA (Esterbauer et al., 1990; InternationalAgency for Research on Cancer, 1995).
Measurement of 3-HPMA is considered to be particularly useful for PRRTPstudies because of an ability to distinguish between smokers and nonsmokersand LSRO ranks 3-HPMA as a Category A biomarker.
III.4.9 Acrylonitrile Biomarkers
Acrylonitrile, a chemical used in manufacturing plastics, resins, fibers,and rubber, is a “possible human carcinogen” (Group 2B) (InternationalAgency for Research on Cancer, 1999). Levels in MS are 3–19 μg/cigarette(Smith et al., 2001). SS acrylonitrile levels are approximately 4-fold higherthan MS levels (World Health Organization, 1986).
III.4.9.1 N-(2-Cyanoethyl)valine-hemoglobin adducts
N-(2-Cyanoethyl)valine-Hb adducts, which are biomarkers of exposure toacrylonitrile, reflect gas phase exposure and persist for the lifetime of anerythrocyte (120 days) but are not specific for tobacco smoke exposure(Scherer, 2005). An analytical method used is GC-mass spectrometry, inelectron impact mode with a limit of detection of 4 pmol/g globin (Schettgenet al., 2002). LSRO ranks these adducts as Category A biomarkers.
Pérez et al. (1999) measured levels of N-(2-cyanoethyl)valine-Hb adductsin nonsmokers, ex-smokers, and current smokers. Mean ± SD adduct levels(pmol/g Hb) for nonsmokers who reported no exposure to ETS (n = 18)and nonsmokers who reported ETS exposure (n = 4) were 0.76 ± 0.36(range = 0.32–1.6) and 1.1 ± 0.6 (range = 0.6–1.7), respectively. Themean ± SD value (pmol/g Hb) for ex-smokers who had stopped smoking4 months before the study (n = 2) was 1.2 ± 0.5 (range = 0.7–1.7). Meanadduct levels for a 10–15 cigarettes/day smoker and for a 20 cigarettes/daysmoker before smoking cessation were 64 and 91 pmol/g Hb, respectively.

64 Exposure Assessment
For internal use of Philip Morris personnel only.
One smoker of 1 cigarette/day before smoking cessation had a value of 8.3pmol/g Hb (Bergmark, 1997).
Fennell et al. (2000) reported that consumption of 1 cigarette/day raised thelevel of these adducts by 9 pmol/g Hb. Means ± SD for adduct levels innonsmokers and active smokers of 1 pack of cigarettes/day were 4.9 ± 1.9pmol/g Hb and 252 ± 22 pmol/g Hb, respectively (p < 0.0001). The mean ± SDvalue for active smokers of 2 packs of cigarettes/day was 364 ± 34 pmol/g Hb,which was significantly higher than levels for smokers of 1 pack/day (p < 0.016)and nonsmokers (p < 0.0001).
Schettgen et al. (2002) reported the median value of N-(2-cyanoethyl)valine-Hb adducts for smokers (n = 38) as 131 pmol/g globin (range = 12–256, 95th
percentile = 14 pmol/g globin) while that for nonsmokers (n = 24) was lessthan 4 pmol/g globin (range = 4–71, 95th percentile = 24 pmol/g globin). Thecorrelation between daily cigarette consumption and adduct levels was 0.68.The authors estimated that smoking 1 cigarette/day raised the level of adductsby approximately 6.1 pmol/g Hb (Schettgen et al., 2002). Other studies alsodemonstrated elevated adduct values in smokers compared with nonsmokers(Bergmark, 1997; Calleman et al., 1994; Osterman-Golkar et al., 1994;Tavares et al., 1996).
III.4.10 Polycyclic Aromatic Hydrocarbon Biomarkers
Polycyclic aromatic hydrocarbons (PAHs) are considered to be likely humancarcinogens and are ubiquitous. Major sources are coal tar and coal tarproducts (Jongeneelen, 2001). Individuals who work in aluminum plants,iron and steel plants, plants that produce creosol, mechanic shops, andmeat-smoking facilities generally have higher exposures to PAHs than thegeneral population (Levin, 1995). Exposure can also result from consumptionof foods that are grilled, smoked, or stored in charred containers.
III.4.10.1 1-Hydroxypyrene
1-Hydroxypyrene (1-HOP) is the major urinary metabolite of pyrene (Harper,1957; Jacob et al., 1982). Pyrene is a non-carcinogenic component of allPAH mixtures (e.g., exhaust fuels) and often accounts for a large proportionof PAHs (Dor et al., 1999). MS and SS ranges of pyrene are 50–270 and390–1,010 ng/cigarette, respectively (Li et al., 2000). 1-HOP has been usedextensively as a measure of tobacco smoke exposure and in PRRTP studies.The elimination half-life of 1-HOP is approximately 20 hours (Dor et al.,1999). LSRO ranks 1-HOP as a Category A biomarker.

Clinical Studies of Potential Reduced-Risk Tobacco Products 65
For internal use of Philip Morris personnel only.
Smokers’ 1-HOP levels are typically 2- to 3-fold higher than nonsmokers’ levels,and most studies have reported significantly elevated levels of 1-HOP insmokers compared with nonsmokers (e.g., (Hecht, 2002; Merlo et al., 1998)).(See Table 1 in Hecht (2002) for a summary of 1-HOP levels in smokers andnonsmokers.)
HPLC with fluorescence detection has been used to quantify PAHs (Carmellaet al., 2004b; Li et al., 2000). Advantages of this assay include a low detectionlimit, sensitivity sufficient for small amounts of urine, rapid analysis of multiplesamples, and use of an internal standard, 1-hydroxybenz[a]anthracene(Carmella et al., 2004b). HPLC with immunoaffinity columns and synchronousfluorescence spectrometry has been used to analyze pyrene in urine (Westonet al., 1993).
Li and others (Li et al., 2000; Merlo et al., 1998) reported a significant positivedose-response relationship for the number of cigarettes smoked per dayand urinary 1-HOP levels (p = 0.001; coefficient of determination [r 2] = 0.93).In first-morning urine voids, Li et al. (2000) measured 1-HOP levels of0.04 ± 0.03 μmol/mol creatinine (nonsmokers), 0.20 ± 0.18 μmol/molcreatinine (light smokers, <20 cigarettes/day), 0.46 ± 0.36 μmol/mol creatinine(medium smokers, >20 to <40 cigarettes/day), and 1.16 ± 0.73 creatinineμmol/mol (heavy smokers, >40 cigarettes/day).
Dor et al. (1999) reported background levels of 1-HOP of 0.03–0.79 μmol/mol creatinine in a population without occupational exposure to 1-HOP.Increases in 1-HOP concentrations between the start and the end of theworkday for occupationally exposed individuals are typically between 1 and10 μmol/mol creatinine, but increases of up to 50 μmol/mol creatinine havebeen reported (Dor et al., 1999; Heikkila et al., 1995). Exposure to ETSdoes not significantly raise 1-HOP levels (Scherer et al., 1992; Van Rooij etal., 1994).
Hatsukami et al. (2004b) measured concentrations of 1-HOP in the urine of22 individuals who switched from their usual brand of conventional cigaretteto Omni® cigarettes for 4 weeks. According to the Omni® cigarette website[cited by Hatsukami et al. (2004b)], these cigarettes yielded 15–20% lesspyrene than a conventional cigarette when machine-smoked via the FTCmethod. Hatsukami et al. (2004b) reported 5% lower levels of 1-HOP levelsin urine of individuals who switched to using Omni® cigarettes comparedwith levels when they smoked their usual brand of cigarettes.

66 Exposure Assessment
For internal use of Philip Morris personnel only.
Feng et al. (2006) measured urinary 1-HOP levels for groups of smokerswho were either assigned to a no smoking group, or instructed to continuesmoking their own brand of conventional cigarette, to switch to smoking aconventional cigarette that delivered 3 mg tar/cigarette, or to change tosmoking one of two EHCSSs for 8 days. On day 8, the urinary 1-HOP valuefor subjects who smoked EHCSSs was significantly lower than that forsubjects who smoked conventional cigarettes (p < 0.0001) and was notsignificantly different from that for the no-smoking group (p > 0.05).
Hecht et al. (2004a) studied the effect of reduced daily cigarette consumptionon urinary 1-HOP levels. Smokers were asked to reduce their smoking by25% during weeks 0–2, by 50% during weeks 2–4, and by 75% duringweeks 4–6. They were asked to maintain reduced smoking through week26 of the study. Urinary 1-HOP values were measured at baseline and at 4,6, 8, 12, and 26 weeks after smoking reduction began. Reductions in 1-HOP levels ranged from 14% to 35% and were less than what might havebeen expected on the basis of the number of cigarettes smoked per day.
Murphy et al. (2004) measured 1-HOP in smoking subjects during 4 visits.Significant correlations were seen between visits (p < 0.0001 to p < 0.005).These authors estimated that 30–50% of pyrene derives from environmentalnon-tobacco sources. According to Van Rooij et al. (1994), food is the sourceof 53% of total PAHs for smokers and 99% of PAHs for nonsmokers withoutoccupational exposure to PAHs. 1-HOP levels may be influenced by geneticpolymorphisms of carcinogen-metabolizing enzymes (Alexandrie et al., 2000;Nan et al., 2001; Nerurkar et al., 2000; van Leeuwen et al., 2005). Dor et al.(1999) discovered a significant inter-individual variation in 1-HOP levels.However, levels were consistently elevated in smokers, and studies of PRRTPsdetected reduced levels. Smoking generally increases 1-HOP values only 2-to 3-fold, so measuring reduced levels can prove challenging (Hecht, 2002).Sampling methods and analysis conditions are standardized (Dor et al., 1999).
III.4.10.2 3-Hydroxybenzo[a]pyrene and 3-hydroxybenz[a]anthracene
3-Hydroxybenzo[a]pyrene and 3-hydroxybenz[a]anthracene are themajor metabolites of the PAHs B[a]P and benz[a]anthracene. The amountof B[a]P in cigarette smoke is approximately 9 ng/cigarette (Chepiga et al.,2000). 3-Hydroxybenzo[a]pyrene and 3-hydroxybenz[a]anthracene are notspecific markers of tobacco smoke exposure because of dietary,occupational, and other environmental exposures. The mean value ± SDof 3-hydroxybenz[a]anthracene in urine of 19 occupationally exposedindividuals was 376 ± 466 ng/g creatinine (range = 15–1,871).Corresponding values for the same individuals for 3-hydroxybenzo[a]pyrene

Clinical Studies of Potential Reduced-Risk Tobacco Products 67
For internal use of Philip Morris personnel only.
were 37 ± 56 ng/g creatinine (range = 3–198) (Gündel & Angerer, 2000).LSRO considers 1-HOP to be a better measure of PAH exposure thanthese biomarkers; however, given the ease of their measurement in urine,3-hydroxybenzo[a]pyrene and 3-hydroxybenz[a]anthracene are consideredto have utility as indicators of tobacco smoke exposure (Category Bbiomarkers).
3-Hydroxybenzo[a]pyrene is primarily excreted in feces and is not generallymeasurable in urine (Hecht, 2002). The excreted amount is lower than thatof other markers of PAH exposure, such as 1-HOP andhydroxyphenanthrenes. B[a]P is found at levels 2,500 times lower than thelevel of 1-HOP, the primary pyrene metabolite in mammals (Harper, 1957;Jacob et al., 1982). Few data are available on 3-hydroxybenzo[a]pyrene levelsin smokers (Hecht, 2002). However, Simon et al. (2000) reported ranges of0.1–0.8 ng/ml for smokers and ND–0.2 ng/ml for nonsmokers.
HPLC that utilizes an automated column-switching method has served foranalysis of 3-hydroxybenzo[a]pyrene in urine (Simon et al., 2000). Thecolumn-switching approach, described as easy, allows the hydrolyzed urinesample to be injected directly into the LC apparatus after a fast, on-linesample treatment process (Simon et al., 2000). Capillary GC-massspectrometry (Grimmer et al., 1997) has also been used to quantify asmany as 25 PAHs including benz[a]anthracene and B[a]P. HPLC with anenriching precolumn and fluorescence detection measures both3-hydroxybenzo[a]pyrene and 3-hydroxybenz[a]anthracene and isdescribed as being simple and sensitive (Gündel & Angerer, 2000).Limitations of this assay include the presence of co-eluting compoundsand resolution (Jacob & Seidel, 2002).
III.4.10.3 Benzo[a]pyrene-hemoglobin adducts
These adducts reflect exposure to B[a]P, a PAH occurring in the particulatephase of smoke. The ultimate carcinogen of B[a]P is B[a]P diol epoxide (BPDE).B[a]P adducts persist for the life of an erythrocyte (approximately 120 days).Seasonal variation in BPDE adduct levels was reported, with higher levels inthe winter than in the summer (Pastorelli et al., 1999). A number of groupshave used GC-mass spectrometry for analysis. (Day et al., 1991; Melikian etal., 1997; Pastorelli et al., 1996, 1998; Scherer et al., 2000).
Scherer et al. (2000) measured B[a]P-Hb adduct levels in smokers (n = 27)and nonsmokers (n = 69). Mean adduct levels for smokers and nonsmokerswere 105 and 68 pmol/g Hb, respectively. Smokers’ B[a]P-Hb levels wereapproximately double that of nonsmokers; however, the difference in adduct
68 Exposure Assessment
For internal use of Philip Morris personnel only.
levels between smokers and nonsmokers was not significant (p = 0.12), norwere urinary cotinine concentration and B[a]P-Hb adduct levels significantlycorrelated (p = 0.35, r = 0.19).
LSRO ranks B[a]P-Hb adducts as Category C biomarkers.
III.4.10.4 Benzo[a]pyrene-albumin adducts
The B[a]P-albumin adduct has a half-life of approximately 21 days. Scherer(2005) reported smokers’ levels of B[a]P-albumin adducts as approximately2-fold those of nonsmokers. Another study by Scherer et al. (2000) alsofound significantly higher levels of B[a]P-albumin adducts for smokers (mean± SE= 0.042 ± 0.011 fmol/mg albumin, range = ND–0.254; n = 27) than fornonsmokers (mean = 0.020 ± 0.005 fmol/mg albumin, range = ND–0.192;n = 42) (p < 0.05). B[a]P-albumin adduct values were significantly correlatedwith cotinine levels (p < 0.05, r = 0.44). Other groups reported higher levelsof B[a]P-albumin for smokers than for nonsmokers as well (Autrup et al.,1995; Crawford et al., 1994; Sherson et al., 1990; Tas et al., 1994).
Analytical methods include ELISA (Autrup et al., 1995; Crawford et al., 1994;Sherson et al., 1990), GC-mass spectrometry (Pastorelli et al., 1998; Schereret al., 2000), and HPLC with fluorescence detection. ELISA showed adductlevels several orders of magnitude higher than those reported for the other2 methods (Tas et al., 1994).
LSRO ranks these adducts as Category C biomarkers.
III.4.10.5 Naphthols
Naphthols are metabolites of naphthalene, a dicyclic aromatic hydrocarbonfound in mixtures of PAHs. Naphthalene levels range from 2 to 4 μg/cigarette(World Health Organization, 1986). The half-life of naphthols is approximately12 hours. These biomarkers are not specific to tobacco smoke; PAH exposurecan result from food, occupational sources, some medications, andenvironmental sources. Analytical methods for naphthols in urine includeHPLC (Kim et al., 1999), with a detection limit of 0.13 ng/ml, and GC-massspectrometry with a detection limit of 0.27 μg/L (Yang et al., 1999).
Smokers’ urine naphthol concentrations are typically higher than nonsmokers’naphthol concentrations (Hansen et al., 1994; Heikkila et al., 1995; Jansenet al., 1995; Kim et al., 1999; Nan et al., 2001; Yang et al., 1999). Nan et al.(2001) showed that 2-naphthol levels in 41 smokers’ urine samples were

Clinical Studies of Potential Reduced-Risk Tobacco Products 69
For internal use of Philip Morris personnel only.
approximately twice those of 87 nonsmokers (geometric mean5 = 3.94,geometric SD = 1.89 versus geometric mean = 1.55, geometric SD = 2.19).Yang et al. (1999) reported that levels of 1- and 2-naphthols in male Japanesesmokers in a population not believed to have significant occupationalexposure to PAHs were approximately 3- to 7-fold higher than those innonsmokers. Kim et al. (1999) reported that the mean urinary 2-naphthollevels for Korean shipyard workers who were smokers (7.03 ± 6.16 ng/ml)were significantly higher than levels for nonsmokers (2.49 ± 3.92 ng/ml).
Genetic polymorphisms of carcinogen-metabolizing enzymes such asCYP2E1 and GSTM1 can cause urinary 2-naphthol levels to vary. Urinelevels of 2-naphthol have better correlations with cotinine than do urine levelsof 1-naphthol (Yang et al., 1999) and thus may be preferred as a biomarkerof PAH exposure compared with levels of 1-naphthol (Kim et al., 1999).
LSRO does not recommend routine measurement of naphthols in PRRTPevaluations and ranks them as Category C biomarkers. LSRO considers1-HOP to be a better biomarker for PAH levels.
III.4.10.6 Hydroxyphenanthrenes and phenanthrene dihydrodiols
The 1-, 2-, 3-, 4-, and 9-hydroxyphenanthrenes are metabolites ofphenanthrene, a non-carcinogenic PAH (International Agency for Researchon Cancer, 1983; LaVoie & Rice, 1988). The range of phenanthrene yields inMS is approximately 85–620 ng/cigarette (World Health Organization, 1986).The half-life of phenanthrenes is approximately 13 hours (Scherer, 2005).
Phenanthrenes are not specific measures of tobacco smoke exposurebecause of environmental and dietary exposures to PAHs. Individuals whowork in coal and pitch tar production; aluminum plants; iron and steel plants;and industries producing creosote, rubber, mineral oil, soot, and carbon-black have an increased likelihood of PAH exposure (Jacob & Seidel, 2002).An argument against using phenanthrenes as biomarkers of exposure isthat they are not biologically active metabolites and will thus not reflectexposure to carcinogenic PAHs (Jacob & Seidel, 2002). Phenanthrenes havenot been studied extensively as measures of tobacco smoke exposure andLSRO does not recommend routine measurement of phenanthrenes inPRRTP evaluations (Category C biomarkers).
Individuals exposed to ETS do not have higher urine levels of phenanthrenesthan unexposed individuals (Hoepfner et al., 1987; Martin et al., 1989). Certain
5 The geometric mean is the product of the numbers in a set divided by the nth root of theproduct.

70 Exposure Assessment
For internal use of Philip Morris personnel only.
studies showed no significant differences in urine phenanthrene values forsmokers and nonsmokers (Carmella et al., 2004a; Jacob et al., 1999).However, Heudorf and Angerer (2001), using HPLC and fluorescencedetection, found significant differences between smokers and nonsmokers.
HPLC and fluorescence detection revealed a significant positive dose-response relationship between the number of cigarettes smoked per dayand 2-, 3-, and 4- hydroxyphenanthrenes, but not a relationship for1-hydroxyphenanthrene (Heudorf & Angerer, 2001). However, other analyticalmethods have not demonstrated such a dose-response relationship(Carmella et al., 2004a; Jacob et al., 1999). Analytical methods forphenanthrenes include HPLC (Gündel et al., 1996; Heudorf & Angerer, 2001;Hoepfner et al., 1987; Lintelmann et al., 1994; Mannschreck et al., 1996),GC (Grimmer et al., 1993; Hoepfner et al., 1987), GC-mass spectrometry(Gmeiner et al., 1998; Grimmer et al., 1997; Jacob et al., 1999; Serdar et al.,2003; Smith et al., 2002), and GC with positive ion chemical ionization(Carmella et al., 2004a). HPLC with fluorescence detection has been usedto analyze phenanthrenes in spot urine samples (Heudorf & Angerer, 2001);GC has been used for measurements of phenanthrenes in urine (Grimmeret al., 1993; Hoepfner et al., 1987).
III.4.10.7 Polycyclic aromatic hydrocarbon-DNA adducts
PAH-DNA adducts are biomarkers of exposure to PAHs found in theparticulate phase of cigarette smoke. After metabolic activation, PAHsproduce electrophilic species that bind covalently to DNA (Lodovici et al.,1998). The half-life of these adducts varies according to cell and kind oftissue, but these adducts are generally markers of long-term exposure(Scherer, 2005). LSRO does not recommend routine measurement of PAH-DNA adducts in PRRTP studies (Category C biomarkers).
PAH-DNA adduct levels in smokers are approximately twice as high as levelsin nonsmokers (Scherer, 2005). Mooney et al. (1995) measured PAH-DNAadducts in smokers of more than 20 cigarettes/day who were trying to quitsmoking. At 1 year after quitting, values of these adducts declined by 50%(Mooney et al., 1995).
B[a]P is activated by cytochrome P450 and epoxide hydrolase to formelectrophilic and free radical species, such as BPDE (Gelboin, 1980).Lodovici et al. (1998) measured mean levels of anti-BPDE-DNA adductsin autopsy samples from smokers, ex-smokers, and nonsmokers who hadlived in Italy. They reported mean levels of total BPDE-DNA adducts of4.46 ± 5.76 per 108 bases in smokers, 4.04 ± 2.37 per 108 bases in

Clinical Studies of Potential Reduced-Risk Tobacco Products 71
For internal use of Philip Morris personnel only.
ex-smokers, and 1.76 ± 1.69 per 108 bases in nonsmokers. Nonsmokers’levels were significantly lower than levels for both smokers and ex-smokers(p < 0.05).
Melikian et al. (1999) observed that BPDE-DNA adduct concentrations inepithelial cervical tissues of smokers were approximately twice those innonsmokers (mean ± SD = 3.5 ± 1.06 versus 1.8 ± 0.96 adducts/108
nucleotides, respectively; p = 0.02). Zenzes et al. (1999) reported that thatsmokers had significantly elevated mean levels of BPDE-DNA adducts insemen compared with nonsmokers.
Romano et al. (1999) used an immunohistochemical approach to evaluateB[a]P-DNA adducts in oral cells from 33 tobacco smokers and 64nonsmokers. The mean relative staining intensity ± SD was significantlygreater for smokers than for nonsmokers (smokers = 330 ± 98,nonsmokers = 286 ± 83; p = 0.013). Furthermore, as the number ofcigarettes smoked increased, the PAH-DNA adduct level increased.
Nia et al. (2000c) compared levels of PAH-DNA adducts in smokers andnonsmokers via an antibody that recognizes a BPDE that cross-reacts withstructurally similar PAH-diol epoxide adducts. PAH-DNA adduct levels(expressed in arbitrary units) in the mouth floor and buccal mucosa for26 smokers and 22 smokers were significantly higher than those fornonsmokers (0.045 ± 0.022 versus 0.022 ± 0.016; p = 0.0008). Buccalmucosa adduct concentrations for smokers were also significantly higherthan those for nonsmokers (0.058 ± 0.028 versus 0.028 ± 0.012; p = 0.001).
Godschalk et al. (2002) reported significantly higher mean ± SD levels ofbulky DNA adducts in 13 lung cancer patients who smoked (11.2 ± 7.8adducts/108 nucleotides, range = ND–25.9) compared with levels in 11 lungcancer patients who did not smoke (2.2 ± 2.2 adducts/108 nucleotides,range = ND–0.7, p = 0.001). Means ± SD (and ranges) of putative BPDE-DNA adduct levels for the same smokers and nonsmokers were 1.5 ± 1.0adducts/108 nucleotides (range = ND–3.6) and 0.2 ± 0.2 adducts/108
nucleotides (range = ND–0.7, p < 0.001), respectively.
Significant inter-individual variability of levels of DNA adducts is observed.One disadvantage of the anti-BPDE–DNA adducts antibody is the potentialfor cross-reaction with other PAH-DNA adducts. High variation in PAH-DNAadducts reflects differences in exposure, response, nutrition, and geneticfactors (Mooney et al., 1995). Furthermore, studies have not consistentlyshown that smokers’ levels of PAH-DNA adducts are higher than those ofnonsmokers (Kriek et al., 1998; Tang et al., 1995).

72 Exposure Assessment
For internal use of Philip Morris personnel only.
III.4.11 Acetonitrile Biomarkers
Acetonitrile is found in the gas phase of MS at levels of 44–140 μg/cigarette.Acetonitrile is an organic solvent that is used in laboratories and variousindustries (Michaelis et al., 1991); it is also thought to be producedendogenously (Jordan et al., 1995). LSRO considers measurement ofacetonitrile as useful for routine assessment of PRRTPs (Category Bbiomarker).
Acetonitrile has been measured in a number of biological matrices, includingblood (Houeto et al., 1997), exhaled breath (Jordan et al., 1995; Lindingeret al., 1998), and urine (McKee et al., 1962; Pinggera et al., 2005). Its half-life is approximately 32 hours in blood and approximately 24 hours in breath(Michaelis et al., 1991). For one smoker it took approximately 1 week forbreath acetonitrile levels to decline to those of nonsmokers (Jordan et al.,1995).
Houeto et al. (1997) measured blood acetonitrile levels in nonsmokers and insmokers whose daily cigarette consumptions were “minimal” (1–5 cigarettes/day), “low” (6–10 cigarettes/day), or “high” (>10 cigarettes/day). The mean± SD blood acetonitrile concentration for 18 men who smoked more than10 cigarettes/day (143 ± 18.0 μg/L) was significantly higher than that for the6 individuals who smoked 1–10 cigarettes/day (43.3 ± 6.0 μg/L, p = 0.03).
Jordan et al. (1995) measured the acetonitrile concentration in exhaled breathsamples of 75 smokers and 56 nonsmokers. The mean concentration fornonsmokers was less than 15 ppb (mean ± SD = 5.65 ± 1.90 ppb), and thatfor smokers ranged from 30 to 200 ppb (mean ± SD = 69.33 ± 33.34 ppb).
Acetonitrile levels were also measured in morning urine voids of 40 smokersof 0.25–2.5 packs of cigarettes/day and 20 nonsmokers (McKee et al., 1962).The lowest acetonitrile concentration measured for smokers of 3 or morecigarettes/day was 2.2 μg/100 ml urine, and the highest concentration foundfor smokers of less than 3 cigarettes/day was 0.74 μg/100 ml (McKee et al.,1962). Acetonitrile in urine appears to be stable.
Pinggera et al. (2005) measured urinary acetonitrile concentrations for 46nonsmokers who were not exposed to ETS at home or at work, 10 “lightsmokers” (≤10 cigarettes/day), 23 “moderate smokers” (10–20 cigarettes/day), 9 “heavy smokers” (≤30 cigarettes/day), and 13 “very heavy smokers”(>30 cigarettes/day). They found a significant, positive dose-responserelationship between number of cigarettes smoked per day and urineacetonitrile concentration (p = 0.001). They also reported that mean urinary

Clinical Studies of Potential Reduced-Risk Tobacco Products 73
For internal use of Philip Morris personnel only.
acetonitrile concentrations for “passive smokers” (i.e., nonsmokers) exposedto ETS (8.2 ppbv) were almost as high as those for moderate smokers (12.95ppbv) (Pinggera et al., 2005). Measurement at 4, 12, 24, and 36 hours afterinitial analysis showed no decline in acetonitrile levels.
Analytical methods for measuring acetonitrile include proton transfer reaction-mass spectrometry for urine samples (Jordan et al., 1995; Lirk et al., 2004;Pinggera et al., 2005), GC by the headspace technique (Houeto et al., 1997),and GC (Breland et al., 2003; McKee et al., 1962).
Analysis of breath acetonitrile concentration was described as a simple,non-invasive, cost-effective method for assessing cigarette smoking habits(Pinggera et al., 2005). Houeto (1997) described acetonitrile in blood as amoderately sensitive marker of cigarette smoking with a dose-effectrelationship.
III.4.12 Minor Tobacco Alkaloids (Anatabine and Anabasine)
Anatabine and anabasine are minor tobacco alkaloids found in MS. Alimitation of these substances as biomarkers of tobacco smoke exposure isthat they are present in tobacco at 0.2–1% of nicotine levels (3–15 μg/cigarette) (Hatsukami et al., 2003; Schmeltz & Hoffmann, 1977). Anatabineand anabasine account for 2–3% and 0.3%, respectively, of total tobaccoalkaloids, whereas nicotine accounts for 95% of this total (Saitoh et al., 1985).They are, however, specific markers of tobacco smoke exposure and appearto correlate well with nicotine intake measures (Benowitz & Jacob, III, 1984).The change in anatabine levels after tobacco exposure is greater than thechange in anabasine levels. Although these substances have a number ofdesirable characteristics, nicotine and its metabolites are better measuresof tobacco alkaloid exposure than are anatabine and anabasine.Quantification is easier because of their higher concentrations. LSROconsiders anatabine and anabasine to be Category B biomarkers, becausenicotine and its metabolites are better indicators of tobacco alkaloid exposurethan are anatabine and anabasine.
The elimination half-lives of anatabine and anabasine are 10 and 16 hours,respectively (Jacob, III et al., 1999). These alkaloids are detectable in urinefor 1–2 days after smoking cessation (Jacob, III, et al., 1999). Anatabineand anabasine are unlikely to be found in foods or other non-tobacco sourcesbut do occur in nicotine-containing medications (Jacob, III, et al., 2002).
Jacob, III, et al. (2002) reported that cigarette smokers’ mean urine levels ofanatabine were 22 ng/ml. They also measured the concentrations of

74 Exposure Assessment
For internal use of Philip Morris personnel only.
anatabine and anabasine in urine samples of 35 individuals who did not usetobacco products or medicines containing nicotine (Jacob, III, et al., 2002).Only one subject had a urinary anatabine concentration above the detectionlimit for the assay. Three subjects had anabasine levels above the detectionlimit of the assay (1.7, 2.42, and 3.4 ng/ml).
Murphy et al. (2004) analyzed urinary anatabine levels of 46 smokers of20–40 cigarettes/day who were asked to reduce their daily cigaretteconsumption by 75% during a 6-week period. The authors measured meanurinary anatabine levels for each subject in samples taken during weeks 1,2, 3, and 8 of the study, and the mean of means was calculated. Anatabinelevels were generally consistent over time and correlated significantly withfree and total cotinine levels (p < 0.001, r = 0.465, and p < 0.001, r = 0.514,respectively), as well as free and total nicotine (p < 0.0001, r = 0.753 and0.773, respectively). Murphy et al. (2004) could not analyze anabasine levelsin some samples because of interference of a co-eluting peak, but theyreported significant intra-individual correlation of anatabine samples across4 visits (p < 0.001 to p < 0.05).
GC-mass spectrometry has been used to quantify anatabine and anabasinein urine (Jacob, III, et al., 1993, 2002). Jacob, III, et al. (2002) reporteddeveloping a more sensitive LC-tandem mass spectrometry assay thatdetected levels of anatabine and anabasine at 0.2 ng/ml.
III.4.13 Cadmium
Cadmium is a heavy metal that is classified by IARC (1993) as a humancarcinogen (Group 1) and is found in tobacco and the particulate phase ofsmoke. Cadmium yield in MS ranges from 0 to 6.67 μg/cigarette (Smith etal., 1997). Cadmium is not a specific biomarker of tobacco product and smokeexposure; other sources of cadmium include polyvinyl chloride products andfood (Järup, 2003). The elimination half-life of cadmium has a fast component(75–128 days) and a slow component (7.4–16.0 years) (Järup et al., 1983).Urinary cadmium levels reflect long-term exposure (body burden); bloodlevels reflect more recent exposure (Satarug et al., 2004). A significant positivecorrelation exists between the number of cigarettes smoked per day andblood cadmium concentration (p < 0.01, r = 0.296) (Telisman et al., 1997).LSRO categorizes cadmium as a Category C biomarker.
Cadmium levels have been measured in urine by using inductively coupledplasma-mass spectrometry (Satarug et al., 2004). Simultaneousmeasurement of other metals such as lead is possible.

Clinical Studies of Potential Reduced-Risk Tobacco Products 75
For internal use of Philip Morris personnel only.
Individuals who are exposed to ETS have urine levels of cadmium that aretwice as high as levels for individuals without such exposure (Järup et al.,1998). Järup et al. (1998) reported that blood cadmium levels of smokerswere typically 4- to 5-fold higher than those of nonsmokers. Telisman et al.(1997) found that blood cadmium levels of 78 smokers were significantlyhigher than those of 42 nonsmokers (9 of whom were former smokers) whodid not have occupational exposure to cadmium. The median values andranges of blood cadmium values for smokers and nonsmokers were 4.33(0.49–13.33) and 0.46 (0.19–1.49) μg/L, respectively.
III.4.14 Acrylamide Biomarkers
III.4.14.1 N-Acetyl-S-(2-carbamoylethyl)-L-cysteine andN-(R,S)-Acetyl-S-(2-carbamoyl-2-hydroxyethyl)-L-cysteine
Acrylamide is a “probable human carcinogen” (Group 2A) (InternationalAgency for Research on Cancer, 1994) that is produced during heatingof foods that are high in starch (Tareke et al., 2000; 2002). Polymerproduction, cosmetics manufacturing, and textile production also generateacrylamide. MS yields of acrylamide range from 1.1 to 2.3 μg/cigarette(Smith et al., 2000c). Acrylamide is found in the vapor phase of smoke.N-Acetyl-S-(2-carbamoylethyl)-L-cysteine (AAMA) and its epoxide,N-(R,S)-Acetyl-S-(2-carbamoyl-2-hydroxyethyl)-L-cysteine (GAMA) aremercapturic acid metabolites of acrylamide. LSRO considers theseadducts to have limited utility for PRRTP assessment and ranks them asCategory C biomarkers.
Boettcher et al. (2005b) reported that levels of urinary AAMA weresignificantly higher (~4-fold) for 13 smokers as compared with levels for 16nonsmokers (median = 127 μg/L, range = 17–338, versus median = 29 μg/L,range = ND–83). Median urinary concentrations of GAMA for smokers andnonsmokers were 19 μg/L (range = <limit of detection–83) and 5 μg/L(range = <ND–14), respectively.
Hagmar et al. (2005) also determined acrylamide adduct values in smokersand nonsmokers. The median concentration of Hb adducts for smokers(n = 72) was 0.152 nmol/g globin (range = 0.03 0.43). The correspondingvalue for nonsmokers (n = 70) was 0.0030 nmol/g globin (range = 0.02 0.1).Adduct levels for nonsmokers who did not have occupational exposure toacrylamide were similar to values for nonsmokers in previous studies (0.031nmol/g globin) (Hagmar et al., 2005).
Boettcher & Angerer (2005) reported a high background level of AAMA andGAMA in German individuals who were not occupationally exposed to

76 Exposure Assessment
For internal use of Philip Morris personnel only.
acrylamide. The median value of AAMA in urine for 13 smokers was 127(range=17–338 range = ND–83 μg/L urine) and the median value fornonsmokers was 29 (range = ND–83 μg/L urine). The median value of GAMAin urine for 13 smokers was 19 (range=ND–45) and the median value fornonsmokers was 5 (range = ND–14 μg/L urine).
LC-electrospray ionization-tandem mass spectrometry has been used tomeasure AAMA and GAMA levels in urine (Boettcher et al., 2005a, 2005b).The detection limits for AAMA and GAMA were 1.5 μg/L urine, and the limitof quantitation for both analytes was approximately 5 μg/L. AAMA and GAMAcan be quantified simultaneously. Acrylamide adducts in blood have beendetected by using GC-tandem mass spectrometry in the negative ion/chemical ionization mode with single reaction monitoring (Hagmar et al.,2005).
III.4.14.2 N-(2-Carbamoylethyl)valine-hemoglobin adducts
N-(2-Carbamoylethyl)valine-Hb adducts are biomarkers of exposure toacrylamide. These adducts persist for the lifetime of an erythrocyte and reflectlong-term exposure (Scherer, 2005). An analytical method applied to measurelevels of this adduct is GC-tandem mass spectrometry in the negativeion/chemical ionization mode. LSRO ranks these biomarkers as Category Cbiomarkers.
Bergmark (1997) reported that mean levels of N-(2-carbamoylethyl) valine-Hb adducts in smokers and nonsmokers were 116 and 31 pmol/g globin,respectively. Laboratory personnel who worked with polyacrylamide gelshad mean adduct levels of 54 pmol/g globin. Schettgen et al. ( 2002) reportedmedian values of these adducts in 38 smokers as 89 pmol/g globin(range = 16–294) and in 24 nonsmokers as 22 pmol/g globin (range = <11–50).
Hagmar et al. (2005) also analyzed N-(2-carbamoylethyl)valine-Hb adductsin smokers and nonsmokers. The median value of these adducts for smokers(n = 72) was 152 pmol/g globin (range = 30–430). The corresponding valuefor nonsmokers (n = 70) was 31 pmol/g globin (range = 20–100). A 5-foldvariation in acrylamide levels was reported for nonsmokers and a 10-foldvariation was reported for smokers (Hagmar et al., 2005). Adduct levels fornonsmokers with no occupational exposure to acrylamide were similar tovalues for nonsmokers in previous studies (31 pmol/g globin) (Hagmar etal., 2005). Another study by Schettgen et al. (2003) reported backgroundadduct levels of 0.012–0.05 nmol/g Hb.

Clinical Studies of Potential Reduced-Risk Tobacco Products 77
For internal use of Philip Morris personnel only.
III.4.15 Hydrogen Cyanide Biomarker
HCN is present in tobacco at trace levels. It transfers into cigarette smoke(Vogt et al., 1977) and is converted to thiocyanate in a reaction catalyzedby rhodanese (Westley, 1973). Thiocyanate is measured in plasma, urine,sweat, and saliva (Prue et al., 1981). Saliva flow rate can influence salivalevels of thiocyanate, however. Sensitivity and specificity of detection areenhanced when plasma serves as the specimen compared with urine andsaliva (Bourdoux, 1995; Degiampietro et al., 1987). LSRO ranks thiocyanateas a Category C biomarker.
Thiocyanate is not a specific biomarker of cigarette smoke exposure becauseexposure can also come from foods containing thiocyanate such as cheeseand milk (Bliss & O’Connell, 1984); vegetables containing glucosinolates(Weuffen et al., 1984); and industrial sources such as gas manufacturingand electroplating (Bark & Higson, 1963). Exposure can also arise throughuse of diuretics (Stookey et al., 1987).
The half-life of thiocyanate is 6–14 days. Junge (1985) reported a half-life of6.4 (SD–0.9) days in 6 subjects who stopped smoking abruptly. In contrast,Pettigrew and Fell (1972) obtained a half-life of approximately 14 days for1 subject. A half-life of 1 day has also been reported (Bliss & O’Connell,1984). Thiocyanate levels in smokers and nonsmokers can overlap,particularly for light smokers (Vogt et al., 1977). Benowitz et al. (2002)recommended a cutoff level of 78–84 mmol/L for serum thiocyanate todistinguish between smokers and nonsmokers.
Hurt et al. (2000) studied blood thiocyanate levels for 23 heavy smokerswho reduced their smoking from more than 40 cigarettes/day. Smokingreduction was unexpectedly associated with increased plasma thiocyanatevalues at weeks 8 and 24. The authors proposed that dietary sources ofthiocyanate contributed to this finding.
Colorimetric analysis with ferric nitrate to produce red ferric thiocyanate hasbeen used to quantify thiocyanate in serum and urine (Butts et al., 1974;Muscat et al., 2005; Westley, 1987). However, ferric thiocyanate can undergophotocatalyzed fading, so samples must be kept away from sunlight. Samplesare stable for hours after color development. Complex biological samplesmay contain substances that interfere with the colored ferric complexes(Westley, 1987). Another technique, capillary zone electrophoresis (Glatz etal., 2001), has been used to measure thiocyanate in plasma, urine, andsaliva. This method was described as being simple, rapid, and effective.

78 Exposure Assessment
For internal use of Philip Morris personnel only.
Furthermore, it could be automated, and only a small amount of samplewas needed (Glatz et al., 2001).
Although multiple studies have utilized serum thiocyanate concentration toassess smoking status, control of dietary sources of exposure would beneeded.
III.4.16 Alkylation Biomarkers
III.4.16.1 3-Methyladenine
3-Methyladenine (3-Me-Ade) is a product of reactions between DNA andalkylating N-nitroso carcinogens (e.g., NDMA and NNK). The methylatedbase residue, 3-methyl-2′-deoxyguanosine, is released and excreted in urineas 3-Me-Ade. 3-Me-Ade reflects gas phase and particulate phase exposureand has a half-life of approximately 12 hours (Scherer, 2005). 3-Me-Adelevels in smokers’ urine are approximately 2-fold those in nonsmokers’ urine.LSRO does not recommend routine measurement of 3-Me-Ade in studies ofPRRTPs (Category C biomarker).
In people whose diets are not controlled, Prevost et al. (1990) considered3-Me-Ade to be of limited use as a measure of DNA methylation. 3-Me-Adehas not been used extensively as a biomarker of tobacco smoke exposure.One limitation of using 3-Me-Ade is high background levels. More than 90%of 3-Me-Ade is thought to come from dietary sources (Prevost et al., 1990).Feng et al. (2006) reported that 3-Me-Ade could distinguish between smokerswho did not smoke for 8 days and continuing smokers but could not distinguishbetween smokers of conventional cigarettes and smokers of two types ofEHCs.
III.4.16.2 3-Ethyladenine
3-Ethyladenine adducts in urine reflect exposure to ethylating substances insmoke. Their half-life is approximately 12 hours (Scherer, 2005). Diet haslittle influence on 3-ethyladenine levels, unlike its effect on 3-Me-Ade levels.Two studies demonstrated higher levels of 3-ethyladenine in urine of smokersthan in urine of nonsmokers (Kopplin et al., 1995; Prevost & Shuker, 1996).Smokers have approximately 5-fold the levels of 3-ethyladenine measuredin nonsmokers. An analytical method used for this substance is GC withnegative ion chemical ionization–tandem mass spectrometry (Carmella etal., 2002). LSRO does not have confidence in this biomarker as a measureof tobacco product or smoke exposure studies and ranks it as a Category Cbiomarker.

Clinical Studies of Potential Reduced-Risk Tobacco Products 79
For internal use of Philip Morris personnel only.
Feng et al. (2006) reported mixed results for studies investigating the abilityof 3-ethyladenine to differentiate between smokers who did not smoke for 8days and continuing smokers, and between smokers of conventionalcigarettes and smokers of two types of electrically heated cigarettes.
III.4.16.3 N-Ethylvaline-hemoglobin adducts
N-Ethylvaline-Hb adducts are reaction products of ethylating compounds incigarette smoke and Hb. Mean ± SD values for 39 smokers (3.76 ± 2.77pmol/g Hb) were significantly higher than those for 28 nonsmokers (2.50 ±1.65 pmol/g Hb; p = 0.023) (Carmella et al., 2002). Age and gender had noeffect on N-ethylvaline-Hb adduct levels. These adducts have been measuredvia HPLC and GC with negative ion chemical ionization-tandem massspectrometry (Carmella et al., 2002). LSRO ranks these adducts as CategoryC biomarkers.
III.4.16.4 N-(2-Hydroxyethyl)valine-hemoglobin adducts
N-(2-Hydroxyethyl)valine-Hb adducts reflect exposure to ethylene andethylene oxide in the gas phase of cigarette smoke. Ethylene oxide,categorized by IARC as a human carcinogen (Group 1), is a commonlyused gaseous sterilant and intermediate in chemical production (Bono et al.,1999). Non-tobacco smoke sources of ethylene oxide include ambient airand endogenous formation (Fennell et al., 2000). N-(2-Hydroxyethyl)valine-Hb adducts adducts have been analyzed via GC-mass spectrophotometrywith a detection limit of 9 pmol/g globin (Schettgen et al., 2002). Theseadducts are promising biomarkers of tobacco smoke exposure but LSROdoes not recommend routine measurement of them in PRRTP studies(Category C biomarkers).
N-(2-Hydroxyethyl)valine-Hb adducts persist for the life of the erythrocyte(120 days). Fennell et al. (2000) reported levels of N-(2-hydroxyethyl)valine-Hb adducts for smokers and nonsmokers of 242 and 13 pmol/g Hb,respectively. Bader et al. (1995) reported N-(2-hydroxyethyl)valine mean ± SDlevels of 46 ± 12 pmol/g globin (range = 19–64) for nonsmokers (n = 37) and171 ± 93 pmol/g globin (range = 31–327) for smokers (n = 32).
Schettgen et al. (2002) compared N-(2-hydroxyethyl)valine-Hb adduct levelsfor individuals working in a chemical plant that makes textile industrysurfactants. Median N-(2-hydroxyethyl)valine-Hb adduct levels fornonsmokers and smokers were 77 pmol/g globin (range = 16–2353, 95th
percentile = 988 pmol/g globin) and 175 pmol/g globin (range = 27–1653,95th percentile = 1328 pmol/g globin) respectively.

80 Exposure Assessment
For internal use of Philip Morris personnel only.
III.4.16.5 N-Methylvaline-hemoglobin adducts
N-Methylvaline-Hb adducts reflect exposure to NDMA, NNK, methyl halides,and other methylating substances in gas and particulate phases of tobaccosmoke. Another source is endogenous formation. N-Methylvaline-Hb adductspersist throughout the lifetime of the erythrocyte. LSRO ranks these adductsas Category C biomarkers.
Carmella et al. (2002) reported N-methylvaline-Hb adduct values in 29nonsmokers as 904 ± 149 pmol/g globin and in 45 active smokersas 997 ± 203 pmol/g Hb, p = 0.037 (two-sided test). Bader et al.(1995) reported a significant difference between mean ± SD backgroundlevels of N-methylvaline in 37 nonsmokers, 1175 ± 176 pmol/g globin(range = 722–1516), and those in 32 smokers, 1546 ± 432 pmol/g globin(range = 938–2702) (p < 0.001). They also reported small inter-individualdifferences in levels (approximately 15%) for nonsmokers (Carmella et al.,2002). Scherer (2005) reported that levels in smokers were approximately1.5 times greater than the levels in nonsmokers.
Endogenous levels of N-terminal N-ethylvaline were 250- to 350-fold lowerthan levels of N-terminal N-methylvaline (Carmella et al., 2002). Bader et al.(1995) reported that these adducts are not appropriate as a measure ofcigarette smoke exposure.
III.4.17 Thioether Biomarkers
Thioethers are biomarkers of exposure to electrophilic compounds in thegas and particulate phases of smoke. The half-life is approximately 12 hours(Scherer, 2005). They are not specific markers of tobacco smoke exposurebecause diet influences their concentrations. LSRO does not recommendthese biomarkers for routine measurement in PRRTP studies and ranksthem as Category C biomarkers.
Thioethers can be measured by using alkaline hydrolysis and assays withEllman’s reagent with modifications. Scherer et al. (1996) reported thatsmokers’ urine contained significantly elevated levels of thioethers comparedwith nonsmokers’ urine, with levels in smokers’ urine less than 50% higherthan levels in nonsmokers’ urine. A significant dose-response relationshipwas reported for the number of cigarettes smoked per day and urinarythioether excretion (van Doorn et al., 1979).
Feng et al. (2006) compared urinary thioethers excretion levels of 19 smokerswho smoked their own brand of cigarettes from before and after they had

Clinical Studies of Potential Reduced-Risk Tobacco Products 81
For internal use of Philip Morris personnel only.
switched to smoking a conventional cigarette for 8 days. No significant differencewas noted between levels before (mean ± SD = 157.0 ± 81.2 μmol/24hr urine)and after switching (mean ± SD =159.9 ± 75.9 μmol/24hr urine) for 19 smokers.The authors reported that this assay was not adequately sensitive.
Exposure to artificially high levels of ETS led to increased thioether excretion(Scherer et al., 1990). However, in a later study, Scherer et al. (1996) foundno significant difference between urine levels of thioethers for nonsmokerswho were exposed to more realistic levels of ETS and those who were notexposed to ETS. Dietary sources of sulfur give rise to inter-individual variationin thioether levels, and minimization of consumption of grilled, fried, toasted,and roasted foods by study participants decreased dietary contribution ofthioethers (Scherer et al., 1996).
III.4.18 Other Biomarkers
III.4.18.1 7-Methylguanine-DNA adducts
7-Methylguanine-DNA adducts are products of DNA methylation bysubstances in the body, air, and both phases of tobacco smoke. The half-lifeof these adducts is approximately 60 hours (Scherer, 2005). Adduct levelsin DNA for smokers and nonsmokers vary widely. Food contains precursorsand factors that modify in vivo nitrosation (Bartsch & Montesano, 1984).These adducts can be detected by means of the 32P-postlabeling assay.LSRO does not recommend these adducts for routine measurement inPRRTP evaluations (Category C biomarkers).
Smokers’ 7-methylguanine DNA adduct levels are approximately5-fold higher than nonsmokers’ levels. Mustonen and Hemminki (1992)measured 7-methylguanine values in total leukocyte, granulocyte, andlymphocyte DNA of 10 smokers and 10 nonsmokers and found significantdifferences between total lymphocyte and leukocyte values and betweengranulocyte and lymphocyte values. Lymphocytes have half-lives for up toyears and granulocytes have half-lives up to days (Mustonen & Hemminki,1992).
In another study, Mustonen et al. (1993) measured 7-methylguanine adductsin bronchial specimens and peripheral blood lymphocytes of cancer patientswho had undergone pulmonary surgery. Mean bronchial adduct levels weresignificantly elevated (p < 0.01) for smokers (17.3 adducts/107 nucleotides;n = 11) compared with nonsmokers (4.7 adducts/107 nucleotides; n = 6).Mean 7-methylguanine adduct levels in lymphocyte DNA for smokers andnonsmokers (n = 3) were of borderline significance (p = 0.055).

82 Exposure Assessment
For internal use of Philip Morris personnel only.
III.4.18.2 8-Hydroxy-2′′′′′-deoxyguanosine
8-Hydroxy-2′-deoxyguanosine (8-OHdG) is produced by reactive oxygenspecies, which are compounds with partially reduced oxygen that are highlyreactive with biological molecules (Nia et al., 2001). Diet, antioxidant levels,physical activity, and exposure to motor vehicle exhaust affect 8-OHdG levels(Daube et al., 1997). The preferred analytical methods to analyze 8-OHdGare HPLC and GC-mass spectrometry (Pilger & Rüdiger, 2006). Smokersand individuals with chronic hepatitis have elevated 8-OHdG concentrations.LSRO ranks 8-OHdG as a Category C biomarker.
Oral cells from 38 healthy smokers contained significantly higher (p < 0.01)levels of 8-OHdG (mean ± SD relative absorbance = 111 ± 55) than cells from71 healthy nonsmokers (mean ± SD relative absorbance = 78 ± 48) (Romanoet al., 1999). Nia et al. (2001) observed no significant difference betweenurinary excretion of 8-OHdG for 21 smokers (mean ± SE = 197 ± 31 ng/BMI,range = 78–449) and 24 nonsmokers (mean ± SE = 240 ± 33 ng/BMI,range = 60–472). Nia et al. (2001) also reported reduced levels of 8-OHdGin smokers’ lymphocytes compared with nonsmokers’ lymphocytes, whichwas reported in a previous study (Zwingmann et al., 1999), and anothergroup reported similar findings (van Zeeland et al., 1999). In contrast, otherinvestigators measured leukocyte and lymphocyte levels of 8-OHdG butshowed higher levels for smokers than for nonsmokers (Asami et al., 1996,1997). Another study did not find a significant difference in lymphocyte 8-OHdG levels for smokers and nonsmokers (Loft et al., 1992).
Feng et al. (2006) reported an apparent lack of association between 8-OHdGlevels and smoking in a study that evaluated levels in smokers of two typesof conventional cigarettes, and smokers who abstained from smoking for 8days.
III.4.18.3 2,5-Dimethylfuran
The volatile organic compound, 2,5-dimethylfuran, is found in smoke at anapproximate concentration of 58 μg/cigarette (Baggett et al. 1974). Othersources are coffee (Wang et al., 1983) and occupational exposure ton-hexanes and its metabolites (Perbellini et al., 1981). 2,5-Dimethylfurancan be measured in breath (Gordon, 1990), blood, urine, and alveolar air(Ashley et al., 1996; Perbellini et al., 2003). Analysis of volatile organiccompounds in breath holds promise, in particular of 2,5-dimethylfuran, butat this time LSRO does not recommend routine measurement of thisbiomarker in PRRTP evaluations (Category C biomarker).

Clinical Studies of Potential Reduced-Risk Tobacco Products 83
For internal use of Philip Morris personnel only.
Analytical methods include GC-mass spectrometry (Perbellini et al., 2002,2003), which has a sensitivity of 1 ng/L in alveolar air and 5 ng/L in bloodand urine (Perbellini et al., 2003). Blood 2,5-dimethylfuran concentrationscan be measured along with those of other volatile organic compounds,which makes additional analytical procedures unnecessary (Ashley et al.,1996). Gordon (1990) found 2,5-dimethylfuran in the breath of 92% ofcigarette smokers and blood of 96% of cigarette smokers but not innonsmokers. In a later study, Gordon et al. (2002) used a real-time breathmeasurement approach to obtain levels of 2,5-dimethylfuran and volatileorganic compounds as indicators of active and passive smoking. Theyreported 2,5-dimethylfuran mean ± SD values of 27.1 ± 18.1 μg/m3 innonsmokers’ breath (n = 4) and 340 ± 71 μg/m3 in smokers’ breath (n = 5).
Mean 2,5-dimethylfuran blood levels were significantly higher for 15 smokers(100.2 ng/L; SD = 103.4) than for 46 nonsmokers 5.7 ng/L; SD = 7.7). Themean 2,5-dimethylfuran alveolar air levels for smokers was 3.6 ng/L(SD = 3.3) and that for nonsmokers was 0.6 ng/L (SD = 0.3) (Perbellini et al.,2003).
III.4.18.4 5-Hydroxymethyluracil
5-Hydroxymethyluracil, a product of uracil oxidation, is excreted in urine.Pourcelot et al. (1999) reported no significant difference between5-hydroxymethyluracil urine levels for smokers and nonsmokers. No dose-response relationship between 5-hydroxymethyluracil levels and the numberof cigarettes smoked was found (Collier & Pritsos, 2003). Therefore,5-hydroxymethyluracil better reflects DNA damage by oxygen free radicalsthan it reflects cigarette smoke exposure (Bianchini et al., 1998). LSRO ranksthis substance as a Category C biomarker.
III.4.18.5 F2-isoprostanes
Oxidation of biomolecules is thought to be a component of the pathologicalprocesses of atherosclerosis and other diseases. F2-isoprostanes (F2-IsoPs)are prostaglandin-like substances produced by peroxidation of arachidonicacid. F2-IsoPs have been described as the best-characterized biomarkersof oxidative stress. LSRO ranks F2-IsoPs as a Category C biomarker.
F2-IsoP levels are elevated in cigarette smokers (Chehne et al., 2002; Pilzet al., 2000; Reilly et al., 1996), as well as in individuals with diabetes, chronicobstructive pulmonary disease, hypocholesterolemia, and scleroderma(Ridker et al., 2004).
84 Exposure Assessment
For internal use of Philip Morris personnel only.
Smoking cessation results in a rapid decline in F2-IsoP levels. Within 2 weeksof quitting, levels are close to those measured in healthy nonsmokers withoutthe above-mentioned risk factors (Pilz et al., 2000). Levels increase onresumption of smoking (Chehne et al., 2002).
F2-IsoPs are measured in plasma and urine by methods such as GC-massspectrometry and ELISA (Ridker et al., 2004). Although highly specific andsensitive, certain analytical methods are labor-intensive, and theinstrumentation is expensive (Morrow, 2005). ELISA methods have beendescribed as having promise but have not been validated. Furthermore, thevalue of plasma measurements of F2-IsoP is still in question (Ridker et al.,2004).
III.4.18.6 Etheno-DNA adducts
Vinyl chloride is classified by the US Environmental Protection Agency as aknown human carcinogen and by IARC as a Group 1 human carcinogen(Albertini et al., 2003). Chloroethylene is the reactive metabolite of vinylchloride that forms etheno adducts with DNA. Information about adductformation and DNA repair after vinyl chloride exposure is lacking. Godschalket al. (2002) reported no significant difference in pulmonary etheno-DNA(ε-DNA) adduct levels between smokers and nonsmokers. They observedconsiderable inter-individual variations in levels of εdA and εdC adducts(80- and 250-fold differences, respectively). LSRO ranks these adducts asCategory C biomarkers.
III.4.18.7 Bulky DNA adducts
Bulky DNA adducts are likely to be biomarkers of exposure to large, primarilyapolar compounds such as PAHs and aromatic amines (Phillips, 2002). Theyreflect particulate phase smoke constituent exposure. Bulky DNA adductshave been measured in a wide range of tissues (e.g., lung and bronchus,larynx, sputum, oral and nasal cavities, bladder, cervix, breast, pancreas,colon, stomach, placental and fetal tissue, sperm, cardiovascular tissue,blood cells, and anal tissue) (World Health Organization, 2004). LSRO doesnot recommend routine measurement of these adducts as indicators oftobacco smoke exposure (Category C biomarker).
Bulky adducts indicate exposure for more than 1 month, but the half-lifevaries for different cell and tissue types (Scherer, 2005). They can also arisefrom dietary, ambient air, workplace, and possibly endogenous sources(Scherer, 2005). Most studies reported significantly higher values of theseadducts in smokers than in nonsmokers, with smokers’ levels approximatelydouble those of nonsmokers (Scherer, 2005).

Clinical Studies of Potential Reduced-Risk Tobacco Products 85
For internal use of Philip Morris personnel only.
Degawa et al. (1994) reported that hydrophobic adducts in the larynx (whichthe authors considered likely to be PAH adducts) were found in smokers butnot in nonsmokers. Szyfter et al. (1996) showed that smokers of more than40 cigarettes/day had levels of adduct 2.5-fold higher than those of smokersof approximately 20 cigarettes/day and 6-fold higher than levels ofnonsmokers and ex-smokers.
Nia et al. (2000b) analyzed DNA in induced sputum from 20 smokers and 24nonsmokers by using the 32P-postlabeling method with nuclease P1 digestionor with butanol enrichment. For the nuclease P1 digestion method, DNA ofall smokers and one nonsmoker showed a diagonal radioactive zone, andthe number of adducts in smokers’ DNA was significantly higher (3.1 ± 1.4/108 nucleotides) than that in nonsmokers’ DNA (0.6 ± 0.8/108 nucleotides,p = 0.0007). The butanol enrichment method also showed a significantdifference between smokers and nonsmokers. However, the authorsconsidered the nuclease P1 digestion approach to be preferred because itdemonstrated larger differences between smokers and nonsmokers (Nia etal., 2000b). The butanol extraction method is thought to enrich variousadducts, including some that are not specific for tobacco smoke (Gallagheret al., 1989).
In another study, Nia et al. (2000a) measured lipophilic DNA adducts ininduced sputum and peripheral blood lymphocytes from 9 smokers and 9nonsmokers. They reported the presence of diagonal radioactive zones inadduct maps of induced sputum of all smokers but no nonsmokers. Adductmaps of peripheral blood lymphocytes of 5 smokers contained this zone,but no such zones were observed for nonsmokers. Adduct levels in inducedsputum from smokers were significantly higher (p = 0.0005) than those fornonsmokers (3.7 ± 0.9 versus 0.7 ± 0.2/108 nucleotides, respectively). Adductvalues for peripheral blood lymphocytes for smokers were also significantlyhigher (p = 0.0001) than those for nonsmokers (2.1 ± 0.3 versus 0.6 ± 0.1/108 nucleotides, respectively). These authors believed induced sputum tobe a better biological matrix for analysis than peripheral blood lymphocytes(Nia et al., 2000a).
Vineis et al. (1996), by means of the 32P-postlabeling assay, measured 2 ofthese DNA adducts in exfoliated bladder cells from 21 nonsmokers, 11 smokersof flue-cured tobacco, and 7 smokers of air-cured tobacco. Mean ± SE valuesof numbers of DNA adduct 2 were 1.4 ± 0.7, Relative Adduct Labeling (RAL)6
for nonsmokers, 1.9 ± 1.1 RAL for flue-cured tobacco smokers, and
6 RAL = (cpm adducts) x (cpm non-adducted nucleotides)-1 x 10⁹

86 Exposure Assessment
For internal use of Philip Morris personnel only.
22.5 ± 12.3 RAL for air-cured tobacco smokers. Corresponding values forDNA adduct 4 were 4.8 ± 1.6 RAL, 7.7 ± 4.0 RAL, and 8.8 ± 5.0, RAL,respectively.
Methods used to quantify these adducts include the 32P-postlabeling assay(Culp et al., 1997; Vineis et al., 1996) and immunoassays (Culp et al., 1997).Exposure to substances that give rise to bulky DNA adducts can derivefrom environmental, dietary, occupational, and endogenous sources. Certainstudies indicated either an effect of gender on DNA adduct levels (Mollerupet al., 1999; Ryberg et al., 1994) or no gender effect (Schoket et al., 1998).The 32P-postlabeling assay does not identify specific adducts.
III.4.19 Analysis of Exhaled Breath Condensate as a Measureof Tobacco Smoke Exposure
EBC analysis is described as a simple, non-invasive method of samplingthe lining of the lower respiratory tract (Mutlu et al., 2001) and of monitoringinflammation. Exhaled breath comprises a gaseous phase that containsvolatile compounds and a water vapor-saturated phase that contains aerosolparticles. Cooling of exhaled breath results in precipitation of the aerosolparticles, which contain non-volatile substances such as proteins, lipids,oxidants, and nucleotides (Mutlu et al., 2001; Scheideler et al., 1993).
EBC contains several markers of oxidative stress including leukotrienes,prostaglandins, hydrogen peroxide, and nitric oxide-derived products suchas S-nitrosothiols, nitrate, nitrite, and 3-nitrotyrosine (Montuschi & Barnes,2002). Although EBC analysis holds promise, significant methodologicalissues related to this technique remain to be resolved. One challenge is thepresence of biomarkers at very low concentrations, so highly sensitive assaysare needed. Also, substances measured tend to be markers of biologicaleffect, not of exposure per se. A recent report by the American ThoracicSociety/European Respiratory Task Force on EBC analysis proposedguidelines for sample collection and biomarker analysis (Horvath et al., 2005).This approach is not currently recommended for routine use in PRRTPstudies.

Clinical Studies of Potential Reduced-Risk Tobacco Products 87
For internal use of Philip Morris personnel only.
III.4.20 LSRO Recommendations for Biomarkers
III.4.20.1 Biomarkers recommended for inclusion in assessment ofall PRRTPs
On the basis of the review of tobacco product and smoke exposurebiomarkers reported in the literature, the sum of nicotine and at least five ofits major metabolites, including cotinine, is considered to be the most reliablemarker of exposure to tobacco products and tobacco smoke and should beincluded in evaluation of all PRRTPs. Measurement of additional metabolites(e.g., nicotine-N′-oxide, cotinine-N-oxide, and demethylcotinine (norcotinine)can improve estimates of nicotine exposure (Benowitz & Jacob, III, 1994;Byrd et al., 1992).
III.4.20.2 Additional biomarkers
Various PRRTPs exist, including products made from tobacco containingreduced nicotine or TSNA levels and PRRTPs that heat but do not burntobacco (Institute of Medicine, 2001). Because of the array of possibilitiesfor modification of manufacturing conditions, product design, andcomposition and the potential for effects on internal exposure to tobaccoproduct- and smoke-related substances, measuring additional biomarkersto assess exposure to other substances of biological concern related toPRRTP use has value. LSRO recommends flexibility in selection of additionalbiomarkers to assess exposure because various PRRTPs are likely to havedifferent product characteristics, which would signal a need for evaluationof different biomarkers. Therefore, other than nicotine and at least five of itsmajor metabolites, including cotinine, LSRO does not recommend a definedset of biomarkers for assessment of every PRRTP. LSRO advises use of abattery of biomarkers that reflect exposure to both particulate and vaporphases of smoke.
Data from smoke chemistry analyses can provide an additional rationale forbiomarker selection. Machine smoking of the PRRTP and control cigarettesusing at least two protocols can reveal whether yields of particular smokeconstituents differ between PRRTPs and control cigarettes, and biomarkerscan be used to evaluate internal exposure to smoke constituents of interest.For example, if an increase in yields of acrolein in smoke from the PRRTPcompared with control cigarettes is observed, analysis of the acroleinbiomarker 3-HPMA could indicate whether a smoker’s internal exposure toacrolein also increased after PRRTP use. A specific list of biomarkers tomeasure for all PRRTPs is less important than the criteria used to selectbiomarkers and the determination that smoke chemistry results are consistentwith biomarkers of exposure.

88 Exposure Assessment
For internal use of Philip Morris personnel only.
Other factors likely to influence the selection of biomarkers include a targetedinterest in assessing exposure to specific smoke constituents that are believedto be of biological concern. However, analytical methods for all biomarkersfor all substances of biological concern are not currently available, and allmethods for quantifying biomarkers have not been validated. Regulatoryauthorities also influence the biomarkers measured. The MassachusettsDepartment of Public Health requires that urine samples of 30 female smokersand 30 male smokers be tested, using federal regulatory methods, for twometabolites of NNK and for NNAL and its glucuronide. Measurement of thebenzene metabolite t,t-MA according to federal regulatory methods is alsorequired (45CFR46, 2001; Massachusetts Department of Public Health, 2001).
Confidence in exposure reduction can increase when smoke chemistrystudies show lower yields of smoke constituents from PRRTPs comparedwith control cigarettes and when biomarkers that measure exposure tothose smoke constituents are lower after PRRTP use compared with levelsafter cigarette use. It is important to address any inconsistencies betweenchanges in smoke chemistry and biomarker levels. PRRTP evaluation isan iterative process, so a battery of tests including other kinds of systems(e.g., biological effect studies) should be utilized to answer questions aboutreduced risk. Unlike consistent results across test systems, inconsistenciesin test results that cannot be resolved reduce confidence that risk is likelyto decrease.
III.4.20.3 Relative contribution of biomarkers of exposure toassess PRRTPs
Many factors should determine selection of biomarkers to quantify tobacco-product-related exposure. Information from product characteristics andtobacco product and smoke chemistry data, as well as a targeted interest inspecific substances and regulatory requirements, can influence the choiceof biomarkers. Biomarker characteristics are an important consideration,and analytical methods should be sufficiently accurate, sensitive, andselective (American Conference of Governmental Industrial Hygienists,2005). Study design and study participant selection methods should receivecareful consideration. Confidence in data from biomarker studies is enhancedby a quality assurance program. Given the possible variations in productcharacteristics, some PRRTPs, compared with conventional cigarettes, mayreduce levels of some compounds but elevate others (Hatsukami et al.,2004a). Such a possibility should be weighed as a component of a riskassessment process.

Clinical Studies of Potential Reduced-Risk Tobacco Products 89
For internal use of Philip Morris personnel only.
Exposure to ETS is influenced by the number of smokers, volume of thespace in which smoking is occurring, room ventilation, and many other factors.The types of evaluations to be performed might include chamber studies,clinical studies, and studies in natural settings. Many studies have utilizedbiomarkers to assess exposure to ETS (Benowitz, 1999; Bianchini et al.,1998; Coultas et al., 1987; Cummings et al., 1990; Hecht, 2004; Jarvis et al.,1984; Scherer et al., 1996; Smith et al., 2000a; Tsai et al., 2003). LSROconsiders nicotine and at least five its major metabolites, including cotinine,to be the most reliable biomarkers of ETS exposure.
Although LSRO has confidence in analysis of smoke constituents as ameasure of ETS exposure, LSRO has less confidence in other methods.LSRO therefore recommends that smoke chemistry studies of ETS beconducted as a routine screen for modified products. If a claim concerningETS exposure is planned, sufficient studies are required to support the claim,including human exposure and other studies.
III.5 BEHAVIOR RELATED TO TOBACCO PRODUCT USE
III.5.1 Smoking Topography
Smoking topography is described as a method for external exposureassessment (Institute of Medicine, 2001). Assessment parameters includepuff volume, puff duration, inter-puff interval, maximum puff velocity, numberof puffs per cigarette, inhalation depth, inhalation volume, time to smoke acigarette, and total inhalation time (Lee et al., 2003). A US Department ofHealth and Human Services report indicated wide variability in cigarettepuffing behavior for conventional cigarettes (U.S. Department of Health andHuman Services, 1988). A number of studies have used smoking topographyto determine external exposure to smoke for PRRTP users (Buchhalter etal., 2001; Lee et al., 2003, 2004).
A concern associated with using smoking topography for this purpose iswhether the smoking topography apparatus alters normal smoking behavior(Watson et al., 2004). Lee et al. (2003) determined that cigarette-smokingbehavior does not change when CreSS Plowshare smoking topographyequipment was used on a single occasion or repeatedly. A disadvantage ofthe apparatus is that it blocks filter ventilation holes during smoking (Watsonet al., 2004).
LSRO considered the value of using smoking topography studies to measuresmoke exposure but was concerned about the value and reliability of these

90 Exposure Assessment
For internal use of Philip Morris personnel only.
data compared with measurement of validated, reliable biomarkers ofexposure. However, smoking topography can provide insight into themechanism by which exposure to smoke constituents is altered. One potentialapplication of these studies is to assess the way in which the PRRTP issmoked and use this information to set cigarette smoking machineparameters (Djordjevic et al., 2000). Smoking topography that imitates thehuman cigarette smoking profile is a method of evaluating human smokeryield (Baker et al., 2004a).
III.5.2 Measures of Cigarette Consumption
These measures include the number of cigarettes smoked per day, pack-years, and dose-years, evaluated by means of questionnaires and interviews.
Epidemiological studies showed a dose-response relationship between dailycigarette consumption and duration of cigarette consumption and diseasesassociated with cigarette smoking (U.S. Department of Health and HumanServices, 2004). Joseph et al. (2005) examined the relationship betweenthe number of cigarettes smoked per day and CO, NNK metabolites, 1-HOP,and total cotinine (cotinine plus its N-glucuronide) for 400 smokers of 1–100cigarettes/day. Twelve subjects smoked more than 45 cigarettes/day. Theauthors reported that daily cigarette consumption is “not necessarily a reliablemeasure of toxin exposure” because it potentially underestimates exposurefor individuals who smoke few cigarettes per day and overestimates exposurefor individuals who smoke more cigarettes per day (Joseph et al., 2005). Asmentioned previously, exposure to tobacco smoke is influenced by cigarettepuffing and smoke inhalation behaviors as well as subjective andphysiological factors, which are not evaluated via the number of cigarettessmoked per day parameter.
III.6 FILTER ANALYSIS
Filter analysis is used to evaluate smoker yield (Baker et al., 2004a). Thismethod involves analysis of part of the filter tip from a smoked cigarette andprovides information about possible maximum tar and nicotine exposures ofthe cigarette smoker. Watson et al. (2004) described a method for estimatingnicotine and tar intake by analyzing deposition of solanesol, a high-molecular-weight, nonvolatile alcohol in tobacco leaves and tobacco products, in smokedcigarette filters. Disadvantages of this method include its being tested onlywith cellulose acetate filters, that underestimating solanesol deposition ispossible because a filter may become saturated if a cigarette is smokedvery intensely, and that it would be necessary to calibrate each type of

Clinical Studies of Potential Reduced-Risk Tobacco Products 91
For internal use of Philip Morris personnel only.
cigarette because variations in product characteristics (such as tobacco orfiller blend) can lead to different relationships between solanesol contentand nicotine and tar delivery (Watson et al., 2004). Filter analysis does notprovide information about exposure to vapor phase components of tobaccosmoke, which pass through the filter, or about depth and duration of inhalationand internal exposure to smoke constituents. However, filter analysis cansupply useful ancillary information, especially for PRRTPs in which a filter isdesigned to retain specific toxicants or classes of toxicants.
III.7 DEPOSITION AND RETENTION OF TOBACCOSMOKE PARTICLES
Cigarette smoking is typically a 2-step process (Bernstein, 2004; Dixon &Baker, 2003). First, a smoker puffs on the cigarette and draws smoke into themouth as the soft palate closes. Within 1 second of completing the puff, thesmoker relaxes the soft palate. Second, the smoker inhales, taking in smokeand air that has not escaped from the mouth, holds the mixture of smoke inthe lung for 1–2 seconds, and then exhales (Baker & Dixon, 2006).
After a smoker exhales, lungs retain some smoke constituents. Smokingbehavior characteristics such as depth of inhalation, time for which smokeis held in lungs, and exhalation volume contribute to the extent to whichparticles are retained. Coughing, mucociliary transport, endocytosis, andother mechanisms clear some of these aerosol particles from the respiratorytract. Particles that remain can have toxic effects, which are a function of theamount and deposition pattern of the aerosol particles (Schleshinger, 1995).Smoke particle characteristics (such as particle size, shape, density,hygroscopicity, and electrical charge), respiratory tract geometry, ventilationcharacteristics, respiratory tract disease, and other factors affect deposition(Schleshinger, 1995). The aerodynamic diameter of the particle influencesrespirability and lung deposition.
In a recent review of respiratory tract retention of cigarette smoke aerosolconstituents, Baker and Dixon (2006) reported that between 60% and 80%of particulate matter in MS is retained by lungs after inhalation. Lungs alsoretain 90–100% of nicotine, 55–65% of CO, and 100% of nitric oxide.Individuals who are exposed to ETS retain approximately 71–91% of nicotineand 11–59% of particulate matter (Baker & Dixon, 2006). Differences betweenMS and ETS retention in the respiratory tract result from the kind of tobaccoin the product, filter ventilation, and some added ingredients that affect growthof the smoke aerosol particles in the respiratory tract and retention ofparticulate matter (Baker & Dixon, 2006).

92 Exposure Assessment
For internal use of Philip Morris personnel only.
Feng et al. (2007) reported a newer method of estimating lung retention ofparticulate and vapor smoke constituents by estimating the differencebetween delivery of smoke constituents to the respiratory tract and exhalationof the constituents. An advantage of this method is that it monitors respiratorypatterns while the subject smokes. Estimates of delivered smoke constituentswere obtained by analyzing the linear relationship between solanesol levelsin a cigarette filter and cigarette smoking machine-generated yields of theselected constituents. The amount of exhaled constituent was determinedby passing exhaled breath through a Cambridge filter pad and then measuringparticulate phase components on the pad. Smoke vapor phase constituentswere measured by using an infrared spectrophotometer that was attachedto the Cambridge filter pad via stainless steel tubing (Feng et al., 2007).With this method, Feng et al. (2007) determined levels of nicotine, NNK,NNN, CO, isoprene, acetaldehyde, and ethylene.
LSRO recommends considering particle deposition and retention inevaluation of PRRTPs.
IIII.8 “OMICS”
DNA microarrays have allowed profiles of differential gene expression afterexposure to cigarette smoke to be obtained (Shah et al., 2005; Spira et al.,2004a, 2004b; Yoneda et al., 2001). Jorgensen et al. (2004) studied effectsof exposure to 12-hour cigarette smoke condensate on global geneexpression profiles for short-term cultures of normal human bronchialepithelial cells. However, use of information obtained from functional genomicsstudies is premature, because the degree of correlation between genomicexpression and protein expression continues to evolve. At present, thisapproach is a research tool. LSRO encourages the use of this approach toacquire additional data and to correlate results with other measures; however,microarrays are not sufficiently understood to serve as definitive exposureassessment tools.

IVComparison of exposure to toxicants arising from the use of potentialreduced-risk tobacco products (PRRTPs) with toxicant exposure arising fromconventional cigarette use is a critical component of assessment of PRRTPs.The Life Sciences Research Office (LSRO) considered methods andapproaches used to assess exposure and concluded that the current state-of-the-science is adequate for measuring reductions in exposure related toPRRTP use. Multiple methods such as smoke chemistry analysis, smokingtopography, biomarker studies, and other approaches can contribute toexposure assessment. However, of the available techniques, LSRO weightedbiomarker evaluation most heavily for demonstration of the exposure impactof a PRRTP on product users. LSRO identified biomarkers that have beensufficiently studied and validated so that, when used in adequately designedand executed clinical studies, investigators can obtain reliable estimates ofexposure.
A number of analyses (preclinical studies) are necessary to provide initialinformation for design of biomarker studies, beginning with a scientificallyinformed consideration of likely effects of the design and composition of thePRRTP compared with those of conventional cigarettes. Smoke chemistrystudies should be as comprehensive as possible to ensure that significantlevels of newly documented compounds and increases and decreases inpreviously detected compounds are measured and to provide the necessaryinformation to identify the appropriate biomarkers for use in exposureassessment studies. Exposure assessment is considered an iterativeprocess; therefore, as new studies provide additional information, it shouldbe used to reexamine data obtained earlier.
Although LSRO focused on the effect of PRRTP use on the tobacco productuser, environmental tobacco smoke (ETS) chemistry and, if necessary,biomarker studies are also important components of a full characterizationof the potential effects of a PRRTP on all individuals exposed to its smokeemissions. A decision tree approach to assess the potential for ETS exposurereduction may be most useful. Components of such an approach couldinclude, in addition to other considerations, discussion of product designand composition. A demonstration that ETS is quantitatively reduced and
CONCLUSIONS

94 Exposure Assessment
For internal use of Philip Morris personnel only.
that smoke constituents are not quantitatively increased could follow. If oneor more smoke constituents show a quantitative increase, toxicity informationindicating that risk would not increase should be collected and, if necessary,developed. Data from emerging technologies and other more standardtechniques may also contribute to confidence in the conclusions concerningassessment results.
The key to interpretation of all studies described is a consistent trend indata across studies. Inconsistencies across studies should be specificallyaddressed and reconciled with overall conclusions about the relative effectsof the PRRTP and conventional cigarettes on tobacco product and smokeexposure. A subsequent step is to weigh the importance of increases anddecreases in exposure measures.
The amount of exposure reduction required to lead to reduction in harm isnot known. Although exposure assessment is an important step in PRRTPevaluation, ultimately decreased toxicity of the complex mixture of smoke iscritical to risk reduction.

For internal use of Philip Morris personnel only.
V45CFR46. (2001) Title 45 Public Welfare. Part 46 Protection of HumanSubjects. Available at http://www.hhs.gov/ohrp/humansubjects/guidance/45cfr46.htm. Accessed 11-1-2004.
Adams, J. D., O’Mara-Adams, K. J. & Hoffmann, D. (1987) Toxic andcarcinogenic agents in undiluted mainstream smoke and sidestream smokeof different types of cigarettes. Carcinogenesis 8: 729-731.
Adam, T., Mitschke, S., Streibel, T., Baker, R. R. & Zimmermann, R. (2006)Quantitative puff-by-puff-resolved characterization of selected toxiccompounds in cigarette mainstream smoke. Chem Res Toxicol 19: 511-520.
Adam, T., Baker, R. R. & Zimmermann, R. (2007) Characterization of puff-by-puff resolved cigarette mainstream smoke by single photon ionization-time-of-flight mass spectrometry and principal component analysis. J AgricFood Chem 55: 2055-2061.
Agyei-Aye, K., Appleton, S., Rogers, R. A. & Taylor, C. R. (2004) Assessmentof the elution of charcoal, cellulose acetate, and other particles from cigaretteswith charcoal and activated charcoal/resin/filters. Inhal Toxicol 16: 615-635.
Al Delaimy, W. K. (2002) Hair as a biomarker for exposure to tobacco smoke.Tob Control 11: 176-182.
Al Delaimy, W. K., Mahoney, G. N., Speizer, F. E. & Willett, W. C. (2002)Toenail nicotine levels as a biomarker of tobacco smoke exposure. CancerEpidemiol Biomarkers Prev 11: 1400-1404.
Albertini, R., Clewell, H., Himmelstein, M. W., Morinello, E., Olin, S., Preston,J., Scarano, L., Smith, M. T., Swenberg, J., Tice, R. & Travis, C. (2003) Theuse of non-tumor data in cancer risk assessment: reflections on butadiene,vinyl chloride, and benzene. Regul Toxicol Pharmacol 37: 105-132.
Alexandrie, A. K., Warholm, M., Carstensen, U., Axmon, A., Hagmar, L.,Levin, J. O., Ostman, C. & Rannug, A. (2000) CYP1A1 and GSTM1polymorphisms affect urinary 1-hydroxypyrene levels after PAH exposure.Carcinogenesis 21: 669-676.
LITERATURE CITATIONS

96 Exposure Assessment
For internal use of Philip Morris personnel only.
American Conference of Governmental Industrial Hygienists (2005)Introduction to the Biological Exposure Indices [BEI Introduction: BEI® 7th
Edition Documentation]. Publication #7DOC-659. Cincinnati: AmericanConference of Governmental Industrial Hygienists.
Anderson, K. E., Carmella, S. G., Ye, M., Bliss, R. L., Le, C., Murphy, L. &Hecht, S. S. (2001) Metabolites of a tobacco-specific lung carcinogen innonsmoking women exposed to environmental tobacco smoke. J Natl CancerInst 93: 378-381.
Asami, S., Hirano, T., Yamaguchi, R., Tomioka, Y., Itoh, H. & Kasai, H. (1996)Increase of a type of oxidative DNA damage, 8-hydroxyguanine, and itsrepair activity in human leukocytes by cigarette smoking. Cancer Res 56:2546-2549.
Asami, S., Manabe, H., Miyake, J., Tsurudome, Y., Hirano, T., Yamaguchi, R.,Itoh, H. & Kasai, H. (1997) Cigarette smoking induces an increase in oxidativeDNA damage, 8-hydroxydeoxyguanosine, in a central site of the human lung.Carcinogenesis 18: 1763-1766.
Ashley, D. L., Bonin, M. A., Hamar, B. & McGeehin, M. (1996) Using theblood concentration of 2,5-dimethylfuran as a marker for smoking. Int ArchOccup Environ Health 68: 183-187.
Autrup, H., Vestergaard, A. B. & Okkels, H. (1995) Transplacental transfer ofenvironmental genotoxins: polycyclic aromatic hydrocarbon-albumin in non-smoking women, and the effect of maternal GSTM1 genotype.Carcinogenesis 16: 1305-1309.
Bader, M., Lewalter, J. & Angerer, J. (1995) Analysis of N-alkylated aminoacids in human hemoglobin: evidence for elevated N-methylvaline levels insmokers. Int Arch Occup Environ Health 67: 237-242.
Baggett, M. S., Morie, G. P., Simmons, M. W. & Lewis, J. S. (1974) Quantitativedetermination of semivolatile compounds in cigarette smoke. J Chromatogr97: 79-82.
Baker, R., Arlauskas, A., Bonin, A. & Angus, D. (1982) Detection of mutagenicactivity in human urine following fried pork or bacon meals. Cancer Lett16: 81-89.
Baker, R. R. & Proctor, C. J. (1990) The origins and properties of environmentaltobacco smoke. Environ Intl 16: 231-245.

Literature Citations 97
For internal use of Philip Morris personnel only.
Baker, R. R. (1999) Smoke chemistry. In: Tobacco. Production, Chemistryand Technology. (Davis, D. L. & Nielsen, M. T., eds.) World Agriculture Series.London, England: CORESTA, Blackwell Science, Ltd., pp. 398-439.
Baker, R. R., Dixon, M., Mariner, D. C., Shepperd, C. J., Scherer, G., Ogden,M. W., Robinson, J. H., Sinclair, N. M., Sherwood, N., Akiyama, Y., Sakamoto,K., Röper, W., Tricker, A. R., Marchand, V., Varignon, B. & Lionetti, G. (2004a)Terms used for exposure to smoke. Beitr Tabakforsch Int 21: 250.
Baker, R. R., Pereira da Silva, J. R. & Smith, G. (2004b) The effect of tobaccoingredients on smoke chemistry. Part I: Flavourings and additives. Food ChemToxicol 42: 3-37.
Baker, R. R. (2006) The generation of formaldehyde in cigarettes—Overviewand recent experiments. Food Chem Toxicol 44: 1799-1822.
Baker, R. R. & Dixon, M. (2006) The retention of tobacco smoke constituentsin the human respiratory tract. Inhal Toxicol 18: 255-294.
Baker, R. S., Darnton-Hill, I., Bonin, A. M., Arlauskas, A., Braithwaite, C.,Wootton, M. & Truswell, A. S. (1986) Urine mutagenicity as an indicator ofexposure to dietary mutagens formed during cooking of foods. Environ HealthPerspect 67: 147-152.
Balint, B., Donnelly, L. E., Hanazawa, T., Kharitonov, S. A. & Barnes, P. J.(2001) Increased nitric oxide metabolites in exhaled breath condensate afterexposure to tobacco smoke. Thorax 56: 456-461.
Bark, L. S. & Higson, H. G. (1963) A review of methods available for thedetection and determination of small amounts of cyanide. Analyst 88: 751-760.
Barr, D. B., Wilder, L. C., Caudill, S. P., Gonzalez, A. J., Needham, L. L. &Pirkle, J. L. (2005) Urinary creatinine concentrations in the U.S. population:implications for urinary biologic monitoring measurements. Environ HealthPerspect 113: 192-200.
Bartsch, H., Caporaso, N., Coda, M., Kadlubar, F., Malaveille, C., Skipper,P., Talaska, G., Tannenbaum, S. R. & Vineis, P. (1990) Carcinogen hemoglobinadducts, urinary mutagenicity, and metabolic phenotype in active and passivecigarette smokers. J Natl Cancer Inst 82: 1826-1831.
Bartsch, H. & Montesano, R. (1984) Relevance of nitrosamines to humancancer. Carcinogenesis 5: 1381-1393.

98 Exposure Assessment
For internal use of Philip Morris personnel only.
Benowitz, N. L. (1983) The use of biologic fluid samples in assessing tobaccosmoke consumption. In: Measurement in the Analysis and Treatment ofSmoking Behavior. National Institute on Drug Abuse Research Monograph48. (Grabowski, J., Bell, C. S. & National Institute on Drug Abuse, eds.)Rockville, MD: U.S. Department of Health and Human Services, Public HealthService, Alcohol, Drug Abuse, and Mental Health Administration, NationalInstitute on Drug Abuse, pp. 6-26.
Benowitz, N. L., Kuyt, F., Jacob, III, P., Jones, R. T. & Osman, A. L. (1983)Cotinine disposition and effects. Clin Pharmacol Ther 34: 604-611.
Benowitz, N. L. & Jacob, III, P. (1984) Daily intake of nicotine during cigarettesmoking. Clin Pharmacol Ther 35: 499-504.
Benowitz, N. L., Porchet, H. & Jacob, III, P. (1990) Pharmacokinetics,metabolism, and pharmacodynamics of nicotine. In: NicotinePsychopharmacology: Molecular, Cellular, and Behavioral Aspects.(Wonnacott, S., Russell, M. A. H. & Stolerman, I. P., eds.) New York: OxfordUniversity Press, pp. 112-157.
Benowitz, N. L. & Jacob, III, P. (1994) Metabolism of nicotine to cotininestudied by a dual stable isotope method. Clin Pharmacol Ther 56: 483-493.
Benowitz, N. L., Jacob, III, P., Fong, I. & Gupta, S. (1994) Nicotine metabolicprofile in man: comparison of cigarette smoking and transdermal nicotine. JPharmacol Exp Ther 268: 296-303.
Benowitz, N. L. & Jacob, III, P. (1997) Individual differences in nicotine kineticsand metabolism in humans. NIDA Res Monogr 173: 48-64.
Benowitz, N. L. (1999) Biomarkers of environmental tobacco smoke exposure.Environ Health Perspect 107 Suppl 2: 349-355.
Benowitz, N. L., Perez-Stable, E. J., Fong, I., Modin, G., Herrera, B. & Jacob,III, P. (1999) Ethnic differences in N-glucuronidation of nicotine and cotinine.J Pharmacol Exp Ther 291: 1196-1203.
Benowitz, N. L. (2001) Compensatory smoking of low-yield cigarettes. In:Risks Associated with Smoking Cigarettes with Low Machine-MeasuredYields of Tar and Nicotine. Smoking and Tobacco Control. Monograph No.13. (Burns, D. M., Benowitz, N. L. & Amacher, R. H., eds.) Bethesda, MD:National Institutes of Health, National Cancer Institute, NIH Pub. No. 02-5074, pp. 39-64.

Literature Citations 99
For internal use of Philip Morris personnel only.
Benowitz, N. L., Jacob, III, P., Ahijevych, K., Jarvis, M. J., Hall, S., LeHouezec, J.,Hansson, A., Lichtenstein, E., Henningfield, J., Tsoh, J., Hurt, R. D. & Velicer,W. (2002) Biochemical verification of tobacco use and cessation. NicotineTob Res 4: 149-159.
Benowitz, N. L., Herrera, B. & Jacob, III, P. (2004) Mentholated cigarette smokinginhibits nicotine metabolism. J Pharmacol Exp Ther 310: 1208-1215.
Benowitz, N. L., Jacob, III, P., Bernert, J. T., Wilson, M., Wang, L., Allen, F.& Dempsey, D. (2005) Carcinogen exposure during short-term switchingfrom regular to “light” cigarettes. Cancer Epidemiol Biomarkers Prev14: 1376-1383.
Benowitz, N. L., Lessov-Schlaggar, C. N., Swan, G. E. & Jacob, III, P. (2006)Female sex and oral contraceptive use accelerate nicotine metabolism. ClinPharmacol Ther 79: 480-488.
Beran, D. R. (2005) Remarks by David R. Beran, Executive Vice PresidentFinance, Planning and Information Philip Morris USA, Inc. Available at http://www.altria.com/media/press_release/03_02_pr_2005_09_07_02.asp.Accessed 5-31-2006.
Bergmark, E. (1997) Hemoglobin adducts of acrylamide and acrylonitrile inlaboratory workers, smokers and nonsmokers. Chem Res Toxicol 10: 78-84.
Bernstein, D. (2004) A review of the influence of particle size, puff volume,and inhalation pattern on the deposition of cigarette smoke particles in therespiratory tract. Inhal Toxicol 16: 675-689.
Bianchini, F., Donato, F., Faure, H., Ravanat, J. L., Hall, J. & Cadet, J. (1998)Urinary excretion of 5-(hydroxymethyl) uracil in healthy volunteers: effect ofactive and passive tobacco smoke. Int J Cancer 77: 40-46.
Binnie, V., McHugh, S., Macpherson, L., Borland, B., Moir, K. & Malik, K.(2004) The validation of self-reported smoking status by analysing cotininelevels in stimulated and unstimulated saliva, serum and urine. Oral Dis10: 287-293.
Bliss, R. E. & O’Connell, K. A. (1984) Problems with thiocyanate as an indexof smoking status: a critical review with suggestions for improving theusefulness of biochemical measures in smoking cessation research. HealthPsychol. 3: 563-581.

100 Exposure Assessment
For internal use of Philip Morris personnel only.
Boettcher, M. I. & Angerer, J. (2005) Determination of the major mercapturicacids of acrylamide and glycidamide in human urine by LC-ESI-MS/MS. JChromatogr B Analyt Technol Biomed Life Sci 824: 283-294.
Boettcher, M. I., Bolt, H. M., Drexler, H. & Angerer, J. (2005a) Excretion ofmercapturic acids of acrylamide and glycidamide in human urine after singleoral administration of deuterium-labelled acrylamide. Arch Toxicol 80: 55-61.
Boettcher, M. I., Schettgen, T., Kütting, B., Pischetsrieder, M. & Angerer, J.(2005b) Mercapturic acids of acrylamide and glycidamide as biomarkers ofthe internal exposure to acrylamide in the general population. Mutat Res580: 167-176.
Bolliger, C. T., Zellweger, J. P., Danielsson, T., van Biljon, X., Robidou, A.,Westin, A., Perruchoud, A. P. & Säwe, U. (2002) Influence of long-termsmoking reduction on health risk markers and quality of life. Nicotine TobRes 4: 433-439.
Bono, R., Vincenti, M., Meineri, V., Pignata, C., Saglia, U., Giachino, O. &Scursatone, E. (1999) Formation of N-(2-hydroxyethyl)valine due to exposureto ethylene oxide via tobacco smoke: A risk factor for onset of cancer. EnvironRes 81: 62-71.
Boogaard, P. J. & van Sittert, N. J. (1995) Biological monitoring of exposureto benzene: a comparison between S-phenylmercapturic acid, trans,trans-muconic acid, and phenol. Occup Environ Med 52: 611-620.
Boogaard, P. J. & van Sittert, N. J. (1996) Suitability of S-phenyl mercapturicacid and trans-trans-muconic acid as biomarkers for exposure to lowconcentrations of benzene. Environ Health Perspect 104 Suppl 6: 1151-1157.
Borgerding, M. & Klus, H. (2005) Analysis of complex mixtures—cigarettesmoke. Exp Toxicol Pathol 57 Suppl 1: 43-73.
Bourdoux, P. P. (1995) Measurement of thiocyanate in serum or urine yieldsdifferent information. J Anal Toxicol 19: 127.
Bowman, D. L., Smith, C. J., Bombick, B. R., Avalos, J. T., Davis, R. A., Morgan,W. T. & Doolittle, D. J. (2002) Relationship between FTC ‘tar’ and urinemutagenicity in smokers of tobacco-burning or Eclipse cigarettes. Mutat Res521: 137-149.

Literature Citations 101
For internal use of Philip Morris personnel only.
Breland, A. B., Buchhalter, A. R., Evans, S. E. & Eissenberg, T. (2002a)Evaluating acute effects of potential reduced-exposure products for smokers:clinical laboratory methodology. Nicotine Tob Res 4 Suppl 2: S131-S140.
Breland, A. B., Evans, S. E., Buchhalter, A. R. & Eissenberg, T. (2002b)Acute effects of Advance: a potential reduced exposure product for smokers.Tob Control 11: 376-378.
Breland, A. B., Acosta, M. C. & Eissenberg, T. (2003) Tobacco specificnitrosamines and potential reduced exposure products for smokers: apreliminary evaluation of Advance™. Tob Control 12: 317-321.
Bridges, R. B., Humble, J. W., Turbek, J. A. & Rehm, S. R. (1986) Smokinghistory, cigarette yield and smoking behavior as determinants of smokeexposure. Eur J Respir Dis Suppl 146: 129-137.
Bridges, R. B., Combs, J. G., Humble, J. W., Turbek, J. A., Rehm, S. R. &Haley, N. J. (1990) Puffing topography as a determinant of smoke exposure.Pharmacol Biochem Behav 37: 29-39.
Brown & Williamson Tobacco (2002) Advance® package insert.
Brugnone, F., Perbellini, L., Romeo, L., Bianchin, M., Tonello, A., Pianalto, G.,Zambon, D. & Zanon, G. (1998) Benzene in environmental air and humanblood. Int Arch Occup Environ Health 71: 554-559.
Brunnemann, K. D. & Hoffmann, D. (1974) The pH of tobacco smoke. FoodCosmet Toxicol 12: 115-124.
Brunnemann, K. D., Kagan, M. R., Cox, J. E. & Hoffmann, D. (1990) Analysisof 1,3-butadiene and other selected gas-phase components in cigarettemainstream and sidestream smoke by gas chromatography-mass selectivedetection. Carcinogenesis 11: 1863-1868.
Brunnemann, K. D., Prokopczyk, B., Djordjevic, M. V. & Hoffmann, D. (1996)Formation and analysis of tobacco-specific N-nitrosamines. Crit Rev Toxicol26: 121-137.
Bryant, M. S., Skipper, P. L., Tannenbaum, S. R. & Maclure, M. (1987)Hemoglobin adducts of 4-aminobiphenyl in smokers and nonsmokers. CancerRes 47: 602-608.

102 Exposure Assessment
For internal use of Philip Morris personnel only.
Bryant, M. S., Vineis, P., Skipper, P. L. & Tannenbaum, S. R. (1988)Hemoglobin adducts of aromatic amines: associations with smoking statusand type of tobacco. Proc Natl Acad Sci USA 85: 9788-9791.
Buchhalter, A. R., Schrinel, L. & Eissenberg, T. (2001) Withdrawal-suppressingeffects of a novel smoking system: comparison with own brand, not ownbrand, and de-nicotinized cigarettes. Nicotine Tob Res 3: 111-118.
Burns, D. M. & Benowitz, N. L. (2001) Public health implications of changesin cigarette design and marketing. In: Risks Associated with SmokingCigarettes with Low Machine-Measured Yields of Tar and Nicotine. Smokingand Tobacco Control. Monograph No. 13. (Burns, D. M., Benowitz, N. L. &Amacher, R. H., eds.) Bethesda, MD: National Institutes of Health, NationalCancer Institute, NIH Pub. No. 02-5074, pp. 1-12.
Burns, D. M., Major, J. M., Shanks, T. G., Thun, M. J. & Samet, J. M. (2001)Smoking lower yield cigarettes and disease risks. In: Risks Associated withSmoking Cigarettes with Low Machine-Measured Yields of Tar and Nicotine.Smoking and Tobacco Control. Monograph No. 13. (Burns, D. M., Benowitz,N. L. & Amacher, R. H., eds.) Bethesda, MD: National Institutes of Health,National Cancer Institute, NIH Pub. No. 02-5074, pp. 65-158.
Burton, H. R., Dye, N. K. & Bush, L. P. (1992) Distribution of tobaccoconsituents in tobacco leaf tissue. 1. Tobacco-specific nitrosamines, nitrate,and alkaloids. J Agric Food Chem 40: 1055.
Butts, W. C., Kueheman, M. & Widdowson, G. M. (1974) Automated methodfor determining serum thiocyanate, to distinguish smokers from nonsmokers.Clin Chem 20: 1344-1348.
Byrd, G. D., Chang, K. M., Greene, J. M. & deBethizy, J. D. (1992) Evidencefor urinary excretion of glucuronide conjugates of nicotine, cotinine, andtrans-3′-hydroxycotinine in smokers. Drug Metab Dispos 20: 192-197.
Byrd, G. D., Davis, R. A. & Kazemi Vala, E. (1995) Comparison of methodsfor determining nicotine and its metabolites in urine. Poster Abstract 09.Abstracts of the 1st Annual Meeting of the Society for Research on Nicotineand Tobacco, 24-25 March 1995, San Diego, CA.
Byrd, G. D. & Ogden, M. W. (2003) Liquid chromatographic/tandem massspectrometric method for the determination of the tobacco-specific nitrosaminemetabolite NNAL in smokers’ urine. J Mass Spectrom 38: 98-107.

Literature Citations 103
For internal use of Philip Morris personnel only.
Byrd, G. D., Davis, R. A. & Ogden, M. W. (2005) A rapid LC-MS-MS methodfor the determination of nicotine and cotinine in serum and saliva samplesfrom smokers: validation and comparison with a radioimmunoassay method.J Chromatogr Sci 43: 133-140.
Calleman, C. J., Wu, Y., He, F., Tian, G., Bergmark, E., Zhang, S., Deng, H.,Wang, Y., Crofton, K. M., Fennell, T. & Costa L. G. (1994) Relationshipsbetween biomarkers of exposure and neurological effects in a group ofworkers exposed to acrylamide. Toxicol Appl Pharmacol 126: 361-371.
Carmella, S. G. & Hecht, S. S. (1987) Formation of hemoglobin adductsupon treatment of F344 rats with the tobacco-specific nitrosamines4-(methylnitrosamino)-1-(3-pyridyl)-1-butanone and N′-nitrosonornicotine.Cancer Res 47: 2626-2630.
Carmella, S. G., Kagan, S. S., Kagan, M., Foiles, P. G., Palladino, G., Quart,A. M., Quart, E. & Hecht, S. S. (1990) Mass spectrometric analysis of tobacco-specific nitrosamine hemoglobin adducts in snuff dippers, smokers, andnonsmokers. Cancer Res 50: 5438-5445.
Carmella, S. G., Akerkar, S. & Hecht, S. S. (1993) Metabolites of the tobacco-specific nitrosamine 4-(methylnitrosamino)-1-(3-pyridyl)-1-butanone insmokers’ urine. Cancer Res 53: 721-724.
Carmella, S. G., Akerkar, S. A., Richie, Jr., J. P. & Hecht, S. S. (1995)Intraindividual and interindividual differences in metabolites of the tobacco-specific lung carcinogen 4-(methylnitrosamino)-1-(3-pyridyl)-1-butanone(NNK) in smokers’ urine. Cancer Epidemiol Biomarkers Prev 4: 635-642.
Carmella, S. G., Chen, M., Villalta, P. W., Gurney, J. G., Hatsukami, D. K. &Hecht, S. S. (2002) Ethylation and methylation of hemoglobin in smokersand non-smokers. Carcinogenesis 23: 1903-1910.
Carmella, S. G., Han, S., Fristad, A., Yang, Y. & Hecht, S. S. (2003) Analysisof total 4-(methylnitrosamino)-1-(3-pyridyl)-1-butanol (NNAL) in human urine.Cancer Epidemiol Biomarkers Prev 12: 1257-1261.
Carmella, S. G., Chen, M., Yagi, H., Jerina, D. M. & Hecht, S. S. (2004a)Analysis of phenanthrols in human urine by gas chromatography-massspectrometry: potential use in carcinogen metabolite phenotyping. CancerEpidemiol Biomarkers Prev 13: 2167-2174.
104 Exposure Assessment
For internal use of Philip Morris personnel only.
Carmella, S. G., Le, K. A. & Hecht, S. S. (2004b) Improved method fordetermination of 1-hydroxypyrene in human urine. Cancer EpidemiolBiomarkers Prev 13: 1261-1264.
Carmella, S. G., Han, S., Villalta, P. W. & Hecht, S. S. (2005) Analysis of total4-(methylnitrosamino)-1-(3-pyridyl)-1-butanol in smokers’ blood. CancerEpidemiol Biomarkers Prev 14: 2669-2672.
Centers for Disease Control and Prevention. (2005a) Annual smoking-attributable mortality, years of potential life lost, and productivity losses—United States, 1997-2001. MMWR Morb Mortal Wkly Rep 54: 625-628.
Centers for Disease Control and Prevention. (2005b) Cigarette smoking amongadults—United States, 2004. MMWR Morb Mortal Wkly Rep 54: 1121-1124.
Centers for Disease Control and Prevention. (2005c) State-specificprevalence of cigarette smoking and quitting among adults—United States,2004. MMWR Morb Mortal Wkly Rep 54: 1124-1127.
Centers for Disease Control and Prevention & National Center for HealthStatistics. (2006) Summary health statistics for U.S. the Adults: NationalHealth Interview Survey. Available at http://www.cdc.gov/nchs/data/series/sr_10/sr10_228.pdf. Accessed 6-13-2006.
Chehne, F., Oguogho, A., Lupattelli, G., Palumbo, B. & Sinzinger, H. (2002)Effect of giving up cigarette smoking and restarting in patients withclinically manifested atherosclerosis. Prostaglandins Leukot Essent FattyAcids 67: 333-339.
Chepiga, T. A., Morton, M. J., Murphy, P. A., Avalos, J. T., Bombick, B. R.,Doolittle, D. J., Borgerding, M. F. & Swauger, J. E. (2000) A comparison ofthe mainstream smoke chemistry and mutagenicity of a representativesample of the US cigarette market with two Kentucky reference cigarettes(K1R4F and K1R5F). Food Chem Toxicol 38: 949-962.
Chetiyanukornkul, T., Toriba, A., Kizu, R., Kimura, K. & Hayakawa, K. (2004)Hair analysis of nicotine and cotinine for evaluating tobacco smoke exposure byliquid chromatography-mass spectrometry. Biomed Chromatogr 18: 655-661.
Clark, K. D., Wardrobe-Wong, N., Elliott, J. J., Gill, P. T., Tait, N. P. & Snashall,P. D. (1998) Cigarette smoke inhalation and lung damage in smokingvolunteers. Eur Respir J 12: 395-399.

Literature Citations 105
For internal use of Philip Morris personnel only.
Coburn, R. F., Forster, R. E. & Kane, P. B. (1965) Considerations of thephysiological variables that determine the blood carboxyhemoglobinconcentration in man. J Clin Invest 44: 1899-1910.
Coghlin, J., Gann, P. H., Hammond, S. K., Skipper, P. L., Taghizadeh, K.,Paul, M. & Tannenbaum, S. R. (1991) 4-Aminobiphenyl hemoglobin adductsin fetuses exposed to the tobacco smoke carcinogen in utero. J Natl CancerInst 83: 274-280.
Collier, A. C. & Pritsos, C. A. (2003) Environmental tobacco smoke in theworkplace: markers of exposure, polymorphic enzymes and implications fordisease state. Chem Biol Interact 146: 211-224.
Committee on Biological Markers & Subcommittee on Reproductive andDevelopmental Toxicology. (1989) Biologic Markers in ReproductiveToxicology. Washington, DC: National Academy Press.
Cooney, A. H., Garland, W. A., Rubio, F., Kronychuk, H., Norkus, E. P. &Kuenzig, W. (1986) Factors influencing the urinary excretion ofNitrosodimethylamine and Nitrosoproline in human beings. In: Mechanismsin Tobacco Carcinogenesis. Banbury Report 23. (Hoffmann, D. & Harris, C.C., eds.) Cold Spring Harbor Laboratory, pp. 21-32.
CORESTA. (2004) CORESTA Recommended Method No. 58. Determinationof benzo(a)pyrene in cigarette mainstream smoke — gas chromatography-mass spectrometry method. Available at http://www.coresta.org/Recommended_Methods/CRM_58.pdf. Accessed 5-26-2004.
CORESTA. (2005) CORESTA Recommended Method No. 63: Determinationof tobacco specific nitrosamines in cigarette mainstream smoke — GC-TEAmethod. Available at http://www.coresta.org/Recommended_Methods/CRM_63.pdf. Accessed 6-30-2005.
Coultas, D. B., Howard, C. A., Peake, G. T., Skipper, B. J. & Samet, J. M.(1987) Salivary cotinine levels and involuntary tobacco smoke exposure inchildren and adults in New Mexico. Am Rev Respir Dis 136: 305-309.
Counts, M. E., Hsu, F. S. & Tewes, F. J. (2006) Development of a commercialcigarette “market map” comparison methodology for evaluating new or non-conventional cigarettes. Regul Toxicol Pharmacol 46: 225-242.

106 Exposure Assessment
For internal use of Philip Morris personnel only.
Crawford, F. G., Mayer, J., Santella, R. M., Cooper, T. B., Ottman, R., Tsai,W. Y., Simon-Cereijido, G., Wang, M., Tang, D. & Perera, F. P. (1994)Biomarkers of environmental tobacco smoke in preschool children andtheir mothers. J Natl Cancer Inst 86: 1398-1402.
Crispino, C. C., Fernandes, K. G., Kamogawa, M. Y., Nobrega, J. A., Nogueira,A. R. & Ferreira, M. M. (2007) Multivariate classification of cigarettes accordingto their elemental content determined by inductively coupled plasma opticalemission spectrometry. Anal Sci 23: 435-438.
Culp, S. J., Roberts, D. W., Talaska, G., Lang, N. P., Fu, P. P., Lay, J. O., Jr.,Teitel, C. H., Snawder, J. E., Von Tungeln, L. S. & Kadlubar, F. F. (1997)Immunochemical, 32P-postlabeling, and GC/MS detection of 4-aminobiphenyl-DNA adducts in human peripheral lung in relation to metabolicactivation pathways involving pulmonary N-oxidation, conjugation, andperoxidation. Mutat Res 378: 97-112.
Cummings, K. M., Markello, S. J., Mahoney, M., Bhargava, A. K., McElroy,P. D. & Marshall, J. R. (1990) Measurement of current exposure toenvironmental tobacco smoke. Arch Environ Health 45: 74-79.
Cunnington, A. J. & Hormbrey, P. (2002) Breath analysis to detect recentexposure to carbon monoxide. Postgrad Med J 78: 233-237.
Curtin, G. M., Potts, R. J., Ayres, P. H., Doolittle, D. J. & Swauger, J. E. (2006)Adaptation to toxicant exposure during rodent lung tumorgenesis. In:Toxicology of the Lung. 4th ed. (Gardner, D. E., ed.) Boca Raton, FL: CRCPress, pp. 587-622.
Curvall, M., Romert, L., Norlen, E. & Enzell, C. R. (1987) Mutagen levels inurine from snuff users, cigarette smokers and non tobacco users—acomparison. Mutat Res 188: 105-110.
Dahlström, A., Lundell, B., Curvall, M. & Thapper, L. (1990) Nicotine andcotinine concentrations in the nursing mother and her infant. Acta PaediatrScand 79: 142-147.
Daisey, J. M. (1999) Tracers for assessing exposure to environmental tobaccosmoke: what are they tracing? Environ Health Perspect 107 Suppl 2: 319-327.

Literature Citations 107
For internal use of Philip Morris personnel only.
Dallinga, J. W., Pachen, D. M., Wijnhoven, S. W., Breedijk, A., van’t Veer, L.,Wigbout, G., Van Zandwijk, N., Maas, L. M., van Agen, E., Kleinjans, J. C. &Van Schooten, F. J. (1998) The use of 4-aminobiphenyl hemoglobin adductsand aromatic DNA adducts in lymphocytes of smokers as biomarkers ofexposure. Cancer Epidemiol Biomarkers Prev 7: 571-577.
Daube, H., Scherer, G., Riedel, K., Ruppert, T., Tricker, A. R., Rosenbaum, P.& Adlkofer, F. (1997) DNA adducts in human placenta in relation to tobaccosmoke exposure and plasma antioxidant status. J Cancer Res Clin Oncol123: 141-151.
Davies, H. M. & Vaught, A. (1990) The Reference Cigarette. Lexington, KY:The University of Kentucky Printing Service.
Davis, R. A., Stiles, M. F., deBethizy, J. D. & Reynolds, J. H. (1991) Dietarynicotine: a source of urinary cotinine. Food Chem Toxicol 29: 821-827.
Day, B. W., Skipper, P. L., Rich, R. H., Naylor, S. & Tannenbaum, S. R.(1991) Conversion of a hemoglobin α chain aspartate(47) ester toN-(2,3-dihydroxypropyl)asparagine as a method for identification of theprincipal binding site for benzo[a]pyrene anti-diol epoxide. Chem ResToxicol 4: 359-363.
Degawa, M., Stern, S. J., Martin, M. V., Guengerich, F. P., Fu, P. P., Ilett, K. F.,Kaderlik, R. K. & Kadlubar, F. F. (1994) Metabolic activation and carcinogen-DNA adduct detection in human larynx. Cancer Res 54: 4915-4919.
Degiampietro, P., Peheim, E., Drew, D., Graf, H. & Colombo, J. P. (1987)Determination of thiocyanate in plasma and saliva without deproteinisationand its validation as a smoking parameter. J Clin Chem Clin Biochem 25:711-717.
Dempsey, D., Jacob, III, P. & Benowitz, N. L. (2002) Accelerated metabolismof nicotine and cotinine in pregnant smokers. J Pharmacol Exp Ther301: 594-598.
Deveci, S. E., Deveci, F., Acik, Y. & Ozan, A. T. (2004) The measurement ofexhaled carbon monoxide in healthy smokers and non-smokers. Respir Med98: 551-556.
Dhar, P. (2004) Measuring tobacco smoke exposure: quantifying nicotine/cotinine concentration in biological samples by colorimetry, chromatographyand immunoassay methods. J Pharm Biomed Anal 35: 155-168.

108 Exposure Assessment
For internal use of Philip Morris personnel only.
Dixon, M. & Baker, R. R. (2003) Influence of cigarette design on humansmoking behavior and sensory responses. Rec Adv Tob Sci 29: 77-99.
Djordjevic, M. V., Hoffmann, D. & Hoffmann, I. (1997) Nicotine regulatessmoking patterns. Prev Med 26: 435-440.
Djordjevic, M. V., Hoffman, D., Thompson, S., & Stellman, S. D. (1998)Smoking behaviour and exposure to selected toxic agents among smokersof low- and medium-yield cigarettes. [Abstract ST 16]. Available at http://legacy.library.ucsf.edu/tid/kha01d00. Accessed 12-6-2002.
Djordjevic, M. V., Stellman, S. D. & Zang, E. (2000) Doses of nicotine and lungcarcinogens delivered to cigarette smokers. J Natl Cancer Inst 92: 106-111.
Dolara, P., Mazzoli, S., Rosi, D., Buiatti, E., Baccetti, S., Turchi, A. & Vannucci, V.(1981) Exposure to carcinogenic chemicals and smoking increases urinaryexcretion of mutagens in humans. J Toxicol Environ Health 8: 95-103.
Doll, R. & Hill, A. B. (1954) The mortality of doctors in relation to their smokinghabits. A preliminary report. BMJ 228: 1451-1455.
Doll, R. & Peto, R. (1976) Mortality in relation to smoking: 20 years’observations on male British doctors. BMJ 2: 1525-1536.
Doll, R., Peto, R., Boreham, J. & Sutherland, I. (2004) Mortality in relation tosmoking: 50 years’ observations on male British doctors. BMJ 328: 1519-1527.
Doolittle, D. J., Rahn, C. A., Burger, G. T., Lee, C. K., Reed, B., Riccio, E.,Howard, G., Passananti, G. T., Vesell, E. S. & Hayes, A. W. (1989) Effect ofcooking methods on the mutagenicity of food and on urinary mutagenicity ofhuman consumers. Food Chem Toxicol 27: 657-666.
Dor, F., Dab, W., Empereur-Bissonnet, P. & Zmirou, D. (1999) Validity ofbiomarkers in environmental health studies: the case of PAHs and benzene.Crit Rev Toxicol 29: 129-168.
Douglas, C. G., Haldane, J. S. & Haldane, J. B. S. (1912) The laws ofcombination of hæmoglobin with carbon monoxide and oxygen. J Physiol(Lond) 44: 275-304.
ECLIPSE Expert Panel. (2000) A safer cigarette? A comparative study.A consensus report. Inhal Toxicol 12: 1-48.

Literature Citations 109
For internal use of Philip Morris personnel only.
Einistö, P., Nohmi, T., Watanabe, M. & Ishidate, M., Jr. (1990) Sensitivity ofSalmonella typhimurium YG1024 to urine mutagenicity caused by cigarettesmoking. Mutat Res 245: 87-92.
Esterbauer, H., Eckl, P. & Ortner, A. (1990) Possible mutagens derived fromlipids and lipid precursors. Mutat Res 238: 223-233.
Fagerström, K., Hughes, J. R., Rasmussen, T. & Callas, P. W. (2000)Randomised trial investigating effect of a novel nicotine delivery device(Eclipse) and a nicotine oral inhaler on smoking behaviour, nicotine andcarbon monoxide exposure, and motivation to quit. Tob Control 9: 327-333.
Fagerström, K., Hughes, J. R. & Callas, P. W. (2002) Long-term effects of theEclipse cigarette substitute and the nicotine inhaler in smokers not interestedin quitting. Nicotine Tob Res 4 Suppl 2: S141-S145.
Fagerström, K. (2005) The nicotine market: an attempt to estimate the nicotineintake from various sources and the total nicotine consumption in somecountries. Nicotine Tob Res 7: 343-350.
Falter, B., Kutzer, C. & Richter, E. (1994) Biomonitoring of hemoglobin adducts:aromatic amines and tobacco-specific nitrosamines. Clin Invest 72: 364-371.
Farmer, P. B., Kaur, B., Roach, J., Levy, L., Consonni, D., Bertazzi,P. A., Pesatori, A., Fustinoni, S., Buratti, M., Bonzini, M., Colombi, A., Popov, T.,Cavallo, D., Desideri, A., Valerio, F., Pala, M., Bolognesi, C. & Merlo,F. (2005) The use of S-phenylmercapturic acid as a biomarker in molecularepidemiology studies of benzene. Chem Biol Interact 153-154: 97-102.
Federal Trade Commission. (1967a) Cigarettes. Testing for tar and nicotinecontent. Fed Reg 32 (147): 11178.
Federal Trade Commission. (1967b) FTC to begin cigarette testing. Newsrelease August 1, 1967. Available at http://legacy.library.ucsf.edu/tid/yfl85f00.Accessed 12-12-2001b.
Federal Trade Commission. (1980) Cigarettes and related matters; carbonmonoxide, “tar” and nicotine content of cigarette smoke; description of newmachine and methods to be used in testing. Fed Reg 45: 46483-46487.
Federal Trade Commission. (1997) Cigarette testing: Request for publiccomment. Available at http://www.ftc.com/os/1997/9709/cigtest.htm.Accessed 4-5-2002.

110 Exposure Assessment
For internal use of Philip Morris personnel only.
Feng, S., Roethig, H. J., Liang, Q., Kinser, R., Jin, Y., Scherer, G., Urban, M.,Engl, J. & Riedel, K. (2006) Evaluation of urinary 1-hydroxypyrene,S-phenylmercapturic acid, trans,trans-muconic acid, 3-methyladenine,3-ethyladenine, 8-hydroxy-2′-deoxyguanosine and thioethers as biomarkersof exposure to cigarette smoke. Biomarkers 11: 28-52.
Feng, S., Plunkett, S. E., Lam, K., Kapur, S., Muhammad, R., Jin, Y., Zimmermann,M., Mendes, P., Kinser, R. & Roethig, H. J. (2007) A new method for estimatingthe retention of selected smoke constituents in the respiratory tract of smokersduring cigarette smoking. Inhal Toxicol 19: 169-179.
Fennell, T. R., MacNeela, J. P., Morris, R. W., Watson, M., Thompson, C. L. &Bell, D. A. (2000) Hemoglobin adducts from acrylonitrile and ethylene oxidein cigarette smokers: effects of glutathione S-transferase T1-null andM1-null genotypes. Cancer Epidemiol Biomarkers Prev 9: 705-712.
Flamini, G., Romano, G., Curigliano, G., Chiominto, A., Capelli, G.,Boninsegna, A., Signorelli, C., Ventura, L., Santella, R. M., Sgambato, A. &Cittadini, A. (1998) 4-Aminobiphenyl-DNA adducts in laryngeal tissue andsmoking habits: an immunohistochemical study. Carcinogenesis 19: 353-357.
Foiles, P. G., Akerkar, S. A., Carmella, S. G., Kagan, M., Stoner, G. D., Resau,J. H. & Hecht, S. S. (1991) Mass spectrometric analysis of tobacco-specificnitrosamine-DNA adducts in smokers and nonsmokers. Chem Res Toxicol4: 364-368.
Fowles, J. & Dybing, E. (2003) Application of toxicological risk assessmentprinciples to the chemical constituents of cigarette smoke. Tob Control12: 424-430.
Fustinoni, S., Giampiccolo, R., Pulvirenti, S., Buratti, M. & Colombi, A. (1999)Headspace solid-phase microextraction for the determination of benzene,toluene, ethylbenzene and xylenes in urine. J Chromatogr B Biomed SciAppl 723: 105-115.
Fustinoni, S., Soleo, L., Warholm, M., Begemann, P., Rannug, A., Neumann,H. G., Swenberg, J. A., Vimercati, L. & Colombi, A. (2002) Influence ofmetabolic genotypes on biomarkers of exposure to 1,3-butadiene in humans.Cancer Epidemiol Biomarkers Prev 11: 1082-1090.

Literature Citations 111
For internal use of Philip Morris personnel only.
Gallagher, J. E., Jackson, M. A., George, M. H., Lewtas, J. & Robertson, I. G.(1989) Differences in detection of DNA adducts in the 32P-postlabellingassay after either 1-butanol extraction or nuclease P1 treatment. CancerLett 45: 7-12.
Gelboin, H. V. (1980) Benzo[a]pyrene metabolism, activation andcarcinogenesis: role and regulation of mixed-function oxidases and relatedenzymes. Physiol Rev 60: 1107-1166.
Ghittori, S., Maestri, L., Fiorentino, M. L. & Imbriani, M. (1995) Evaluation ofoccupational exposure to benzene by urinalysis. Int Arch Occup EnvironHealth 67: 195-200.
Glatz, Z., Novakova, S. & Sterbova, H. (2001) Analysis of thiocyanate inbiological fluids by capillary zone electrophoresis. J Chromatogr A 916:273-277.
Gmeiner, G., Krassnig, C., Schmid, E. & Tausch, H. (1998) Fast screeningmethod for the profile analysis of polycyclic aromatic hydrocarbon metabolitesin urine using derivatisation—solid-phase microextraction. J Chromatogr BBiomed Sci Appl 705: 132-138.
Gobba, F., Rovesti, S., Borella, P., Vivoli, R., Caselgrandi, E. & Vivoli, G.(1997) Inter-individual variability of benzene metabolism to trans,trans-muconic acid and its implications in the biological monitoring of occupationalexposure. Sci Total Environ 199: 41-48.
Godschalk, R., Nair, J., Van Schooten, F. J., Risch, A., Drings, P., Kayser, K.,Dienemann, H. & Bartsch, H. (2002) Comparison of multiple DNA adducttypes in tumor adjacent human lung tissue: effect of cigarette smoking.Carcinogenesis 23: 2081-2086.
Godtfredsen, N. S., Holst, C., Prescott, E., Vestbo, J. & Osler, M. (2002a)Smoking reduction, smoking cessation, and mortality: a 16-year follow-upof 19,732 men and women from The Copenhagen Centre for ProspectivePopulation Studies. Am J Epidemiol 156: 994-1001.
Godtfredsen, N. S., Vestbo, J., Osler, M. & Prescott, E. (2002b) Risk of hospitaladmission for COPD following smoking cessation and reduction: a Danishpopulation study. Thorax 57: 967-972.

112 Exposure Assessment
For internal use of Philip Morris personnel only.
Godtfredsen, N. S., Osler, M., Vestbo, J., Andersen, I. & Prescott, E. (2003)Smoking reduction, smoking cessation, and incidence of fatal and non-fatalmyocardial infarction in Denmark 1976-1998: a pooled cohort study.J Epidemiol Community Health 57: 412-416.
Godtfredsen, N. S., Prescott, E. & Osler, M. (2005) Effect of smoking reductionon lung cancer risk. JAMA 294: 1505-1510.
Gordon, S. M. (1990) Identification of exposure markers in smokers’ breath.J Chromatogr 511: 291-302.
Gordon, S. M., Wallace, L. A., Brinkman, M. C., Callahan, P. J. & Kenny, D. V.(2002) Volatile organic compounds as breath biomarkers for active andpassive smoking. Environ Health Perspect 110: 689-698.
Granella, M., Priante, E., Nardini, B., Bono, R. & Clonfero, E. (1996) Excretionof mutagens, nicotine and its metabolites in urine of cigarette smokers.Mutagenesis 11: 207-211.
Grimmer, G., Naujack, K. W. & Dettbarn, G. (1987) Gaschromatographicdetermination of polycyclic aromatic hydrocarbons, aza-arenes, aromaticamines in the particle and vapor phase of mainstream and sidestream smokeof cigarettes. Toxicol Lett 35: 117-124.
Grimmer, G., Dettbarn, G. & Jacob, J. (1993) Biomonitoring of polycyclicaromatic hydrocarbons in highly exposed coke plant workers by measurementof urinary phenanthrene and pyrene metabolites (phenols and dihydrodiols).Int Arch Occup Environ Health 65: 189-199.
Grimmer, G., Jacob, J., Dettbarn, G. & Naujack, K. W. (1997) Determinationof urinary metabolites of polycyclic aromatic hydrocarbons (PAH) for therisk assessment of PAH-exposed workers. Int Arch Occup Environ Health69: 231-239.
Grimmer, G., Dettbarn, G., Seidel, A. & Jacob, J. (2000) Detection ofcarcinogenic aromatic amines in the urine of non-smokers. Sci Total Environ247: 81-90.
Guerin, M. R. (1987) Formation and physicochemical nature of sidestreamsmoke. IARC Sci Publ 81: 11-23.

Literature Citations 113
For internal use of Philip Morris personnel only.
Guerin, M. R., Jenkins, R. A. & Tomkins, B. A. (1992) Mainstream andsidestream cigarette smoke. In: The Chemistry of Environmental TobaccoSmoke: Composition and Measurement. Ann Arbor, MI: Lewis Publishers,Inc., pp. 43-62.
Gündel, J., Mannschreck, C., Buttner, K., Ewers, U. & Angerer, J. (1996)Urinary levels of 1-hydroxypyrene, 1-, 2-, 3-, and 4-hydroxyphenanthrene infemales living in an industrial area of Germany. Arch Environ Contam Toxicol31: 585-590.
Gündel, J. & Angerer, J. (2000) High-performance liquid chromatographicmethod with fluorescence detection for the determination of3-hydroxybenzo[a]pyrene and 3-hydroxybenz[a]anthracene in the urine ofpolycyclic aromatic hydrocarbon-exposed workers. J Chromatogr B BiomedSci Appl 738: 47-55.
Hagmar, L., Wirfalt, E., Paulsson, B. & Tornqvist, M. (2005) Differences inhemoglobin adduct levels of acrylamide in the general population with respectto dietary intake, smoking habits and gender. Mutat Res 580: 157-165.
Hammond, S. K., Coghlin, J., Gann, P. H., Paul, M., Taghizadeh, K., Skipper,P. L. & Tannenbaum, S. R. (1993) Relationship between environmentaltobacco smoke exposure and carcinogen-hemoglobin adduct levels innonsmokers. J Natl Cancer Inst 85: 474-478.
Hammond, D., Fong, G. T., Cummings, K. M., O’Connor, R. J., Giovino, G. A.& McNeill, A. (2006) Cigarette yields and human exposure: a comparisonof alternative testing regimens. Cancer Epidemiol Biomarkers Prev 15:1495-1501.
Hammond, D., Wiebel, F., Kozlowski, L. T., Borland, R., Cummings, K. M.,O’Connor, R. J., McNeill, A., Connolly, G. N., Arnott, D. & Fong, G. T. (2007)Revising the machine smoking regime for cigarette emissions: implicationsfor tobacco control policy. Tob Control 16: 8-14.
Hansen, A. M., Poulsen, O. M., Sigsgaard, T. & Christensen, J. M. (1994)The validity of α-naphthol in urine as a marker for exposure to polycyclicaromatic hydrocarbons. Anal Chim Acta 291: 341-347.
Harper, K. H. (1957) The metabolism of pyrene. Br J Cancer 11: 499-507.

114 Exposure Assessment
For internal use of Philip Morris personnel only.
Hatsukami, D. K., Hecht, S. S., Hennrikus, D. J., Joseph, A. M. & Pentel, P. R.(2003) Biomarkers of tobacco exposure or harm: application to clinical andepidemiological studies. 25-26 October, 2001, Minneapolis, Minnesota.Nicotine Tob Res 5: 387-396.
Hatsukami, D. K., Henningfield, J. E. & Kotlyar, M. (2004a) Harm reductionapproaches to reducing tobacco-related mortality. Annu Rev Public Health25: 377-395.
Hatsukami, D. K., Lemmonds, C., Zhang, Y., Murphy, S. E., Le, C., Carmella,S. G. & Hecht, S. S. (2004b) Evaluation of carcinogen exposure in peoplewho used “reduced exposure” tobacco products. J Natl Cancer Inst 96:844-852.
Hatsukami, D. K., Giovino, G. A., Eissenberg, T., Clark, P. I., Lawrence, D. &Leischow, S. (2005a) Methods to assess potential reduced exposureproducts. Nicotine Tob Res 7: 827-844.
Hatsukami, D. K., Kotlyar, M., Allen, S., Jensen, J., Li, S., Le, C. & Murphy, S.(2005b) Effects of cigarette reduction on cardiovascular risk factors andsubjective measures. Chest 128: 2528-2537.
Hatsukami, D. K., Benowitz, N. L., Rennard, S. I., Oncken, C. & Hecht, S. S.(2006a) Biomarkers to assess the utility of potential reduced exposuretobacco products. Nicotine Tob Res 8: 600-622.
Hatsukami, D. K., Le, C. T., Zhang, Y., Josesph, A. M., Mooney, M. E.,Carmella, S. G. & Hecht, S. S. (2006b) Toxicant exposure in cigarette reducersversus light smokers. Cancer Epidemiol Biomarkers Prev 15: 2355-2358.
Health Canada & Losos, J. Z. (1998) Information Letter: Proposed Tobacco(Reporting) Regulations. Available at http://legacy.library.ucsf.edu/tid/lux68c00. Accessed 1-31-2006.
Health Canada. (2000a) Canada Government Tobacco Act: Tobacco ReportingRegulations. SOR/200-273. Registration June 26, 2000. Part 3 Emissionsfrom designated tobacco products. Available at http://www.hc-sc.gc.ca/hl-vs/pubs/tobac-tabac/tir-rft/emissions_e.html. Accessed 12-22-2005a.
Health Canada. (2000b) Tobacco reporting regulations. Canada Gazette 134.
Hecht, S. S., Schmeltz, I. & Hoffmann, D. (1977) Nitrogenous compounds incigarette smoke and their possible precursors. Rec Adv Tob Sci 3: 59-93.
Literature Citations 115
For internal use of Philip Morris personnel only.
Hecht, S. S. & Hoffmann, D. (1988) Tobacco-specific nitrosamines, animportant group of carcinogens in tobacco and tobacco smoke.Carcinogenesis 9: 875-884.
Hecht, S. S. & Hoffmann, D. (1989) The relevance of tobacco-specificnitrosamines to human cancer. Cancer Surv 8: 273-294.
Hecht, S. S., Kagan, S. S., Kagan, M. & Carmella, S. G. (1991) Quantificationof 4-hydroxy-1-(3-pyridyl)-1-butanone released from human haemoglobinas a dosimeter for exposure to tobacco-specific nitrosamines. IARC Sci Publ105: 113-118.
Hecht, S. S., Carmella, S. G., Murphy, S. E., Akerkar, S., Brunnemann, K. D.& Hoffmann, D. (1993) A tobacco-specific lung carcinogen in the urine ofmen exposed to cigarette smoke. N Engl J Med 329: 1543-1546.
Hecht, S. S. (1998) Biochemistry, biology, and carcinogenicity of tobacco-specific N-nitrosamines. Chem Res Toxicol 11: 559-603.
Hecht, S. S., Carmella, S. G., Chen, M., Dor Koch, J. F., Miller, A. T., Murphy,S. E., Jensen, J. A., Zimmerman, C. L. & Hatsukami, D. K. (1999) Quantitationof urinary metabolites of a tobacco-specific lung carcinogen after smokingcessation. Cancer Res 59: 590-596.
Hecht, S. S., Ye, M., Carmella, S. G., Fredrickson, A., Adgate, J. L., Greaves,I. A., Church, T. R., Ryan, A. D., Mongin, S. J. & Sexton, K. (2001) Metabolitesof a tobacco-specific lung carcinogen in the urine of elementary school-aged children. Cancer Epidemiol Biomarkers Prev 10: 1109-1116.
Hecht, S. S. (2002) Human urinary carcinogen metabolites: biomarkers forinvestigating tobacco and cancer. Carcinogenesis 23: 907-922.
Hecht, S. S., Carmella, S. G., Ye, M., Le, K. A., Jensen, J. A., Zimmerman,C. L. & Hatsukami, D. K. (2002) Quantitation of metabolites of4-(methylnitrosamino)-1-(3-pyridyl)-1-butanone after cessation of smokelesstobacco use. Cancer Res 62: 129-134.
Hecht, S. S. (2004) Carcinogen derived biomarkers: applications in studiesof human exposure to secondhand tobacco smoke. Tob Control 13 Suppl1: i48-i56.
Hecht, S. S., Carmella, S. G., Le, K. A., Murphy, S. E., Li, Y. S., Le, C., Jensen, J.& Hatsukami, D. K. (2004a) Effects of reduced cigarette smoking on levels of1-hydroxypyrene in urine. Cancer Epidemiol Biomarkers Prev 13: 834-842.

116 Exposure Assessment
For internal use of Philip Morris personnel only.
Hecht, S. S., Murphy, S. E., Carmella, S. G., Zimmerman, C. L., Losey, L.,Kramarczuk, I., Roe, M. R., Puumala, S. S., Li, Y. S., Le, C., Jensen, J. &Hatsukami, D. K. (2004b) Effects of reduced cigarette smoking on the uptakeof a tobacco-specific lung carcinogen. J Natl Cancer Inst 96: 107-115.
Hecht, S. S., Murphy, S. E., Carmella, S. G., Li, S., Jensen, J., Le, C., Joseph,A. M. & Hatsukami, D. K. (2005) Similar uptake of lung carcinogens bysmokers of regular, light, and ultralight cigarettes. Cancer EpidemiolBiomarkers Prev 14: 693-698.
Heikkila, P., Luotamo, M., Pyy, L. & Riihimaki, V. (1995) Urinary 1-naphtholand 1-pyrenol as indicators of exposure to coal tar products. Int Arch OccupEnviron Health 67: 211-217.
Heinrich-Ramm, R., Wegner, R., Garde, A. H. & Baur, X. (2002) Cotinineexcretion (tobacco smoke biomarker) of smokers and non-smokers:comparison of GC/MS and RIA results. Int J Hyg Environ Health 205:493-499.
Henningfield, J. E., Stapleton, J. M., Benowitz, N. L., Grayson, R. F. & London,E. D. (1993) Higher levels of nicotine in arterial than in venous blood aftercigarette smoking. Drug Alcohol Depend 33: 23-29.
Heudorf, U. & Angerer, J. (2001) Urinary monohydroxylated phenanthrenesand hydroxypyrene-the effects of smoking habits and changes induced bysmoking on monooxygenase-mediated metabolism. Int Arch Occup EnvironHealth 74: 177-183.
Higuchi, M. A., Sagartz, J., Shreve, W. K. & Ayres, P. H. (2004) Comparativesubchronic inhalation study of smoke from the 1R4F and 2R4F referencecigarettes. Inhal Toxicol 16: 1-20.
Hoepfner, I., Dettbarn, G., Scherer, G., Grimmer, G. & Adlkofer, F. (1987)Hydroxy-phenanthrenes in the urine of non-smokers and smokers. ToxicolLett 35: 67-71.
Hoffmann, D. & Brunnemann, K. D. (1983) Endogenous formation ofN-nitrosoproline in cigarette smokers. Cancer Res 43: 5570-5574.
Hoffmann, D., Brunnemann, K. D., Prokopczyk, B. & Djordjevic, M. V. (1994)Tobacco-specific N-nitrosamines and Areca-derived N-nitrosamines:chemistry, biochemistry, carcinogenicity, and relevance to humans. J ToxicolEnviron Health 41: 1-52.

Literature Citations 117
For internal use of Philip Morris personnel only.
Hoffmann, D., Djordjevic, M. V., Fan, J., Zang, E., Glynn, T. & Connolly, G. N.(1995) Five leading U.S. commercial brands of moist snuff in 1994:Assessment of carcinogenic N-nitrosamines. J Natl Cancer Inst 87:1862-1869.
Hoffmann, D. & Hoffmann, I. (1997) The changing cigarette, 1950-1995.J Toxicol Environ Health 50: 307-364.
Hoffmann, D. & Hoffmann, I. (1998) Tobacco smoke components. BeitrTabakforsch Int 18: 49-52.
Hoffmann, D. & Hoffmann, I. (2001) The changing cigarette: chemical studiesand bioassays. In: Risks Associated with Smoking Cigarettes with LowMachine-Measured Yields of Tar and Nicotine. Smoking and Tobacco Control.Monograph No. 13. (Burns, D. M., Benowitz, N. L. & Amacher, R. H., eds.)Bethesda, MD: National Institutes of Health, National Cancer Institute, NIHPub. No. 02-5074, pp. 159-192.
Hoffmann, D., Hoffmann, I. & El-Bayoumy, K. (2001) The less harmfulcigarette: A controversial issue. A tribute to Ernst L. Wynder. Chem ResToxicol 14: 767-790.
Hölzle, D., Schlöbe, D., Tricker, A. R. & Richter, E. (2007) Mass spectrometricanalysis of 4-hydroxy-1-(3-pyridyl)-1-butanone-releasing DNA adducts inhuman lung. Toxicology 232: 277-285.
Horvath, I., Hunt, J. & Barnes, P. J. (2005) Exhaled breath condensate:methodological recommendations and unresolved questions. Eur Respir J26: 523-548.
Houeto, P., Hoffman, J. R., Got, P., Dang, V. B. & Baud, F. J. (1997)Acetonitrile as a possible marker of current cigarette smoking. Hum ExpToxicol 16: 658-661.
Hsu, T.-M., Zhang, Y. J. & Santella, R. M. (1997) Immunoperoxidasequantitation of 4-aminobiphenyl- and polycyclic aromatic hydrocarbon-DNAadducts in exfoliated oral and urothelial cells of smokers and nonsmokers.Cancer Epidemiol Biomarkers Prev 6: 193-199.
Hughes, J. R. & Keely, J. P. (2004) The effect of a novel smoking system—Accord—on ongoing smoking and toxin exposure. Nicotine Tob Res6: 1021-1027.

118 Exposure Assessment
For internal use of Philip Morris personnel only.
Hughes, J. R., Hecht, S. S., Carmella, S. G., Murphy, S. E. & Callas, P. (2004)Smoking behaviour and toxin exposure during six weeks use of a potentialreduced exposure product: Omni. Tob Control 13: 175-179.
Hurt, R. D., Croghan, G. A., Wolter, T. D., Croghan, I. T., Offord, K. P., Williams,G. M., Djordjevic, M. V., Richie, Jr., J. P. & Jeffrey, A. M. (2000) Does smokingreduction result in reduction of biomarkers associated with harm? A pilotstudy using a nicotine inhaler. Nicotine Tob Res 2: 327-336.
Inoue, O., Seiji, K., Nakatsuka, H., Watanabe, T., Yin, S., Li, G. L., Cai,S. X., Jin, C. & Ikeda, M. (1989) Excretion of 1,2,4-benzenetriol in the urineof workers exposed to benzene. Br J Ind Med 46: 559-565.
Institute of Medicine. (2001) Clearing the Smoke. Assessing the ScienceBase for Tobacco Harm Reduction. (Stratton, K., Shetty, P., Wallace,R. & Bondurant, S., eds.) Washington, DC: National Academy Press.
International Agency for Research on Cancer. (1983) Polynuclear AromaticCompounds, Part 1: Chemical, Environmental and Experimental Data. IARCMonographs on the Evaluation of the Carcinogenic Risk of Chemicals toHumans 32. Lyon, France: IARC.
International Agency for Research on Cancer. (1993) Cadmium andcadmium compounds. In: Beryllium, Cadmium, Mercury, and Exposures inthe Glass Manufacturing Industry. IARC Monographs on the Evaluation ofthe Carcinogenic Risk of Chemicals to Humans. Lyon, France: IARC,pp. 119-237.
International Agency for Research on Cancer. (1994) Acrylamide. IARCMonographs on the Evaluation of the Carcinogenic Risk of Chemicals toHumans. 60 Lyon, France: IARC, pp. 389-433.
International Agency for Research on Cancer. (1995) IARC - Summariesand evaluations: Furfural (Group 3). Available at http://www.inchem.org/documents/iarc/vol63/furfural.html. Accessed 2-15-2005.
International Agency for Research on Cancer. (1999) 1,3-butadiene. In:Re-evaluation of some organic chemicals, hydrazine and hydrogen peroxide(part one). IARC monographs on the evaluation of the carcinogenic risk ofchemicals to humans. Lyon, France: IARC, pp. 109-225.
International Agency for Research on Cancer. (2007) Overall evaluations ofcarcinogenicity to humans. Available at http://monographs.iarc.fr/ENG/Classification/crthgr01.php. Accessed 1-5-2007.

Literature Citations 119
For internal use of Philip Morris personnel only.
International Conference on Harmonisation. (1996) ICH Harmonised TripartiteGuidelines: Validation of analytical procedures: methodology Q2B. Availableat http://www.bcg-usa.com/docs/ich/ICHQ2B.pdf. Accessed 8-5-2005.
International Organization for Standardization (1995) Cigarettes—Determination of carbon monoxide in the vapour phase of cigarette smoke—NDIR method. ISO 8454:1995. Geneva: ISO.
International Organization for Standardization (1999) Cigarettes—Determination of water in smoke condensates—Part 1: Gas-chromatographicmethod. ISO 10362-1:1999. Geneva: ISO.
International Organization for Standardization (2000a) Cigarettes—Determination of total and nicotine-free dry particulate matter using a routineanalytical smoking machine. ISO 4387:2000(E). Geneva: ISO.
International Organization for Standardization (2000b) Cigarettes—Determination of nicotine in smoke condensates—Gas-chromatographicmethod. ISO 10315:2000. Geneva: ISO.
International Organization for Standardization (2000c) Routine AnalyticalCigarette-Smoking Machine—Definitions and Standard Conditions. ISO3308:2000. Geneva: ISO, pp. 1-30
Jacob, J., Grimmer, G., Raab, G. & Schmoldt, A. (1982) The metabolism ofpyrene by rat liver microsomes and the influence of various mono-oxygenaseinducers. Xenobiotica 12: 45-53.
Jacob, J., Grimmer, G. & Dettbarn, G. (1999) Profile of urinary phenanthrenemetabolites in smokers and non-smokers. Biomarkers 4: 319-327.
Jacob, J. & Seidel, A. (2002) Biomonitoring of polycyclic aromatichydrocarbons in human urine. J Chromatogr B Analyt Technol Biomed LifeSci 778: 31-47.
Jacob, III, P., Yu, L., Liang, G., Shulgin, A. T. & Benowitz, N. L. (1993) Gaschromatographic-mass spectrometric method for determination of anabasine,anatabine and other tobacco alkaloids in urine of smokers and smokelesstobacco users. J. Chromatogr. 619: 49-61.
Jacob, III, P., Yu, L., Shulgin, A. T. & Benowitz, N. L. (1999) Minor tobaccoalkaloids as biomarkers for tobacco use: comparison of users of cigarettes,smokeless tobacco, cigars, and pipes. Am J Public Health 89: 731-736.

120 Exposure Assessment
For internal use of Philip Morris personnel only.
Jacob, III, P., Hatsukami, D., Severson, H., Hall, S., Yu, L. & Benowitz, N. L.(2002) Anabasine and anatabine as biomarkers for tobacco use during nicotinereplacement therapy. Cancer Epidemiol Biomarkers Prev 11: 1668-1673.
James, H., Tizabi, Y. & Taylor, R. (1998) Rapid method for the simultaneousmeasurement of nicotine and cotinine in urine and serum by gaschromatography-mass spectrometry. J Chromatogr B Biomed Sci Appl 708:87-93.
Jansen, E. H. J. M., Schenk, E., den Engelsman, G. & van de Werken, G.(1995) Use of biomarkers in exposure assessment of polycyclic aromatichydrocarbons. Clin Chem 41: 1905-1906.
Järup, L., Rogenfelt, A., Elinder, C. G., Nogawa, K. & Kjellstrom, T. (1983)Biological half-time of cadmium in the blood of workers after cessation ofexposure. Scand J Work Environ Health 9: 327-331.
Järup, L., Berglund, M., Elinder, C. G., Nordberg, G. & Vahter, M. (1998)Health effects of cadmium exposure—a review of the literature and a riskestimate. Scand J Work Environ Health 24 Suppl 1: 1-51.
Järup, L. (2003) Hazards of heavy metal contamination. Br Med Bull68: 167-182.
Jarvis, M., Tunstall-Pedoe, H., Feyerabend, C., Vesey, C. & Salloojee, Y. (1984)Biochemical markers of smoke absorption and self reported exposure topassive smoking. J Epidemiol Community Health 38: 335-339.
Jarvis, M. J., Primatesta, P., Erens, B., Feyerabend, C. & Bryant, A. (2003)Measuring nicotine intake in population surveys: comparability of salivacotinine and plasma cotinine estimates. Nicotine Tob Res 5: 349-355.
Jenkins, R. A., Maskarinec, M. P., Counts, R. W., Caton, J. E., Tomkins, B. A.& Ilgner, R. H. (2001) Environmental tobacco smoke in an unrestrictedsmoking workplace: area and personal exposure monitoring. J Expo AnalEnviron Epidemiol 11: 369-380.
Johnson, W. R., Hale, R. W., Nedlock, J. W., Grubbs, H. J. & Powell, D. H.(1973) The distribution of products between mainstream and sidestreamsmoke. Tob Sci 17: 141-144.

Literature Citations 121
For internal use of Philip Morris personnel only.
Jongeneelen, F. J. (2001) Benchmark guideline for urinary 1-hydroxypyreneas biomarker of occupational exposure to polycyclic aromatic hydrocarbons.Ann Occup Hyg 45: 3-13.
Jordan, A., Hansel, A., Holzinger, R. & Lindinger, W. (1995) Acetonitrile andbenzene in the breath of smokers and non-smokers investigated by protontransfer reaction mass spectrometry (PTR-MS). Int J Mass Spectrometryand Ion Processes 148: L1-L3.
Jorgensen, E. D., Dozmorov, I., Frank, M. B., Centola, M. & Albino, A. P.(2004) Global gene expression analysis of human bronchial epithelial cellstreated with tobacco condensates. Cell Cycle 3: 1154-1168.
Joseph, A. M., Hecht, S. S., Murphy, S. E., Carmella, S. G., Le, C. T., Zhang, Y.,Han, S. & Hatsukami, D. K. (2005) Relationships between cigaretteconsumption and biomarkers of tobacco toxin exposure. Cancer EpidemiolBiomarkers Prev 14: 2963-2968.
Junge, B. (1985) Changes in serum thiocyanate concentration on stoppingsmoking. BMJ (Clin Res Ed) 291: 22.
Kado, N. Y., Manson, C., Eisenstadt, E. & Hsieh, D. P. (1985) The kineticsof mutagen excretion in the urine of cigarette smokers. Mutat Res157: 227-233.
Kaye, C. M. (1973) Biosynthesis of mercapturic acids from allyl alcohol, allylesters and acrolein. Biochem J 134: 1093-1101.
Kim, H., Kim, Y. D., Lee, H., Kawamoto, T., Yang, M. & Katoh, T. (1999) Assayof 2-naphthol in human urine by high-performance liquid chromatography. JChromatogr B Biomed Sci Appl 734: 211-217.
Kivistö, H., Pekari, K., Peltonen, K., Svinhufvud, J., Veidebaum, T., Sorsa,M. & Aitio, A. (1997) Biological monitoring of exposure to benzene in theproduction of benzene and in a cokery. Sci Total Environ 199: 49-63.
Klus, H. & Kuhn, H. (1975) Chromatographic evidence for N-nitrosamines oftobacco alkaloids [English translation]. J Chromatogr 109: 425-426.
Knight, T. M., Leach, S., Forman, D., Vindigni, C., Packer, P., Venitt, S., Minacci,C., Lorenzini, L., Tosi, P., Frosini, G., Marini, M. & Carnicelli, N. (1991)N-nitrosoproline excretion in the presence and absence of gastric disease.Eur J Cancer 27: 456-461.

122 Exposure Assessment
For internal use of Philip Morris personnel only.
Kopplin, A., Eberle-Adamkiewicz, G., Glusenkamp, K. H., Nehls, P. & Kirstein,U. (1995) Urinary excretion of 3-methyladenine and 3-ethyladenine aftercontrolled exposure to tobacco smoke. Carcinogenesis 16: 2637-2641.
Kozlowski, L. T., Heatherton, T. F., Frecker, R. C. & Nolte, H. E. (1989) Self-selected blocking of vents on low-yield cigarettes. Pharmacol Biochem Behav33: 815-819.
Kozlowski, L. T., Sweeney, C. T. & Pillitteri, J. L. (1996) Blocking cigarettefilter vents with lips more than doubles carbon monoxide intake from ultra-low tar cigarettes. Exp Clin Psychopharmacol 4: 404-408.
Kozlowski, L. T. & O’Connor, R. J. (2000) Official cigarette tar tests aremisleading: use a two-stage, compensating test. Lancet 355: 2159-2161.
Kozlowski, L. T. & O’Connor, R. J. (2002) Cigarette filter ventilation is adefective design because of misleading taste, bigger puffs, and blocked vents.Tob Control 11 Suppl 1: I40-I50.
Kozlowski, L. T. & O’Connor, R. J. (2004) Dealing with health fears: cigaretteadvertising in the United States in the twentieth century. In: Tobacco and PublicHealth: Science and Policy. (Boyle, P., Gray, N., Henningfield, J., Seffrin, J. &Zatonski, W., eds.) Oxford, UK: Oxford University Press, pp. 37-50.
Kriek, E., Rojas, M., Alexandrov, K. & Bartsch, H. (1998) Polycyclic aromatichydrocarbon-DNA adducts in humans: relevance as biomarkers for exposureand cancer risk. Mutat Res 400: 215-231.
Ladd, K. F., Newmark, H. L. & Archer, M. C. (1984) N-nitrosation of proline insmokers and nonsmokers. J Natl Cancer Inst 73: 83-87.
LaVoie, E. J. & Rice, J. E. (1988) Structure-activity relationships amongtricyclic polynuclear aromatic hydrocarbons. In: Polycyclic AromaticHydrocarbon Carcinogenesis: Structure-Activity Relationships. Boca Raton,FL: CRC Press, pp. 151-175.
Lee, B. L., Ong, H. Y., Ong, Y. B. & Ong, C. N. (2005) A sensitive liquidchromatographic method for the spectrophotometric determination of urinarytrans,trans-muconic acid. J Chromatogr B Analyt Technol Biomed Life Sci818: 277-283.
Lee, E. M., Malson, J. L., Waters, A. J., Moolchan, E. T. & Pickworth, W. B.(2003) Smoking topography: reliability and validity in dependent smokers.Nicotine Tob Res 5: 673-679.

Literature Citations 123
For internal use of Philip Morris personnel only.
Lee, E. M., Malson, J. L., Moolchan, E. T. & Pickworth, W. B. (2004)Quantitative comparisons between a nicotine delivery device (Eclipse) andconventional cigarette smoking. Nicotine Tob Res 6: 95-102.
Lee, P. & Sanders, E. (2004) Does increased cigarette consumption nullifyany reduction in lung cancer risk associated with low-tar filter cigarettes?Inhal Toxicol 16: 817-833.
Leone, A. (2005) Biochemical markers of cardiovascular damage fromtobacco smoke. Curr Pharm Des 11: 2199-2208.
Leuchtenberger, C. & Leuchtenberger, R. (1971) Effect of fresh cigarettesmoke on the development of lung tumors and on lung tissue cultures inSnell mice. Schweiz Med Wochenschr 101: 1374-1381.
Levin, J. O. (1995) First international workshop on hydroxypyrene as abiomarker for PAH exposure in man — summary and conclusions. Sci TotalEnviron 163: 165-168.
Li, H., Krieger, R. I. & Li, Q. X. (2000) Improved HPLC method for analysis of1-hydroxypyrene in human urine specimens of cigarette smokers. Sci TotalEnviron 257: 147-153.
Life Sciences Research Office. (2007a) Biological Effects Assessment inthe Evaluation of Potential Reduced-Risk Tobacco Products. (Brownawell,A. B., ed.) Bethesda, MD: Life Sciences Research Office.
Life Sciences Research Office. (2007b) Scientific Methods to EvaluatePotential Reduced-Risk Tobacco Products. (St.Hilaire, C. L., ed.) Bethesda,MD: Life Sciences Research Office.
Lindinger, W., Hansel, A. & Jordan, A. (1998) On-line monitoring of volatileorganic compounds at ppbv levels by means of proton-transfer-reaction massspectrometry (PTR-MS) medical applications, food control and environmentalresearch. Int J Mass Spectrom ION Processes 173: 191-241.
Linhart, I., Frantik, E., Vodickova, L., Vosmanska, M., Smejkal, J. & Mitera, J.(1996) Biotransformation of acrolein in rat: excretion of mercapturicacids after inhalation and intraperitoneal injection. Toxicol Appl Pharmacol136: 155-160.

124 Exposure Assessment
For internal use of Philip Morris personnel only.
Lintelmann, J., Hellemann, C. & Kettrup, A. (1994) Coupled-column high-performance liquid chromatographic method for the determination offour metabolites of polycyclic aromatic hydrocarbons, 1-, 4- and 9-hydroxy-phenanthrene and 1-hydroxypyrene, in urine. J Chromatogr B Biomed Appl660: 67-73.
Lirk, P., Bodrogi, F., Deibl, M., Kahler, C. M., Colvin, J., Moser, B., Pinggera,G., Raifer, H., Rieder, J. & Schobersberger, W. (2004) Quantification of recentsmoking behaviour using proton transfer reaction-mass spectrometry (PTR-MS). Wien Klin Wochenschr 116: 21-25.
Lodovici, M., Akpan, V., Giovannini, L., Migliani, F. & Dolara, P. (1998)Benzo[a]pyrene diol-epoxide DNA adducts and levels of polycyclic aromatichydrocarbons in autoptic samples from human lungs. Chem Biol Interact116: 199-212.
Loft, S., Vistisen, K., Ewertz, M., Tjonneland, A., Overvad, K. & Poulsen, H.E. (1992) Oxidative DNA damage estimated by 8-hydroxydeoxyguanosineexcretion in humans: influence of smoking, gender and body mass index.Carcinogenesis 13: 2241-2247.
Maclure, M., Bryant, M. S., Skipper, P. L. & Tannenbaum, S. R. (1990) Declineof the hemoglobin adduct of 4-aminobiphenyl during withdrawal from smoking.Cancer Res 50: 181-184.
Malaveille, C., Vineis, P., Esteve, J., Ohshima, H., Brun, G., Hautefeuille, A.,Gallet, P., Ronco, G., Terracini, B. & Bartsch, H. (1989) Levels of mutagensin the urine of smokers of black and blond tobacco correlate with their risk ofbladder cancer. Carcinogenesis 10: 577-586.
Mannschreck, C., Gündel, J. & Angerer, J. (1996) Occupational exposure toPAHs—biological monitoring of hycroxylated metabolites. Polycycl AromatComp 11: 11-18.
Martin, F., Hoepfner, I., Scherer, G., Adlkofer, F., Dettbarn, G. & Grimmer, G.(1989) Urinary excretion of hydroxy-phenanthrenes after intake of polycyclicaromatic hydrocarbons. Environmental International 15: 41-47.
Mascher, D. G., Mascher, H. J., Scherer, G. & Schmid, E. R. (2001) High-performance liquid chromatographic-tandem mass spectrometricdetermination of 3-hydroxypropylmercapturic acid in human urine. JChromatogr B Biomed Sci Appl 750: 163-169.

Literature Citations 125
For internal use of Philip Morris personnel only.
Massachusetts Department of Public Health. (2001) Massachusetts TobaccoControl Program. 105 CMR 655.000: Testing and reporting constituents ofcigarette smoke. Available at http://www.state.ma.us/dph/mtcp. Accessed3-13-2002.
Massachusetts Department of Public Health. (2005) 105 CMR 660.000:Cigarette and Smokeless Tobacco Products: Reports of Added Constituentsand Nicotine Ratings. Available at http://www.mass.gov/dph/mtcp/legal/ingreg.htm. Accessed 10-28-2005.
McCarthy, W. J., Caskey, N. H. & Jarvik, M. E. (1992) Ethnic differences innicotine exposure. Am J Public Health 82: 1171-1173.
McKee, H. C., Rhoades, J. W., Campbell, J. & Gross, A. L. (1962) Acetonitrilein body fluids related to smoking. Public Health Rep 77: 553-554.
Meckley, D., Hayes, J. R., Van Kampen, K. R., Mosberg, A. T. & Swauger, J. E.(2004) A responsive, sensitive, and reproducible dermal tumor promotionassay for the comparative evaluation of cigarette smoke condensates. RegulToxicol Pharmacol 39: 135-149.
Meger, M., Meger-Kossien, I., Dietrich, M., Tricker, A. R., Scherer, G. &Adlkofer, F. (1996) Metabolites of 4-(N-methylnitrosamino)-1-(3-pyridyl)-1-butanone in urine of smokers. Eur J Cancer Prev 5 Suppl 1: 121-124.
Meger, M., Meger-Kossien, I., Riedel, K. & Scherer, G. (2000) Biomonitoringof environmental tobacco smoke (ETS)-related exposure to4-(methylnitrosamino)-1- (3-pyridyl) -1-butanone (NNK). Biomarkers 5: 33-45.
Meger, M., Meger-Kossien, I., Schuler-Metz, A., Janket, D. & Scherer, G.(2002) Simultaneous determination of nicotine and eight nicotine metabolitesin urine of smokers using liquid chromatography-tandem mass spectrometry.J Chromatogr B Analyt Technol Biomed Life Sci 778: 251-261.
Melikian, A. A., Prahalad, A. K. & Hoffmann, D. (1993) Urinary trans,trans-muconic acid as an indicator of exposure to benzene in cigarette smokers.Cancer Epidemiol Biomarkers Prev 2: 47-51.
Melikian, A. A., Sun, P., Pierpont, C., Coleman, S. & Hecht, S. S. (1997) Gaschromatographic-mass spectrometric determination of benzo[a]pyrene andchrysene diol epoxide globin adducts in humans. Cancer EpidemiolBiomarkers Prev 6: 833-839.

126 Exposure Assessment
For internal use of Philip Morris personnel only.
Melikian, A. A., Sun, P., Prokopczyk, B., el Bayoumy, K., Hoffmann, D., Wang, X.& Waggoner, S. (1999) Identification of benzo[a]pyrene metabolites in cervicalmucus and DNA adducts in cervical tissues in humans by gaschromatography-mass spectrometry. Cancer Lett 146: 127-134.
Melikian, A. A., Qu, Q., Shore, R., Li, G., Li, H., Jin, X., Cohen, B., Chen, L.,Li, Y., Yin, S., Mu, R., Zhang, X. & Wang, Y. (2002) Personal exposure todifferent levels of benzene and its relationships to the urinary metabolites S-phenylmercapturic acid and trans,trans-muconic acid. J Chromatogr B AnalytTechnol Biomed Life Sci 778: 211-221.
Melikian, A. A., Hosey, J., Zhang, J., Colosimo, S., Zang, E., Hoffmann, D.,Varga, M., Jaffe, J. H. & Barr, W. H. (2003) Reduction of urinary metabolitesof tobacco carcinogens in smokers who switched from conventional lightcigarettes to a new cigarette with low levels of tobacco-specific nitrosaminesand a modified filter tip. Proc. Amer Assoc Cancer Res 44 (2nd ed.): R1283.
Melikian, A. A., Djordjevic, M. V., Hosey, J., Zhang, J., Chen, S., Muscat, J.E., Zang, E., Stellman, S. D. & Richie, Jr., J. P. (2004) Influence of gender ondelivered toxins from cigarete smoke metabolism. Proceedings of the 10thAnnual Meeting of the Society for Research on Nicotine and Tobacco.
Melikian, A. A., Djordjevic, M. V., Chen, S., Richie, Jr., J. & Stellman, S. D.(2007a) Effect of delivered dosage of cigarette smoke toxins on the levels ofurinary biomarkers of exposure. Cancer Epidemiol Biomarkers Prev 16: 1408-1415.
Melikian, A. A., Djordjevic, M. V., Hosey, J., Zhang, J., Chen, S., Zang, E.,Muscat, J. & Stellman, S. D. (2007b) Gender differences relative to smokingbehavior and emissions of toxins from mainstream cigarette smoke. NicotineTob Res 9: 377-387.
Merlo, F., Andreassen, A., Weston, A., Pan, C. F., Haugen, A., Valerio, F.,Reggiardo, G., Fontana, V., Garte, S., Puntoni, R. & Abbondandolo, A. (1998)Urinary excretion of 1-hydroxypyrene as a marker for exposure to urban airlevels of polycyclic aromatic hydrocarbons. Cancer Epidemiol BiomarkersPrev 7: 147-155.
Michaelis, H. C., Clemens, C., Kijewski, H., Neurath, H. & Eggert, A. (1991)Acetonitrile serum concentrations and cyanide blood levels in a case ofsuicidal oral acetonitrile ingestion. J Toxicol Clin Toxicol 29: 447-458.

Literature Citations 127
For internal use of Philip Morris personnel only.
Mitschke, S., Adam, T., Streibel, T., Baker, R. R. & Zimmermann, R. (2005)Application of time-of-flight mass spectrometry with laser-basedphotoionization methods for time-resolved on-line analysis of mainstreamcigarette smoke. Anal Chem 77: 2288-2296.
Mohtashamipur, E., Norpoth, K. & Lieder, F. (1985) Isolation of frameshiftmutagens from smokers’ urine: experiences with three concentrationmethods. Carcinogenesis 6: 783-788.
Molander, L., Hansson, A., Lunell, E., Alainentalo, L., Hoffmann, M. & Larsson, R.(2000) Pharmacokinetics of nicotine in kidney failure. Clin Pharmacol Ther68: 250-260.
Mollerup, S., Ryberg, D., Hewer, A., Phillips, D. H. & Haugen, A. (1999) Sexdifferences in lung CYP1A1 expression and DNA adduct levels among lungcancer patients. Cancer Res 59: 3317-3320.
Montuschi, P. & Barnes, P. J. (2002) Analysis of exhaled breath condensatefor monitoring airway inflammation. Trends Pharmacol Sci 23: 232-237.
Mooney, L. A., Santella, R. M., Covey, L., Jeffrey, A. M., Bigbee, W., Randall,M. C., Cooper, T. B., Ottman, R., Tsai, W. Y. & Wazneh, L. (1995) Decline ofDNA damage and other biomarkers in peripheral blood following smokingcessation. Cancer Epidemiol Biomarkers Prev 4: 627-634.
Morrow, J. D. (2005) Quantification of isoprostanes as indices of oxidantstress and the risk of atherosclerosis in humans. Arterioscler Thromb VascBiol 25: 279-286.
Mure, K., Hayatsu, H., Takeuchi, T., Takeshita, T. & Morimoto, K. (1997)Heavy cigarette smokers show higher mutagenicity in urine. Mutat Res373: 107-111.
Murphy, S. E., Link, C. A., Jensen, J., Le, C., Puumala, S. S., Hecht, S. S.,Carmella, S. G., Losey, L. & Hatsukami, D. K. (2004) A comparison of urinarybiomarkers of tobacco and carcinogen exposure in smokers. CancerEpidemiol Biomarkers Prev 13: 1617-1623.
Muscat, J. E., Djordjevic, M. V., Colosimo, S., Stellman, S. D. & Richie, Jr., J. P.(2005) Racial differences in exposure and glucuronidation of the tobacco-specific carcinogen 4-(methylnitrosamino)-1-(3-pyridyl)-1-butanone (NNK).Cancer 103: 1420-1426.

128 Exposure Assessment
For internal use of Philip Morris personnel only.
Mustonen, R. & Hemminki, K. (1992) 7-Methylguanine levels in DNA ofsmokers’ and non-smokers’ total white blood cells, granulocytes andlymphocytes. Carcinogenesis 13: 1951-1955.
Mustonen, R., Schoket, B. & Hemminki, K. (1993) Smoking-related DNAadducts: 32P-postlabeling analysis of 7-methylguanine in human bronchialand lymphocyte DNA. Carcinogenesis 14: 151-154.
Mutlu, G. M., Garey, K. W., Robbins, R. A., Danziger, L. H. & Rubinstein, I.(2001) Collection and analysis of exhaled breath condensate in humans.Am J Respir Crit Care Med 164: 731-737.
Nagao, M., Honda, M., Seino, Y., Yahagi, T. & Kawachi, T. (1977a)Mutagenicities of protein pyrolysates. Cancer Lett 2: 335-339.
Nagao, M., Honda, M., Seino, Y., Yahagi, T. & Sugimura, T. (1977b)Mutagenicities of smoke condensates and the charred surface of fish andmeat. Cancer Lett 2: 221-226.
Nair, J., Ohshima, H., Pignatelli, B., Friesen, M., Malaveille, C., Calmels, S.& Bartsch, H. (1986) Modifiers of endogenous carcinogen formation: studieson in vivo nitrosation in tobacco users. In: Mechanisms in TobaccoCarcinogenesis. (Hoffmann, D. & Harris, C., eds.) Banbury report. Cold SpringHarbor, NY: Cold Spring Harbor Laboratory, pp. 45-61.
Nan, H. M., Kim, H., Lim, H. S., Choi, J. K., Kawamoto, T., Kang, J. W., Lee,C. H., Kim, Y. D. & Kwon, E. H. (2001) Effects of occupation, lifestyle andgenetic polymorphisms of CYP1A1, CYP2E1, GSTM1 and GSTT1 onurinary 1-hydroxypyrene and 2-naphthol concentrations. Carcinogenesis22: 787-793.
National Research Council (1983) Risk Assessment in the FederalGovernment: Managing the Process. Washington, DC: National AcademyPress.
National Toxicology Program. (2005) 1,3-Butadiene CAS No. 106-99-0[Report on Carcinogens, 11th edition].Available at http://ntp.niehs.nih.gov/ntp/roc/eleventh/profiles/s025buta.pdf.Accessed 9-1-2005.
Nerurkar, P. V., Okinaka, L., Aoki, C., Seifried, A., Lum-Jones, A., Wilkens, L. R.& Le, M. L. (2000) CYP1A1, GSTM1, and GSTP1 genetic polymorphismsand urinary 1-hydroxypyrene excretion in non-occupationally exposedindividuals. Cancer Epidemiol Biomarkers Prev 9: 1119-1122.

Literature Citations 129
For internal use of Philip Morris personnel only.
Neurath, G. & Ehmke, H. (1964) Apparatus for investigating sidestreamsmoke. Beitr Tabakforsch 2: 177-121.
Nia, A. B., Maas, L. M., Brouwer, E. M., Kleinjans, J. C. & Van Schooten, F. J.(2000a) Comparison between smoking-related DNA adduct analysisin induced sputum and peripheral blood lymphocytes. Carcinogenesis21: 1335-1340.
Nia, A. B., Maas, L. M., Van Breda, S. G., Curfs, D. M., Kleinjans, J. C.,Wouters, E. F. & Van Schooten, F. J. (2000b) Applicability of induced sputumfor molecular dosimetry of exposure to inhalatory carcinogens: 32P-postlabeling of lipophilic DNA adducts in smokers and nonsmokers. CancerEpidemiol Biomarkers Prev 9: 367-372.
Nia, A. B., Van Straaten, H. W., Godschalk, R. W., Van Zandwijk, N.,Balm, A. J., Kleinjans, J. C. & Van Schooten, F. J. (2000c) Immunoperoxidasedetection of polycyclic aromatic hydrocarbon-DNA adducts in mouth floorand buccal mucosa cells of smokers and nonsmokers. Environ Mol Mutagen36: 127-133.
Nia, A. B., Van Schooten, F. J., Schilderman, P. A. E. L., De Kok, T. M. C. M.,Haenen, G. R., Van Herwijnen, M. H. M., Van Agen, E., Pachen, D. & Kleinjans,J. C. S. (2001) A multi-biomarker approach to study the effects of smokingon oxidative DNA damage and repair and antioxidative defense mechanisms.Carcinogenesis 21: 395-401.
Ohshima, H., O’Neill, I. K., Friesen, M., Bereziat, J. C. & Bartsch, H. (1984)Occurrence in human urine of new sulphur-containing N-nitrosamino acidsN-nitrosothiazolidine 4-carboxylic acid and its 2-methyl derivative, and theirformation. J Cancer Res Clin Oncol 108: 121-128.
Ong, C. N., Lee, B. L., Shi, C. Y., Ong, H. Y. & Lee, H. P. (1994) Elevatedlevels of benzene-related compounds in the urine of cigarette smokers. Int JCancer 59: 177-180.
Ong, C. N., Kok, P. W., Lee, B. L., Shi, C. Y., Ong, H. Y., Chia, K. S., Lee, C. S.& Luo, X. W. (1995) Evaluation of biomarkers for occupational exposure tobenzene. Occup Environ Med 52: 528-533.
Ong, C. N., Kok, P. W., Ong, H. Y., Shi, C. Y., Lee, B. L., Phoon, W. H. &Tan, K. T. (1996) Biomarkers of exposure to low concentrations of benzene:a field assessment. Occup Environ Med 53: 328-333.

130 Exposure Assessment
For internal use of Philip Morris personnel only.
Osterman-Golkar, S. M., MacNeela, J. P., Turner, M. J., Walker, V. E.,Swenberg, J. A., Sumner, S. J., Youtsey, N. & Fennell, T. R. (1994) Monitoringexposure to acrylonitrile using adducts with N-terminal valine in hemoglobin.Carcinogenesis 15: 2701-2707.
Palmeri, A., Pichini, S., Pacifici, R., Zuccaro, P. & Lopez, A. (2000) Drugs innails: physiology, pharmacokinetics and forensic toxicology. ClinPharmacokinet 38: 95-110.
Parsons, W. D., Carmella, S. G., Akerkar, S., Bonilla, L. E. & Hecht, S. S.(1998) A metabolite of the tobacco-specific lung carcinogen 4-(methylnitrosamino)-1-(3-pyridyl)-1-butanone in the urine of hospital workersexposed to environmental tobacco smoke. Cancer Epidemiol BiomarkersPrev 7: 257-260.
Pastorelli, R., Restano, J., Guanci, M., Maramonte, M., Magagnotti, C.,Allevi, R., Lauri, D., Fanelli, R. & Airoldi, L. (1996) Hemoglobin adducts ofbenzo[a]pyrene diolepoxide in newspaper vendors: association with trafficexhaust. Carcinogenesis 17: 2389-2394.
Pastorelli, R., Guanci, M., Cerri, A., Negri, E., La Vecchia, C., Fumagalli,F., Mezzetti, M., Cappelli, R., Panigalli, T., Fanelli, R. & Airoldi, L. (1998)Impact of inherited polymorphisms in glutathione S-transferase M1,microsomal epoxide hydrolase, cytochrome P450 enzymes on DNA, andblood protein adducts of benzo(a)pyrene-diolepoxide. Cancer EpidemiolBiomarkers Prev 7: 703-709.
Pastorelli, R., Guanci, M., Restano, J., Berri, A., Micoli, G., Minoia, C., Alcini,D., Carrer, P., Negri, E., La Vecchia, C., Fanelli, R. & Airoldi, L. (1999) Seasonaleffect on airborne pyrene, urinary 1-hydroxypyrene, and benzo(a)pyrene diolepoxide-hemoglobin adducts in the general population. Cancer EpidemiolBiomarkers Prev 8: 561-565.
Patrianakos, C. & Hoffmann, D. (1979) Chemical studies on tobacco smokeLXIV. On the analysis of aromatic amines in cigarette smoke. J Anal Toxicol3: 150-154.
Patterson, F., Benowitz, N., Shields, P., Kaufmann, V., Jepson, C., Wileyto, P.,Kucharski, S. & Lerman, C. (2003) Individual differences in nicotine intakeper cigarette. Cancer Epidemiol Biomarkers Prev 12: 468-471.

Literature Citations 131
For internal use of Philip Morris personnel only.
Pavanello, S., Simioli, P., Carrieri, M., Gregorio, P. & Clonfero, E. (2002a)Tobacco-smoke exposure indicators and urinary mutagenicity. Mutat Res521: 1-9.
Pavanello, S., Simioli, P., Lupi, S., Gregorio, P. & Clonfero, E. (2002b) Exposurelevels and cytochrome P450 1A2 activity, but not N-acetyltransferase,glutathione S-transferase (GST) M1 and T1, influence urinary mutagenexcretion in smokers. Cancer Epidemiol Biomarkers Prev 11: 998-1003.
Peach, H., Hayward, D. M., Ellard, D. R., Morris, R. W. & Shah, D. (1986)Phlegm production and lung function among cigarette smokers changingtar groups during the 1970s. J Epidemiol Community Health 40: 110-116.
Perbellini, L., Brugnone, F. & Faggionato, G. (1981) Urinary excretion of themetabolites of n-hexane and its isomers during occupational exposure. Br JInd Med 38: 20-26.
Perbellini, L., Pasini, F., Romani, S., Princivalle, A. & Brugnone, F. (2002)Analysis of benzene, toluene, ethylbenzene and m-xylene in biologicalsamples from the general population. J Chromatogr B Analyt Technol BiomedLife Sci 778: 199-210.
Perbellini, L., Princivalle, A., Cerpelloni, M., Pasini, F. & Brugnone, F. (2003)Comparison of breath, blood and urine concentrations in the biomonitoringof environmental exposure to 1,3-butadiene, 2,5-dimethylfuran, and benzene.Int Arch Occup Environ Health 76: 461-466.
Perera, F. P., Santella, R. M., Brenner, D., Poirier, M. C., Munshi, A. A.,Fischman, H. K. & Van Ryzin, J. (1987) DNA adducts, protein adducts, andsister chromatid exchange in cigarette smokers and nonsmokers. J NatlCancer Inst 79: 449-456.
Pérez, H. L., Segerback, D. & Osterman-Golkar, S. (1999) Adducts ofacrylonitrile with hemoglobin in nonsmokers and in participants in a smokingcessation program. Chem Res Toxicol 12: 869-873.
Peto, R., Darby, S., Deo, H., Silcocks, P., Whitley, E. & Doll, R. (2000) Smoking,smoking cessation, and lung cancer in the UK since 1950: combination ofnational statistics with two case-control studies. BMJ 321: 323-329.
Pettigrew, A. R. & Fell, G. S. (1972) Simplified colorimetric determination ofthiocyanate in biological fluids, and its application to investigation of thetoxic amblyopias. Clin Chem 18: 996-1000.

132 Exposure Assessment
For internal use of Philip Morris personnel only.
Philip Morris USA (2001) The Time is Right for Accord package insert.
Phillips, D. H. (2002) Smoking-related DNA and protein adducts in humantissues. Carcinogenesis 23: 1979-2004.
Pilger, A. & Rüdiger, H. W. (2006) 8-Hydroxy-2′-deoxyguanosine as a markerof oxidative DNA damage related to occupational and environmentalexposures. Int Arch Occup Environ Health 80: 1-15.
Pilz, H., Oguogho, A., Chehne, F., Lupattelli, G., Palumbo, B. & Sinzinger, H.(2000) Quitting cigarette smoking results in a fast improvement of in vivooxidation injury (determined via plasma, serum and urinary isoprostane).Thromb Res 99: 209-221.
Pinggera, G. M., Lirk, P., Bodogri, F., Herwig, R., Steckel-Berger, G., Bartsch,G. & Rieder, J. (2005) Urinary acetonitrile concentrations correlate with recentsmoking behaviour. BJU Int 95: 306-309.
Pottenger, L. H., Penman, M., Moorec, N. P., Pristone, R. A. J. & Thomas, M.(2004) Biological significance of DNA adducts: summary of discussion ofexpert panel. Regul Toxicol Pharmacol 39: 403-408.
Pourcelot, S., Faure, H., Firoozi, F., Ducros, V., Tripier, M., Hee, J., Cadet, J.& Favier, A. (1999) Urinary 8-oxo-7,8-dihydro-2′-deoxyguanosine and 5-(hydroxymethyl) uracil in smokers. Free Radic Res 30: 173-180.
Prevost, V., Shuker, D. E., Bartsch, H., Pastorelli, R., Stillwell, W. G., Trudel,L. J. & Tannenbaum, S. R. (1990) The determination of urinary 3-methyladenine by immunoaffinity chromatography-monoclonal antibody-based ELISA: use in human biomonitoring studies. Carcinogenesis 11: 1747-1751.
Prevost, V. & Shuker, D. E. G. (1996) Cigarette smoking and urinary 3-alkyladenine excretion in man. Chem Res Toxicol 9: 439-444.
Proctor, C. J., Martin, C., Beven, J. L. & Dymond, H. F. (1988) Evaluation ofan apparatus designed for the collection of sidestream tobacco smoke.Analyst 113: 1509-1513.
Prue, D. M., Martin, J. E., Hume, A. S. & Davis, N. S. (1981) The reliability ofthiocyanate measurement of smoking exposure. Addict Behav 6: 99-105.

Literature Citations 133
For internal use of Philip Morris personnel only.
Purkis, S. W., Hill, C. A. & Bailey, I. A. (2003) Current measurement reliabilityof selected smoke analytes. Beitr Tabakforsch Int 20: 314-324.
R.J. Reynolds Tobacco Company. (2006) Eclipse. Why there’s no cigarettelike Eclipse. Available at http://www.Eclipse.RJRT.com. Accessed 4-17-2006.
Rannug, A., Olsson, M., Aringer, L. & Brunius, G. (1988) An improvedstandardized procedure for urine mutagenicity testing. IARC Sci Publ 89:396-400.
Reilly, M., Delanty, N., Lawson, J. A. & Fitzgerald, G. A. (1996) Modulation ofoxidant stress in vivo in chronic cigarette smokers. Circulation 94: 19-25.
Richardson, K. A., Megens, H. J., Webb, J. D. & van Sittert, N. J. (1996)Biological monitoring of butadiene exposure by measurement of haemoglobinadducts. Toxicology 113: 112-118.
Richie, Jr., J. P., Carmella, S. G., Muscat, J. E., Scott, D. G., Akerkar, S. A. &Hecht, S. S. (1997) Differences in the urinary metabolites of the tobacco-specific lung carcinogen 4-(methylnitrosamino)-1-(3-pyridyl)-1-butanone inblack and white smokers. Cancer Epidemiol Biomarkers Prev 6: 783-790.
Richter, E., Branner, B., Kutzer, C., Donhart, A. M. E., Scherer, G., Tricker, A.R. & Heller, W.-D. (1995) Comparison of biomarkers for exposure toenvironmental tobacco smoke: cotinine and haemoglobin adducts fromaromatic amines and tobacco-specific nitrosamines in pregant smoking andnonsmoking women. In: Proceedings of Healthy Buildings ’95, AnInternational Conference on Healthy Buildings in Mild Climate. (Maroni, M.,ed.) Milano, Italy: Healthy Buildings ’95, pp. 599-604.
Richter, E. & Branner, B. (2002) Biomonitoring of exposure to aromaticamines: haemoglobin adducts in humans. J Chromatogr B Analyt TechnolBiomed Life Sci 778: 49-62.
Rickert, W. S. & Wright, W. (2002) The stability of yields of Canadian mandatedanalytes from the Kentucky reference cigarette 1R4F: a time series analysis.Paper presented at CORESTA Congress, New Orleans, USA. Programmeand Abstracts Booklet, no. ST26. CORESTA Programme and AbstractsBooklet.
Ridker, P. M., Brown, N. J., Vaughan, D. E., Harrison, D. G. & Mehta, J. L.(2004) Established and emerging plasma biomarkers in the prediction offirst atherothrombotic events. Circulation 109: IV6-19.

134 Exposure Assessment
For internal use of Philip Morris personnel only.
Riffelmann, M., Muller, G., Schmieding, W., Popp, W. & Norpoth, K. (1995)Biomonitoring of urinary aromatic amines and arylamine hemoglobin adductsin exposed workers and nonexposed control persons. Int Arch Occup EnvironHealth 68: 36-43.
Robinson, J. C., Young, J. C., Rickert, W. S., Fey, G. & Kozlowski, L. T. (1983)A comparative study of the amount of smoke absorbed from low yield (‘lesshazardous’) cigarettes. Part 2: Invasive measures. Br J Addict 78: 79-87.
Rodgman, A. & Green, C. R. (2002) Toxic chemicals in cigarette mainstreamsmoke — Hazard and hoopla. In: Cigarette Risk and the Potential for RiskReduction. Invited Speaker Symposium Proceedings. CORESTA NewOrleans, LA. September 22-27, 2002. CORESTA, pp. 2-52.
Roethig, H. J., Kinser, R. D., Lau, R. W., Walk, R. A. & Wang, N. (2005)Short-term exposure evaluation of adult smokers switching from conventionalto first-generation electrically heated cigarettes during controlled smoking.J Clin Pharmacol 45: 133-145.
Romano, G., Sgambato, A., Boninsegna, A., Flamini, G., Curigliano, G.,Yang, Q., La, G., V, Signorelli, C., Ferro, A., Capelli, G., Santella, R. M. &Cittadini, A. (1999) Evaluation of polycyclic aromatic hydrocarbon-DNAadducts in exfoliated oral cells by an immunohistochemical assay. CancerEpidemiol Biomarkers Prev 8: 91-96.
Rose, J. E. (2006) Nicotine and nonnicotine factors in cigarette addiction.Psychopharmacology (Berl) 184: 274-285.
Rossi, A. M., Guarnieri, C., Rovesti, S., Gobba, F., Ghittori, S., Vivoli, G. &Barale, R. (1999) Genetic polymorphisms influence variability in benzenemetabolism in humans. Pharmacogenetics 9: 445-451.
Ryberg, D., Hewer, A., Phillips, D. H. & Haugen, A. (1994) Differentsusceptibility to smoking-induced DNA damage among male and femalelung cancer patients. Cancer Res 54: 5801-5803.
Saitoh, F., Noma, M. & Kawashima, N. (1985) The alkaloid contents of sixtyNicotiana species. Phytochemistry 24: 477-480.
Sakuma, H., Kusama, M., Munakatu, S., Ohsumi, T. & Sugawara, S. (1983)The distribution of cigarette smoke components between mainstream andsidestream smoke I. Acidic components. Beitr Tabakforsch Int 12: 63-71.

Literature Citations 135
For internal use of Philip Morris personnel only.
Sanduja, R., Ansari, G. A. & Boor, P. J. (1989) 3-Hydroxypropylmercapturicacid: a biologic marker of exposure to allylic and related compounds. J ApplToxicol 9: 235-238.
Satarug, S., Ujjin, P., Vanavanitkun, Y., Nishijo, M., Baker, J. R. & Moore, M.R. (2004) Effects of cigarette smoking and exposure to cadmium and leadon phenotypic variability of hepatic CYP2A6 and renal function biomarkersin men. Toxicology 204: 161-173.
Scheideler, L., Manke, H. G., Schwulera, U., Inacker, O. & Hämmerle, H.(1993) Detection of nonvolatile macromolecules in breath. A possiblediagnostic tool? Am Rev Respir Dis 148: 778-784.
Scherer, G., Conze, C., von Meyerinck, L., Sorsa, M. & Adlkofer, F. (1990)Importance of exposure to gaseous and particulate phase components oftobacco smoke in active and passive smokers. Int Arch Occup Environ Health62: 459-466.
Scherer, G., Conze, C., Tricker, A. R. & Adlkofer, F. (1992) Uptake of tobaccosmoke constituents on exposure to environmental tobacco smoke (ETS).Clin Invest 70: 352-367.
Scherer, G., Doolittle, D. J., Ruppert, T., Meger-Kossien, I., Riedel, K.,Tricker, A. R. & Adlkofer, F. (1996) Urinary mutagenicity and thioethers innonsmokers: role of environmental tobacco smoke (ETS) and diet. MutatRes 368: 195-204.
Scherer, G., Renner, T. & Meger, M. (1998) Analysis and evaluation oftrans,trans-muconic acid as a biomarker for benzene exposure. J ChromatogrB Biomed Sci Appl 717: 179-199.
Scherer, G., Frank, S., Riedel, K., Meger-Kossien, I. & Renner, T. (2000)Biomonitoring of exposure to polycyclic aromatic hydrocarbons ofnonoccupationally exposed persons. Cancer Epidemiol Biomarkers Prev 9:373-380.
Scherer, G., Urban, M. & Meger, M. (2001) Biological monitoring of thetobacco smoke-related exposure to alkylating agents. Proc Am Assoc CancerRes 42: 150.
Scherer, G. (2005) Biomonitoring of inhaled complex mixtures—ambient air,diesel exhaust and cigarette smoke. Exp Toxicol Pathol 57 Suppl 1: 75-110.

136 Exposure Assessment
For internal use of Philip Morris personnel only.
Schettgen, T., Broding, H. C., Angerer, J. & Drexler, H. (2002) Hemoglobinadducts of ethylene oxide, propylene oxide, acrylonitrile and acrylamide-biomarkers in occupational and environmental medicine. Toxicol Lett 134:65-70.
Schettgen, T., Weiss, T., Drexler, H. & Angerer, J. (2003) A first approach toestimate the internal exposure to acrylamide in smoking and non-smokingadults from Germany. Int J Hyg Environ Health 206: 9-14.
Schleshinger, R. B. (1995) Deposition and clearance of inhaled particles. In:Concepts in Inhalation Toxicology. 2nd ed. (McClellan, R. O. & Henderson,R. F., eds.) Washington, D.C.: Taylor & Francis, pp. 191-224.
Schmeltz, I. & Hoffmann, D. (1977) Nitrogen-containing compounds intobacco and tobacco smoke. Chem Rev 77: 295-311.
Schneider, N. G., Jacob, III, P., Nilsson, F., Leischow, S. J., Benowitz, N. L. &Olmstead, R. E. (1997) Saliva cotinine levels as a function of collectionmethod. Addiction 92: 347-351.
Schoket, B., Phillips, D. H., Kostic, S. & Vincze, I. (1998) Smoking-associatedbulky DNA adducts in bronchial tissue related to CYP1A1 MspI and GSTM1genotypes in lung patients. Carcinogenesis 19: 841-846.
Serdar, B., Waidyanatha, S., Zheng, Y. & Rappaport, S. M. (2003)Simultaneous determination of urinary 1- and 2-naphthols, 3- and 9-phenanthrols, and 1-pyrenol in coke oven workers. Biomarkers 8: 93-109.
Shah, V., Sridhar, S., Beane, J., Brody, J. S. & Spira, A. (2005) SIEGE:Smoking induced epithelial gene expression database. Nucleic Acids Res33: D573-D579.
Sherson, D., Sabro, P., Sigsgaard, T., Johansen, F. & Autrup, H. (1990)Biological monitoring of foundry workers exposed to polycyclic aromatichydrocarbons. Br J Ind Med 47: 448-453.
Shi, Q., Nelson, D. D., McManus, J. B., Zahniser, M. S., Parrish, M. E.,Baren, R. E., Shafer, K. H. & Harward, C. N. (2003) Quantum cascadeinfrared laser spectroscopy for real-time cigarette smoke analysis. AnalChem 75: 5180-5190.

Literature Citations 137
For internal use of Philip Morris personnel only.
Simon, P., Lafontaine, M., Delsaut, P., Morele, Y. & Nicot, T. (2000) Tracedetermination of urinary 3-hydroxybenzo[a]pyrene by automated column-switching high-performance liquid chromatography. J Chromatogr B BiomedSci Appl 748: 337-348.
Simon-Hettich, B., Rothfuss, A. & Steger-Hartmann, T. (2006) Use ofcomputer-assisted prediction of toxic effects of chemical substances.Toxicology 224: 156-162.
Skipper, P. L. & Tannenbaum, S. R. (1994) Molecular dosimetry of aromaticamines in human populations. Environ Health Perspect 102 Suppl 6: 17-21.
Smith, C. J., McKarns, S. C., Davis, R. A., Livingston, S. D., Bombick, B. R.,Avalos, J. T., Morgan, W. T. & Doolittle, D. J. (1996) Human urine mutagenicitystudy comparing cigarettes which burn or primarily heat tobacco. Mutat Res361: 1-9.
Smith, C. J., Livingston, S. D. & Doolittle, D. J. (1997) An international literaturesurvey of “IARC Group I Carcinogens” reported in mainstream cigarettesmoke. Food Chem Toxicol 35: 1107-1130.
Smith, C. J., Guy, T. D., Stiles, M. F., Morton, M. J., Collie, B. B., Ingebrethsen,B. J. & Robinson, J. H. (1998) A repeatable method for determination ofcarboxyhemoglobin levels in smokers. Hum Exp Toxicol 17: 29-34.
Smith, C. J., Bombick, D. W., Ryan, B. A., Morgan, W. T. & Doolittle, D. J.(2000a) Urinary mutagenicity in nonsmokers following exposure to freshdiluted sidestream cigarette smoke. Mutat Res 470: 53-70.
Smith, C. J., Perfetti, T. A., Rumple, M. A., Rodgman, A. & Doolittle, D. J.(2000c) “IARC group 2A Carcinogens” reported in cigarette mainstreamsmoke. Food Chem Toxicol 38: 371-383.
Smith, C. J., Perfetti, T. A., Rumple, M. A., Rodgman, A. & Doolittle, D. J.(2001) “IARC Group 2B carcinogens” reported in cigarette mainstreamsmoke. Food Chem Toxicol 39: 183-205.
Smith, C. J., Huang, W., Walcott, C. J., Turner, W., Grainger, J. & Patterson,D. G., Jr. (2002) Quantification of monohydroxy-PAH metabolites in urine bysolid-phase extraction with isotope dilution-GC-MS. Anal Bioanal Chem 372:216-220.
138 Exposure Assessment
For internal use of Philip Morris personnel only.
Speck, W. T., Stein, A. B. & Rosenkranz, H. S. (1976) Mutagenicity ofmetronidazole: presence of several active metabolites in human urine. JNatl Cancer Inst 56: 283-284.
Spiegelhalder, B. & Bartsch, H. (1996) Tobacco-specific nitrosamines. Eur JCancer Prev 5 Suppl 1: 33-38.
Spira, A., Beane, J., Shah, V., Liu, G., Schembri, F., Yang, X., Palma, J. &Brody, J. S. (2004a) Effects of cigarette smoke on the human airway epithelialcell transcriptome. Proc Natl Acad Sci USA 101: 10143-10148.
Spira, A., Schembri, F., Beane, J., Shah, V., Liu, G. & Brody, J. S. (2004b)Impact of cigarette smoke on the normal airway transcriptome. Chest 125:115S.
Stabbert, R., Voncken, P., Rustemeier, K., Haussmann, H. J., Roemer, E.,Schaffernicht, H. & Patskan, G. (2003) Toxicological evaluation of anelectrically heated cigarette. Part 2: Chemical composition of mainstreamsmoke. J Appl Toxicol 23: 329-339.
Stampfer, M. J., Hu, F. B., Manson, J. E., Rimm, E. B. & Willett, W. C. (2000)Primary prevention of coronary heart disease in women through diet andlifestyle. N Engl J Med 343: 16-22.
Star Scientific Inc. (1999) StarCure® Technology. Available at http://www.starscientific.com/main_pages/starcure.htm. Accessed 4-27-2006.
Stepanov, I. & Hecht, S. S. (2005) Tobacco-specific nitrosamines and theirpyridine-N-glucuronides in the urine of smokers and smokeless tobaccousers. Cancer Epidemiol Biomarkers Prev 14: 885-891.
Stepanov, I., Feuer, R., Jensen, J., Hatsukami, D. & Hecht, S. S. (2006)Mass spectrometric quantitation of nicotine, cotinine, and 4-(methylnitrosamino)-1-(3-pyridyl)-1-butanol in human toenails. CancerEpidemiol Biomarkers Prev 15: 2378-2383.
Stevens, K. R. & Munoz, L. R. (2004) Cigarette smoking: Evidence to guidemeasurement. Res Nurs Health 27: 281-292.
Stillwell, W. G., Bryant, M. S. & Wishnok, J. S. (1987) GC/MS analysis ofbiologically important aromatic amines. Application to human dosimetry.Biomed Environ Mass Spectrom 14: 221-227.

Literature Citations 139
For internal use of Philip Morris personnel only.
Stookey, G. K., Katz, B. P., Olson, B. L., Drook, C. A. & Cohen, S. J. (1987)Evaluation of biochemical validation measures in determination of smokingstatus. J Dent Res 66: 1597-1601.
Suarez, J. C., Warmath, D. S., Koetz, K. P., Hood, A. F., Thompson, M. L.,Kendal-Reed, M. S., Walker, D. B. & Walker, J. C. (2005) Single-passenvironmental chamber for quantifying human responses to airbornechemicals. Inhal Toxicol 17: 169-175.
Sutherland, G., Russell, M. A., Stapleton, J. A. & Feyerabend, C. (1993)Glycerol particle cigarettes: a less harmful option for chronic smokers. Thorax48: 385-387.
Szyfter, K., Hemminki, K., Szyfter, W., Szmeja, Z., Banaszewski, J. &Pabiszczak, M. (1996) Tobacco smoke-associated N7-alkylguanine in DNAof larynx tissue and leucocytes. Carcinogenesis 17: 501-506.
Tang, D., Santella, R. M., Blackwood, A. M., Young, T.-L., Mayer, J., Jaretzki, A.,Grantham, S., Tsai, W.-Y. & Perera, F. P. (1995) A molecular epidemiologicalcase-control study of lung cancer. Cancer Epidemiol Biomarkers Prev 4:341-346.
Tareke, E., Rydberg, P., Karlsson, P., Eriksson, S. & Törnqvist, M. (2000)Acrylamide: a cooking carcinogen? Chem Res Toxicol 13: 517-522.
Tareke, E., Rydberg, P., Karlsson, P., Eriksson, S. & Törnqvist, M. (2002)Analysis of acrylamide, a carcinogen formed in heated foodstuffs. J AgricFood Chem 50: 4998-5006.
Tas, S., Buchet, J. P. & Lauwerys, R. (1994) Determinants of benzo[a]pyrenediol epoxide adducts to albumin in workers exposed to polycyclic aromatichydrocarbons. Int Arch Occup Environ Health 66: 343-348.
Tavares, R., Borba, H., Monteiro, M., Proenca, M. J., Lynce, N., Rueff, J.,Bailey, E., Sweetman, G. M., Lawrence, R. M. & Farmer, P. B. (1996)Monitoring of exposure to acrylonitrile by determination of N-(2-cyanoethyl)valine at the N-terminal position of haemoglobin. Carcinogenesis17: 2655-2660.
Telisman, S., Jurasovic, J., Pizent, A. & Cvitkovic, P. (1997) Cadmium in theblood and seminal fluid of nonoccupationally exposed adult male subjectswith regard to smoking habits. Int Arch Occup Environ Health 70: 243-248.

140 Exposure Assessment
For internal use of Philip Morris personnel only.
Texas Administrative Code. (1998) Title 25 Part 1 Chapter 101 Tobacco.Available at http://info.sos.state.tx.us. Accessed 12-22-2005.
Thomas, J. L., Ebbert, J. O., Patten, C. A., Dale, L. C., Bronars, C. A. &Schroeder, D. R. (2006) Measuring nicotine dependence among smokelesstobacco users. Addict Behav 31: 1511-1521.
Togores, B., Bosch, M. & Agusti, A. G. (2000) The measurement ofexhaled carbon monoxide is influenced by airflow obstruction. Eur RespirJ 15: 177-180.
Torano, J. S. & van Kan, H. J. (2003) Simultaneous determination of thetobacco smoke uptake parameters nicotine, cotinine and thiocyanate in urine,saliva and hair, using gas chromatography-mass spectrometry forcharacterisation of smoking status of recently exposed subjects. Analyst128: 838-843.
Tricker, A. R., Ditrich, C. & Preussmann, R. (1991) N-nitroso compounds incigarette tobacco and their occurrence in mainstream tobacco smoke.Carcinogenesis 12: 257-261.
Tsai, H. T., Wu, M. T., Hauser, R., Rodrigues, E., Ho, C. K., Liu, C. L. &Christiani, D. C. (2003) Exposure to environmental tobacco smoke andurinary 1-hydroxypyrene levels in preschool children. Kaohsiung. J Med.Sci 19: 97-104.
Tsuda, M., Niitsuma, J., Sato, S., Hirayama, T., Kakizoe, T. & Sugimura, T.(1986) Increase in the levels of N-nitrosoproline, N-nitrosothioproline andN-nitroso-2-methylthioproline in human urine by cigarette smoking. CancerLett. 30: 117-124.
Tulunay, O. E., Hecht, S. S., Carmella, S. G., Zhang, Y., Lemmonds, C.,Murphy, S. & Hatsukami, D. K. (2005) Urinary metabolites of a tobacco-specific lung carcinogen in nonsmoking hospitality workers. Cancer EpidemiolBiomarkers Prev 14: 1283-1286.
U.S. Consumer Product Safety Commission, Lee, B. C., Burns, D. M., Gairola,C. G., Harris, J. E., Hoffman, D., Pillsbury, H. C. & Shopland, D. R., eds.(1993) Toxicity Testing Plan. Volume 5. Washington, DC: U.S. ConsumerProduct Safety Commission, pp. 1-140.

Literature Citations 141
For internal use of Philip Morris personnel only.
U.S. Department of Health, Education, and Welfare. (1964) Smoking andHealth. Report of the Advisory Committee to the Surgeon General of thePublic Health Service. Washington: U.S. Department of Health, Education,and Welfare, Public Health Service, Center for Disease Control. DHEWpublication no. (PHS) 64-1103. Washington, DC: U.S. Government PrintingOffice.
U.S. Department of Health and Human Services. (1988) The HealthConsequences of Smoking. Nicotine Addiction. A Report of the SurgeonGeneral. (Benowitz, N. L., Grunberg, N. E. & Lando, H. A., eds.) Washington,DC: U.S. Government Printing Office.
U.S. Department of Health and Human Services. (2004) The HealthConsequences of Smoking. A Report of the Surgeon General. RockvilleMD: U.S. Department of Health and Human Services, Public Health Service,Office on Smoking and Health.
U.S. Environmental Protection Agency. (1992) Respiratory Health Effects ofPassive Smoking: Lung Cancer and Other Disorders. EPA/600/6-90/006F.Washington, DC: U.S. Environmental Protection Agency, Office of Researchand Development, Office of Health and Environmental Assessment.
U.S. Food and Drug Administration. (2001) Guidance for Industry.Bioanalytical Methods Validation. Available at http://www.fda.gov/cder/guidance/4252fnl.pdf. Accessed 7-13-2005.
Upadhyaya, P., McIntee, E. J., Villalta, P. W. & Hecht, S. S. (2006) Identificationof adducts formed in the reaction of 5′-acetoxy-N′-nitrosonornicotine withdeoxyguanosine and DNA. Chem Res Toxicol 19: 426-435.
Urban, M., Gilch, G., Schepers, G., Van Miert, E. & Scherer, G. (2003)Determination of the major mercapturic acids of 1,3-butadiene in humanand rat urine using liquid chromatography with tandem mass spectrometry.J Chromatogr B Analyt Technol Biomed Life Sci 796: 131-140.
van Doorn, R., Bos, R. P., Leijdekkers, C. M., Wagenaas-Zegers, M. A.,Theuws, J. L. & Henderson, P. T. (1979) Thioether concentration andmutagenicity of urine from cigarette smokers. Int Arch Occup Environ Health43: 159-166.
van Leeuwen, D. M., Gottschalk, R. W., van Herwijnen, M. H., Moonen, E. J.,Kleinjans, J. C. & van Delft, J. H. (2005) Differential gene expression in humanperipheral blood mononuclear cells induced by cigarette smoke and itsconstituents. Toxicol Sci 86: 200-210.

142 Exposure Assessment
For internal use of Philip Morris personnel only.
Van Rooij, J. G., Veeger, M. M., Bodelier-Bade, M. M., Scheepers, P. T. &Jongeneelen, F. J. (1994) Smoking and dietary intake of polycyclic aromatichydrocarbons as sources of interindividual variability in the baseline excretionof 1-hydroxypyrene in urine. Int Arch Occup Environ Health 66: 55-65.
van Sittert, N. J., Megens, H. J., Watson, W. P. & Boogaard, P. J. (2000)Biomarkers of exposure to 1,3-butadiene as a basis for cancer riskassessment. Toxicol Sci 56: 189-202.
van Zeeland, A. A., de Groot, A. J., Hall, J. & Donato, F. (1999) 8-Hydroxydeoxyguanosine in DNA from leukocytes of healthy adults:relationship with cigarette smoking, environmental tobacco smoke, alcoholand coffee consumption. Mutat Res 439: 249-257.
Vector Tobacco Inc. (2001a) Omni™. The first reduced carcinogen cigarette.Available at http://legacy.library.ucsf.edu/tid/zpk07a00. Accessed 4-27-2006.
Vector Tobacco Inc. (2001b) Omni™ advertisement. Available at http://legacy.library.ucsf.edu/tid/zpk07a00. Accessed 4-26-2006.
Vector Tobacco Inc. (2006) Frequently asked questions about Quest®.Available at http://www.vectortobacco.com. Accessed 4-17-2006.
Vineis, P., Caporaso, N., Tannenbaum, S. R., Skipper, P. L., Glogowski, J.,Bartsch, H., Coda, M., Talaska, G. & Kadlubar, F. (1990) Acetylationphenotype, carcinogen-hemoglobin adducts, and cigarette smoking. CancerRes 50: 3002-3004.
Vineis, P., Talaska, G., Malaveille, C., Bartsch, H., Martone, T., Sithisarankul,P. & Strickland, P. (1996) DNA adducts in urothelial cells: relationship withbiomarkers of exposure to arylamines and polycyclic aromatic hydrocarbonsfrom tobacco smoke. Int J Cancer 65: 314-316.
Vogt, T. M., Selvin, S., Widdowson, G. & Hulley, S. B. (1977) Expired aircarbon monoxide and serum thiocyanate as objective measures of cigaretteexposure. Am J Public Health 67: 545-549.
Voncken, P., Gerstenberg, B., Rustemeier, K., Stabbert, R., Patskan, G. &Haussmann, H.-J. (1998) Chemical analysis of selected cigarette mainstreamsmoke constituents for comparative product integrity testing. 52nd TobaccoScience Research Conference, Atlanta, Georgia. Available at http://legacy.library.ucsf.edu/tid/ecr25c00.

Literature Citations 143
For internal use of Philip Morris personnel only.
Waddell, W. J. (2006) Critique of dose response in carcinogenesis. HumExp Toxicol 25: 413-436.
Wald, N. J., Idle, M., Boreham, J. & Bailey, A. (1981) Carbon monoxidein breath in relation to smoking and carboxyhaemoglobin levels. Thorax36: 366-369.
Wallace, L. A. (1989) Major sources of benzene exposure. Environ HealthPerspect 82: 165-169.
Wallace, L. A. & Pellizzari, E. D. (1986) Personal air exposures and breathconcentrations of benzene and other volatile hydrocarbons for smokers andnonsmokers. Toxicol Lett 35: 113-116.
Wallace, L. A., Pellizzari, E. D., Hartwell, T. D., Sparacino, C., Whitmore, R.,Sheldon, L., Zelon, H. & Perritt, R. (1987) The TEAM Study: personalexposures to toxic substances in air, drinking water, and breath of 400residents of New Jersey, North Carolina, and North Dakota. Environ Res 43:290-307.
Wang, T. H., Shanfield, H. & Zlatkis, A. (1983) Analysis of trace volatile organiccompounds in coffee by headspace concentration and gas-chromatography-mass spectrometry. Chromatographia 17: 411-417.
Watanabe, M., Ishidate, M., Jr. & Nohmi, T. (1990) Sensitive method for thedetection of mutagenic nitroarenes and aromatic amines: new derivatives ofSalmonella typhimurium tester strains possessing elevated O-acetyltransferase levels. Mutat Res 234: 337-348.
Watson, C., McCraw, J., Polzin, G. & Ashley, D. (2004) Development of amethod to assess cigarette smoke intake. Environ Sci Technol 38: 248-253.
Watts, R. R., Langone, J. J., Knight, G. J. & Lewtas, J. (1990) Cotinineanalytical workshop report: consideration of analytical methods fordetermining cotinine in human body fluids as a measure of passive exposureto tobacco smoke. Environ Health Perspect 84: 173-182.
Westley, J. (1973) Rhodanese. Adv Enzymol Relat Areas Mol Biol 39: 327-368.
Westley, J. (1987) Thiocyanate and thiosulfate. Methods Enzymol 143: 22-25.
Weston, A. & Bowman, E. D. (1991) Fluorescence detection ofbenzo[a]pyrene—DNA adducts in human lung. Carcinogenesis 12: 1445-1449.
144 Exposure Assessment
For internal use of Philip Morris personnel only.
Weston, A., Bowman, E. D., Carr, P., Rothman, N. & Strickland, P. T. (1993)Detection of metabolites of polycyclic aromatic hydrocarbons in human urine.Carcinogenesis 14: 1053-1055.
Weuffen, W., Franzke, C. & Thurkow, B. (1984) The alimentary ingestion,analysis and biological significance of thiocyanate. Nahrung 28: 341-355.
WHO Study Group on Tobacco Product Regulation (TobReg) (2004)Recommendation 1: Guiding Principles for the Development of TobaccoProduct Research and Testing Capacity and Proposed Protocols for theInitiation of Tobacco Product Testing. Geneva: WHO, pp. 1-31.
Wilp, J., Zwickenpflug, W. & Richter, E. (2002) Nitrosation of dietary myosmineas risk factor of human cancer. Food Chem Toxicol 40: 1223-1228.
Witschi, H., Espiritu, I., Maronpot, R. R., Pinkerton, K. E. & Jones, A. D.(1997) The carcinogenic potential of the gas phase of environmental tobaccosmoke. Carcinogenesis 18: 2035-2042.
Witschi, H. (2005) Carcinogenic activity of cigarette smoke gas phase andits modulation by Beta-carotene and N-acetylcysteine. Toxicol Sci 84: 81-87.
Witschi, H. (2006) Tobacco smoking. In: Toxicology of the Lung. 4th ed.(Gardner, D. E., ed.) Boca Raton, FL: CRC Press, pp. 623-648.
World Health Organization (1986) IARC Monographs on the Evaluation ofthe Carcinogenic Risk of Chemicals to Humans. Tobacco Smoking. Volume38. Lyons, Switzerland: IARC.
World Health Organization. (2000) Environmental health criteria 214.Available at http://www.nutrition.org/cgi/reprint/132/8/2283. Accessed 7-13-2005.
World Health Organization. (2003a) IPCS Environmental Health CriteriaSeries: No. 213 Carbon Monoxide (2nd ed.) Available at http://www.who.int/pcs/ehc/summaries/ehc_213.html. Accessed 12-16-2003.
World Health Organization. (2003b) WHO Scientific Advisory Committee onTobacco Product Regulation (SACTob). Statement of principles. Guiding theevaluation of new or modified tobacco products. Available at http://www5.who.int/tobacco/repository/stp82/modified-en.pdf. Accessed 5-14-2003.

Literature Citations 145
For internal use of Philip Morris personnel only.
World Health Organization (2004) IARC Monograph on the Evaluation ofCarcinogenic Risks to Humans. Volume 83. Tobacco Smoke and InvoluntarySmoking. Lyon, France: IARC.
Wynder, E. L. & Graham, E. A. (1950) Tobacco smoking as a possible etiologicfactor in bronchiogenic carcinoma. JAMA 143: 329-336.
Wynder, E. L., Graham, E. A. & Croninger, A. B. (1953) Experimentalproduction of carcinoma with cigarette tar. Cancer Res 13: 855-864.
Wynder, E. L., Kopf, P. & Ziegler, H. (1957) A study of tobacco carcinogenesis.II. Dose-response studies. Cancer 10: 1193-1200.
Xu, X., Iba, M. M. & Weisel, C. P. (2004) Simultaneous and sensitivemeasurement of anabasine, nicotine, and nicotine metabolites in humanurine by liquid chromatography/tandem mass spectrometry. Clin Chem 50:2323-2330.
Yamasaki, E. & Ames, B. N. (1977) Concentration of mutagens from urine byabsorption with the nonpolar resin XAD-2: cigarette smokers have mutagenicurine. Proc Natl Acad Sci USA 74: 3555-3559.
Yang, M., Koga, M., Katoh, T. & Kawamoto, T. (1999) A study for the properapplication of urinary naphthols, new biomarkers for airborne polycyclicaromatic hydrocarbons. Arch Environ Contam Toxicol 36: 99-108.
Yoneda, K., Peck, K., Chang, M. M., Chmiel, K., Sher, Y. P., Chen, J.,Yang, P. C., Chen, Y. & Wu, R. (2001) Development of high-density DNAmicroarray membrane for profiling smoke- and hydrogen peroxide-inducedgenes in a human bronchial epithelial cell line. Am J Respir Crit CareMed 164: S85-S89.
Yu, M. C., Skipper, P. L., Taghizadeh, K., Tannenbaum, S. R., Chan, K. K.,Henderson, B. E. & Ross, R. K. (1994) Acetylator phenotype, aminobiphenyl-hemoglobin adduct levels, and bladder cancer risk in white, black, and Asianmen in Los Angeles, California. J Natl Cancer Inst 86: 712-716.
Zacny, J. P., Stitzer, M. L. & Yingling, J. E. (1986) Cigarette filter vent blocking:effects on smoking topography and carbon monoxide exposure. PharmacolBiochem Behav 25: 1245-1252.
146 Exposure Assessment
For internal use of Philip Morris personnel only.
Zacny, J. P., Stitzer, M. L., Brown, F. J., Yingling, J. E. & Griffiths, R. R. (1987)Human cigarette smoking: effects of puff and inhalation parameters on smokeexposure. J Pharmacol Exp Ther 240: 554-564.
Zenzes, M. T., Bielecki, R. & Reed, T. E. (1999) Detection of benzo(a)pyrenediol epoxide-DNA adducts in sperm of men exposed to cigarette smoke.Fertil Steril 72: 330-335.
Zwickenpflug, W. (2000) N-Nitrosation of myosmine yields HPB (4-hydroxy-1-(3-pyridyl)-1-butanone) and NNN (N-nitrosonornicotine). J Agric. FoodChem 48: 392-394.
Zwingmann, I. H., Welle, I. J., Engelen, J. J., Schilderman, P. A., de Jong, J.M. & Kleinjans, J. C. (1999) Analysis of oxidative DNA damage and HPRTmutant frequencies in cancer patients before and after radiotherapy. MutatRes 431: 361-369.

For internal use of Philip Morris personnel only.
VIVI.A THE LIFE SCIENCES RESEARCH OFFICE
VI.A.1 Exposure Assessment Committee
Richard N. Dalby, Ph.D.
Richard Dalby is a professor in the Department of Pharmaceutical Sciencesat the University of Maryland, School of Pharmacy. He holds a Bachelor ofPharmacy degree (1983) from Nottingham University in England, and a Ph.D.in pharmaceutical sciences from the University of Kentucky (1988). Dr. Dalby’saerosol research, which encompasses novel pulmonary and nasalformulation development, device design, and product testing, is founded onhis Ph.D. work on sustained-release metered-dose inhalers, and industrialexperience as a Formulation Scientist with Fisons (now Aventis). He haspublished more than 40 papers and 90 abstracts related to aerosoltechnology, authored several book chapters, and spoken at many nationaland international meetings. He holds 3 patents concerned with novel metered-dose inhaler formulations, is a reviewer for many international journals, andis a frequent consultant to industry and the FDA. Dr. Dalby is the director ofthe Inhalation Aerosol Technology Workshop that is taught annually inBaltimore and at company facilities worldwide and is co-organizer and editorof Respiratory Drug Delivery, and its spin-off, RDD Europe. Dr. Dalby is aDean’s Distinguished Educator at the University of Maryland School ofPharmacy and a Fellow of the American Association of PharmaceuticalScientists.
Karl-Olav Fagerström, Ph.D.
Karl-Olav Fagerström graduated from the University of Uppsala as a licensedclinical psychologist in 1975. At that time, he started to operate a smokingcessation clinic. In 1981, he earned his Ph.D.; his dissertation examinednicotine dependence and smoking cessation. In the late 1970s and early1980s, he served as Editor-in-Chief of the Scandinavian Journal for BehaviourTherapy. From 1983 through 1997, he worked for Pharmacia & Upjohn asDirector of Scientific Information for Nicotine Replacement Products. He hascontributed to nicotine replacement therapy developments such as nicotinegum, patch, spray, and inhaler. He currently works in private practice
APPENDICES

148 Exposure Assessment
For internal use of Philip Morris personnel only.
(Fagerström Consulting and the Smokers Information Center). He is afounding member of the Society for Research on Nicotine and Tobacco(SRNT). He started the European affiliate in 1999 and served as presidentuntil 2003. In 2003, he was elected president of SRNT. His main researchcontributions have been in the fields of behavior medicine, tobacco, andnicotine, with more than 125 peer-reviewed publications (of which he is thefirst author of 80). His current research interest relates to reducing harmand exposure to tobacco toxins in those who cannot stop smoking. He hasdeveloped a scale for nicotine dependence (Fagerström Test for NicotineDependence) and was awarded the WHO medal in 1999 for outstandingwork in tobacco control.
Jerold Last, Ph.D.
Jerold Last is Professor of Pulmonary/Critical Care Medicine at the Universityof California, Davis, Medical School and Director of the University ofCalifornia, Davis, Fogarty International Center, South America. From 1985to 2004, he was Director of the University of California Systemwide ToxicSubstances Research and Teaching Program. His research interests includeanimal models of asthma and lung fibrosis, inhalation toxicology, andenvironmental toxicology. Dr. Last has edited 6 books, has served on editorialboards of Toxicology and Applied Pharmacology and Experimental LungResearch, and is currently Associate Editor of Toxicology and AppliedPharmacology. He has provided support and expertise to numerousgovernmental committees and agencies on issues related to toxic substancesin the environment. Dr. Last has published more than 190 articles, includinga review of toxic interactions between inorganic gases and particles andstudies of effects of exposure to sidestream and environmental tobaccosmoke.
Robert Orth, Ph.D.
Robert Orth is a physical chemist at Apis Discoveries, L.L.C. He is also aconsultant to the Monsanto Company and Adjunct Associate Professor ofPhysical Chemistry at the University of Missouri, where he teachesundergraduate courses in physical chemistry, instrumental analysis, andgeneral chemistry. He has conducted research in secondary ion massspectrometry and taught at the University of Utah and Montana StateUniversity. Dr. Orth held positions of increasing responsibility during a 16-year career with the Monsanto Company. His work focused on environmentalchemistry and remediation, and in food and agricultural science. His currentwork at Apis Discoveries includes setting up business units for ultratraceanalysis, consulting for companies submitting direct and indirect food

Appendices 149
For internal use of Philip Morris personnel only.
additives to the FDA, and studying analysis and remediation of organicpollutants. He has more than 100 publications and presentations on analyticaland physical chemistry and holds two patents.
Glenn Talaska, Ph.D., C.I.H.
Glenn Talaska is Professor of Environmental Health in the Divisions ofIndustrial and Environmental Hygiene, and Toxicology at the University ofCincinnati and is a Certified Industrial Hygienist. Dr. Talaska received hisPh.D. in genetic toxicology from the University of Texas Medical Branch atGalveston in 1986 and conducted postdoctoral research at the NationalCenter for Toxicological Research in Jefferson, AK from 1986 to 1989. Dr.Talaska has been on the faculty of the University of Cincinnati since 1989.His research is in the field of biological monitoring, with an emphasis oncarcinogen biomarkers, and involves metabolite and DNA adduct analysisand cytogenetics. His research on human subjects includes projectsinvestigating the effects of tobacco smoking on levels of DNA adducts inplacental tissue, the influence of various diets on DNA damage in exfoliatedurothelial cells of smokers, genotoxic exposures in the rubber industry, andthe effect of hair dye use on DNA adduct levels in exfoliated urothelial cells.Dr. Talaska also conducts research on DNA damage in human and animalbreast tissues caused by polycyclic aromatic hydrocarbons (PAHs) and onthe interaction between exposure to arsenic and PAHs. His developmentand use of an exfoliated urothelial cell assay for DNA adduction and damageis one of the few cases where a representative sample of an important targetorgan for environmental carcinogens can be obtained by non-invasive means.Dr. Talaska is Vice-Chair of the Biological Exposures Indices Committee ofthe American Conference of Governmental Hygienists, a member of theAmerican Academy of Industrial Hygiene, and a genetic toxicology consultantto the Occupational and Environmental Epidemiology Branch, Division ofCancer Epidemiology and Genetics, National Cancer Institute. He is amember of the editorial board of the Journal of Environmental andOccupational Health and the International Advisory Board of Yonsei MedicalJournal and is the associate editor of Polycyclic Aromatic Compounds.Dr. Talaska has published 90 articles and 11 book chapters.
William Waddell, M.D.
William Waddell is Emeritus Chairman of Department of Pharmacology andToxicology at University of Louisville. He served on the faculties of theUniversity of North Carolina and University of Kentucky before his tenure atthe University of Louisville, School of Medicine. He is a member of the editorialboard of Human and Experimental Toxicology. Dr. Waddell has authored

150 Exposure Assessment
For internal use of Philip Morris personnel only.
more than 100 peer-reviewed articles, including studies of localization ofnicotine and its metabolites in the mouse and reviews on thresholds ofcarcinogenicity. He has given more than 100 invited lectures around theworld and has served as the chair of national scientific organizations and asa consultant to several drug and chemical companies.
VI.A.2 Reduced-Risk Review Project Core Committee
Alwynelle (Nell) Ahl, Ph.D., D.V.M.
Nell Ahl is Principal Scientist at Highland Rim Research Consulting, Inc.(HRRC). After majoring in biology and mathematics at Centenary College ofLouisiana, she obtained her M.S. and Ph.D. in zoology and biochemistry,respectively from the University of Wyoming, and a doctorate in veterinarymedicine from Michigan State University where she also served as aProfessor in the Department of Natural Science. Before her work at HRRC,Dr. Ahl had a distinguished career at the US Department of Agriculture(USDA) and serving in various capacities, including Deputy Director forAnimal Health Training and Chief of Risk Analysis Systems within USDA’sAnimal and Plant Inspection Service. She also served in the Senior ExecutiveService as the first Director of the USDA Office of Risk Assessment andCost-Benefit Analysis and as a USDA Fellow to the Center for the IntegratedStudy of Food, Animal and Plant Systems at Tuskegee University in Alabama.She is a fellow of the American Association for the Advancement of Scienceand has served on several panels at the National Academy of Sciences. Herresearch interests include public policy for science and veterinary medicineand the use of risk assessment for agricultural issues affecting human health.Dr. Ahl’s presentations and publications total more than 250, and she hasedited reports from more than a dozen symposia.
Elizabeth L. Anderson, Ph.D., Fellow A.T.S.
Elizabeth L. Anderson is Group Vice President of the Health Sciences andFood & Chemicals Division of Exponent, Inc. and has more than 20 years ofexperience, both government and corporate, in health and environmentalsciences. She received her B.S. in chemistry from the College of Williamand Mary, her M.S. in organic chemistry from the University of Virginia, andher Ph.D. from The American University. She formerly served as Presidentand Chief Executive Officer of Sciences International, Inc. and was President,Chief Executive Officer, and Chairman of the Board of Clement InternationalCorporation, where she directed an interdisciplinary group of 200 seniorscientists and engineers. She founded and directed the central riskassessment programs at the US Enivironmental Protection Agency (EPA)

Appendices 151
For internal use of Philip Morris personnel only.
for 10 years. The primary functions of the office were to conduct riskassessments on health effects of a wide variety of toxic chemicals, provideleadership to establish EPA-wide guidelines for risk assessment, and overseeEPA’s risk assessment program. She is the recipient of the EPA Gold Medalfor Exceptional Service. Dr. Anderson is an internationally recognized lecturerand consultant and has published numerous journal articles in areas of riskassessment and carcinogenicity. She is in her sixth year as Editor-in-Chiefof Risk Analysis: an International Journal.
Nancy L. Buc, Esq.
Nancy Buc is a partner at Buc & Beardsley, Washington, DC. She receivedan A.B. from Brown University, an LL.B. from the University of Virginia, andan LL.D. (Honoris Causa) from Brown University. She has taught food anddrug law at Georgetown University Law Center and is a Trustee Emerita ofBrown University. She served as Chief Counsel, FDA, from February 1980to January 1981. She also served as Attorney-Adviser to U.S. Federal TradeCommission (FTC) Chairman Miles W. Kirkpatrick and as Assistant Directorof the FTC Bureau of Consumer Protection (1969-1972). Ms. Buc has servedas a member on various advisory committees and panels to the NationalInstitutes of Health (NIH), Institute of Medicine, and Office of TechnologyAssessment.
Carroll E. Cross, M.D.
Carroll E. Cross is Professor of Medicine and Physiology at the University ofCalifornia, Davis, School of Medicine, where he is an attending physician inPulmonary and Critical Care Medicine. He graduated from Columbia Collegeof Physicians and Surgeons in 1961 and completed his internship at theUniversity of Wisconsin Hospital in 1962, his residency at Stanford HospitalCenter in 1964, and his clinical and research fellowship training at theUniversity of Pittsburgh Medical Center in 1968. He was certified in internalmedicine in 1969 and in pulmonary disease in 1971. Dr. Cross has publishedmore than 200 papers in such fields as air pollutants, antioxidantmicronutrients, inflammatory-immune system oxidants, ozone, nitrogenoxides, cigarette smoke, and related aspects of inhalation toxicology as itrelates to respiratory tract diseases. He is a member of several professionalorganizations including the American Physiological Society, the UKBiochemical Society, the Oxygen Society, the Mount Desert Island BiologicalLaboratory, the Western Society of Physicians, and the American Society forClinical Nutrition. He serves on editorial boards of the American Journal ofClinical Nutrition and Free Radicals in Biology and Medicine and has servedon research review panels for the Veterans Administration, the NIH, EPA,FDA, and for the Heart, Lung, and Cancer Society Associations.

152 Exposure Assessment
For internal use of Philip Morris personnel only.
Louis D. Homer, M.D., Ph.D.
Louis D. Homer is the former Medical Director of Clinical Investigation andBiomedical Research at Legacy Research, Holladay Park Medical Center. Hereceived his Ph.D. in physiology and M.D. from the Medical College of Virginia.He has served as Assistant and Associate Professor at Emory Universityconcentrating on physiological processes and mathematical models; asAssociate Professor at Brown University; and as Research Medical Officer atthe Naval Medical Research Institute concentrating on biometrics, physiology,environmental medicine, metabolic research, and kidney transplanthistocompatibility. He served as a consultant to scientists regularly on topicssuch as physiology, mathematics, statistics, and computer application. Hehas also reviewed proposals and has served on site visit teams for the NationalInstitute of Allergy and Infectious Diseases; National Heart, Lung, and BloodInstitute; National Science Foundation; and Naval Medical Research andDevelopment Command. He has reviewed articles submitted to the Journalof Theoretical Biology, Microvascular Research, American Journal ofPhysiology, and Journal of Applied Physiology. His interest in usingmathematical models of physiology in his research has led him to becomefamiliar with a number of computer languages, numerical algorithms, iterativeleast-square estimation, and iterative maximum likelihood estimation.
Joseph V. Rodricks, Ph.D., D.A.B.T.
Joseph V. Rodricks is a Founder and Principal of ENVIRON Corporationand an internationally recognized expert in the fields of toxicology and riskanalysis. Dr. Rodricks received his B.S. in chemistry from the MassachusettsInstitute of Technology and his M.S. in organic chemistry and Ph.D. inchemistry from the University of Maryland. Dr. Rodricks was formerly theDirector, Life Sciences Division, Clement Associates (1980–1982); the DeputyAssociate Commissioner, Health Affairs; and Toxicologist, FDA (1965–1980);and is a Visiting Professor at the Johns Hopkins University School of PublicHealth. He has published more than 100 peer-reviewed articles and is theauthor of Calculated Risks (Cambridge University Press), a non-technicalintroduction to toxicology and risk analysis.
Richard C. Schwing, Ph.D.
Richard C. Schwing is Founder and President of Sustainable Visions, Inc., afirm devoted to the consumer-driven search for more sustainable productsand lifestyles. Dr. Schwing received his B.S., M.S., and Ph.D. in chemicalengineering from the University of Michigan. Dr. Schwing previously workedat General Motors in research and development. His focus areas includedhighway safety, environmental pollution, and corporate strategy. As a founding

Appendices 153
For internal use of Philip Morris personnel only.
member of GM’s unique-in-industry Societal Analysis Department, hedeveloped groundbreaking approaches to air pollution health effects, riskanalysis, risk trade-offs, human behavior components of risk, and technologyforecasting and societal trends. He has authored several technical papersand co-authored the paper Interdisciplinary Vision: The First 25 Years of theSociety for Risk Analysis (SRA) 1980-2005.
Emanuel Rubin, M.D.
Emanuel Rubin is Gonzalo E. Aponte Distinguished Professor of Pathologyand Chairman Emeritus of the Department of Pathology, Anatomy, and CellBiology at Jefferson Medical College in Philadelphia. He obtained an M.D.from Harvard Medical School. After completing his residency at the Children’sHospital of Philadelphia, he continued as a Dazian Research Fellow inpathology and as Advanced Clinical Fellow of the American Cancer Society,both at Mount Sinai Hospital in New York. After his fellowship, Dr. Rubinspent the next 14 years at Mount Sinai Hospital’s Pathology Service withincreasing responsibilities, culminating in Pathologist-in-Chief. Dr. Rubin thenbecame Director of Laboratories at the Hahnemann University Hospital. Hismany academic appointments include the Irene Heinz and John LaPorteGiven Professor and Chairman of the Department at Mount Sinai School ofMedicine, Professor and Chairman of the Department of Pathology andLaboratory Medicine at the Hahnemann University School of Medicine,Adjunct Professor of Biochemistry and Biophysics at the University ofPennsylvania School of Medicine, and several appointments at JeffersonMedical College, culminating in his current position. Among the honorsreceived, the University of Barcelona and the University of Naples namedhim as Doctor Honoris Causa. He was also given the F.K. MostofiDistinguished Service Award from the U.S.-Canadian Academy of Pathology,and he received the NIH MERIT Award. He has held many editorial positionsand has served as a consultant to many organizations. He has more than300 publications, including 13 textbooks and a CD-ROM.
Richard Windsor, M.S., Ph.D., M.P.H.
Richard Windsor is Professor in the Department of Prevention andCommunity Health in the School of Public Health and Health Services at theGeorge Washington University (GWU) Washington DC, and is a nationallyrecognized expert in public health program evaluation. Dr. Windsor obtaineda B.S. in community health education from Morgan State College in Baltimore;an M.S. and Ph.D. in public health education and educational/socialpsychology from the University of Illinois; and an M.P.H. in maternal andchild health from The Johns Hopkins University. Prior to joining GWU, heheld academic appointments and provided research and management

154 Exposure Assessment
For internal use of Philip Morris personnel only.
leadership at a number of institutions, including Ohio State University,University of Alabama Medical Center, and Johns Hopkins University, andhas served as Associate Director for Prevention at the National Heart, Lung,and Blood Institute. He served as the Principal Investigator of five and Co-Principal Investigator of three NIH-funded randomized clinical trails toevaluate Smoking Cessation or Reduction in Pregnancy Treatment Methods.Dr. Windsor was recognized by the Agency for Healthcare Research andQuality (2000) Tobacco Treatment Clinical Practice Guidelines and receivedthe C. Everett Koop National Health Award (1997) for his scientific leadershipand contributions to the evidence-based treatment for pregnant smokers.
VI.A.3 The Life Sciences Research Office Staff
Michael Falk, Ph.D., is the Director of the Life Sciences Research Office(LSRO). He received his Ph.D. in biochemistry from Cornell University andcompleted postdoctoral training at Harvard Medical School. He was employedin various capacities at the Naval Medical Research Institute, where hesupervised as many as 80 senior-level scientists. As a principal investigatorhe was a key member of the Scientific Advisory Board and the Acting Directorfor the Institute. He was also the Director of the Wound Repair Program andpioneered a new position as the Director of Biochemistry and Cell Biology.Also, as the Director, he rescued the Septic Shock Research Program bycutting inefficiencies and increasing productivity in terms of grant fundingand publication production. He managed peer review and subject reviewpanels in infectious diseases, environmental sciences, military medicine, andother health-related fields. He was a peer reviewer for research proposals forthe National Science Foundation, Medical Research Council of Canada, andOffice of Naval Research. As the Director of the LSRO, Dr. Falk evaluatesbiomedical information and scientific opinion for regulatory and policy makersin both the public and the private sectors. Among his many accomplishments,he has produced seminal white papers on infant nutrition, food labeling, foodsafety, and military dental research and has organized two internationalconferences. Concurrently, he is with MCF Science Consultants and providesanalysis and consultation on emerging technologies. Dr. Falk has publishedmore than 60 research articles, abstracts, technical reports, and presentations.
Robin S. Feldman, B.S., M.B.A., is the LSRO Literature Specialist. She is aseasoned information specialist with experience in the electronic acquisition,analysis, and management of scientific, business, and regulatory information.Ms. Feldman obtained her B.S. from the George Washington University inWashington, DC, with a major in zoology, and her M.B.A. from the Universityof Maryland at College Park, with a concentration in science and technology.She previously worked as a Biomedical Research Assistant at Consultants

Appendices 155
For internal use of Philip Morris personnel only.
in Toxicology, Risk Assessment and Product Safety, where she obtainedand researched scientific literature for private and governmental clients. Atthe National Alliance for the Mentally Ill, she designed and implemented adocument management and retrieval system for the Biological PsychiatryBranch of the National Institute of Mental Health and served as ManagingEditor of Bipolar Network News, a newsletter for the Stanley FoundationBipolar Network. At Howard Hughes Medical Institute (HHMI), she oversawimplementation of the HHMI Predoctoral Fellowship in Biological Sciencesprogram. While serving as Science Information Specialist at the DistilledSpirits Council of the United States, she managed the installation of a localarea network and participated in development and maintenance of anelectronic research database for the beverage alcohol industry. As a ReportCoordinator at Microbiological Associates, Inc., she conducted statisticalanalyses and prepared technical reports about toxicology studies usinganimal models. She served as data management administrator for theNational Toxicology Program’s sponsored studies. Ms. Feldman maintainsLSRO’s library, responds to requests for reports, and assists LSRO’sscientists in discovering, obtaining, compiling, and documenting the scientificliterature required to prepare reports for sponsors.
Karin French, B.S. is a former LSRO Associate Staff Scientist. Ms. Frenchreceived one B.S. degree in animal science and another in cell and molecularbiology and genetics from the University of Maryland at College Park (UMCP).In addition, she earned a College Park “Scholars Certificate in Science,Technology, and Society.” Ms. French worked in the Dairy Nutrition Laboratoryat the university where she assisted Maryland dairy farmers in using milkurea nitrogen (MUN) to evaluate herd protein nutrition. She helped designand complete studies to compare and evaluate the MUN analysis techniquesused in the National Dairy Herd Improvement Association laboratories. Ms.French is pursing doctoral studies at UMCP.
Rebecca Johnson, Ph.D., is the LSRO Assistant Information Specialist. Dr.Johnson received her B.A. from Wesleyan University and her Ph.D. inanthropology with a concentration in archaeology from the University of Iowa.Her dissertation research examined dietary change between two NativeAmerican villages in southeastern Iowa, dated to 1950 and 100 B.P., bylooking at fatty acid residues extracted from pottery. Dr. Johnson hasperformed fieldwork across the Mid-Atlantic and Upper Midwest, as well asin South Carolina, Great Britain, and Poland. Before joining LSRO, Dr.Johnson developed and maintained statewide archaeological databases forIowa’s Office of the State Archaeologist.

156 Exposure Assessment
For internal use of Philip Morris personnel only.
Kara D. Lewis, Ph.D., is a Senior Staff Scientist at LSRO. Dr. Lewis completedpostdoctoral research at Yale University, obtained her Ph.D. in biology, witha concentration in neuroscience, from Clark University, and graduated summacum laude with a B.S. in biology from Spelman College. Dr. Lewis hasconducted research on taste and smell of the fruit fly Drosophilamelanogaster, and on molecular mechanisms of sweet taste transduction inthe blowfly Phormia regina. She has collegiate teaching experience andthree peer-reviewed publications. She is a member of the Association forChemoreception Sciences.
Catherine L. St. Hilaire, Ph.D., retired as a LSRO Senior Staff Scientistand Project Leader of the Reduce-Risk Review Project during the course ofthis project. Dr. St. Hilaire had more than 20 years of experience inenvironmental and consumer product risk assessment and risk management.She provided leadership in the development of risk assessment policiesand procedures, from the original Risk Assessment Guidelines forCarcinogens, and the original guidelines for EPA’s Superfund RiskAssessments, to industry-wide risk assessment approaches for foodcontaminants. Her contributions to the field were formally recognized throughher election as a Fellow of the Society for Risk Analysis and as a recipient ofThe National Academies’ Certificate for Outstanding Service on the 20thAnniversary of the release of the landmark Red Book. Formally known asRisk Assessment in the Federal Government: Managing the Process, thisdocument became a foundation of theory and practice in the field of riskassessment and provided the framework for public health risk assessmentsadopted by regulatory agencies worldwide. Dr. St. Hilaire held executive-level posts at Hershey Foods Corporation, International Life Science Institute,ENVIRON Corporation, and Sciences International, Inc. She was the primaryauthor of more than 20 books and publications in the fields of microbiologyand toxicology, including carcinogenesis and reproductive and developmentaltoxicity, risk assessment, and risk management. She was a member of theSociety for Risk Analysis and the Society of Toxicology.
James Cecil Smith Jr., Ph.D., is a Senior Scientific Consultant at LSRO.Dr. Smith obtained his doctorate in nutritional sciences/biochemistry at theUniversity of Maryland and completed postdoctoral work in the Departmentof Biological Chemistry at UCLA. He served two years as Health ServiceOfficer at the NIH. Dr. Smith completed 36 years in federal researchlaboratories with increasing responsibilities in the Veterans Administrationmedical system and the USDA. Although best known for contributions totrace element nutrition, he is also an authority in the area of vitamin andmineral interactions. Original research directed by him identified a link

Appendices 157
For internal use of Philip Morris personnel only.
between zinc and vitamin A, which was published in Science. Other researchaccomplishments include collaborating on studies that revealed an importantinteraction between copper and dietary carbohydrates. He directed two largehuman investigations, funded in part by the National Cancer Institute, whichestablished the USDA Laboratory and Research Center at Beltsville, MD,as original leaders in research to elucidate the role of dietary carotenoids inhealth and disease. Dr. Smith has authored or co-authored more than 375publications. He served as an editorial board member, assistant editor, andad hoc reviewer for several national and international journals. He is a memberof several professional societies. His recognitions include the Klaus SchwarzAward for Excellence and Leadership in Trace Element Research sponsoredby the International Association of Bioinorganic Scientists, and he wasrecently named a Fellow of the American Society for Nutritional Sciences.

158 Exposure Assessment
For internal use of Philip Morris personnel only.
VI.A.4 The Life Sciences Research Office Board of Directors
Taffy J. Williams, Ph.D., ChairConsultantConcord, NC
Terry Quill, M.S., J.D., Vice ChairThe Weinberg Group, Inc.Washington, DC
Directors
Rita R. Colwell, Ph.D.University of MarylandCollege Park, MD
Susan Finn, Ph.D., RDConsultantColumbus, OH
William MacLean, Jr., M.D., C.M., F.A.A.P.ConsultantColumbus, OH
Thomas Stagnaro, B.S., M.B.A.Americas Biotech DistributorRiva, MD
Jacob J. Steinberg, Ph.D.Albert Einstein College of MedicineMontefiore Medical CenterBronx, NY
SecretaryMichael C. Falk, Ph.D.Life Sciences Research OfficeBethesda, MD

Appendices 159
For internal use of Philip Morris personnel only.
VI.B GLOSSARY/ACRONYMS AND ABBREVIATIONS
VI.B.1 Glossary
Biological effects assessmentOne of two critical evaluations included in a PRRTP risk assessment.Statistically and biologically significant changes indicative of decreased riskin relevant biomarkers of effect in PRRTP users compared to those inconventional cigarette smokers support the likelihood that risk of lung cancer,chronic obstructive pulmonary disease and/or cardiovascular disease willbe lower for PRRTP users.
Biologically effective doseThe amount of a constituent or metabolite that is measured interacting withcritical subcellular, cellular, and target tissues.
Biological matrixA discrete material of biological origin (e.g., blood, serum, plasma, urine, orsaliva), that can be sampled and processed in a reproducible manner (U.S.Food and Drug Administration, 2001).
BiomarkerA biological response variable that is measured in biological fluids, tissues,cells, and subcellular components and is indicative of exposure and/or effect.
Biomarker of effectA measurable effect including early subclinical biological effects; alterationsin morphology, structure, or function; or clinical symptoms consistent withthe development of health impairment and disease.
Biomarker of exposureA constituent or metabolite that is measured in a biological fluid or tissueand/or is measured after it has interacted with critical subcellular, cellular, ortarget tissues.
CancerA term for diseases in which abnormal cells divide without control.
Cardiovascular diseaseDisease of the heart and/or vascular (blood vessel) system includingatherosclerosis, coronary artery disease, carotid artery disease, andmyocardial infarction (heart attack).

160 Exposure Assessment
For internal use of Philip Morris personnel only.
Cessation (smoking)Abstinence from smoking for at least six months (Centers for Disease Controland Prevention, 2005b).
Chronic obstructive pulmonary diseaseA slowly progressive disease of the airways characterized by a gradual lossof lung function. In the US, the term includes chronic bronchitis, chronicobstructive bronchitis, or emphysema or combinations of these conditions.
CigaretteA rod of tobacco wrapped in paper.
Cigarette smoke condensateThe particulate phase of cigarette smoke that includes liquid and/or solidparticles within the smoke aerosol.
Cigarette smoking machineA machine that generates smoke from a cigarette according to one or moredefined protocols.
Cigarette smoking machine regimensA set of conditions for the production of smoke from cigarettes by using asmoking machine. In general, regimens differ in puffing parameters (e.g.,volume, duration, and inter-puff interval) and filter vent-blocking conditions.
Clinical studiesStudies conducted with human subjects.
Conventional cigarettesCommercial cigarettes that incorporate materials and designs typical of thosethat have been used in cigarette manufacturing for a number of years (Countset al., 2006).
CotinineA metabolite of nicotine found in the plasma, saliva, and urine of smokersand used as a biomarker of exposure to cigarette smoke.
Crossover studyA study in which each participant is used as his/her own control, removinginter-subject variations in responses.
Appendices 161
For internal use of Philip Morris personnel only.
DoseThe amount of a substance absorbed by an organism.
Dose-responseA relationship between the amount of a substance in environmental mediathat comes in contact with an organism (humans, animals) and/or the amountof a substance absorbed by an organism or a specified compartment, organ,or tissue, and the biological effects caused by the substance.
Environmental tobacco smokeSmoke consisting of aged, diluted sidestream smoke and exhaledmainstream smoke.
Epidemiological studiesEpidemiological studies are conducted using human populations to evaluatewhether there is a causal relationship between exposure to a substanceand adverse health effects. These studies measure the risk of illness ordeath in an exposed population compared to the risk in an identical population(e.g., same age, sex, race, socio-economic status) unexposed population.
ExposureThe amount of a substance that is absorbed by an organism or specifiedcompartment, organ, or tissue. Also referred to as dose.
Exposure assessmentOne of two critical aspects of a risk assessment. The purpose of an exposureassessment is to evaluate all relevant data on an exposure of interest (inthis case, chemicals present in PRRTPs and conventional cigarette smoke).
Ex-smokersIndividuals who do not currently use tobacco products and who havemanaged to abstain from smoking for ≥ 6 months.
FTC methodA cigarette smoking machine procedure adopted by the FTC in 1967 tomeasure yields of tar and nicotine in mainstream smoke. The method wasmodified in 1980 to include carbon monoxide.
Filter (cigarette)A device positioned at the mouth end of a cigarette, which serves as asmoke-permeable mouthpiece; usually composed of cellulose acetate fibersin the US and encased by a wrapper.

162 Exposure Assessment
For internal use of Philip Morris personnel only.
Filter ventsOne or more rings of small holes or perforations intended to dilute smokewith air, thereby reducing standard yields of tar, nicotine, and carbonmonoxide.
Former smokerA person who reports having smoked ≥100 cigarettes during his/her lifetimebut currently does not smoke (Centers for Disease Control and Prevention,2005c).
Gas phaseThe nonliquid (vapor) phase of cigarette smoke, which does not readilycondense when it passes through a filter, as compared with the particulatephase.
HarmAn adverse event (e.g., a tobacco-associated disease or health condition).
Harm reductionA reduction in adverse consequences associated with an activity or exposureto toxic substances. In general, harm reduction operates in an environmentin which harm is occurring and cannot be prevented or eliminated.
Lung cancerCancer that forms in tissues of the lung, usually in cells lining the air passages.There are four main histological types, squamous cell carcinoma,adenocarcinoma, small cell carcinoma, and large cell carcinoma.
Mainstream smokeSmoke drawn from the butt end of a cigarette into the mouth as a smokerpuffs on a cigarette.
MorbidityA diseased state; prevalence and/or incidence of disease.
MortalityDeath.
N-NitrosamineA chemical substance formed by nitrosation of secondary and tertiary amines.Tobacco-specific nitrosamines are formed by nitrosation of the major tobaccoalkaloid nicotine (Brunnemann et al., 1996).

Appendices 163
For internal use of Philip Morris personnel only.
NicotineA cyclic tertiary amine composed of a pyridine ring and a pyrrolidine ring. Itis a colorless to pale yellow, water soluble, fluid alkaloid derived from plantsof the genus Nicotiana. Nicotine acts as a stimulant in mammals and is oneof the main factors responsible for dependence-forming properties of tobaccosmoke.
Nicotine replacement therapyUse of various forms of nicotine delivery methods intended to replace nicotineobtained from smoking or other tobacco use. Examples include nicotinepatches, gums, inhalers, nasal sprays, and lozenges.
Pack-yearA unit of measure of smoking exposure. One pack-year represents theconsumption of 20 cigarettes (one pack) per day for one year by one person.
Particulate phaseIn smoke, the solid and/or liquid phase of an aerosol, that is suspended ingas. Liquid particles are referred to as droplets.
Potential reduced-exposure products (PREPs)Products that could potentially result in reduced exposure to toxicants froma given instance of tobacco use.
Potential reduced-risk tobacco products (PRRTPs)Tobacco products that may pose lower health risks than conventionalcigarettes.
Premarket evaluationTesting that is conducted before the marketing of a product.
Product characteristicsComposition, design, and engineering of a tobacco product.
Preclinical studiesStudies generally conducted prior to studies in humans. For PRRTPs,preclinical studies include product characterization, chemistry (smoke orproduct), cytogenicity and genotoxicity assays, and animal studies.
PyrolysisThermal degradation of a chemical substance, generally resulting in smallerchemical fragments.

164 Exposure Assessment
For internal use of Philip Morris personnel only.
Reference cigaretteCigarettes prepared under controlled conditions with uniform, documentedsource tobaccos producing standardized yields of tar, nicotine, and carbonmonoxide.
Relative riskExpression of a risk in relation to another risk (e.g., the risk of death at workis approximately twice the risk of death from drowning).
RiskThe probability that harm (e.g., a smoking-associated disease) will occur.
Risk assessmentA human health risk assessment is a systematic review and evaluation ofdata related to risks posed by occupational or environmental chemicals,consumer products, food components and drugs, and other potential healthhazards (National Research Council, 1983).
Risk reductionA decrease in the likelihood that harm will occur.
ShardsA small piece or particle.
Sidestream smokeThe smoke emitted directly into the air from the burning end of the cigarette,largely during the smolder interval between puffs.
SmokeFine particles suspended in air that scatter light and are physically visible.Cigarette smoke contains many chemical substances in both gas and liquidstate, suspended in a dynamic aerosol created by incomplete combustionwhich changes both physically and chemically over time.
SmokerA person who has smoked ≥100 cigarettes and who now smokes every dayor some days (Centers for Disease Control and Prevention & National Centerfor Health Statistics, 2006).
Smoke chemistry studiesStudies that investigate the general composition of smoke or the yield ofspecific smoke constituents.

Appendices 165
For internal use of Philip Morris personnel only.
Smoking machineA machine that generates smoke from cigarettes under specific programmedparameters.
Smoking topographyA method to assess how individuals smoke cigarettes or cigarette-likeproducts.
Smoking-related diseasesDiseases that have been reported to be caused by cigarette smoking, suchas those listed in the 2004 Surgeon General’s report (U.S. Department ofHealth and Human Services, 2004).
Standard methodsTesting methods that have undergone appropriate validation (intra- and inter-laboratory evaluation) that are used to compare results.
Structure-activity relationshipsRelationships linking chemical structure and toxicological effects.
Surrogate compoundA chemical that is used to represent other chemicals of similar structure orchemical class.
TarThe weight in grams of the total particulate matter collected on a Cambridgefilter minus the weight of alkaloids, as nicotine, and water (Federal TradeCommission, 1967a).
Tobacco-specific nitrosaminesN-Nitroso compounds formed by nitrosation of the major tobacco alkaloidnicotine, and a suspected human carcinogen.
Tobacco harm reductionReduction of adverse impacts on the health of smokers who will not or cannotabstain from smoking.
Total particulate matterParticles in smoke, larger than 1 µm in diameter, that are trapped on aCambridge filter as the smoke passes through the filter; usually obtainedfrom mainstream smoke.

166 Exposure Assessment
For internal use of Philip Morris personnel only.
ToxicantA poisonous substance.
Vapor phaseMaterial in the gas state; usually material that passes through a filter.
VentilationPerforations in the filter tipping paper or paper wrapping the tobacco rodthat dilute total air flow inside the rod and reduce the holes-open pressuredrop measurement; expressed as a percentage with higher numbersindicating greater ventilation.
Weight of evidenceA process that assigns different levels of importance (“weights”) to evidencebased on a number of factors. The term also refers to conclusions based onthe totality of the evidence from all study types.
YieldThe amount of a substance, such as tar, nicotine, or carbon monoxide, asproduced in smoke under standard smoking conditions.

Appendices 167
For internal use of Philip Morris personnel only.
VI.B.2 Acronyms and Abbreviations
AAMA N-Acetyl-S-(2-carbamoylethyl)-L-cysteine4-ABP 4-Aminobiphenyl4-ABP-Hb 4-Aminobiphenyl-HemoglobinBEA Biological Effects AssessmentB[a]P Benzo[a]pyreneBMI Body mass indexBPDE Benzo[a]pyrene diolepoxideCDC Centers for Disease Control and PreventionCI Confidence intervalCO Carbon monoxideCOHb CarboxyhemoglobinCORESTA Centre de Coopération pour les Recherches
Scientifiques Relatives au TabacCreSS Clinical research support systemDHBMA or MI Dihydroxybutyl mercapturic acidDNA Deoxyribonucleic acidEA Exposure assessmentEBC Exhaled breath condensateEHC Electrically heated cigaretteEHCSS Electrically heated cigarette smoking systemELISA Enzyme-linked immunosorbent assayEPA U.S. Environmental Protection AgencyETS Environmental tobacco smokeFDA U.S. Food and Drug AdministrationFTC U.S. Federal Trade CommissionGAMA N-(R,S)-Acetyl-S-(2-carbamoyl-2-hydroxyethyl)-L-
cysteineGC Gas chromatographyGC-TEA Gas chromatography-thermal energy analyzerHb HemoglobinHCN Hydrogen cyanide1-HOP 1-HydroxypyreneHPB 4-Hydroxy-1-(3-pyridyl)-1-butanoneHPLC High-performance liquid chromatography3-HPMA 3-Hydroxypropylmercapturic acidIARC International Agency for Cancer on ResearchIOM Institute of MedicineISO International Organization for StandardizationIsoP Isoprostanes
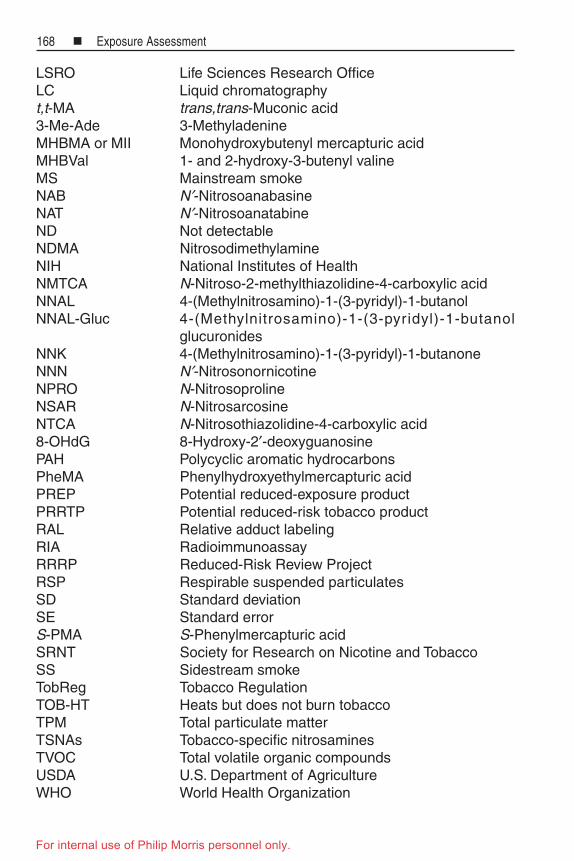
168 Exposure Assessment
For internal use of Philip Morris personnel only.
LSRO Life Sciences Research OfficeLC Liquid chromatographyt,t-MA trans,trans-Muconic acid3-Me-Ade 3-MethyladenineMHBMA or MII Monohydroxybutenyl mercapturic acidMHBVal 1- and 2-hydroxy-3-butenyl valineMS Mainstream smokeNAB N′-NitrosoanabasineNAT N′-NitrosoanatabineND Not detectableNDMA NitrosodimethylamineNIH National Institutes of HealthNMTCA N-Nitroso-2-methylthiazolidine-4-carboxylic acidNNAL 4-(Methylnitrosamino)-1-(3-pyridyl)-1-butanolNNAL-Gluc 4-(Methylnitrosamino)-1-(3-pyridyl)-1-butanol
glucuronidesNNK 4-(Methylnitrosamino)-1-(3-pyridyl)-1-butanoneNNN N′-NitrosonornicotineNPRO N-NitrosoprolineNSAR N-NitrosarcosineNTCA N-Nitrosothiazolidine-4-carboxylic acid8-OHdG 8-Hydroxy-2′-deoxyguanosinePAH Polycyclic aromatic hydrocarbonsPheMA Phenylhydroxyethylmercapturic acidPREP Potential reduced-exposure productPRRTP Potential reduced-risk tobacco productRAL Relative adduct labelingRIA RadioimmunoassayRRRP Reduced-Risk Review ProjectRSP Respirable suspended particulatesSD Standard deviationSE Standard errorS-PMA S-Phenylmercapturic acidSRNT Society for Research on Nicotine and TobaccoSS Sidestream smokeTobReg Tobacco RegulationTOB-HT Heats but does not burn tobaccoTPM Total particulate matterTSNAs Tobacco-specific nitrosaminesTVOC Total volatile organic compoundsUSDA U.S. Department of AgricultureWHO World Health Organization

Index 169
For internal use of Philip Morris personnel only.
INDEXBiologically effective dose, 29,
159
Biological matrix, 32-36,159
Biomarkerof effect, 29, 159of exposure, 29, 159
Acetonitrile, 33, 72-73Acrolein, 62-63Acrylamide, 34, 75-76Acrylonitrile, 33, 63-64Adducts, 33, 35
1,3-Butadiene, 62Albumin
Benzo[a]pyrene, 67-68DNA, 51-52, 57, 70-72, 81
Bulky, 35, 84-85Etheno, 35, 84Hemoglobin, 35, 54-57,
63-64, 67, 76-80Benzo[a]pyrene, 35, 68valine, 36, 62, 76, 79-80
N′-Nitrosonornicotine, 53Alkylation, 78-80Aromatic amines, 34, 54-57Benzene, 34, 58-611,3-Butadiene, 61-62Cadmium, 34, 74-75Carbon Monoxide, 32, 40-44Cotinine, 39-40, 160Hydrogen cyanide, 77-78Mercapturic acids, 32, 60-62Minor tobacco alkaloids, 73-74
Anatabine, 33, 73-74Anabasine, 33, 73-74
Nicotine, 32, 37-40, 163N-Nitrosamine, 46-54, 162Other, 81-86Polycyclic aromatic
hydrocarbons, 36, 64-72
Tobacco specific nitrosamines,46-47,165
Thioether, 34, 8-82Urine, 32, 44-46, 53-54, 57-58
Cambridge filter pad, 8, 92, 165
Cancer, 1, 7-8, 47-48, 71, 81, 159lung, 1, 7-8, 47, 72, 162
Cardiovascular disease, 1, 159
Cessation, 49, 55-56, 63, 74, 84,160
Chronic obstructive pulmonarydisease, 1, 7, 84, 160
Cigaretteconventional, 1-4, 6-7, 9, 11-14,
16, 20-21, 24, 28, 30, 40, 42,44-45, 47, 49, 51, 61, 66, 79,81-82, 89-90, 94-95, 160
filter, 8, 90-91, 161reference, 2-3, 13smoking machine, 3, 14-18,
23-24, 50, 90, 92, 160-161, 165
Deposition, 2, 16, 29, 91-92
Dose, 7, 9, 29, 38, 50, 73, 90, 159,161dose response, 40, 45, 58, 70,
80, 161
Environmental tobacco smoke,see Smoke
Exhaled breath, 26, 41, 43, 72,86
Exposure, iii, 1-5, 9-10, 6-25,29-36, 94-95, 161
Gas phase, 19, 23, 40, 58, 62-64,72, 78-81, 86, 162
Harm, 6, 94, 162
Lung cancer, see Cancer

170 Exposure Assessment
For internal use of Philip Morris personnel only.
Morbidity, 6, 47, 162
Mortality, 6, 8-9, 47, 162
Nicotine, see Biomarker ofexposure
N-Nitrosamines, see Biomarker ofexposure
Pack-year, 7, 90, 163
Particulate phase, 4, 8, 10, 19,23, 52, 54, 67, 70, 74, 78, 80, 87,92, 160, 162-163
Potential reduced-exposureproducts (PREPs), 6, 163
Potential reduced-risk tobaccoproducts (PRRTPs), iii, 1-5, 11-12,163
Premarket evaluation, 1, 7, 163
Product characteristics, 1-3, 9,23, 88, 91, 163
Retention, 2, 29, 91-92
Risk, 1, 5-9, 24, 84, 88-89, 94, 164
Smokechemistry, 2-4, 13-25, 88-89, 93,
164environmental tobacco, 10, 12,
22-24, 75, 93, 161mainstream, 10-11, 14, 22-24, 37,
162sidestream, 10-12, 22-24, 37, 161,
164
Smoker, 164continuing, 7, 79current, 63ex-smoker, 63, 71, 85, 161former, 7, 49, 75, 162
Smoking-related diseases, 1, 19,24, 165
Spectrometry, 22, 24, 38, 40,51-52, 57, 59-60, 63-65, 67-70,73-76, 78-79, 82GC, 38, 40, 51-52, 57, 59, 62-63,
68, 70, 74, 76, 78-79, 82GC-TEA, 51HPLC, 38, 40, 57, 63, 65, 67-70,
79, 82LC, 38, 40, 51, 60, 76
Structure activity relationships,20, 165
Studiesclinical, 3, 20, 26-92, 160crossover, 42, 45, 48-49, 160epidemiological, 7-9, 90, 161preclinical, 2-3, 163smoke chemistry, 2-4, 13-25,
88-89, 93, 164
Tobacco-specific nitrosamines,see Biomarkers of exposure
Total particulate matter, 8, 14,165
Toxicant, 6, 9, 11, 13, 15, 19, 91,93, 163, 166
Vapor phase, 4, 8, 10, 75, 87,91-92, 166
Ventilation, 8-9, 15-17, 42, 89-90,92, 166
Weight of evidence, 2, 166
Yield, 8-10, 12, 14-25, 43-44,49-50, 65, 69, 75, 90-92, 162,165-166

The LSRO Report on
EditorKara D. Lewis, Ph.D.
Exp
osure Assessm
ent L
SR
O R
eport
EXPOSURE ASSESSMENT IN THEEVALUATION OF
POTENTIAL REDUCED-RISKTOBACCO PRODUCTS
LSRO Report on
EXPOSURE ASSESSMENT IN THEEVALUATION OF
POTENTIAL REDUCED-RISKTOBACCO PRODUCTS
Expert Committee
Richard Dalby, Ph.D.Department of Pharmaceutical Sciences
University of MarylandBaltimore, MD
Karl Olav Fagerström, Ph.D.Fagerström Consulting AB and Smokers Information Center
Helsingborg, Sweden
Jerold Last, Ph.D.University of California at Davis
School of MedicineDavis, CA
Robert Orth, Ph.D.Apis Discoveries, LLC
Gerald, MO
William Waddell, M.D.Department of Pharmacology and Toxicology
University of LouisvilleSchool of Medicine
Louisville, KY
The Life Sciences Research Office
The Life Sciences Research Office (LSRO) is a non-profit organization thatbenefits society by providing information, analysis, and advice to decisionmakers in the government and the private sector. LSRO reports addressscientific issues in biomedicine, health care, nutrition, food safety, health riskanalysis, and the environment.
www.LSRO.org