to work more or less? satisfaction on the … · orkhan nadirov, khatai aliyev, bruce dehning issn...
TRANSCRIPT
Orkhan Nadirov, Khatai Aliyev, Bruce Dehning
ISSN 2071-789X
INTERDISCIPLINARY APPROACH TO ECONOMICS AND SOCIOLOGY
Economics & Sociology, Vol. 10, No. 3, 2017
266
Orkhan Nadirov, Tomas Bata University in Zlin, Zlin, Czech Repuplic, E-mail: [email protected] Khatai Aliyev, Azerbaijan State Economic University (UNEC), Baku, Azerbaijan,
TO WORK MORE OR LESS? THE IMPACT OF TAXES AND LIFE
SATISFACTION ON THE MOTIVATION TO WORK
IN CONTINENTAL AND EASTERN EUROPE
E-mail: [email protected] Bruce Dehning, Chapman University, Orange, United States, E-mail: [email protected] Received: December, 2016 1st Revision: March, 2017 Accepted: June, 2017
DOI: 10.14254/2071-789X.2017/10-3/19
ABSTRACT. Using country-level data from 2000-2013, we test the relationship between life satisfaction (measured as how people evaluate their life as a whole rather than their current feelings) and the motivation to work (measured as aggregate hours of work). Our hypothesis is that even after controlling for average labor income tax rates in countries with high and low average hours worked, there is a significant negative association between the motivation to work and life satisfaction. The main findings of this paper are that the increase in the motivation to work per employee comes at the expense of life satisfaction, and differences in average tax rates on labor income cannot account for differences in time allocation. Once life satisfaction is included, the hypotheses of previous neoclassical economic studies are almost irrelevant in determining the response of market hours to higher average tax rates on labor income. In line with our assumption, we find a negative relationship between life satisfaction and the motivation to work in the cross-country examinations. In countries with the highest hours worked (Hungary, Estonia), wealth is generally preferred to leisure and in countries with the lowest hours worked (France, Germany), leisure is preferred to wealth.
JEL Classification: H20, J01, J29
Keywords: motivation to work, labor supply, labor taxes, life satisfaction.
Introduction
Nowadays, there are huge differences between Americans and Europeans in how the
motivation to work changes in the labor market. In the 1990s, the average weekly working
hours started to fall in Europe, whereas Americans started to work more. Using the average
number of weekly hours of work data from the European Statistics database (Eurostat, 2017)
and the Organisation for Economic Co-operation and Development (OECD, 2017a), we found
that, in 2014, Americans worked 38.6 hours per week in market work (defined as paid time).
For example, in the same year, the average number of weekly hours of market work by French
workers was 34.4. The comparison between Germany and the United States is similar.
Nadirov, O., Aliyev, K., Dehning B. (2017). To Work More or Less? The Impact of Taxes and Life Satisfaction on the Motivation to Work in Continental and Eastern Europe. Economics and Sociology, 10(3), 266-280. doi:10.14254/2071-789X.2017/10-3/19
Orkhan Nadirov, Khatai Aliyev, Bruce Dehning
ISSN 2071-789X
INTERDISCIPLINARY APPROACH TO ECONOMICS AND SOCIOLOGY
Economics & Sociology, Vol. 10, No. 3, 2017
267
However, the average weekly working hours were not the same in the early 1970s.
Decomposing the weekly hours worked per worker into the weekly hours worked per person,
we can observe that Americans were working fewer hours per person, 23.5 per week, on
average, while the average number of hours working per person was 24.4 per week in France
(see Prescott, 2004; McGrattan and Rogerson, 2004; Hallam and Weber, 2007; for details).
Previous studies have tried to find answers to the question, “Why are there differences in the
motivation to work between countries and why did it change after the 1970s?” Using cultural
differences to answer this question when comparing the United States and European countries
is dubious. Around the time of World War I, the motivation to work was lower in the United
States than in France and Germany (Huberman, 2004). Then, the motivation to work started to
decline in Europe, and by the late 1960s, it was almost the same in the United States and Europe
(Huberman, 2004). The aforementioned fluctuations in the history of hours worked shows that
simply comparing the motivation to work between the United States and Europe is
inappropriate and much remains to be clarified. To the best of our knowledge, this is the first
work on the effect of taxes on the motivation to work that examines and compares Continental
Europe with Eastern Europe.
Finding deterministic factors influencing the motivation to work has been the subject of
intense debate in recent international economic literature. To the best of our knowledge, except
for Alesina et al. (2005), most of the papers in this area pay little or no attention to life
satisfaction when explaining the motivation to work (Prescott, 2004; Faggio and Nickell, 2007;
Rogerson, 2007; Ohanian et al., 2008; Olovsson, 2009; Berger and Heylen, 2011). Our aim in
this paper to examine the explanatory power of two factors, average labor income tax rates and
life satisfaction, on the motivation to work in Continental and Eastern Europe. The main
question we are trying to answer is why the motivation to work in France and Germany fell
dramatically, but stayed relatively stable in Hungary and Estonia (see Table 1, below).
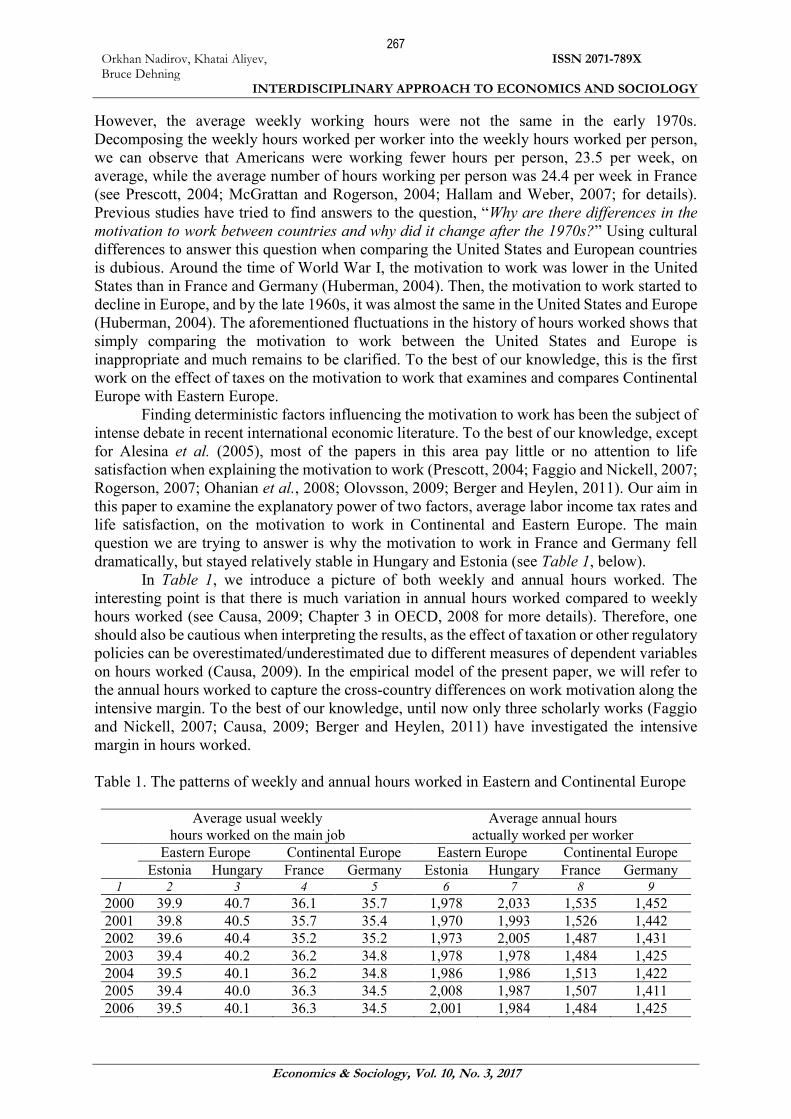
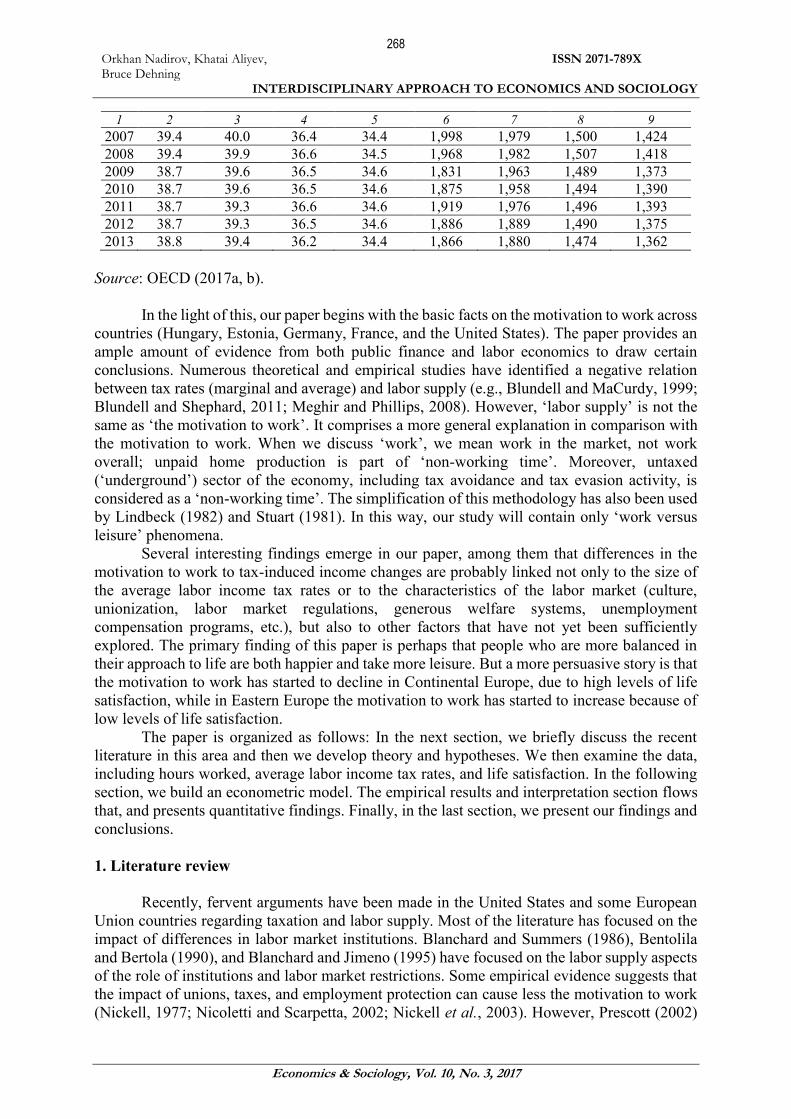
In Table 1, we introduce a picture of both weekly and annual hours worked. The
interesting point is that there is much variation in annual hours worked compared to weekly
hours worked (see Causa, 2009; Chapter 3 in OECD, 2008 for more details). Therefore, one
should also be cautious when interpreting the results, as the effect of taxation or other regulatory
policies can be overestimated/underestimated due to different measures of dependent variables
on hours worked (Causa, 2009). In the empirical model of the present paper, we will refer to
the annual hours worked to capture the cross-country differences on work motivation along the
intensive margin. To the best of our knowledge, until now only three scholarly works (Faggio
and Nickell, 2007; Causa, 2009; Berger and Heylen, 2011) have investigated the intensive
margin in hours worked.
Table 1. The patterns of weekly and annual hours worked in Eastern and Continental Europe
Average usual weekly
hours worked on the main job
Average annual hours
actually worked per worker
Eastern Europe Continental Europe Eastern Europe Continental Europe
Estonia Hungary France Germany Estonia Hungary France Germany 1 2 3 4 5 6 7 8 9
2000 39.9 40.7 36.1 35.7 1,978 2,033 1,535 1,452
2001 39.8 40.5 35.7 35.4 1,970 1,993 1,526 1,442
2002 39.6 40.4 35.2 35.2 1,973 2,005 1,487 1,431
2003 39.4 40.2 36.2 34.8 1,978 1,978 1,484 1,425
2004 39.5 40.1 36.2 34.8 1,986 1,986 1,513 1,422
2005 39.4 40.0 36.3 34.5 2,008 1,987 1,507 1,411
2006 39.5 40.1 36.3 34.5 2,001 1,984 1,484 1,425
Orkhan Nadirov, Khatai Aliyev, Bruce Dehning
ISSN 2071-789X
INTERDISCIPLINARY APPROACH TO ECONOMICS AND SOCIOLOGY
Economics & Sociology, Vol. 10, No. 3, 2017
268
1 2 3 4 5 6 7 8 9
2007 39.4 40.0 36.4 34.4 1,998 1,979 1,500 1,424
2008 39.4 39.9 36.6 34.5 1,968 1,982 1,507 1,418
2009 38.7 39.6 36.5 34.6 1,831 1,963 1,489 1,373
2010 38.7 39.6 36.5 34.6 1,875 1,958 1,494 1,390
2011 38.7 39.3 36.6 34.6 1,919 1,976 1,496 1,393
2012 38.7 39.3 36.5 34.6 1,886 1,889 1,490 1,375
2013 38.8 39.4 36.2 34.4 1,866 1,880 1,474 1,362
Source: OECD (2017a, b).
In the light of this, our paper begins with the basic facts on the motivation to work across
countries (Hungary, Estonia, Germany, France, and the United States). The paper provides an
ample amount of evidence from both public finance and labor economics to draw certain
conclusions. Numerous theoretical and empirical studies have identified a negative relation
between tax rates (marginal and average) and labor supply (e.g., Blundell and MaCurdy, 1999;
Blundell and Shephard, 2011; Meghir and Phillips, 2008). However, ‘labor supply’ is not the
same as ‘the motivation to work’. It comprises a more general explanation in comparison with
the motivation to work. When we discuss ‘work’, we mean work in the market, not work
overall; unpaid home production is part of ‘non-working time’. Moreover, untaxed
(‘underground’) sector of the economy, including tax avoidance and tax evasion activity, is
considered as a ‘non-working time’. The simplification of this methodology has also been used
by Lindbeck (1982) and Stuart (1981). In this way, our study will contain only ‘work versus
leisure’ phenomena.
Several interesting findings emerge in our paper, among them that differences in the
motivation to work to tax-induced income changes are probably linked not only to the size of
the average labor income tax rates or to the characteristics of the labor market (culture,
unionization, labor market regulations, generous welfare systems, unemployment
compensation programs, etc.), but also to other factors that have not yet been sufficiently
explored. The primary finding of this paper is perhaps that people who are more balanced in
their approach to life are both happier and take more leisure. But a more persuasive story is that
the motivation to work has started to decline in Continental Europe, due to high levels of life
satisfaction, while in Eastern Europe the motivation to work has started to increase because of
low levels of life satisfaction.
The paper is organized as follows: In the next section, we briefly discuss the recent
literature in this area and then we develop theory and hypotheses. We then examine the data,
including hours worked, average labor income tax rates, and life satisfaction. In the following
section, we build an econometric model. The empirical results and interpretation section flows
that, and presents quantitative findings. Finally, in the last section, we present our findings and
conclusions.
1. Literature review
Recently, fervent arguments have been made in the United States and some European
Union countries regarding taxation and labor supply. Most of the literature has focused on the
impact of differences in labor market institutions. Blanchard and Summers (1986), Bentolila
and Bertola (1990), and Blanchard and Jimeno (1995) have focused on the labor supply aspects
of the role of institutions and labor market restrictions. Some empirical evidence suggests that
the impact of unions, taxes, and employment protection can cause less the motivation to work
(Nickell, 1977; Nicoletti and Scarpetta, 2002; Nickell et al., 2003). However, Prescott (2002)
Orkhan Nadirov, Khatai Aliyev, Bruce Dehning
ISSN 2071-789X
INTERDISCIPLINARY APPROACH TO ECONOMICS AND SOCIOLOGY
Economics & Sociology, Vol. 10, No. 3, 2017
269
disputes that differential taxation by itself might cause the differences in the current level of
aggregate hours worked.
The first significant work was done by Prescott (2004) who calibrated a growth model
to see the differences in the motivation to work between the United States and Europe. Prescott
(2004) provided that different marginal tax rates explain the decreasing motivation to work in
more advanced industrial countries. Prescott’s framework has been followed by numerous
studies (e.g., Davis and Henrekson, 2003; Ljungqvist and Sargent, 2006; Ohanian et al., 2008;
Chetty et al., 2011; McDaniel, 2011). His idea was defended by the statistical evidence of Davis
and Henrekson (2003), who found that in wealthier countries higher tax rates reduce the
motivation to work. Alesina, Glaeser, and Sacerdote (2005) found that the impact of taxes on
labor supply is negated by unionization management and labor market regulation. Ljungqvist
and Sargent (2008) provided that unemployment benefits supplied by governments decrease
the labor supply. Ohanian et al. (2008) apply Prescott’s methodology to a larger sample of
countries over a longer time span and conclude that much of the change in hours worked over
time and across countries can be explained by differences tax rates. Conesa and Kehoe (2008)
empirically assessed taxes and productivity on the motivation to work in Spain. Their models
showed that almost 80 percent of the decrease in the motivation to work can be explained by
increasing taxes. Chen et al. (2015) contend that increases in labor taxes and unemployment
benefits together explain roughly 75% of the declining the motivation to work in Europe relative
to the United States over the past three decades. Using micro data from the European Social
Survey, Mocan and Pogorelova (2015) tested the impact of “culture of leisure” and taxes
(average and marginal) on the motivation to work of second-generation immigrants living in
26 European countries. They found that both “culture of leisure” and taxes have an impact on
females, but for men the only taxes have an impact on their motivation to work. The findings
of Mocan and Pogorelova (2015) show that there is a significant difference between not only
Americans and Europeans, but also between European countries. Therefore, we ground our
predictions based on two country groups: Continental Europe (Germany, France) and Eastern
Europe (Hungary, Estonia).
2. Theory development and hypothesis
High tax rates and its impact on the motivation to work is a very broad and
interdisciplinary research area. It draws on works from economics, accounting, psychology,
and sociology. The topic is of great interest to academics, policy makers, and private-sector
institutions worldwide. Because we are introducing psychological and sociological theories in
addition to economic theory, this research can make a seminal contribution in the areas of
taxation and economics.
To derive the empirical model, we follow theory of the leisure class presented by Veblen
(1899), which presented individuals as irrational, economic agents who pursue social status and
the prestige that comes from a place in society with little regard to their own satisfaction.
Especially, Veblen (1899) criticized contemporary (19th-century) economic theories, and
indicated that economists should take into account how individuals behave, socially and
culturally, rather than rely upon the abstractions of theoretic deduction to explain the economic
behavior of society (Veblen, 1899). On the other hand, in the national tax debate, many ignore
the effect of taxes on human motivation (Harriss 1985). But, we know from Maslow’s
Hierarchy of Needs that individuals must satisfy lower level basic needs before progressing on
to meet higher-level growth needs (Maslow, 1954). Once lower basic needs have been
reasonably satisfied, the importance of income decreases (Lewis, 1982). That is why both of

Orkhan Nadirov, Khatai Aliyev, Bruce Dehning
ISSN 2071-789X
INTERDISCIPLINARY APPROACH TO ECONOMICS AND SOCIOLOGY
Economics & Sociology, Vol. 10, No. 3, 2017
270
these theories are appealing in determining the differences of hours worked between these
countries. Following from the above discussion, it is hypothesized that:
Hypothesis: After controlling for differences in average labor income tax rates between
the highest hours worked countries and the lowest hours worked countries, there is a significant
negative association between the motivation to work and life satisfaction.
3. Data: average labor income tax rates, life satisfaction and the motivation to work
This section presents data on hours worked and the average labor income tax rates across
countries. Life satisfaction measures are added to assess the true relationship between hours
worked and average labor income tax rates from different perspectives. Our study will focus on
the role of those three factors in determining whether it is taxes or life satisfaction that explains
the differences in hours worked between these countries.
3.1. Data on hours worked
The main goal of this research is to investigate which policy can help clarify the
motivation of employees to work. Employee motivation will be measured by the aggregate
hours of work. For our example countries, the measure of aggregate hours of work will be the
product of two numbers: civilian employment and annual hours of work per person in
employment. This methodology was previously used by Ohanian et al. (2008). The employment
and hours data are taken from the OECD Labor Statistics Database (OECD, 2017a, b). The
sample of countries includes: France, Germany, Hungary, Estonia, and the United States. When
we conduct our statistical analysis, the country sample reduces to 4 countries because we
measure only differences among the highest hours worked countries (Hungary, Estonia) and
the lowest hours worked countries (France, Germany). It is important to note that the hours data
are meant to include differences in vacation and statutory holidays, as well as differences in the
workweek (Rogerson, 2008). Because these four countries differ in population size, the data is
normalized by the size of the population aged 15-65, which is used as a proxy for the number
of working-aged individuals. The logic for this is that individuals under 15 are usually full-time
students and individuals over the age of 65 are normally retired from market work. The
normalization formula in shown in Equation (1):
64)-(15 Population)/ Employment* employee)per hours ((Annual=H (1)
To simplify comparisons we report all values relative to the US in 2000-2013. Table 2
indicates the resulting distribution of relative hours of work across countries. Examining
Table 2 shows that there are considerable differences in hours worked across these four
countries, with the lowest hours worked countries (France and Germany) working around 25%
less than their counterparts in the US and the highest hours worked countries (Hungary and
Estonia) working around 10% more than their counterparts in the US.
Table 2. Hours worked relative to the US, 2000-2013
Low ( < .8 ) High ( 1.00 )
France (.74) Hungary (1.10)
Germany (.76) Estonia (1.09)
Source: Authors’ own compilation.

Orkhan Nadirov, Khatai Aliyev, Bruce Dehning
ISSN 2071-789X
INTERDISCIPLINARY APPROACH TO ECONOMICS AND SOCIOLOGY
Economics & Sociology, Vol. 10, No. 3, 2017
271
3.2. Calculating average tax rates on labor income
We know from previous neo-classical growth model studies that general taxes in the
economy are divided into four categories: 1) consumption tax; 2) investment tax; 3) capital tax;
and 4) labor income tax. The calculation of tax rates provided in this paper are only related to
labor income. To be more precise, we shall concentrate on taxes on labor income paid by
individuals. The other three taxes are excluded from our research because we want to focus on
the average labor income tax rate and its impact on aggregate hours worked. It has been shown
that individuals reduce their labor supply significantly more in response to an income tax than
to an equivalent consumption tax (Blumkin et al., 2012).
Here, this question can be raised among the readers ‘why we are using average labor tax
rate’. Because, according to economic theory, income taxes affect the incentives to supply labor
by lowering the real wage (Ohanian et al., 2008).
According to economic theory, income taxes affect the incentives to supply labor by
lowering the real wage (Ohanian et al., 2008). There are several different tax rates available to
choose from when examining these questions, including statutory tax rates, marginal tax rates,
and average tax rates. The complexity and diversity of tax exemptions, deductions, and credits
make it nearly impossible for researchers to estimate the actual tax burden from information on
statutory tax rates, making them unsuitable. Producing time-series and cross-country samples
of marginal tax rates is limited by data availability. Therefore, we use average tax rates for labor
income. A measure of average tax rates was developed by McDaniel (2007). Tax systems often
include different forms of taxation that affect the same tax base. There are three widely used
methods for deriving average tax rates.
The first is usually referred to as an effective tax rate. Mendoza et al. (1994) computed
the time series of effective tax rates on consumption, capital income, and labor income. They
measured these tax rates for G7 countries using information from publicly available data
sources. Mendoza et al. (1994) provide a method for calculating average tax rates that does not
rely on data from individual tax returns or taxes paid by income bracket. The second method,
developed by Prescott (2004), modifies the procedure of Mendoza et al. (1994) for producing
the effective marginal tax rate on labor income. McDaniel (2007) developed the third method
by producing a series for effective average tax rates on labor income that includes taxes levied
on labor, payroll, and consumption for 15 OECD countries from the mid-1950s through the
early 2000s. She found that the effective average labor tax rate is around 30% in the highest
hours worked countries, while it is around 50% in the lowest hours worked countries.
There are some differences in details among these three methodologies. McDaniel’s
work builds upon the previous estimates of average tax rates across countries by Mendoza et
al. (1994) and Prescott (2004). To obtain a correspondence from the actual tax systems to the
taxes in the model, we utilize McDaniel’s method. Table 3 displays the data categories for tax
revenues, domestic income, and private expenditures from OECD National Accounts (OECD,
2017c) used to calculate tax rates from 2000 to 2013.
Table 3. SNA 2000-2013 National Account Data
GDP Gross Domestic Product
TPI Taxes on production and imports
Sub Subsidies
HHTL Taxes on income and profits (hh)
SS Actual social contributions, receivable (gov) Note: ‘hh’ denotes a value comes from household accounts and ‘gov’ from government accounts.
Source: McDaniel (2007).
Orkhan Nadirov, Khatai Aliyev, Bruce Dehning
ISSN 2071-789X
INTERDISCIPLINARY APPROACH TO ECONOMICS AND SOCIOLOGY
Economics & Sociology, Vol. 10, No. 3, 2017
272
The average tax rate on labor income is obtained as in Equation (2):
))()(1( SubTPIGDP
HHTSS Lh
(2)
Gollin (2002) found evidence regarding the labor share and that it is roughly constant over
countries, in the range of 0.65 and 0.80. Therefore, we set . Following McDaniel
(2007), we found that the effective average labor tax rate in the highest hours worked countries
(Hungary, Estonia) and the lowest hours worked countries (France, Germany) is around 35-
40%, while the same rate is around 20-25% in the US, as shown in Table 6 in the Appendix. If
the average labor tax rates are the same for both the highest and lowest hours worked countries,
then an interesting research question is, “What is the key factor that can account for the
differences in hours worked, if it is not differences in labor tax rates?” In the next section, we
attempt to shed light on this question using data on life satisfaction.
3.3. Isn’t life satisfaction a great thing?
Life satisfaction measures how people evaluate their life as a whole rather than their current
feelings. To measure life satisfaction we used data from Eurobarometer (EC, 2017). Subjects were
asked, “On the whole are you very satisfied, fairly satisfied, not very satisfied, or not at all satisfied
with the life you lead?” (EC, 2017). When asked to rate their general satisfaction with life on a scale
from 0 to 10, people across the OECD gave it an average 6.6 response (EC, 2017). However, life
satisfaction is not equally shared across the OECD. Some countries, including Estonia and Hungary,
have a relatively low level of overall life satisfaction, with average scores of less than 5.6. At the
other end of the scale, scores reach 7.0-7.5 in Germany and France. There is almost no difference
in life satisfaction levels between men and women across OECD countries.
3.4. Descriptive statistics
The data used in the empirical tests includes four countries, Germany, France, Hungary,
and Estonia for the 2000-2013 period by using annual data. Below, Table 4 tabulates descriptive
statistics of the model variables.
Table 4. Descriptive statistics of the variables
Variable Obs. No. Mean Maximum Minimum Std. Dev.
Hours_work 40 1734.03 1872.00 1566.40 122.52
Sat_index 40 2.790 3.160 2.280 0.259
Labor_tax 40 0.369 0.390 0.354 0.012
Rates 40 34.88 57.07 21.48 12.37
Duration 40 0.515 0.830 0.310 0.164
Density 40 12.89 22.20 5.100 5.534
Protection 40 2.328 2.866 1.587 0.345
Dummy 40 0.500 1.000 0.000 0.506 Where: 𝐻𝑂𝑈𝑅𝑆𝑊𝑂𝑅𝐾𝐸𝐷 𝑡
denotes hours worked per employee at time t; 𝑆𝐴𝑇𝐼𝑁𝐷𝐸𝑋𝑡 denotes life satisfaction index
at time t; 𝐿𝐴𝐵𝑂𝑅𝑇𝐴𝑋𝑡 denotes labor income tax at time t; and 𝐷𝑈𝑀𝑀𝑌 is a binary variable takes the value 1 for
the observations from the countries with low working hours (Germany and France), and 0 for those of the countries
with high working hours (Hungary, and Estonia)
Source: Authors’ own compilation.
h
7.01
Orkhan Nadirov, Khatai Aliyev, Bruce Dehning
ISSN 2071-789X
INTERDISCIPLINARY APPROACH TO ECONOMICS AND SOCIOLOGY
Economics & Sociology, Vol. 10, No. 3, 2017
273
4. Model building
Before choosing the empirical estimation method for the intended regression model, an
order of integration of the variables should be examined by employing panel unit root tests.
Here, two major points might be considered. First, the existence of a unit root problem with
model variables should be tested with and without an intercept. Meanwhile, it is noteworthy to
identify both the existence of individual and common unit root processes in panel series. To
obtain more reliable and robust results several panel unit root tests are applied in this empirical
research. This approach also enables us to address some methodological issues not considered
in previous studies (Hasanov et al., 2017).
More precisely, we use Levin, Lin, and Chu (2002), Im, Pesaran, and Shin (2003),
Breitung (2000) as well as Fisher-ADF and Fisher-PP panel unit root tests of Maddala and Wu
(1999). Note that Levin, Lin, and Chu (hereafter LLC) and Breitung assume a common unit
root process while Im, Pesaran and Shin (hereafter IPS), Fisher-ADF and Fisher-PP tests
assume the individual unit root process in panel data series. Test results provide useful
information about the integration properties of the data employed in this research.
To estimate the responsiveness of hours worked per employee to life satisfaction and
labor income tax rates, we first employ a panel multiple linear regression model as in equation
(3), and second we employ an impulse response analysis based on an unrestricted Vector
Autoregressive (VAR) model as in equation (4) below:
tti
i
i iTAX
TAXINDEXINDEXWORKED
XDUMMYLABOR
LABORDUMMYSATSATHOURSLog
t
tttt
,
4
`4
3210)( (3)
and
tti
i
i i
TAXINDEXWORKEDWORKED
X
LABORSATHOURSLogHOURSLogtttt
,
4
1
3210 111)()(
(4)
Here, 𝐻𝑂𝑈𝑅𝑆𝑊𝑂𝑅𝐾𝐸𝐷𝑡, 𝑆𝐴𝑇𝐼𝑁𝐷𝐸𝑋𝑡
, and 𝐿𝐴𝐵𝑂𝑅𝑇𝐴𝑋𝑡 are as defined previously (see
Table 4). 𝑋𝑖,𝑡 covers all institutional variables (benefit replacement rates, unemployment benefit
duration, net union density, and employment protection) added to the model to control such
effects. Institutional variables used in our regressions are taken from the Database for
Institutional Comparisons in Europe (DICE, 2017) (for more information, see Appendix B). The
error terms are denoted as 𝜗𝑡 and 𝜀𝑡, respectively.
5. Empirical results and interpretation
5.1. Unit root test results
Table 5 represents panel unit test results for all variables included, with intercept
(panel A), and with the trend and intercept (panel B). Assuming the common unit root process,
LLC concludes that hours_work, labor_tax, and density are I(0) or stationary at level while the
trend is not included. Fisher-ADF, Fisher-PP, and IPS do not reveal any individual unit root
process in hours_work, and labor_tax, giving conflicting results. However, at least one test

Orkhan Nadirov, Khatai Aliyev, Bruce Dehning
ISSN 2071-789X
INTERDISCIPLINARY APPROACH TO ECONOMICS AND SOCIOLOGY
Economics & Sociology, Vol. 10, No. 3, 2017
274
rejects the existence of unit root at a 5% significance level in all variables, except rates and
protection.
When the trend is included, LLC test results reject a common unit root process in all
variables, except duration. Breitung test reveals weak stationarity, but finds duration I(0) at the
5% significance level. To test de-trended individual unit root process, only Fisher-PP unit root
test reveals duration I(0) while protection is found as not stationary at level. For other variables,
the existence of an individual unit root process is mostly rejected.
Overall evaluation of unit root tests is that only duration and protection are weak
stationary at the level when the series are de-trended. Note that in Nadirov and Aliyev (2016),
the impact of both duration and protection over hours_work is not statistically significant. To
overcome this issue, here, we decide to run empirical estimations with as well as without these
two variables to obtain results that are more reliable.
Table 5. Panel unit root test results
Panel A: Individual Intercept
LLC Breitung Fisher-ADF Fisher-PP IPS
I(0) I(0) I(0) I(0) I(0)
Hours_work -6.237*** - 21.159*** 15.082** -2.314**
Sat_index -0.799 - 12.990* 23.817*** -0.863
Labor_tax -7.726*** - 22.777*** 16.660** -2.783***
Rates -0.317 - 10.815 12.812* 0.013
Duration 7.386 - 5.674 20.771*** -0.628
Density -5.573*** - 16.404** 4.775 -1.359*
Protection -0.120 - 1.389 1.837 0.583
Panel B: Individual Intercept and Trend
Hours_work -28.939*** -1.450* 24.699*** 10.468 -4.075***
Sat_index -2.9900*** -1.144 13.587* 35.695*** -0.509
Labor_tax -13.292*** -1.295* 33.728*** 28.194*** -2.786***
Rates -2.937*** -2.290** 13.921* 16.448** -0.524
Duration 21.340 -1.542** 2.445 18.669*** 0.257
Density -89.349*** -1.445* 25.738*** 21.264*** -12.534***
Protection -0.815 -1.696** 2.165 1.845 0.241 Note: ***, **, and * denote rejection of the null hypothesis at the 1%, 5% and 10% significance levels respectively.
Probabilities of Fisher-ADF and Fisher-PP are computed by using an asymptotic χ2 distribution while all the rest
of the tests assume asymptotic normality. Maximum lag length set to two and optimal length is specified
automatically by Schwarz (SC) criterion.
5.2. Panel OLS regression results
Table 5 tabulates panel OLS regression results obtained from the estimation of equation
(2) in two different modifications. More precisely, two institutional variables (duration and
protection) are not included in the panel regression in model (2) while both are added to the
estimated model (1). It is noteworthy once to emphasize that dummy is a binary variable
included to differentiate the impact of sat_index and labor_tax to the hours_work for the low-
and-high working hour countries.
Orkhan Nadirov, Khatai Aliyev, Bruce Dehning
ISSN 2071-789X
INTERDISCIPLINARY APPROACH TO ECONOMICS AND SOCIOLOGY
Economics & Sociology, Vol. 10, No. 3, 2017
275
Table 5. Panel OLS regression results
Independent variables Model (1) Model (2)
Sat_index 0.0889***
(0.0155)
0.0807***
(0.0102)
Sat_index*dummy -0.1187***
(0.0297)
-0.1153***
(0.0289)
Labor_tax 0.2248
(0.2298)
0.2717
(0.2161)
Labor_tax*dummy 0.6037***
(0.2654)
0.5794***
(0.2590)
Log(Rates) -0.0511*
(0.0291)
-0.0571**
(0.0233)
Log(Duration) -0.0064
(0.0261) -
Log(Density) 0.0286***
(0.0062)
0.0264***
(0.0055)
Log(Protection) -0.0137
(0.0135) -
C 7.3052***
(0.1861)
7.3299***
(0.1412)
R-squared 0.9903 0.9900
S.E. of regression 0.0078 0.0077
No. of obs. 40 40 Note: The dependent variable is log (hours_work). ***, **, and * denote rejection of the null hypothesis at the
1%, 5% and 10% significance levels respectively. Standard errors for each coefficient are given in parentheses.
Comparing the estimation results in model (1) and model (2) shows no significant
impact of excluding duration and protection. Thus, this exclusion does not lead to any
statistically significant changes as well as too small of magnitude differences for regression
coefficients. Meanwhile, the coefficients of both institutional variables are neither statistically,
nor economically, significant as in Nadirov and Aliyev (2016).
Empirical estimations indicate that the impact of sat_index over working hours is
statistically significant for both groups, but positive in countries with high working hours while
the association is negative in those with low working hours according to our sample. More
precisely, in the case of Hungary and Estonia, the average impact of a one unit positive change
in sat_index increases working hours by 8.07-8.89% while other variables are assumed to
remain the same. For Germany and France, the impact is negative ((0.0889-0.1187)*100% =
-2.98% for the model (1), and (0.0807-0.1153)*100% = 3.46%) for model (2).
For the impact of labor_tax, for high working hour countries, a 1% or 0.01 point increase
leads to 0.22-0.27% more work1. This impact is significantly higher for countries with low
working hours (0.6037%-0.2248% = 0.3789% for model (1), and 0.5794%-0.2717% = 0.3077%
for model (2)). For institutional variables, estimation results reveal a statistically significant
negative influence of rates and a positive impact of density. The remaining two institutional
variables (duration and protection) do not significantly matter for the motivation to work.
1Note that labor income tax gets a value between 0 and 1. Here, 1 point means 0.01. That is why in
interpretation we calculate, ceteris paribus, the impact as 0.2248*0.01*100%.
Orkhan Nadirov, Khatai Aliyev, Bruce Dehning
ISSN 2071-789X
INTERDISCIPLINARY APPROACH TO ECONOMICS AND SOCIOLOGY
Economics & Sociology, Vol. 10, No. 3, 2017
276
5.3. Impulse response analysis
Because all variables are I(0), we can run unrestricted VAR to obtain impulse-response
simulation results. Note that only hours_work, labor_tax, and sat_index are included as
endogenous variables while institutional variables are employed as exogenous. Meanwhile, a
binary variable is also added to the exogenous factors in order to control for working hours
difference between the two groups.
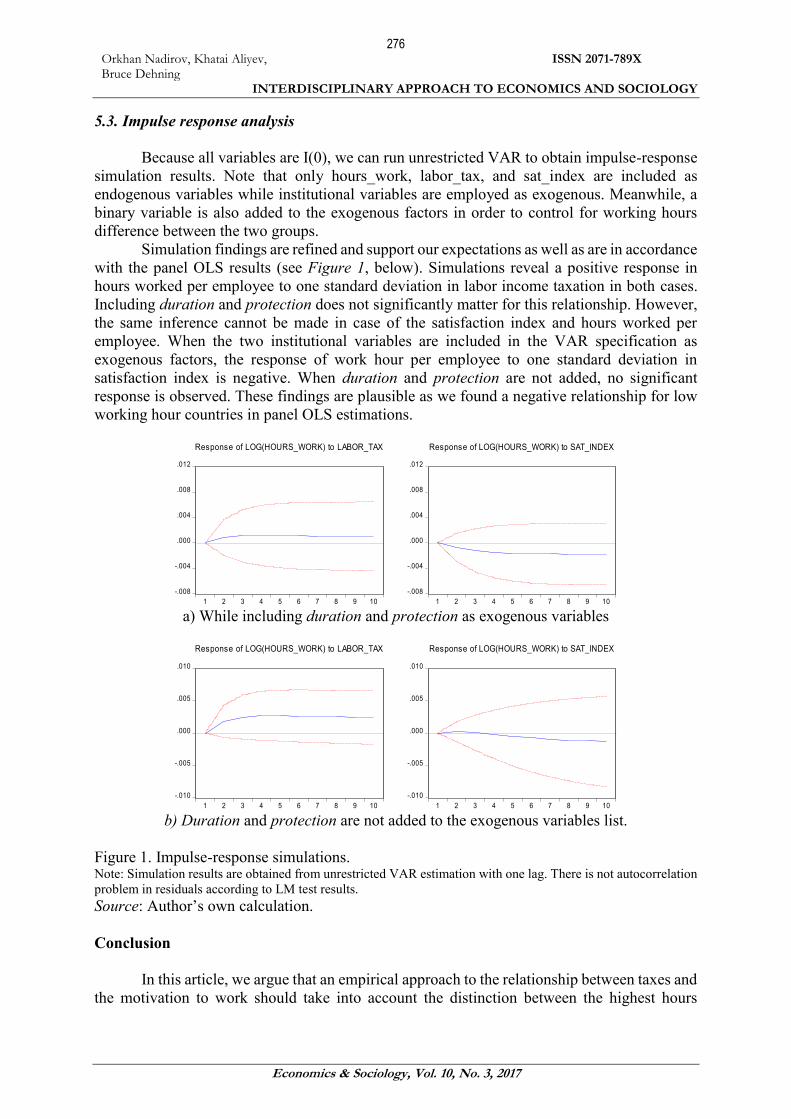
Simulation findings are refined and support our expectations as well as are in accordance
with the panel OLS results (see Figure 1, below). Simulations reveal a positive response in
hours worked per employee to one standard deviation in labor income taxation in both cases.
Including duration and protection does not significantly matter for this relationship. However,
the same inference cannot be made in case of the satisfaction index and hours worked per
employee. When the two institutional variables are included in the VAR specification as
exogenous factors, the response of work hour per employee to one standard deviation in
satisfaction index is negative. When duration and protection are not added, no significant
response is observed. These findings are plausible as we found a negative relationship for low
working hour countries in panel OLS estimations.
a) While including duration and protection as exogenous variables
b) Duration and protection are not added to the exogenous variables list.
Figure 1. Impulse-response simulations. Note: Simulation results are obtained from unrestricted VAR estimation with one lag. There is not autocorrelation
problem in residuals according to LM test results.
Source: Author’s own calculation.
Conclusion
In this article, we argue that an empirical approach to the relationship between taxes and
the motivation to work should take into account the distinction between the highest hours
-.008
-.004
.000
.004
.008
.012
1 2 3 4 5 6 7 8 9 10
Response of LOG(HOURS_WORK) to LABOR_TAX
-.008
-.004
.000
.004
.008
.012
1 2 3 4 5 6 7 8 9 10
Response of LOG(HOURS_WORK) to SAT_INDEX
-.010
-.005
.000
.005
.010
1 2 3 4 5 6 7 8 9 10
Response of LOG(HOURS_WORK) to LABOR_TAX
-.010
-.005
.000
.005
.010
1 2 3 4 5 6 7 8 9 10
Response of LOG(HOURS_WORK) to SAT_INDEX
Orkhan Nadirov, Khatai Aliyev, Bruce Dehning
ISSN 2071-789X
INTERDISCIPLINARY APPROACH TO ECONOMICS AND SOCIOLOGY
Economics & Sociology, Vol. 10, No. 3, 2017
277
worked countries and the lowest hours worked countries to help generate significant insights.
To test this conjecture, we constructed both impulse response analysis based on unrestricted
Vector Autoregressive (VAR) model and a panel multiple linear regression model in which
countries with high working hours and low working hours enter as separate factors into the
process. The econometric model was estimated and tested for four countries (Hungary, Estonia,
Germany, and France) over the period 2000-2013. The primary points from these models can
be summarized as follows. Increases in life satisfaction exert negative effects on working hours
in countries with low working hours, while it has a positive effect on working hours in countries
with high working hours. This suggests that the effect of average labor income tax rates on the
motivation to work can be assessed differently for societies who are working for normal living
standards and societies who are working for social status or other luxury items. For future
research, our idea can be tested with poor and rich countries instead of using the classification
of countries with high and low working hours. While people in poor countries might have lower
life satisfaction, people in rich countries might have greater life satisfaction; this approach can
help us to see how people in rich countries behave compared to people in poor countries when
average labor income tax rate changes.
Acknowledgement
The authors would like to thank the participants in the 3rd Global Conference on
Business, Economics, Management, and Tourism, 26-28 November 2015, Rome, Italy. The
present paper is a revised and extended version of the conference proceedings. Moreover, the
authors would like to thank the Internal Grant Agency of FaME for providing financial support
to carry out this research. Funding was extended through: TBU No. IGA/FaME/2017/018 –
“Income tax and the motivation to work”.
References
Alesina, A., Glaeser, E., & Sacerdote, B. (2005). Work and leisure in the United States and
Europe: why so different? NBER macroeconomics annual, 20, 1-64.
Bentolila, S., & Bertola, G. (1990). Firing costs and labor demand: how bad is eurosclerosis?
The Review of Economic Studies, 57(3), 381-402.
Berger, T., & Heylen, F. (2011). Differences in hours worked in the OECD: institutions or fiscal
policies? Journal of Money, Credit and Banking, 43(7), 1333-1369.
Blanchard, O. J., & Summers, L. H. (1986). Hysteresis and the European unemployment
problem. NBER macroeconomics annual, 1, 15-78.
Blanchard, O., & Jimeno, J. F. (1995). Structural unemployment: Spain versus Portugal. The
American Economic Review, 85(2), 212-218.
Blumkin, T., Ruffle, B. J., & Ganun, Y. (2012). Are income and consumption taxes ever really
equivalent? Evidence from a real-effort experiment with real goods. European Economic
Review, 56(6), 1200-1219.
Blundell, R., & MaCurdy, T. (1999). Labor supply: A review of alternative approaches.
Handbook of labor economics, 3, 1559-1695.
Blundell, R., & Shephard, A. (2011). Employment, hours of work and the optimal taxation of
low-income families. The Review of Economic Studies, rdr034.
Breitung, J. (2001). The local power of some unit root tests for panel data. In: Nonstationary
panels, panel cointegration, and dynamic panels (pp. 161-177). Emerald Group
Publishing Limited.

Orkhan Nadirov, Khatai Aliyev, Bruce Dehning
ISSN 2071-789X
INTERDISCIPLINARY APPROACH TO ECONOMICS AND SOCIOLOGY
Economics & Sociology, Vol. 10, No. 3, 2017
278
Causa, O. (2009). The policy determinants of hours worked across OECD countries. OECD
Journal. Economic Studies, 2009(1), 9.
Chen, B. L., Hsu, M., & Lai, C. F. (2015). Relative Effects of Labor Taxes and Unemployment
Benefits on Hours Worked Per Worker and Employment. Pacific Economic Review,
20(2), 282-309.
Chetty, R., Guren, A., Manoli, D., Weber, A., Sargent, T. J., Rogerson, R., ... & Yagan, D.
(2011). Are Micro and Macro Labor Supply Elasticities Consistent? A. In: Review of
Evidence on the Intensive and Extensive Margins, American Economic Review: Papers
and Proceedings, 101(3), 471-475.
Conesa, J. C., & Kehoe, T. J. (2005). Productivity, taxes and hours worked in Spain, 1970-
2003. Manuscript, University of Minnesota.
Davis, S. J., & Henrekson, M. (2004). Tax effects on work activity, industry mix and shadow
economy size: Evidence from rich-country comparisons (No. w10509). National Bureau
of Economic Research.
DICE (2017). Labor Market. Online available at http://www.cesifo-
group.de/ifoHome/facts/DICE/DICE-Search.html?DICEsearch.facet_isArchived=false.
Eurostat (2017). Hours worked per week of full-time employment.
http://ec.europa.eu/eurostat/tgm/table.do?tab=table&init=1&language=en&pcode=tps00
071&plugin=1.
European Commission (2017). Eurobarometer Interactive. Life satisfaction. Online available at
http://ec.europa.eu/commfrontoffice/publicopinion/index.cfm/Chart/index.
Faggio, G., & Nickell, S. (2007). Patterns of work across the OECD. The Economic Journal,
117(521), F416-F440.
Gollin, D. (2002). Getting income shares right. Journal of political Economy, 110(2), 458-474.
Hallam, A., & Weber, E. J. (2007). Labor taxes and work hours in Australia.
Harriss, L. (1985). Taxation, Incentives and Disincentives, and Human Motivation. American
Journal of Economics and Sociology, 44(2), 129-136.
Hasanov, F., Bulut, C., & Suleymanov, E. (2017). Review of energy-growth nexus: A panel
analysis for ten Eurasian oil exporting countries. Renewable and Sustainable Energy
Reviews, 73, 369-386.
Huberman, M. (2004). Working hours of the world unite? New international evidence of
worktime, 1870-1913. Journal of Economic History, 64(4), 964-1001.
Im, K. S., Pesaran, M. H., & Shin, Y. (2003). Testing for unit roots in heterogeneous panels.
Journal of econometrics, 115(1), 53-74.
Levin, A., Lin, C. F., & Chu, C. S. J. (2002). Unit root tests in panel data: asymptotic and finite-
sample properties. Journal of econometrics, 108(1), 1-24.
Lewis, A. (1982). The psychology of taxation. Blackwell.
Lindbeck, A. (1982). Tax effects versus budget effects on labor supply. Economic inquiry,
20(4), 473-489.
Ljungqvist, L., Sargent, T. J., Blanchard, O., & Prescott, E. C. (2006). Do Taxes Explain
European Employment? Indivisible Labor, Human Capital, Lotteries, and Savings (with
Comments and Discussion). NBER macroeconomics annual, 21, 181-246.
Ljungqvist, L., & Sargent, T. J. (2008). Taxes, benefits, and careers: Complete versus
incomplete markets. Journal of Monetary Economics, 55(1), 98-125.
Maddala, G. S., & Wu, S. (1999). A comparative study of unit root tests with panel data and a
new simple test. Oxford Bulletin of Economics and statistics, 61(S1), 631-652.
McGrattan, E. R., & Rogerson, R. (2004). Changes in hours worked, 1950-2000. Federal
Reserve Bank of Minneapolis Quarterly Review, 28(1), 14-33.
Orkhan Nadirov, Khatai Aliyev, Bruce Dehning
ISSN 2071-789X
INTERDISCIPLINARY APPROACH TO ECONOMICS AND SOCIOLOGY
Economics & Sociology, Vol. 10, No. 3, 2017
279
Maslow, A. H. (1954). The instinctoid nature of basic needs. Journal of Personality, 22(3), 326-
347.
Meghir, C., & Phillips, D. (2010). Labor supply and taxes. Dimensions of Tax Design: The
Mirrlees Review, 202-74.
Mendoza, E. G., Razin, A., & Tesar, L. L. (1994). Effective tax rates in macroeconomics:
Cross-country estimates of tax rates on factor incomes and consumption. Journal of
Monetary Economics, 34(3), 297-323.
McDaniel, C. (2007). Average tax rates on consumption, investment, labor and capital in the
OECD 1950-2003. Manuscript, Arizona State University, 1960-2004.
Mocan, N. H., & Pogorelova, L. (2015). Why work more? The impact of taxes, and culture of
leisure on labor supply in Europe (No. w21297). National Bureau of Economic Research.
Nadirov, O., & Aliyev, K. (2016). The motivation to work, Labor Income Taxes and Life
Satisfaction: Hungary, Estonia, Continental Europe and the United States. Procedia
Economics and Finance, 39, 373-379.
Nickell, S. (1997). Unemployment and labor market rigidities: Europe versus North America.
The Journal of Economic Perspectives, 11(3), 55-74.
Nickell, S., Nunziata, L., Ochel, W., & Quintini, G. (2003). The Beveridge Curve,
Unemployment and Wages in the OECD from the 1960s to the 1990s (pp. 394-431).
Princeton: Princeton University Press.
Nicoletti, G., & Scarpetta, S. (2001, June). Interactions between product and labor market
regulations: do they affect employment? Evidence from OECD countries. In: Conference
on “Labor Market Institutions and Economic Outcomes.” Lisbon: Bank of Portugal.
OECD (2008). Going for Growth, Paris.
OECD (2017a). OECD statistics – Average usual weekly hours worked on the main job. Online
available at https://stats.oecd.org/Index.aspx?DataSetCode = ANHRS.
OECD (2017b). OECD statistics – Average annual hours actually worked per worker. Online
available at https://stats.oecd.org/Index.aspx?DataSetCode = ANHRS.
OECD (2017c). OECD statistics – National Accounts at Glance. Online available at
https://stats.oecd.org/Index.aspx?DataSetCode = NAAG.
Ohanian, L., Raffo, A., & Rogerson, R. (2008). Long-term changes in labor supply and taxes:
Evidence from OECD countries, 1956-2004. Journal of Monetary Economics, 55(8),
1353-1362.
Olovsson, C. (2009). Why do Europeans work so little? International Economic Review, 50(1),
39-61.
Prescott, E. C. (2002). Prosperity and depression. The American Economic Review, 92(2), 1-15.
Prescott, E. C. (2004). Why do Americans work so much more than Europeans? (No. w10316).
National Bureau of Economic Research.
Rogerson, R. (2007). Taxation and market work: is Scandinavia an outlier? Economic theory,
32(1), 59-85.
Rogerson, R. (2008). Structural transformation and the deterioration of European labor market
outcomes. Journal of political Economy, 116(2), 235-259.
Stuart, C. E. (1981). Swedish tax rates, labor supply, and tax revenues. Journal of Political
Economy, 89(5), 1020-1038.
Veblen, T. (1899). The theory of the leisure class: An economic study in the evolution of
institutions. Macmillan.

Orkhan Nadirov, Khatai Aliyev, Bruce Dehning
ISSN 2071-789X
INTERDISCIPLINARY APPROACH TO ECONOMICS AND SOCIOLOGY
Economics & Sociology, Vol. 10, No. 3, 2017
280
Appendix
Appendix A.
Table 6. Average Tax on Labor, τh
Years Estonia France Germany Hungary United States
2000 0.359 0.363 0.385 0.390 0.239
2001 0.362 0.360 0.380 0.374 0.237
2002 0.356 0.354 0.379 0.370 0.215
2003 0.355 0.356 0.379 0.368 0.205
2004 0.358 0.363 0.381 0.365 0.238
2005 0.363 0.361 0.380 0.386 0.236
2006 0.358 0.355 0.383 0.384 0.215
2007 0.360 0.354 0.382 0.382 0.210
2008 0.359 0.361 0.385 0.390 0.240
2009 0.364 0.360 0.382 0.388 0.242
2010 0.358 0.359 0.381 0.380 0.239
2011 0.361 0.357 0.379 0.383 0.243
2012 0.359 0.362 0.388 0.396 0.241
2013 0.363 0.360 0.386 0.388 0.238
Source: Author’s own calculation.
Appendix B.
Table 7. Institutional variables
• Employment protection. This variable is higher the stricter the employment protection legislation, with a
range {0,2}.
• Net union density. This variable measures the fraction of workers that were union members over the
sample period covered.
• Benefit replacement rates. This variable measures the percentage of (average before tax) earnings
covered through unemployment and social insurance programs.
• Benefit duration. This variable is a proxy for the duration of unemployment benefit specified above. A
value of zero indicates that the unemployment benefit provision stops within the first year. A value of one
indicates that unemployed receive the amount defined in BRR for five years.
Source: Author’s own elaboration based on Ohanian et al., 2008.