to the extent assay micropropagatedplants of begonia hiemalis
TRANSCRIPT

Acta Bot. Need. 39(2), June 1990, p. 145-151
145
An assay to measure the extent of variation in
micropropagated plants of Begonia x hiemalis
G.-J. de Klerk J. ter Brugge and H. Bouman
Central Research Laboratoryfor Tissue Culture ofHorticultural Crops, Lisse, The Netherlands
SUMMARY
The extent of somaclonal variation is usually assessed by determining
the percentage of plants aberrant for a specific trait (e.g. phenotypical
characteristics, chromosome number, electrophoresis pattern of
proteins). We have assessed the extent of variation in micropropagated
plants of Begonia x hiemalis cv. Schwabenland Red in another way. In
three somaclonal populations the value of the standarddeviation(SD)
ofa quantitative trait was determined, namely the SD ofthe natural
logarithm of the ratio of the lengths of two leafribs (SD of In c/a).
Plants, regenerated fromcallus, induced and maintainedat a high
concentrationof 2,4-dichlorophenoxyacetic acid (2,4-D), had a
significantly larger SD, whereas the mean was not affected at all. The
observed increase of the SD is likely to have been caused by somaclonal
variation, but epigenetic variation cannot be ruled out. It is concluded
that differences in the valuesof the SD may be used to assess
differencesin the extent of variation.
Key-words: Begonia hiemalis, micropropagation, somaclonalvariation.
INTRODUCTION
Correspondence; Dr G.-J. de Klerk, Central Research Laboratory for Tissue Culture of Horticultural Crops,
PO Box 85,2160 AB Lisse, The Netherlands.
Micropropagated plants of variousornamental crops show aberrant phenotypes. In The
Netherlands at present, this causes losses of over US$1 million per year. It is not known
whether the observed variation is somaclonal (i.e. genetic) or epigenetic (i.e. non-genetic),
but in orchids, Anthuriumand Saintpaulia, the variation is probably somaclonalbecause
micropropagation occurs via adventitious buds and, in the case of Anthurium, with
an extended callus interphase. Somaclonalvariationis also amajor obstacle in biotechno-
logical breeding techniques, such as genetic engineering and the production of haploid
plants.
Knowledge of the causes and mechanisms of somaclonal variationis very limited. One
ofthe major obstacles for rapid progress ofresearch is the absence ofan accurate and easy
assay to assess the extent of somaclonal variation (Orton 1983; De Klerk 1990). Usually,
somaclonal variation is measured as the percentage of plants showing aberrations in
phenotypical characteristics, chromosome number, chromosome structure, DNA
sequences or protein/isozyme patterns. For such qualitative assays, at least 100 plants are
146 G.-J. DE KLERK, J. TER BRUGGE AND H. BOUMAN
In this communicationwe present the first results of our research aimed at the develop-
ment of an easy and accurate quantitative assay for somaclonal variation. We have
examined whether the value of the standard deviation (SD) of a quantitative trait can be
used to assess the extent of somaclonal variation. We regenerated plantlets immediately
on leaf explants or after a callus interphase on a low or a high concentration of 2,4-
dichlorophenoxyacetic acid (2,4-D). As expected, these conditions will result in an
increasing extent of somaclonal variation (cf. De Klerk 1990). The experiments were
carried out with Begonia x hiemalis cv. Schwabenland Red. For this begonia, variation in
micropropagated plants has been reported previously (Westerhof et al. 1984). In
addition, micropropagation of this begonia has also been examined extensively (Hilding
& Welander 1976; Mikkelsen & Sink 1978; Welander 1979; Takayama & Misawa
1982).
MATERIALS AND METHODS
Plants of Begonia x hiemalis (Fotsch.) cv. Schwabenland Red were purchased from local
growers. The plants were used shortly before or during the early period of flowering.
Leaves of 6-10 cm were surface-sterilized for 15 min in 1 % (w/v) solution of NaOCl and
rinsed three times with sterile water. Explants of 1 x 1 cm were cut and placed with the
basal side down on 14 ml medium in 60-ml culture tubes. About halfof the explant was
submerged in the medium. The basal medium(modified from Hakkaart & Versluijs 1983)
was composed of MS macro- and micronutrients (Murashige and Skoog 1962) at half
stength, lOOmgl-1
myo-inositol, 0-4mgl-1
thiamine-HCl, 10g 1 —1 sucrose and 7gl~'
agar (Difco Bacto). For induction, the basal medium was supplemented with (i) 0-1 mg 1~ 1
a-naphthaleneacetic acid (NAA) + 0-2mgl~' 6-benzylaminopurine (BAP), (ii) 005
mgl-1
2,4-D +0-2 mg I-1
BAP, or (iii) Imgl-1
2,4-D + 0-2 mg I -1 BAP. The culture
temperature was 20°C and, unless indicated otherwise, the light intensity 30 pE m“2
s-1
(Philips TL 33) for 16 h per day.
After 10 days of induction in the dark on medium i, the explants were transferred to
basal medium. Regenerated plantlets were transferred to rooting medium2 months after
the start of the culture. The rooting medium had the same composition as the basal
mediumexcept for the reductionofNH4N0
3to 82 mg 1“ 1 . Explants culturedon mediumii
or iii generated only callus. Threemonths after the start of the culture, pieces of callus of
3x3x3 mm were transferredto the NAA/BAP-medium. Two (medium ii) or 4 (medium
iii) months after the transfer to NAA/BAP-medium, regenerated plantlets were trans-
ferred to rooting medium. The final number of plants was 21 (i), 16 (ii) or 31 (iii)
respectively.
After 3 weeks on rooting medium, the rooted plantlets were transferred to soil in a
greenhouse at 20-25°C and weaned. As a rule, this begonia is sprayed with 2-chloroethyl-
trimethylammonium chloride (CCC). However, because such spray may mask dwarf-
mutants, the regenerated plants were not sprayed with CCC. After another3 months, the
plants flowered. They were evaluated for gross phenotypic aberrations and from each
plant the shape of a leafofapproximately 15 cm was determinedby measuring the lengths
of ribs a and c (see Fig. 1). The leaf was located on one of the main stems at the third or
fourth position from the apex. There were four or five more leaves on the stem below this
leaf.
required to obtain statistically reliable data. In addition, the assays are time-consuming
and, in the case of judging the phenotype, dependent upon the eye of the observer.

AN ASSAY TO MEASURE VARIATION 147
RESULTS
Bud and callus induction
Explants cultured for 10 days on NAA/BAP-medium and subsequently transferred to
basal mediumshowed the formationofonly few buds (3-5 per explant) after 2 weeks.
Explants culturedon 01 mg 1“
1 2,4-D + 0-2 mg 1~
1 BAP formedyellow-green, hardand
fast growing callus.After transfer to NAA/BAP-medium, plantlets differentiatedrapidly.
Explants cultured on 1 mg 1“ 1 2,4-D + 0-2 mg 1“ 1 BAPformed yellow-brown, soft and
slowly growing callus. After transfer to NAA/BAP-medium, plantlets differentiated
slowly.
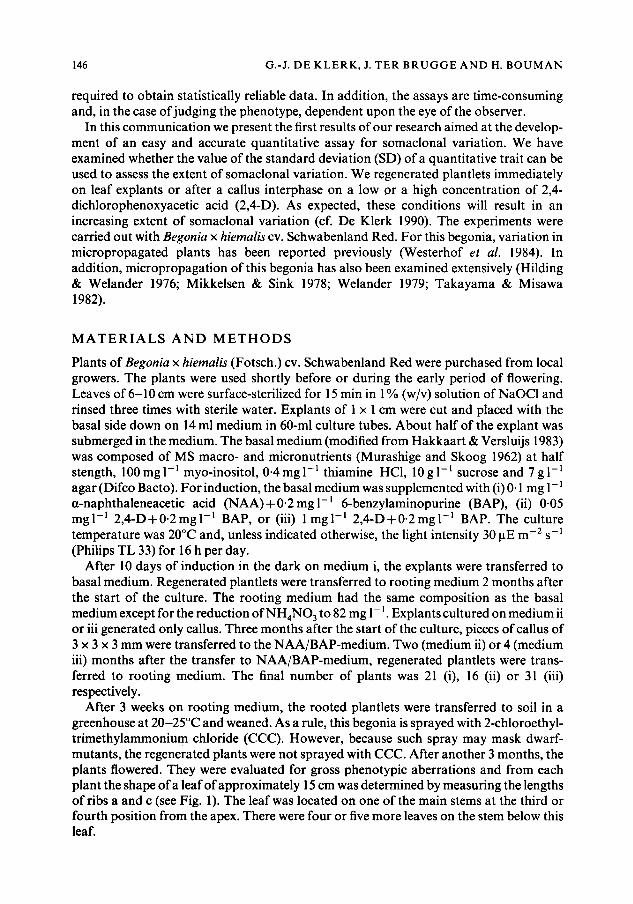
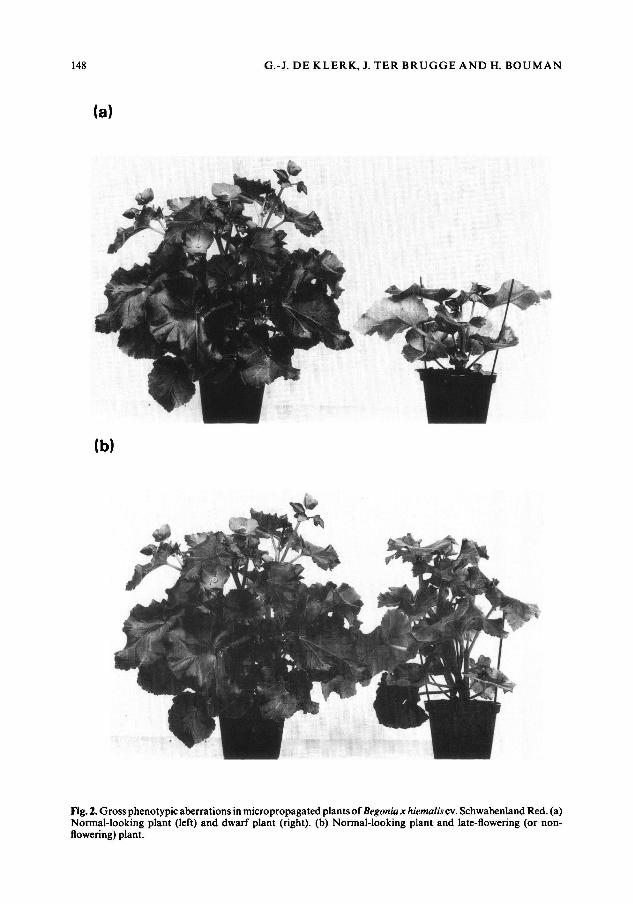
Gross phenotypic alterations
A smallpercentageof the plants (approximately 10%) showed obvious aberrations.Most
notable were dwarfand non-flowering/late-flowering plants (Fig. 2). The percentages of
aberrant plants of the three groups were not statistically different.It should be noted that
the sample sizes were small.
Increased variation of the leafshape
From each plant, the lengths of two ribs (a and c, see Fig. 1) of a leafof approximately
15 cm were determined. Then, for each leaf In c/a was calculated. Using the ratio c/a
instead of In c/a would result in an asymmetric treatment of a and c. Moreover, the
analysis should be based on the parameter most normally distributed. In each group, the
skewness of In c/a was closer to zero than the skewness of c/a.
Figure 3 shows the mean values of c, a and In c/a, and the SD of In c/a for the three
groups. The mean values of c and a demonstrate that in the three groups, leaves of the
same size had been selected. The mean valuesofIn c/a were almost exactly the same for the
three groups. However, the value of the SD of In c/a in the sample of plants regeneratedfrom callus grown in the presence of 1 mg I
-12,4-D differed significantly from the SD in
the two other samples (P<001 and P<005).
Fig. 1. A leaf ofBegoniax hiemalis cv. Schwabenland Red. Ribs a and c are indicated
148 G.-J. DE KLERK, J. TER BRUGGE AND H. BOUMAN
(a)
(b)
Begoniax hiemalis cv. Schwabenland Red. (a)
Normal-lookingplant (left) and dwarf plant (right), (b) Normal-lookingplant and late-flowering (or non-
flowering) plant.
Fig. 2. Grossphenotypic aberrations in micropropagatedplants of

AN ASSAY TO MEASURE VARIATION 149
DISCUSSION
It has been notedthat in somaclonal populations the spread of the values ofquantitative
traits is larger than in control populations (Karp & Bright 1985). To our knowledge the
valueofthe SD has only been used in few papers to describe the extent of variation (see De
Klerk 1990). Most notably, Jackson & Dale(1989) reported an increase of the coefficient
of variation (i.e. the proportional SD) for various quantitative traits in the progeny of a
regenerated plant after selling relative to selfed control plants. They did not observe any
changes on the chromosomal level and in isozyme patterns which demonstrates the sensi-
tivity of an assay based on the SD. Similar results were obtained in rice by Zheng et al.
(1989). In our experiments, we observed an increase of the SD of the leafshape (measured
as In c/a) in plants regenerated from callus induced at a high concentrationof2,4-D. Only
some ofthe plants in this group showed gross phenotypical changes and the percentageof
these plants was not statistically differentfrom the percentages of grossly aberrant plants
in the other groups: because of the small numbers in each group, only large differences
betweenpercentages wouldhave been statistically significant. This indicates the sensitivity
ofan assay based on the SD.
Fig. 3. Analysis ofthe leaf shapeofthree groups of plants,namely 21 plants regenerateddirectly on leaf explantson medium i (NAA), 16plantsregeneratedafter acallus interphase onmedium ii (0-1 mg I 1 2,4-D), and 31plants
regeneratedafter a callus interphase on medium iii (1-0 mg 1“' 2,4-D). (a) Mean values of leafribs a and c (see
Fig. 1 for explanation); (b) mean values of In c/a; (c) SD of In c/a. The SD of plants from medium iii differs
signficantly from the SDs of the otherplants (*/> <005; **P<001).

150 G.-J. DE KLERK, J. TER BRUGGE AND H. BOUMAN
We do not know whether the observed increase of the SD of In c/a is dueto somaclonal
or to epigenetic variation. Some lines of evidence indicate an epigenetic nature. First, it is
known that the leaf shape is affected by applied plant growth regulators such as zeatin
(Harte & Wallroth-Marmor 1988). We observed that the first leaves formed during tissue
culturewere round(In c/a = ±0). The increase of the SD could therefore be the result of an
epigenetic effect of tissue culture factors still being strong in some plants but weak in
others. Secondly, Wang & Holl (1988) reported that in red clover plants micropropagated
through axillary buds, the SD of the length-width ratiowas significantly larger than the
SD in control plants. In plants generated from pre-existing meristems only epigenetic
variationsoccur (De Klerk 1990).
Other evidence, though, suggests a genetic cause for the increase of the SD. First,
epigenetic variation would probably also affect the value of the mean of In c/a. As we
foundthat this mean was almost the same for the three groups(Fig. 3b) and that only the
SD was affected (Fig. 3c), high 2,4-D apparently had a random effect: the leaves were
sometimeswider (decrease of In c/a) and other times longer (increase of In c/a) than the
‘control’ leaves. Such randomeffect strongly indicates the occurrence of genetic mutations
(cf. De Klerk 1990). Secondly, it is known that leaf shape is under the control of genetic
factors and that these factors have a considerably larger effect than added hormones
(Harte & Wallroth-Marmor 1988). Finally, we have found that leaf shape is stable from
the third to the fifth leaf from the apex and that the major factor causing variation is not
the position of the leafon the plant, but the individualplant (G. J. De Klerk unpublished
observations). Together, these data strongly indicate that the observed increase of the
SD is due to an increased extent of somaclonal variation. At present, we are examiningthis in more detail. As the begonia Schwabenland Red is triploid (Arends 1970), and
consequently sterile, we cannot examine the sexual progeny.
In conclusion, we have shown that the value of the SD of the leaf shape (determined as
In c/a) can be used to assess the extent of variation. Although epigenetic variationcannot
be ruled out, it is likely that the observed increase of the SD of In c/a was caused by
somaclonal variation.
ACKNOWLEDGEMENTS
We wish to thank Dr Rob Rogers for the reading of the manuscript and Annie Paffen for
technical assistance.
REFERENCES
Arends, J.C. (1970): Somatic chromosome numbers
in ‘Elatior’-begonias. Meded. Landhouwh.
Wageningen 70:1-18.
De Klerk, G.J. (1990): How to measuresomaclonal
variation. Acta Bot. Neerl. 39: 129-144.
Hakkaart, F.A. & Versluijs, J.M.A. (1983): Control
of leaf curl and Xanthomonas begoniae in begonia
‘Elation’ by meristem culture and an isolation test.
Acta Hortic. 131:299-301,
Harte, C. & Wallroth-Marraor,L. (1988): Reaction
of mutants of Anthirrhinum majus L. to the appli-
cation of growth substances. Biol. Zent. bl. 107:
505-516.
Hilding, A. & Welander, T. (1976): Effects of some
factors onpropagation of Begonia hiemalis in vitro.
Swedish J. Agric. Res. 6: 191-199.
Jackson, J.A. & Dale, PJ. (1989): Somaclonal vari-
ation in Lolium multiflorumL. and L. temulentum L.
Plant Cell Rep. 8: 161-164.
Karp, A. & Bright, S.W.J, (1985): On the causes and
origins of somaclonal variation. In: Miflin, B.J.
(ed.): Oxford SurveysofPlant Molecular Biology. 2:
199-234. Oxford University Press, Oxford.
Mikkelsen, E.P. & Sink, K.C. (1978): In vitro propa-
gationofRieger Elatior begonias. Horl. Science 13:
242-244.

AN ASSAY TO MEASURE VARIATION 151
Murashige, T. & Skoog, F. (1962): A revised medium
for rapid growth and bioassays with tobacco tissue
cultures. Physiol. Plant. 15:473-497.
Orton, T.J. (1983): Experimental approaches to the
study of somaclonal variation. Plant Mol. Biol. Rep.
1:67-76.
Takayama, S. & Misawa, M. (1982): Factors affecting
differentiation and growth in vitro, and a mass-
propagation scheme for Begoniax hiemalis. Sci.
Horlic. 16: 65-75.
Wang, H.&Holl.F.B. (1988): In vitroculture and the
incidence of somaclonal variation in regenerated
plants of Trifolium pralense L. Plant Sci. 55:
159-167,
Welander, T. (1979): Influence of medium compo-
sition on organ formation in explants of
Begonia x hiemalis in vitro. Swedish J. Agric. Res. 9:
163-168.
Westerhof, J., Hakkaart, F.A. & Versluijs, J.M.A.
(1984): Variation in two Begoniax hiemalis
clones after in vitro propagation. Sci. Hortic. 24:
67-74.
Zheng, K..-L., Zhou,Z.-M. Wang, G.-L., Luo, Y.-K.
& Xiong, Z.-M. (1989); Somatic cell culture of rice
cultivars with different grain types: somaclonal
variation in some grain and quality characters.
Plant Cell, Tissue Organ Culture 18: 201-208.