to the by la, 0. l. j. h. publishing, bnf 96 126
TRANSCRIPT

To be published in: Procedings of the Raman Emission by X-rays Workshop, New Orleans, LA, 1996, edited by 0. L. Ederer and J. H. McGuire (World Scientific Publishing, UK). / e bNf - 96 126 / -
'3.k INTERPRETING X-RAY AND AUGER RESONANT RAMAN SPECTRA
T. LEBRUN ECE$VED Physrcs Dzvlszon, Argonne National Lnborufoy, Argonne, II
APR 1 4 1997
O S T I We discuss resonant Raman Scattering in atoms within the context of conservation of energy, arguing that energy conservation determines the prinapal features of spectra taken at a resolution comparable to the natural widths of the transitions involved. Example systems applicable to atoms or solids are calculated using the model by Tulkki and Aberg, and the model is discussed in terms of energy conservation. Finally, results for X-ray resonant Raman scattering in Xe and Auger resonant Raman scattering in Ar are presented and the two processes are contrasted.
I Introduction
Resonant Raman scattering has recently emerged as a promising technique for studying the inner-shell electronic structure of atoms, molecules, and solids1-'. The surge of interest largely stems from the effective enhancement in the resolution of the electronic structure of core-excited states which is possible with the technique. The word "effective" is carefully chosen here because the correct interpretation of these spectra is still a subject of debate. We will discuss the principal features of these spectra in terms of energy conservation to build up an intuitive picture of the scattering process, and develop a context for understanding theoretical and experimental results. An understanding of the spectra for atomic systems also provides a basis for interpreting spectra of more complex systems such as solids. The analysis in terms of energy conservation is illustrated by calculations using the model developed by Tulkki and Aberg from the resonant scattering theory" '-lo. Indeed, much of the analysis reported in section 2 is not new but was anticipated by these authors, however the level of confusion and controversy surrounding resonant Raman scattering warrants its discussion here. We close with examples of x-ray and Auger resonant Raman spectra in atoms which allow the simple interpretation of section 2 to be tested against experimental data.
7 .1 Background and Mofiuation of this Work
X-ray resonant Raman scattering is resonant inelastic scattering. It was first observed by Sparks using a Cu K a source to irradiate a variety of targets", and subsequently investigated by Eisenberger et. and Briand et. using synchrotron radiation. The field benefited from e d y theoretical support by Tulkki and her$. '-lo who described the process In terms of the resonant scattering theory, and also derived a simplified rode1 which continues to provide valuable guidance to experimentalists. PJote that our use of the term "the Tulkki-.&berg model" (TA) in the following sections refers to this simplified model. Other authors have derived similar models from the Kramers- Heisenberg formula3 which share the characteristic of neglecting interference between different intermediate states. We view these models as providing a useful context for understanding measurements and theoretical calculations, so that the effects of interference in the spectra can be more easily identified. One of
The wbrnitted rnanvartpt has been authored bv a Contractor of the U. S. Government under contracl No. W-31-104ENG-38 Accordingly, thc U. S Government retains a nonercluave. roysltv-frec Icenre 10 wbltsh 0. remoduce the publ,shsd form of thtr contribUtion. or atlow others 10 do Io, tor i i! C Govrrnment wrposei

DISCLAIMER
This report was prepared as an account of work sponsored by an agency of the United States Government. Neither the United States Government nor any agency thereof, nor any of their employees, make any warranty? express or implied, or assumes any legal liabdi- ty or responsibility for the accuracy, completeness, or usefulness of any information, appa- ratus, product, or process disdosed, or represents that its use would not infringe privately owned rights. Reference herein to any specific commercial product, process, or service by trade name, trademark, manufacturer, or otherwise does not necessariiy constitute or imply its endorsement, recommendation, or favoring by the United States Government or any agency thereof. The views and opinions of authors expressed herein do not necessar- ily state or reflect those of the United States Government or any agency thereof.

Portions of this document may be illegible in electronic image products. Images are produced from the best available original dOl.ument
the central themes of this paper is that neglecting interference does yield a good first-order understanding of the experimental spectra, and that s&tilar results can be derived from energy conservation.
2 Phenomenology
We distinguish two processes: resonant excitation and photoionization, which represent two extremes of the behavior encountered in real systems. Here, resonant excitation means that the inner-shell electron is initially excited to a quasi-bound state and remains in interaction with the ion during the subsequent relaxation. Ionization means that the excited electron is immediately ejected from the ion and does not interact further with the ion. Note that this description therefore neglects PCI which will not be brought into the discussion until the Auger results are discussed at the end of this article. In addition, we will assume that the intermediate core-hole state is sufficiently long-lived to treat the relaxation as a two-step process.
2.1 Resonant Excitation
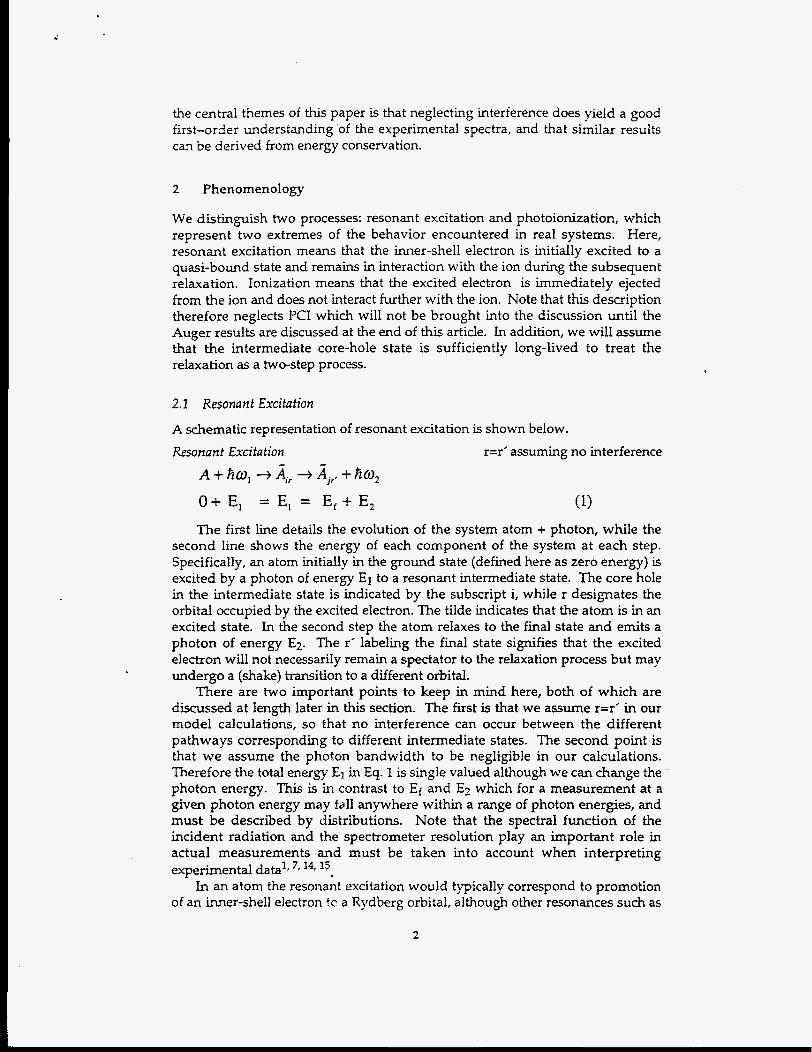
A schematic representation of resonant excitation is shown below.
Resonant Excifafion r=r' assuming no interference
The first line details the evolution of the system atom + photon, while the second line shows the energy of each component of the system at each step. Specifically, an atom initially in the ground state (defined here as zero energy) is excited by a photon of energy El to a resonant intermediate state. The core hole in the intermediate state is indicated by the subscript i, while r designates the orbital occupied by the excited electron. The tilde indicates that the atom is in an excited state. In the second step the atom relaxes to the final state and emits a photon of energy E2. The r' labeling the final state signifies that the excited electron will not necessarily remain a spectator to the relaxation process but may undergo a (shake) transition to a different orbital.
There are two important points to keep in mind here, both of which are discussed at length later in this section. The first is that we assume r=r' in our model calculations, so that no interference can occur between the different pathways corresponding to different intermediate states. The second point is that we assume the photon bandwidth to be negligible in our calculations. Therefore the total energy El in Eq. 1 is single valued although we can change the photon energy. This is in contrast to Ef and E2 which for a measurement at a given photon energy may fall anywhere within a range of photon energies, and must be described by distributions. Note that the spectral function of the incident radiation and the spectrometer resolution play an important role in actual measurements and must be taken into account when interpreting experimental datal. 71 l 4 r 15.
In an atom the resonant excitation would typically correspond to promotion of an inner-shell electron !e a Rydberg orbital, although other resonances such as
2

multi-electron excitations above threshold can also be studied. We will illustrate this shortly for the excitation of the 7p3 2 level in Xe, but we will begin by restricting ourseives to model systems which are equally applicable to atoms or solids. While the example systems we use are almost cartoon-like in their simplicity, they have the advantage of clarifying important points which are common sources of confusion.
Consider Eq. 1 for a single intermediate state with a natural width rl and assuming a negligible excitation bandwidth. We can resonantly excite the state over a range of incident photon energies El determined by the natural width r, of the intermediate state (Le. in the absorption spectrum the state appears as a Lorentzian resonance of width rl centered at the excitation energy of the intermediate state Iir). The total energy is just El, and has a well defined value without any energy spread because the incident energy bandwidth is negligible. In the final state the system separates into two non-interacting components atom + photon but the system is entangled in the quantum mechanical sense and the energies of the atom Ef and the photon E2 are not separately well defined. Instead the values of Ef and E2 that would be measured are represented by distributions. Because Ef and E2 must sum to a constant (the total energy), their distributions are simply related and have the same width - the natural width of the f ina l state. As discussed in the next section, the width of the characteristic fluorescence (fluorescence following excitation well above threshold) is the sum of the natural widths of the intermediate and final states. Hence the resonant scattering allows the spectral width to be reduced when the incident bandwidth is less than the natural width of the intermediate state. This is the narrowing effect which is responsible for the surge of interest in resonant Raman scattering. In the context of the model discussed here (no interference) it is purely a consequence of energy conservation.
The other distinguishing feature of resonant scattering can be seen if we temporarily assume that the final state is not broadened by subsequent relaxation. In this case the energy of the final state Efis constant and it is clear that the fluorescence energy E2 must v a n 1 to 1 with the excitation energy El. When broadening is included, the fluorescence energy represented by the center of the fluorescence peak displays the same one-to-one dispersion with the incident photon energy.
To gain a full picture of this photon-idphoton-out process, laying aside for the moment questions of polarization and angular distributions, we study the scattering intensity as a function of the incident and the scattered photon energies. An example spectrum calculated for resonantly exciting two discrete intermediate states which then undergo radiative decay to two final states is shown in Fig. 1. These states might correspond to excitons below a band edge, or Rydberg states below an ionization threshold. The calculations use the model of Tulkki and Aberg 2r '-lo, which is discussed in more detail in section 2.3, to illustrate the characteristics of these spectra. The natural width of the final state has been chosen to be small compared to the energy spacing between the states, which is comparable to the natural width of the intermediate state. The top left inset shows the level diagram. The spectrum at the bottom of Fig. 1 represents a series of fluorescence spectra taken at closely spaced excitation energies. For clarity only the peaks resulting from resonant excitations are shown. The top right inset represents a top view of the spectrum.
3

:$ E l
I
Figure 1: Resonant excitation. At the bottom is an example x-ray resonant Raman spectrum of two discrete states. The upper left inset shows the level scheme and the right inset schematically shows a top view of the spectrum.
From the preceding discussion we expect the fluorescence from relaxation of a given state to increase in energy as the photon energy is increased, while the intensity as a function of El should follow the absorption profile. Here we have two states of the excited electron, and therefore two peaks which disperse in a 1:l fashion with the excitation energy. This is also illustrated schematically in the upper right inset of Fig. 1 where the dispersion of the two peaks are represented by diagonal lines with dots indicating the absorption maximum of each state. Although continuum excitation is not included in the example spectrum, the continuum edge is indicated in the inset by a short horizontal line to relate the resonant peaks to the characteristic fluorescence described in the next section. The energy of the characteristic fluorescence relative to the resonant peaks is indicated by the vertical line. In this simple case the maxima of the resonant peaks fall at the same energy as the characteristic fluorescence. In practice this will not necessarily be the case, particularly for final states where a hole in an outer shell can couple strongly with the excited electron.
The difference between the width of the absorption profiles and the widths of the peaks in the fluorescence spectra can also be seen from the example spectrum. If the spectrum is integrated over E2 and plotted along the El axis, the resulting curve would mirror the absorption spectrum3. The peak structure in the integrated spectrum would be broad (characterized by a width ri) and the two peaks would not be resolved. But in the fluorescence spectrum, which is a slice at constant El through the long resonant Raman peaks, the two component peaks are easily distinguished.
This raises an important point which has been the source of some confusion. The peaks in the fluorescence spectrum taken at some photon energy El correspond to differentfinal states - the intermediate state through which the system passed is unknown in a real measurement. In addition, the spacing and widths of the peaks in the fluorescence spectrum are, apart from interference, determined by the final states. Our access to the intermediate density of states is
4

through the variation of the fluorescence intensities as the excitation energy is scanned. The fluorescence intensity depends on the transition amplitude from the ground state to the intermediate state, which is why the intensity variations with El in the example spectrum mirror absorption profiles. A resonant peak in the Raman spectrum identifies the final state which, when interference between different intermediate states is neglected, determines the intermediate state because the excited electron is assumed to remain a spectator to the relaxation process. This then is the nature of the enhanced effective resolution in the model system: when interference is ignored peaks in the Raman spectrum identify unique intermediate states. And, although nothing has changed regarding the density or widths of the intermediate states, the resonant Raman peaks are distinct, allowing the excitation of each intermediate state to be followed individually.
This is not strictly true for real systems, where the interference between different intermediate states can not be neglected, and this point constitutes an active area of discourse in current x-ray Raman studies. Whether simple models such as the one used here are appropriate to the interpretation of experimental spectra is a key question, and the answer depends upon the experimental conditions, among other factors. For example, good agreement has been found between such models and measurements of both x-ray3 and Auger resonant Raman scattering4, 16. So the Tulkki-Aberg type models provide a good first order description of existing experimental results. However, measurements and calculations have pointed out the timitations of simple pictures such as the one used here2# 6# ”-”, and it is necessary to include interference effects to go beyond the first order picture and more completely understand these spectra.
2.2 Confinuum Excifation = lonizafion
The essential difference between continuum excitation and resonant excitation in the picture used here is that for continuum excitation the system separates into two non-interacting components in the infermediate state - the photoelectron and the core-excited ion. This is illustrated in the following diagram and equation which are analogous to those presented for resonant excitation.
Ionization p=p’ assuming no interference
A+AU, -+ 4 +e, +A, +ha, + e ,
O+E, = Ei + E , = E/ + E, +E,, ( 2 )
If we assume as before that the incident photon energy has a negligible
bandwidth, then Ei + $ is the total energy El. The energy sharing here is analc,gous to that found for the final state after resonant excitation: the total energy is well defined, but the system has broken into two non-interacting components, so the energy of each is described by a Lorentzian distribution truncated by kinematics. The Lorentzian distribution of the fluorescence energy is strongly modified for excitation near threshold - the high energy side is effectively cut off because the photoelectron necessarily has a nonnegative energy. We will begin by briefly discussing the width of the Lorentzian distribution characterizing the emitted fluorescence, and then describe the manner in which it is truncated.
5

We are interested in the form of the distribution that characterizes the
fluorescence energy E2 (i.e. the peak shape). From Eq. 2, E2 = El - ( E f i q ) , which because El has a set value and a negligible bandwidth implies that the
distribution representing E2 is given by the distribution for the sum of Ef and (with the appropriate change of variables). If the excitation energy El substantially exceeds the threshold energy (the case of characteristic
fluorescence), the distribution for E, is a Lorentzian with width Ti. The distribution for Ef is a Lorentzian with width Tf so the distribution representing
Ef i Ep is also a Lorentzian distribution but with a width of Ti i Tf because the distribution for the sum of two independent random variables is the convolution of the individual distributions. This is the well known result for characteristic fluorescence, and in fact transitions in general, that the peak width is the sum of the natural widths of the initial and final states.
For excitation near threshold, however, the fluorescence peak shape is strongly modified. Because the photoelectron energy is non-negative Ei <= El, so the distribution for Ei is a Lorentzian truncated to zero for values of 5 greater that El. For example at threshold the high-energy half of the distribution of El will be truncated. Because the distribution for E2 is just the convolution of the distributions for Ei and Eb the peak for E2 will be truncated in similar manner, although less sharply because the cut-off is smoothed by the convolution with the Lorentzian for Ef. In short, near threshold the fluorescence is highly asymmetric, with the low-energy side of the fluorescence peak characterized by a Lorentzian with halfwidth Ti/2 and the high-energy side by a halfwidth Tf/2. Aberg and Crasemann refer to this phenomena as continuum resonance Raman scatterin2. We will use the term threshold fluorescence for brevity and because the emission results from ionization near threshold.
J A " Y I
2 I
E2
E2
Figure 2: Continuum exatation. At the bottom is an example spectrum of an absorption edge. The upper left inset shows the level scheme and the right inset schematically shows a top view of the spectrum.
The asymmetry of the threshold fluorescence is demonstrated in Fig. 2 where the insets are analogous to those in the preceding figure. The level scheme shows
6

the photoionization of the atom followed by the relaxation of the ion. The diagonal line in the upper right inset represents the condition El = €?+If along which the fluorescence is truncated, where If is the ionization energy of the final state. The evolution of the threshold fluorescence is evident in the example spectrum where ionization occurs well below threshold but only the low energy wing of the fluorescence peak is observed. As the photon energy is increased the fluorescence peak effectively fills in, becoming a full Lorentzian at energies well above threshold.
The continuum excitation below threshold has interesting implications for the interpretation of these spectra. A common approximation to the form of an ionization threshold broadened by a core hole is an arctangent function, arrived at by convoluting a Lorentzian with a step function. An arctangent function falls more slowly than a Lorentzian as the photon energy is decreased below threshold, suggesting that ionization can dominate resonant excitation for photon energies well below threshold. This has been demonstrated in absorption spectra by Brenig ef. aL2' and in ion yield spectra by Morgan et. d2'. Therefore even in systems with strong discrete resonances below threshold, fluorescence from excitation well below threshold can be asymmetric due to contributions from threshold fluorescence. We demonstrate this for the case of Xe in section 3.1.
This effect should also be manifested in solid state spectra, for example in studies which look for band edges by following the dispersion of a peak up to threshold until the peak energy remains constant. In these studies, one traces the peak fluorescence intensity as the photon energy is scanned across threshold. In the example shown in Fig. 2 the maximum would roughly follow the diagonal line u p to threshold and then remain essentially constant, thereafter following the vertical line - if no resonant states are present. The existence of resonant states just below threshold, however, would change this behavior, causing the energy of the peak fluorescence intensity to increase to the characteristic fluorescence energy or even higher before the photon energy reaches threshold. Resonances in the continuum could cause the energy corresponding the maximum intensity to oscillate about the characteristic fluorescence energy. In solids, excitation to the band presumably also dominates over resonant excitation for energies well below the band edge, so analogous behavior would be expected. Although some investigators have attributed fluorescence observed below threshold to nonresonant Raman scattering it is more more likely to be threshold fluorescence. As noted by Aberg and Crasemann' scattering cross sections typically increase by a factor of roughly 106near a resonance. This implies that one has to be on the order of one thousand natural widths away from a resonance before nonresonant scattering strongly competes with resonant scattering. Even under such experimental conditions, ionization would still dominate discrete excitation as shown above, so observation of nonresonant Raman scattering in near-threshold spectra is highly unlikely.

2.3 The Tulkki-Aberg Model and Energy Consemation
Although we have reasoned in terms of energy conservation thus far, all of the example calculations have used the Tulkki-Aberg model. This is because when interference is neglected, such as in the model by Tulkki and aberg or the model by C0wan3 the functional form of the model is substantially determined by conservation of energy. This can be rigorously demonstrated by treating El as a constant and the other variables in equations 1 and 2 as random variables and then using standard techniques for combining distributions to derive the distribution of E2. Because of space considerations, we limit ourselves to a brief discussion here. The rigorous derivation will published elsewhere.
The expression for the scattering cross section in the TuIkki-Aberg2, ‘-lo
model is given in Eq. 3
c = 2 ~ r ; ( Ii - I,)r,g, (3) where Ij and If represent the ionization energies of the intermediate and final states, gi and gfi are the oscillator strengths for excitation and decay, rg is the classical electron radius, and we have transformed the original expression from a function of frequency to a function of energy. A schematic form of the expression is given in Eq. 4 where we have tried to emphasize the functional form by dropping the constants and replacing the Lorentzian functions by L[].
1,. E’ ( I , + E ) dg,/dE L[ El - I , - &;r, J LIE, - Ez - I , - &;TJ (4) dE, E,
This expression is a convolution of two terms representing excitation and relaxation that can be derived from a statistical approach; the remaining terms would not be found using such an approach. The Lorentzian in the excitation term represents the distribution of photoelectron energies. Normally one would include a step function to cut the distribution off at zero, but the lower limit of integration serves this purpose here. The distribution of photoelectron energies is weighted by the intermediate density of states to give the threshold dependence. Properly including the density of states in the statistical calculation is the only challenge in performing the otherwise straightforward calculation. The relaxation term represents the distribution of energies of the atom/ion in the final state Ef. The experimental resolution can be included using the distributions representing the resolution in the incident and scattered photon channels, as shown elsewhere2, lo. As mentioned above, starting with the distributions will not reproduce either the constants of proportionality or the factors outside the excitation and relaxation terms, so the approach here is intended to develop a context for understanding these models.
A few practical observations are also in order for those interested in applying the model to their own data. Resonant scattering is modeled by replacing the density of intermediate states gi by gir 8(~+1,)~ where g,, is the oscillator strength of the resonance and I, is the energy of the resonance below threshold. The delta function reduces the integral to a product of two Lorentzians. Continuum
Excitation Relaxarion
8

scattering uses a step edge at zero as shown in Fig. 3. Obtaining the proper density of states is one of the main challenges in modeling experimental spectra. Thus far, experimental spectra have been successfully modeled by deconvoluting absorption spectra or using a calculated density of states3# ’. Proper inclusion of the spectral functions presents another challenge.
Because the expression in Eq. 3 is linear in the density of states, spectra of more complex systems can be readily interpreted-simply decompose the density of states into components such as resonances or edges then sum the corresponding spectra. Two examples of this are shown in Fig. 3 along with the corresponding densities of states.
Figure 3: Examples of edge structure.
Fig. 3a shows the spectrum calculated for continuum excitation near an edge with two steps. The density of states is shown in the upper left inset. The resulting spectrum is just the sum of two spectra such as that in fig 2. The integrated fluorescence yield, which manifests the intermediate state lifetime width, is shown to the left of the spectrum and in the lower inset. The other spectrum in the lower inset shows the fluorescence yield when only a narrow range of energies centered on the characteristic fluorescence is recorded. This method of taking the data provides access to the effective enhancement in resolution without requiring the full surface to be measured, and has been employed in threshold studies’. In practice, however, it provides less information regarding interference, and renders more difficult the extraction of the actual density of states from the experimental data.
The second example in Fig. 3 shows a system with a bump in the density of states, corresponding to a continuum resonance. The calculated spectrum looks like a discrete state superposed on the continuum contribution. This may be surprising at first because in the context of the simple picture used here we exped continuum excitation to behave fundamentally different than resonant elcitation. However, a resonance in the continuum necessarily implies some temporary trapping of the electron and therefore an interaction between the eleckm and the ion in the intermediate state; i.e. the assumptions listed at the beginning of section 2 break down. It is of course only the simple picture that is inadequate. The calculations are performed using the Tulkki-Aberg model which is not limited by our simple assumptions. The important point is that for the TA model where the width of the bump is less than rf, a resonance in the densi?y of states will appear the same as a discrete resonance. This points out the relation between the narrowing of discrete resonance and the truncation of
9

threshold fluorescence: resonant narrowing is essentially truncation of both the high and low energy sides of the fluorescence peak due to energy conservation.
3 Experimental Results
To illustrate the characteristics of resonant Raman spectra discussed in the preceding sections we will briefly present two experimental spectra, concentrating on the resonant Raman scattering aspects of the spectra as opposed to the atomic structure. We begin with an x-ray resonant Raman spectrum taken near the L3 (2p3/2) edge of Xe, and then compare an Auger resonant Raman spectrum taken near the K edge of Ar to highlight the differences in the nonradiative spectra.
3.1 X-ray Resonant Raman
In figure 4 we show a set of spectra of the L C C I , ~ fluorescence following photoexcitation of Xe at a series of photon energies over a range containing the L3 edge. For purposes of comparison the integrated fluorescence spectrum is shown to the left of the perspective plot. For a more thorough discussion of this work, including the experimental details, the reader is referred to MacDonaldet. al. =.
In the transition to the 3d shell, the initially created 2~312 hole can relax to the 3d5/2 or the 3d3/2 levels, and as the two states are split by 12.6 eV both transitions appear in this spectrum.
Fig. 4. Perspective pIot of the x-ray resonant Raman spectrum of the L3 edge of Xeitmt The integrated intensity is shown at the left.
Below threshold we expect to excite to both s and d Rydberg series 20, with excitation to the 5d most intense. However, the individual final states are not resolved here because the resolution of the measurement (incident photon bandwidth + spectrometer) is about 2.6 eV, which when combined with the
10

natural width of the final state of 0.5 eV is larger than the spacing between the Rydberg levels. As a result the sum oi these transitions gives rise to an aggregate peak exhibiting the characteristic Raman dispersion. in addition, threshold fluorescence, which in a measured spectrum can not be separated from the resonant scattering without a coincidence measurement, grows rapidly at threshold yielding a peak at constant fluorescence energy.
As discussed above, photoionization near threshold gives rise to highly asymmetric fluorescence peaks that persist well below threshold. This can be seen in figure 5 showing a series of fluorescence spectra (indicated by thin lines) taken at photon energies a full-width T, or more below the discrete excitation energies. The fluorescence spectrum at the maximum of the 5d excitation is shown by a dashed line and the characteristic fluorescence is given by the heavy solid line.
0.0
4090 4 1 00 4110 41 20 Fluorescence Energy (eV)
Fig. 5. Comparison of fluorescence spectra taken on resonance (dashed line), above threshold (thick solid line), and well below threshold (thin solid lines). The spectra taken well below threshold start 294 eV below the M resonance and step down in photon energy in increments of 1.47 eV.
The high energy wings of the observed fluorescence peaks fall off more rapidly than the low energy side because continuum excitation dominates discrete excitation at energies well below threshold, accounting for approximately 50% of the total intensity in the spectrum taken at 2.92 eV below the 5d2*. As a result this series clearly displays the "filling-in" of the threshold fluorescence peak as the excitation energy is increased, an effect that has been discussed elsewhere in more detail'. 3* '-'Ot 23. Contributions from resonant excitations are also present in this series, but the dominant features are a result of below-threshold ionization. The evolution from resonant scattering to threshold fluorescence is still not completely understood, and measurements at higer resolution are needed to characterize the threshold region more carefully.

3.2 Auger Resonant R m r a n
If we now consider the Auger resonant Raman spectrum of the K edge of Ar in Fig. 6, it is similar to the radiative spectrum, but striking in the way that the excitations to the different states appear much more distinct. The dispersion of the discrete states is more easily seen because the lines are better separated, indeed one (the 4p) is completely resolved. This occurs in part because the resonant Auger peaks do not fall at the same energy as the diagram Line due to the greater effective nuclear charge experienced by the Rydberg electron in the final state. Note also that the shape of the Auger electron peak above threshold is substantially different from that of the fluorescence peaks shown before, changing in both position and asymmetry with varying excitation energy.
The spectrum in Fig. 6 is free of the forest of peaks typical of Auger spectra because it is a series of KLL Auger spectra limited to the region surrounding the L2L3 (1D2) peakz4. The Auger spectra have been restricted to a small window in electron energy where all other Auger lines have very little intensity, and the spectra therefore follow the evolution of a single line as the photon energy is scanned across threshold, much like the case of the fluorescence spectrum discussed earlier.
!
I
i i
Fig. 6. Resonant Auger Raman spectrum of the K shell of argon showing the evolution of a single line in the KLL Auger spectrum as the excitation energy is scanned across threshold.
For excitation energies well above the ionization threshold, the Auger peak is referred to as the diagram line. The asymmetric shape and slight (negative) energy dispersion of the diagram line near threshold are due to the post-collision interaction (PCI) effect in which the slow photoelectron interacts with the fast Auger electron. In addition we expect this peak to display the same truncation as threshold fluorescence, but it appears to masked by PCI. Interestingly, the onset of this peak is observable distinct from the associated Rydberg series, allowing
12

the contributions of continuum and discrete states in photo-excitation spectra to be more easily disentangled.
Aside from PCI, the most significant difference between the Auger spectrum and the x-ray spectrum is that the effective resolution of the Auger resonant Raman spectrum is enhanced because the resonant peaks are shifted up in electron energy relative to the diagram line. This energy shift of resonant Auger lines was first observed by Eberhardt et. aLX, and results from the higher charge of the Ar+ ion which increases the binding energy of the Rydberg levels in the ion. The principal practical importance of the Auger electron energy shift is that the resonant Auger peaks are more easily resolved. This is a unique strength of the Auger Raman technique for high resolution spectroscopy compared to radiative Raman where the fluorescence peaks from different resonant states generally overlap in energy.
4 Conclusion
A great deal remains to be learned about interpreting x-ray resonant Raman spectra before the technique can fulfill the promise of providing high resolution spectra of inner-shell electronic structure. We have discussed the first-order interpretation of these spectra, relying on the principle of energy conservation to explain the main features of the spectra. A more probing description should include interference effects which will modify the structure given by the simple models discussed here. Although several groups are already studying the role of interference in these spectra6# 17-'9, measurements of interference effects in resonant Raman scattering are still in their infancy. Ultimately, a principle goal is to measure the intermediate density of states, and for some systems the extraction of the intermediate density of states from a measured resonant Raman spectrum will hinge on the proper inclusion of interference. The author warmly acknowledges all of the people who have participated in the measurements shown here, especially S.H. Southworth, who has been closely involved with all of the work presented here, M.A. MacDonald, Y. Azuma, P. Cowan, and D. Deslattes. Work supported by the U.S. Department of Energy, Nuclear Science Div is ion , under c o n t r a c t W-31-109-ENG-38.
References
1
2
S. Aksela, E. Kukk, H. Aksela, and S. Svensson, Phys. R w . Leff. 74,2917 (1995). T. Aberg and B. Crasemann, in X-Ray Anomalous (Resonance) Scaffering: Theory and Experiment, edited by K. Fischer, G. Materlik, and C. J. Sparks (Elsevier/North-Holland, Amsterdam, 1994), p. 430.
3 P.L. Cowan, in X-Ray Anomalous (Resonance) Scaftering: Theory and Experiment, edited by G. Materlik, C. J. Sparks, and K. Fischer (Elsevier/North-Holland, Amsterdam, 1994), p. 430. W. Drube, R. Treusch, and Materlik, Phys. Rev. Lett. 71,42 (1995). K. Hihalainen, D.P. Siddons, J.B. Hastings, and L.E. Berxtan, Phys. Rev. Let:. 67,2850 (1991).
4 5
13

6
7
8
9 10 11 12
13
14 15
16 17 18 19
20
21 22
23
24
25
M. Neeb, J.-E. Rubensson, M. Biermann, W. Eberhardt, K.J. Randall, J. Feldhaus, A.L.D. Kilcoyne, AIM. Bradshaw, Z. Xu, P.D. Johnson, and Y. Ma, Cliemical Physics Letters 212,205 (1993). H . Wang, J.C. Woicik, T. Aberg, M.H. Chen, A. Herrera-Gomez, T. Kendelewicz, A. Mantykentta, K.E. Miyano, S. Southworth, and B. Crasemann, Phys. Rev. A 50,1359 (1994). T. Aberg and J . Tulkki, in Atomic Inner-Shell Physics, edited b y B. Crasemann (Plenum, 1985), p. 419. J. Tulkki and T. Aberg, 1. Phys. B 15, L435 (1982). J. Tulkki, Plzys. Rev. A 27,3375 (1983). C.J. Sparks, PIzys. Rat. Lett. 33,262 (1974). P. Eisenberger, P.iM. Platzman, and H. Winick, Phys. Rev. Leff. 36, 623 (1976). J.P. Briand, D. Girard, V.O. Kostroun, P. Chevalier, K. Wohrer, and J.P. Moss& Phys. Rev. Lett. 46,1625 (1981). G.B. Amen and H. Wang, Pfzys. Rev. A 51,1241 (1995). A. Kivimaki, A.N.d. Brito, S. Aksela, H. Aksela, 0.-. Sairanen, A. Ausmees, S.J. Osbome, L.B. Dantas, and S. Svensson, Plzys. Rm. Lett. 71, 4307 (1993). W. Drube, These proceedings . P. Carra, M. Fabrizio, and B.T. Thole, Phys. Rev. Lett. 74,3700 (1995). F. Gel’mukhanov and H. Agren, Plzys. Rev. A 49,4378 (1994). T.X. Carroll, S.E. Anderson, L. Ungier, and T.D. Thomas, Plzys. Rev. Letf. 58,867 (1987). M. Breinig, M.H. Chen, G.E. Ice, F. Parente, and B. Crasemann, Phys. Rev. A 22,520 (1980). D.V. Morgan, R.J. Bartlett, and M. Sagurton, Plzys. Rev. A 51,2939 (1995). M.A. MacDonald, S.H. Southworth, J.C. Levin, A. Henins, R.D. Deslattes, T.LeBrun, Y. Azuma, P.L. Cowan, and B.A. Karlin, Phys. Rev A 51,3598 (1995). T. LeBrun, S.H. Southworth, M.A. MacDonald, and Y. Azuma, in Oji International Seminar on Atomic Molecular Photoionization, Tsukuba, japan, 2 996, edited by A. Yagashita and T. Sasaki (Universal Academy Press, . L. Asplund, P. Kelfve, B. Blomster, H. Siegbahn, and K. Siegbahn, Physica Scripta 16, (1977). W . Eberhardt, G. Kalkoffen, and C. Kunz, Phys. Rev. Letf. 41,156 (1978).
14