to our unitholders, - ag growth international · to our unitholders, ... we must keep the market...
TRANSCRIPT


To Our Unitholders, On behalf of the management, employees and the board of trustees of Ag Growth Income Fund, we are pleased to present our financial results for the third quarter ended September 30, 2008. The third quarter of 2008 was the strongest ever for the Fund. We achieved revenues of $60.0 million (2007- $40.7 million) an increase of almost 50% over the prior year. Our EBITDA*, adjusting for foreign exchange gains or losses, increased 31% over 2007 to $15.1 million (2007 - $11.5 million). What a difference a couple of months can make. Equity markets have been hit with a major liquidation that has impacted equities around the world. In particular, commodities have experienced a major sell off as investors fear global recession. Agricultural commodities have not escaped this carnage. Corn is trading below $4.00 per bushel and soybeans have settled below $10.00 per bushel. This is substantially below levels of a few months ago when corn approached $8.00 and soybeans traded in the mid teens as a result of an overreaction to the possible effect of spring floods in the U.S. Midwest. Although this has unnerved many investors, we must keep the market fundamentals in perspective. For almost ten years after the 1997 Asian crisis corn traded in a tight range between $2.00 and $2.50 per bushel. Soybeans traded in the $6.00 range and wheat in the $3.00-$4.00 range. Corn at $4.00, soybeans at $9.00 and wheat at $5.50 represents a pullback from recent highs but remains well above levels at which producers have historically operated profitably. At the writing of this report, harvest was still being completed in the northern regions of the U.S. Midwest that were negatively impacted by flooding at the beginning of the year. This year’s harvest will have one of the latest completion dates of the last 20 years. Although the USDA’s recently announced 2008 corn crop estimate of 12.02 billion bushels represents a substantial decline from last year’s corn harvest of over 13 billion bushels, the 2008 estimate still represents the second largest corn crop in US history. Even with two successive large crops, grain carryovers are anticipated to be at or near multi-decade lows. Recent economic developments have given cause to reassess the state of our segment of the agricultural sector. The characteristics of our equipment give us confidence regarding the sustainability of our growth. Small ticket equipment, the demand for which is primarily driven by grain volumes, has a distinct advantage over larger items such as tractors, combines and tillage equipment in times of lower commodity prices. When asked about the outlook for auger sales in 2009, one of our largest distributors replied “We are in the sweet spot of equipment manufacturers”. We couldn’t have said it better ourselves. This has proven itself through past pullbacks in agricultural markets and we believe this will again be the case. In addition, farmers have the most conservative balance sheets they have had in the last ten years with debt representing less than 10% of total assets. Despite the credit crunch that is affecting many industries, we feel it will have a much more tempered effect on domestic agricultural producers than many other sectors.
1
We are, however, anticipating a pull back in our larger commercial equipment as the tightening of credit will have a more pronounced short term impact on larger capital projects for grain handlers. This equipment represents approximately 20% of our historic revenue base. We hope to offset much of this decline through our recent efforts in expanding our overseas markets. I have recently spent time traveling with our marketing team in emerging markets such as Russia, Kazakhstan, Ukraine and Brazil, in an attempt to assess the potential size of these markets. The large scale of farms that exist or are being assembled are conducive to the adoption of our type of equipment. These countries have corporate farming operations that are of individual scale that dwarf the size and scope of North American farming operations. More importantly, recognition of the benefits of and payback from preserving the quality of the grain through on-farm storage and aeration is greatly increasing. These emerging market nations as a rule only have on farm storage capacity representing 10% of annual grain production. This compares to over 80% capacity in Canada and approximately 70% in the U.S. Despite tightening in the availability of credit in these markets, we believe that substantial growth opportunities exist as they accelerate their efforts to maximize the value they receive for their grain. Our broad catalogue of grain handling, storage and conditioning products have positioned us well to have a strong competitive advantage when entering these exciting new markets. We are aggressively building the business plan to establish these international markets as the new long term growth driver for our business. This has been a transition year for the Fund. Aggressive product line acquisitions in 2007 have created opportunities but have also caused a few digestion problems in 2008. We are diligently working through these challenges. The product line acquisitions have positioned the company to begin reaping the rewards of our expanded catalogue in 2009. In particular, the introduction of grain bins through the Twister acquisition and commercial handling equipment through the Hi Roller and Union Iron acquisitions have positioned us well to enter overseas markets. Our biggest hurdle, the capacity expansion at Westfield, our largest division, finally is delivering the benefits that we promised the market at the outset of the project. Our ship rate in the second half of the year is exceeding last years run rate by 68%. We believe we are now beginning to see market share gains in this expanding market as we are ahead of our competitors in capacity expansion. We anticipate another strong year from Westfield, which is still our flagship division. As we complete the third quarter, we have finally eliminated backlogs at Westfield that were locked in at older price levels that did not compensate for the dramatic run up in steel prices earlier this year. We are still hampered by backlogs at Twister and Edwards where pricing does not yet reflect the higher input costs, but we expect to be benefiting from increased prices by the end of the year. In the last month the fear of recession has
2

seen softening in steel prices. We will be burdened for a period of time with higher priced steel inventory, but expect to realize the benefit from lower input costs in 2009. The recent dramatic drop in the Canadian dollar has allowed us to lock in currency hedges at lower rates than in the last couple of years. We will be negatively impacted by the repricing of our US dollar denominated debt if the currency remains at current levels, but given that the majority of our sales are also US dollar denominated we expect this negative impact will be more than offset by margin expansion in 2009. The equity and debt market as well as concerns over the sustainability of the agricultural cycle has hurt our trust unit price. Given the strength of our balance sheet and our low debt levels relative to cash flow we requested and received approval to begin a unit buyback. Our normal course issuer bid commenced in late October. Overall, despite the concerns of some regarding the end of the agricultural cycle, we will continue to build for a solid growth year until we see evidence to the contrary. We have been in this industry for many years and have been correct more often than not with respect to the interpretation of the macro economic situation. We again intend to trust our instincts in these uncertain times. The world is having increasing difficulty keeping supply tracking with demand growth. What is becoming apparent as we have expanded our sights outside of North America is that there is enough land to feed the world. The answer to the supply demand equation is reducing the extensive loss of crop in developing nations as a result of archaic storage, handling and conditioning practices. We are convinced of this but more importantly producers and governments in these markets are finally recognizing this too. Our job is to capitalize on the opportunity!! We thank all of our customers, suppliers, employees and investors who have supported us to date. If you agree with our vision and commit to our plan in the long term we believe you all will be rewarded. Yours Truly, Rob Stenson Chief Executive Officer Ag Growth Income Fund * See “non-GAAP measures” in the Management’s Discussion and Analysis.
3

AG GROWTH INCOME FUND MANAGEMENT’S DISCUSSION AND ANALYSIS NOVEMBER 13, 2008 This Management’s Discussion and Analysis (“MD&A”) should be read in conjunction with the audited consolidated financial statements and accompanying notes of Ag Growth Income Fund (the “Fund”) for the year ended December 31, 2007 and the unaudited interim consolidated financial statements of the Fund for the three and nine month periods ended September 30, 2008. Results are reported in Canadian dollars unless otherwise stated and have been prepared in accordance with Canadian generally accepted accounting principles. Throughout this Management's Discussion and Analysis references are made to "EBITDA", “gross margin”, "standardized distributable cash", “adjusted distributable cash” and "payout ratio". A description of these measures and their limitations are discussed below under "Non-GAAP Measures". See also "Risks and Uncertainties" and "Forward-Looking Statements" below. FORWARD-LOOKING STATEMENTS This Management’s Discussion and Analysis contains forward-looking statements that reflect our expectations regarding the future growth, results of operations, performance, business prospects, and opportunities of the Fund. Forward-looking statements may contain such words as “anticipate”, “believe”, “continue”, “could”, “expects”, “intend”, “plans”, “will” or similar expressions suggesting future conditions or events. Such forward-looking statements reflect our current beliefs and are based on information currently available to us. Forward-looking statements involve significant risks and uncertainties. A number of factors could cause actual results to differ materially from results discussed in the forward-looking statements, including changes in national and local business conditions, crop yields, crop conditions, seasonality, industry cyclicality, volatility of production costs, commodity prices, foreign exchange rates, and competition. These risks and uncertainties are described under “Risks and Uncertainties” and in our Annual Information Form. Although the forward-looking statements contained in this MD&A are based on what we believe to be reasonable assumptions, we cannot assure readers that actual results will be consistent with these forward-looking statements and we undertake no obligation to update such statements except as expressly required by law. OVERVIEW OF THE FUND The Fund is an unincorporated, open-ended, limited purpose trust established under the laws of the Province of Ontario. The Fund holds indirectly all of the securities of Ag Growth Industries Inc. (“Ag Growth”), which conducts business in the grain handling, storage, and conditioning market. The following units of the Fund (“Trust units”) were issued and outstanding and participated pro rata in distributions during the periods indicated:
4

# Trust units
# Class B units (1)
# Total units
December 31, 2006 11,088,915 136,085 11,225,000 October 2, 2007 equity financing 1,730,000 0 1,730,000
December 31, 2007 and September 30, 2008 12,818,915 136,085 12,955,000 Units purchased under normal course issuer bid (172,100) 0 (172,100)
November 13, 2008 12,646,815 136,085 12,782,900 (1) The previous owners of Ag Growth were issued Class B exchangeable limited partnership units (“Class B units”) of AGX Holdings Limited Partnership (“AGHLP”), a wholly owned subsidiary of the Fund. The Class B units are exchangeable for Trust units of the Fund at the option of the holder on a one-for-one basis at any time. The Trust units of the Fund and the Class B units of AGHLP participate pro rata in distributions. The Fund has issued one Special Voting Unit for each Class B unit outstanding. The Special Voting Units are not entitled to any interest or share in the Fund, or in any distribution from the Fund, but are entitled to vote on matters related to the Fund. On October 22, 2008, the Fund commenced a normal course issuer bid for up to 1,262,090 Trust units, representing 10% of the Fund’s public float. The normal course issuer bid will terminate on October 21, 2009 unless terminated earlier by the Fund. Units purchased under the normal course issuer bid will be cancelled. Trust units are purchased at market price and in accordance with Toronto Stock Exchange (“TSX”) requirements. The Fund has granted 220,000 unit awards under its unit award incentive plan approved by unitholders in May 2007. The unit awards remain outstanding at September 30, 2008 and November 13, 2008 and, subject to vesting and payment of the exercise price, are each exercisable for one Trust unit. The Fund’s Trust units trade on the Toronto Stock Exchange under the symbol AFN.UN. RATE OF FOREIGN EXCHANGE Impact on U.S. dollar denominated sales and expenses The appreciation of the Canadian dollar is a significant factor when comparing results for the three and nine month periods ended September 30, 2008 to the same periods in 2007. The Fund’s average rate of exchange per U.S. dollar for the three and nine months ended September 30, 2008 was $1.03 and $1.01, respectively, compared to $1.06 and $1.11 for the same periods in 2007. A stronger Canadian dollar will result in lower sales and lower expenses as transactions denominated in U.S. dollars are translated to Canadian dollars at a lower rate. As the Fund’s sales denominated in U.S. dollars greatly exceed its expenses denominated in that currency, a stronger Canadian dollar negatively impacts operating results of the Fund. The Fund’s average rate of exchange for the fourth quarter of 2007 was $0.99, and for the quarters ended March 31, 2008 and June 30, 2008 was $0.99 and $1.01, respectively. The Canadian dollar has recently weakened and unless it recovers to these levels, in future quarters the impact of foreign exchange will benefit the Fund’s operating results when comparing to prior periods.
5

Impact on gain (loss) on foreign exchange The Fund’s gain (loss) on foreign exchange on the income statement is comprised of gains or losses on foreign exchange hedging contracts as well as the impact of translating U.S. dollar denominated assets and liabilities, including U.S. dollar denominated long-term debt, into Canadian dollars using the foreign exchange rate in effect at the end of the reporting period. As the Canadian dollar strengthened throughout 2007, the Fund recorded large gains when translating its U.S. dollar denominated debt into Canadian dollars. The opposite was true in the third quarter of 2008, as the Canadian dollar weakened and the Fund recorded an unrealized loss on its U.S. dollar denominated debt. Largely due to the impact of U.S. dollar denominated debt, for the three and nine months ended September 30, 2008, the Fund has recorded a loss on foreign exchange of $1.2 million and $1.5 million, respectively, compared to gains of $1.1 million and $2.3 million for the same periods in 2007. The Canadian dollar has weakened significantly to date in the fourth quarter of 2008. Accordingly, unless the Canadian dollar recovers before the end of the Fund’s fiscal year, the Fund anticipates it will record a large unrealized loss on its U.S. dollar denominated long-term debt in the fourth quarter of 2008. OPERATING RESULTS (thousands of dollars)
Three Months Ended September 30
Nine Months Ended September 30
2008 2007 2008 2007 Sales $60,012 $40,762 $151,100 $103,808 Cost of goods sold 38,134 23,492 97,330 61,743
Gross margin 21,878 17,270 53,770 42,065
General, administrative and other (1) 6,884 5,261 20,387 14,659 Long-term incentive plan 150 157 700 471 Unit award incentive plan (220) 397 637 686 Loss (gain) on foreign exchange 1,242 (1,117) 1,537 (2,254) Amortization 2,063 1,572 6,106 3,905 Interest expense 772 855 2,002 2,141
Earnings before tax 10,987 10,145 22,401 22,457 Current income taxes 1,094 1,109 2,899 1,412 Future income taxes 140 60 400 11,353
Net earnings for the period $9,753 $8,976 $19,102 $9,692 EBITDA * $13,822 $12,572 $30,508 $28,503 EBITDA before loss (gain) on FX $15,064 $11,455 $32,045 $26,249 Net earnings per unit $0.75 $0.80 $1.47 $0.86 * See “non-GAAP Measures”. (1) Comprised of selling, general and administrative expenses, professional fees, research and development, capital taxes and other expense (income).
6

ASSETS AND LIABILITIES (thousands of dollars)
September 30 2008
September 30 2007
Total assets $230,888 $183,462 Total liabilities $84,495 $74,734 Distributions Declared The table below summarizes the distributions declared for Trust units of the Fund and for Class B units of AGHLP. The Fund’s distribution policy is described in the “Distributions” section of this MD&A. DISTRIBUTIONS (thousands of dollars)
Three Months Ended September 30
Nine Months Ended September 30
2008 2007 2008 2007 Trust units $6,153 $4,657 $16,921 $13,972 Class B units 65 57 180 171
Total distributions $6,218 $4,714 $17,101 $14,143 Acquisitions The inclusion of the assets, liabilities and operating results of the following acquisitions significantly impacts comparisons to 2007: Effective May 31, 2007, the Fund acquired substantially all of the operating assets of Twister Pipe Ltd. (“Twister”), a manufacturer of grain storage bins, aeration equipment, and bin unload systems. Subsequent to the acquisition the assets, liabilities and operations of Twister were integrated with the Fund’s Edwards division. Effective November 19, 2007, the Fund acquired 100% of the outstanding shares of Union Iron Inc. (“Union Iron”) and the shares and assets of certain related companies of Union Iron, a manufacturer of material handling and storage equipment. Effective January 15, 2008, the Fund acquired substantially all of the assets of Applegate Steel Inc. (“Applegate”), a manufacturer of livestock equipment. Overall Performance Strong demand for portable grain handling and aeration equipment and a significant increase in production at the Westfield division has resulted in a substantial increase in sales compared to 2007. The table below summarizes consolidated sales as well as sales at core divisions (defined as those divisions reporting full three and nine month results in both 2007 and 2008):
7

SALES (in thousands)
Three Months Ended Nine Months Ended Core Consolidated Core Consolidated
September 30, 2008 $44,787 $60,012 $118,655 $151,100 September 30, 2007 $38, 126 $40,762 $100,213 $103,808 Increase $6,661 $19,250 $18,442 $47,292 Percentage increase 17% 47% 18% 46% Gross margin (see “non-GAAP measures”) as a percentage of sales for the three and nine month periods ended September 30, 2008 was 36.5% (2007 – 42.4%) and 35.6% (2007 – 40.5%), respectively. Previously disclosed gross margin issues at Westfield have been resolved. Compared to 2007, gross margin was negatively impacted by integration issues at the Edwards/Twister division, increases in input costs, particularly raw steel, and a stronger Canadian dollar. The Fund has announced several sales price increases to offset the increase in input costs, however the impact of these price increases for the periods ended September 30, 2008 has been limited as the Fund honoured old pricing on its backorder. Management initiatives to enhance gross margin percentages have been largely successful, as gross margin excluding Edwards/Twister was 41.5% and 40.1% in the three and nine months periods ended September 30, 2008, and excluding both Edwards/Twister and the impact of foreign exchange, was 42.2% and 41.9%. The Fund has enhanced management depth and made organizational changes at Edwards/Twister, and expects gross margin improvements over the next several quarters to result from enhanced labour productivity, the realization of previously announced price increases, and the continuation of higher sales volume. EBITDA for the three and nine month periods ended September 30, 2008 was $13.8 million (2007 - $12.6 million) and $30.5 million (2007 - $28.5 million), respectively. The increase in EBITDA was due primarily to a significant increase in sales and gross margin at Westfield, strong results at Hi Roller, offset by the gross margin pressures discussed above and a significant decrease in the gain on foreign exchange. As a percentage of sales, EBITDA for the three and nine months ended September 30, 2008 was 23% and 20%, respectively (2007 – 31% and 27%). As discussed under “Foreign Exchange” the Fund has recorded losses in 2008 on its U.S. dollar denominated debt. Excluding the gain (loss) on foreign exchange, which encompasses the impact of translating U.S. denominated debt into Canadian dollars, EBITDA in the three and nine month periods ended September 30, 2008 was $15.1 million (2007 - $11.5 million) and $32.0 million (2007 - $26.2 million), respectively. Sales Sales for the three months ended September 30, 2008 were $60.0 million, including $15.2 million at divisions acquired in 2007 and 2008. Excluding the impact of acquisitions, sales in the third quarter of 2008 were $44.8 million, compared to $38.1 million in 2007. The increase of $6.7 million or 17% over 2007 is largely due to the following:
• Sales of grain handling equipment in the North American market, in particular Westfield augers and Batco conveyors, increased significantly (30% over the prior year) due to exceptional farm level demand.
8

• Sales at Hi Roller in the three month period decreased $2.1 million from the third quarter of 2007. Hi Roller sales in the third quarter of 2007 were exceptional due to a sizeable ethanol industry component.
• Total international sales for the quarter were $3.6 million (2007 - $1.9 million). The increase is largely due to the development of new markets in Russia and Kazakhstan.
• Sales were negatively impacted by foreign exchange. Had the average exchange rates experienced in 2007 been in effect in 2008, all other factors remaining constant, sales excluding acquisitions would have increased an additional $0.7 million.
Sales for the nine months ended September 30, 2008 were $151.1 million, including $32.4 million at divisions acquired in 2007 and 2008. Excluding the impact of these acquisitions, sales in the nine month period were $118.7 million, compared to $100.2 million in 2007. The increase of $18.5 million or 18% over 2007 is largely due to the following:
• Sales of grain handling equipment in the North American market, in particular Westfield augers and Batco conveyors, increased significantly (24% over the prior year) due to exceptional farm level demand.
• Sales at Hi Roller for the nine month period increased $0.1 million compared to 2007 as an increase in sales to its traditional customer base and growth in overseas markets more than offset the decrease in sales to the ethanol industry.
• Total international sales were $11.6 million (2007 - $4.3 million). The increase is largely due to the development of new markets in Russia and Kazakhstan.
• Sales were negatively impacted by foreign exchange. Had the average exchange rates experienced in 2007 been in effect in 2008, all other factors remaining constant, sales excluding acquisitions would have increased an additional $8.5 million.
Foreign Exchange Sales and expenses denominated in a foreign currency are recorded each month at the rate of exchange in effect on the closing business day of the previous month. For the three and nine months ended September 30, 2008, sales denominated in U.S. dollars accounted for 78% and 76% of total sales respectively (2007 - 74% and 73%) and U.S. dollar denominated expenses equated to 34% and 36% of sales for the periods then ended (2007 – 25% and 28%). As sales denominated in U.S. dollars significantly exceed purchases denominated in that currency, the Fund’s operating results are negatively impacted by a strengthening Canadian dollar. The Fund’s average rate of exchange for the three and nine months ended September 30, 2008 was $1.03 and $1.01 respectively, compared to $1.06 and $1.11 in 2007. Ag Growth has entered into a series of hedging arrangements to partially mitigate the potential effect of fluctuating exchange rates. Realized gains or losses on foreign currency hedging instruments have been included, along with the gain or loss on the translation of U.S. dollar monetary items, in operating expenses as a gain or loss on foreign exchange. Gross Margin Gross margin as a percentage of sales for the three and nine months ended September 30, 2008 was 36.5% and 35.6%, respectively, compared to 42.4% and 40.5% in 2007. The decrease in gross margin percentages compared to 2007 was largely due to the following:
• The inclusion of Twister negatively impacted gross margin percentages due primarily to set-up and integration issues. Excluding the Edwards/Twister division, gross margin for
9

the three and nine months ended September 30, 2008 was 41.5% and 40.1% respectively. The Fund has enhanced management depth and made organizational changes at Edwards/Twister, and expects gross margin improvements over the next several quarters to result from enhanced labour productivity, the realization of previously announced price increases, and the continuation of higher sales volume.
• The comparison to 2007 was negatively impacted by foreign exchange. Excluding the impact of the Edwards/Twister division and the stronger Canadian dollar, gross margin as a percentage of sales for the three and nine months ended September 30, 2008 would have been 42.0% and 41.9% respectively.
• Although Westfield’s previously disclosed gross margin issues were resolved with the completion of the capacity improvement initiative in March 2008, the project negatively impacted first quarter gross margin percentages prior to its completion.
• Gross margin was negatively impacted by increases in the price of steel. The Fund has implemented a number of price increases to address rising input costs, however these price increases are generally not applied to its back order and accordingly there is a lag effect between the date of a price increase announcement and the full realization by the Fund of the higher sales price. The lag effect most materially affected Westfield and Edwards/Twister. The Fund expects the benefit of all price increases to fully impact the first quarter of 2009.
• The Fund’s sales mix has changed substantially with the acquisitions of Twister, Union Iron, and Applegate. These are inherently lower margin businesses and their inclusion in the Fund’s consolidated results will lower the consolidated gross margin percentage. Divisions that were acquired in 2007 and 2008 accounted for 25% and 21% of total sales in the three and nine months ended September 30, 2008.
Expenses For the three months ended September 30, 2008, selling, general and administrative expenses were $6.6 million or 11% of sales. Excluding acquisitions, selling, general and administrative expenses were $5.3 million or 12% of sales (2007 - $4.8 million or 13% of sales). The increase of $0.5 million over 2007 is primarily due to the following:
• Salary expense increased $0.2 million due largely to personnel additions to facilitate growth and acquisition integration, wage adjustments, and a number of smaller items.
• Sales and marketing expense increased $0.2 million due largely to the development of an international sales group and investment in offshore territory development.
• A number of miscellaneous items accounted for the remaining change. For the nine months ended September 30, 2008, selling, general and administrative expenses were $19.3 million or 13% of sales. Excluding acquisitions, selling, general and administrative expenses were $15.8 million or 13% of sales (2007 - $13.4 million or 13% of sales). The increase of $2.4 million over 2007 is primarily due to the following:
• Commission expense payable to third parties increased $0.5 million largely due to increased sales at Westfield and Hi Roller’s customer mix.
• Salary expense increased $0.5 million due largely to personnel additions to facilitate growth and acquisition integration, wage adjustments, and a number of smaller items.
• Sales and marketing expense increased $0.5 million due largely to the development of an international sales group and investment in offshore territory development.
• Repairs and maintenance increased $0.3 million due to a number of small items at Westfield and Edwards.
• A number of miscellaneous items accounted for the remaining change.
10

Variances compared to the three and nine months ended September 30, 2007 were also recorded in the following:
• The Fund adopted a unit award incentive plan in May 2007. Calculation of the expense is
based on the trading price of the Trust units at the balance sheet date and the vesting provisions of the plan. For the three months ended September 30, 2008, the fund recorded a recovery of $0.2 million (2007 – expense of $0.4 million) and for the nine months then ended recorded an expense of $0.6 million (2007 – $0.7 million).
• In 2007 the Fund adopted an amended long-term incentive plan (“LTIP”) that provides for annual awards based on distributable cash generated. The awards are expensed over the term of the participant’s vesting period and as a result the expense in 2008 includes a component related to the fiscal 2007 award as well as a component related to the current fiscal year. For the three and nine months ended September 30, 2008, the Fund recorded an expense related to the LTIP of $0.2 million and $0.7 million respectively (2007 - $0.2 million and $0.5 million).
• For the three and nine months ended September 30, 2008 the Fund recorded a loss on foreign exchange of $1.2 million and $1.5 million respectively (2007 – gains of $1.1 million and $2.3 million). As discussed under “foreign exchange”, the gain (loss) on foreign exchange has been significantly impacted by measuring U.S. dollar liabilities at current exchange rates.
EBITDA and Net Earnings (see discussion of non-GAAP measures) EBITDA for the three and nine months ended September 30, 2008 was $13.8 million and $30.5 million, compared to $12.6 million and $28.5 million in 2007. The increases in EBITDA were largely the result of a significant increase in production and sales at the Westfield division that resulted from the completion of the Westfield capacity improvement initiative. EBITDA was negatively impacted by a lower consolidated gross margin percentage that resulted primarily from low margins at the Edwards/Twister division and the effect of a stronger Canadian dollar. As discussed under “Foreign Exchange” the Fund has recorded losses in 2008 on the translation of its U.S. denominated debt into Canadian dollars. Excluding the gain (loss) on foreign exchange, which includes the debt translation loss, EBITDA in the three and nine month periods ended September 30, 2008 was $15.1 million (2007 - $11.5 million) and $32.0 million (2007 - $26.2 million), respectively. The Fund’s credit facility includes operating lines of CAD $10.0 million and USD $2.0 million, and provides for long-term debt of up to USD $66.5 million. As at September 30, 2008, $5.9 million was drawn under the operating lines compared to a cash balance of $3.3 million at September 30, 2007. The Fund’s outstanding long-term debt is CAD $42.6 million (2007 - $48.9 million), comprised of term loans of USD $37.6 million and CAD $3.0 million. Interest rates on both facilities are based on performance calculations. For the three and nine months ended September 30, 2008, the Fund’s effective interest rate on its U.S dollar term debt was 6.5% and 6.9% respectively (2007 - 8.8% and 8.8%), and after consideration of the effect of the Fund’s interest rate swap was 6.2% and 6.1% (2007 – 6.3% in both periods). For the three and nine months ended September 30, 2007, the Fund’s effective interest rate on its Canadian dollar term debt was 4.9% in both periods. See “Financial Instruments”. Amortization for the three months ended September 30, 2008 was $2.1 million (2007 - $1.6 million) and included the amortization of capital assets of $1.3 million and the amortization of
11

intangible assets of $0.8 million. Amortization for the nine months ended September 30, 2008 was $6.1 million (2007 - $3.9 million) and included the amortization of capital assets of $3.9 million and the amortization of intangible assets of $2.2 million. Compared to 2007, amortization was most significantly impacted by the acquisitions of Twister, Union Iron and Applegate, and amortization of the new paint line at the Westfield facility. The Fund is a mutual fund trust for income tax purposes and therefore is not at this time subject to tax on income distributed to unitholders. The manufacturing business operations of the Fund’s divisions that are based in Canada are carried out within a limited partnership. Income from the limited partnership is not subject to tax but flows through to the holders of the partnership units, which includes the Fund. The Fund’s distributions are taxable in the hands of the unitholders. As a result of the Fund’s structure, a current tax provision is recorded only for the Fund’s subsidiary corporations, including its U.S. based divisions, and for the three and nine months ended September 30, 2008 the current tax provision was $1.1 million and $2.9 million respectively. For the three and nine months ended September 30, 2008 the Fund recorded a future tax expense of $0.1 million and $0.4 million respectively (2007 – $0.1 million and $11.4 million). The 2008 expense is related to the treatment of the Fund’s long-term incentive plan and unit award incentive plan, net of an expense derived primarily from the utilization of future tax assets. The 2007 expense included a charge related to new income trust tax legislation (see “Legislation Related to Income Trusts”). For the three and nine months ended September 30, 2008, the Fund recorded net earnings of $9.8 million and $19.1 million respectively (2007 – $9.0 million and $9.7 million) and earnings per basic and diluted unit of $0.75 and $1.47 (2007 – $0.80 and $0.86). Quarterly Financial Information (thousands of dollars):
2008
Sales Gain (Loss)
on FX Net Earnings
(Loss) Net Earnings
per Unit Q1 $35,138 $(586) $1,889 $0.14 Q2 55,950 291 7,460 0.58 Q3 60,012 (1,242) 9,753 0.75 Fiscal 2008 $151,100 $(1,537) $19,102 $1.47
2007
Sales
Gain (Loss) on FX
Net Earnings (Loss)
Net Earnings per Unit
Q1 $28,085 $ 59 $ 5,618 $0.50 Q2 34,960 1,078 (4,902) (0.44) Q3 40,762 1,117 8,976 0.80 Q4 26,563 1,864 2,674 0.20 Fiscal 2007 $130,370 $4,118 $ 12,366 $1.06
12

2006
Sales Gain (Loss)
on FX
Net Earnings Net Earnings
per Unit Q1 $19,704 $ 201 $ 4,116 $0.37 Q2 22,572 121 5,157 0.46 Q3 22,050 1,102 5,771 0.51 Q4 17,199 2,549 4,000 0.36 Fiscal 2006 $81,525 $3,973 $19,044 $1.70
Interim period revenues and earnings historically reflect some seasonality. The third quarter is typically the strongest primarily due to high in-season demand at the farm level. Adjusted distributable cash generated per unit will also typically be highest in the third quarter. Due to the seasonality of the Fund’s working capital movements, standardized distributable cash generated per unit will typically be highest in the fourth quarter. The following factors impact comparability between quarters in the table above:
• Sales, gain (loss) on foreign exchange, net earnings, and net earnings per unit are significantly impacted by the rate of exchange between the Canadian and U.S. dollars.
• The second quarter of 2007 includes a non-cash future tax accrual of $11.1 million related to the enactment of taxation laws related to income trusts for taxation years commencing January 1, 2011. The fourth quarter of 2007 includes a $1.6 million credit to future taxes to reflect a lower expected effective tax rate.
• Subsequent to January 15, 2008, results reflect the acquisition of Applegate. • Subsequent to November 19, 2007, results reflect the acquisition of Union Iron. • Subsequent to May 31, 2007, results reflect the acquisition of Twister. • Subsequent to December 31, 2006, results reflect the acquisition of Hi Roller.
CASH FLOW AND LIQUIDITY The table below reconciles net earnings to cash provided by (used in) operations for the three and nine months ended September 30, 2008 and 2007: (thousands of dollars)
Three Months Ended September 30
Nine Months Ended September 30
2008 2007 2008 2007 Net earnings for the period $9,753 $8,976 $19,102 $9,692 Add charges (deduct credits) to operations not requiring a current cash payment:
Amortization 2,063 1,572 6,106 3,905 Future income taxes 140 60 400 11,353 Translation gain on foreign exchange 1,730 (1,788) 2,832 (3,693) Non-cash interest expense 90 55 258 112 Long term incentive plan 150 0 700 0 Unit award incentive plan (220) 397 637 686 Loss (gain) on sale of property, plant & equipment
0 0 0 (40)
13,706 9,272 30,035 22,015
13

Net change in non-cash working capital balances related to operations:
Accounts receivable (1,549) 1,136 (22,427) (7,564) Inventory (2,941) 2,336 (10,573) 707 Prepaid expenses and other assets (402) 65 (861) (243) Accounts payable and accruals 787 345 4,103 506 Customer deposits (2,146) 280 (8,712) (4,223) Income taxes payable 758 265 1,186 (182)
(5,493) 4,427 (37,284) (10,999)
Cash provided by (used in) operations $8,213 $13,699 $(7,249) $11,016 For the three months ended September 30, 2008, cash provided by operations was $8.2 million (2007 - $13.7 million) and for the nine months then ended cash used in operations was $7.2 million (2007 – cash provided of $11.0 million). The increase in cash used in operations in 2008 is primarily due to changes in non-cash working capital. Increased demand resulted in a high level of customer deposits on hand at December 31, 2007, and accordingly a higher level of production and sales in 2008 related to cash received in 2007. Additional cash resources were required to support inventory levels in 2008 as an increase in purchasing resulted from increased production, higher input prices, and an increased investment in raw material to protect against rising input prices. An increase in period end accounts receivable resulted from higher sales. A number of smaller changes account for the remaining variance. Working Capital Interim period working capital requirements typically reflect the seasonality of the business. The Fund’s collections of accounts receivable are weighted towards the third and fourth quarters. This collection pattern, combined with seasonally high sales in the third quarter, result in accounts receivable levels increasing throughout the year and peaking in the third quarter. In order to ensure the Fund has adequate supply throughout its distribution network in advance of in-season demand, inventory levels must be gradually increased throughout the year. Accordingly, inventory levels typically increase in the first and second quarters and then begin to decline in the third or fourth quarter as sales levels exceed production. As a result of these working capital movements, historically, Ag Growth begins to draw on its operating lines in the first or second quarter. The operating line balance typically peaks in the second or third quarter and normally begins to decline later in the third quarter as collections of accounts receivable increase. Ag Growth has typically fully repaid its operating line balance by early in the fourth quarter. Operating results to date in 2008 have generally reflected these expectations, however, compared to prior years, additional cash resources were required to support inventory levels as an increase in purchasing resulted from increased production, higher input prices, and an increased investment in raw material to protect against rising input prices. Accordingly, the Fund’s consolidated inventory balance did not decrease in the third quarter as is typical, and largely due to the increased investment in inventory, the Fund’s cash balance at September 30, 2008 was below historical levels.
14

Capital Expenditures The Fund had maintenance capital expenditures of $0.5 million and $2.0 million for the three and nine months ended September 30, 2008 (2007 - $0.2 million and $1.2 million). Maintenance capital expenditures in 2008 relate primarily to purchases of a semi tractor unit and trailers and manufacturing equipment. The increase from 2007 is largely the result of the acquisitions of Twister, Union Iron and Applegate. Maintenance capital expenditures in a fiscal year are funded through cash from operations. Due to seasonality of the Fund’s cash flows, capital expenditures may be funded on a short-term basis through the Fund’s credit facilities (see “Capital Resources”). The Fund defines maintenance capital expenditures as cash outlays required to maintain plant and equipment at current operating capacity and efficiency levels. Non-maintenance capital expenditures encompass other investments including cash outlays required to increase operating capacity or improve operating efficiency. The following capital expenditures were classified as non-maintenance in the three and nine months ended September 30, 2008:
i. Westfield capacity improvement initiative - in addition to capacity enhancements, the initiative improved the quality and finish of the Westfield product through the implementation of a new paint system. The total expenditure prior to 2008 was $3.6 million. An additional $0.5 million was expended in 2008, including $0.2 million in the third quarter. The project is substantially complete and project costs were consistent with management expectations.
ii. Westfield facility in Winnipeg, Manitoba - to allow for capacity gains at Westfield’s primary facility in Rosenort, Manitoba, the Fund leased space and moved certain production to Winnipeg. In 2008 a total of $0.1 million was expended on manufacturing equipment at this facility. Additional non-maintenance capital expenditures are not anticipated to be material.
iii. Union City, Indiana facility – the facility was acquired to allow for a transfer of certain production from western Canada as well as to provide a more efficient facility for Applegate. Management anticipates expenditures of $3.0 million related to manufacturing equipment, paint line equipment and building enhancements. In 2008 the Fund expended $2.7 million on this project, including $1.3 million in the third quarter.
iv. Building and equipment related to the Twister acquisition - in 2008 the Fund expended $0.3 million related to site preparation and material handling equipment. In 2007 the Fund invested $1.6 million in building renovations and certain equipment not included in the purchase agreement.
v. Expansion of Batco manufacturing facility - to enhance capacity and improve productivity, Batco added approximately 6,000 square feet to its facility at a total projected cost of $0.7 million. Expenditures in 2008 totaled $0.3 million, bringing the project cost to date to $0.6 million. The project is complete and costs were consistent with management expectations.
vi. Acquisition of Hi Roller manufacturing facility - in February 2008 the Fund purchased the facility in Sioux Falls, South Dakota that it had previously leased. The total investment was $3.3 million.
vii. Westfield laser cutter – to allow for capacity gains and increased efficiency, Westfield purchased a second laser cutter for $0.6 million.
15

Cash Balance For the three and nine months ended September 30, 2008 the Fund’s cash balance decreased $nil and $20.4 million (2007 – increase of $3.3 million and decrease of $5.4 million). The variance from 2007 was largely the result of increased working capital requirements. CONTRACTUAL OBLIGATIONS (thousands of dollars) Total 2008 2009 2010 2011 2012 + Long-term debt 42,970 4 17 10,743 32,187 19 Operating leases 3,040 298 1,088 964 577 114
Total obligations 46,010 302 1,105 11,707 32,764 133
Long-term debt at September 30, 2008 includes non-amortizing term loans of $42.9 million (comprised of U.S. dollar debt of $37.6 million and CAD $3.0 million), which for financial reporting purposes are shown net of the related deferred financing costs of $0.3 million. The remaining long-term debt relates to GMAC financed vehicle loans. The operating leases relate primarily to vehicle, equipment, warehousing, and facility leases and were entered into in the normal course of business. DISTRIBUTIONS The Fund declared distributions to public unitholders of $6.1 million and $16.9 million for the three and nine months ended September 30, 2008 (2007 - $4.7 million and $14.0 million) and declared distributions to holders of Class B units of AGHLP of $0.1 million and $0.2 million (2007 - $0.1 million and $0.2 million) for the periods then ended. Total distributions declared to public unitholders have increased due to an increase in the number of outstanding units and an increase in the distribution rate. The Fund’s distribution level increased to $0.17 per unit effective August 2008, a $0.03 increase from $0.14 per unit, the distribution rate for all of 2007 and the first seven months of 2008. The Fund’s policy is to make monthly distributions to holders of both Trust units of the Fund and Class B units of AGHLP. The Fund's Declaration of Trust requires that it distribute all taxable income earned in its fiscal period ending December 31. It may be necessary for the Fund to estimate one or more special distributions to achieve this requirement. The Fund’s Board of Trustees reviews financial performance and other factors when assessing the Fund’s distribution levels. An adjustment to distribution levels may be made at such time as the Board determines an adjustment to be in the long-term best interest of the Fund and its unitholders. STANDARDIZED DISTRIBUTABLE CASH The Canadian Institute of Chartered Accountants (CICA) has issued an interpretive release providing guidance on standardized preparation and disclosure of distributable cash for income trusts. The CICA calculation of standardized distributable cash is based on cash flows from
16

operating activities, including the effects of changes in non-cash working capital, less total capital expenditures. Management believes that the standardized distributable cash calculation distorts the Fund’s distributable cash and payout ratios, as the Fund’s non-cash working capital fluctuates dramatically due to the seasonality of the Fund’s business and cash flow cycle. In addition the standardized distributable cash calculation does not contemplate the timing or source of funding for non-maintenance capital expenditures and as a result may not provide complete information with respect to distributable cash ultimately available for distribution. The table below calculates standardized distributable cash for the three and nine month periods ended September 30, 2008 and 2007. Standardized Distributable Cash (thousands of dollars)
Three Months Ended September 30
Nine Months Ended September 30
2008 2007 2008 2007 Cash provided by (used in) operations $8,213 $13,699 $(7,249) $11,016 Capital expenditures (2,026) (595) ( 9,869) (2,820)
Standardized distributable cash $6,187 $13,104 $(17,118) $8,196 Standardized distributable cash per unit $0.48 $1.17 $(1.32) $0.73 Distributions declared $0.48 $0.42 $1.32 $1.26 Standardized Distributable Cash (thousands of dollars)
12 Months Ended September 30, 2008
12 Months Ended September 30, 2007
Previous Twelve Months Standardized cash generated $5,454 $24,048 Distributions declared $1.74 $1.68 Standardized cash generated per unit $0.42 $2.14 Payout ratio – Standardized 413% 78% The decrease in standardized cash and the corresponding increase in payout ratio are primarily due to an increase in non-maintenance capital expenditures and the working capital movements described under “Cash Flow and Liquidity”. ADJUSTED DISTRIBUTABLE CASH Adjusted distributable cash, as defined under “non-GAAP measures”, is the equivalent of EBITDA less maintenance capital expenditures, cash interest expense, and current cash tax expense plus the non-cash charge related to unit award incentive plan. The objective of presenting this measure is to calculate the amount that is available for distribution to unitholders and exchangeable unitholders. The adjusted distributable cash definition excludes changes in working capital as they are necessary to drive organic growth and are expected to be financed by the
17

Fund’s operating facility (See “Capital Resources”). Adjusted distributable cash should not be construed as an alternative to cash flows from operating, investing, and financing activities as a measure of the Fund’s liquidity and cash flows. Adjusted distributable cash can be reconciled to cash provided by operating activities as follows: (in thousands of dollars)
Three Months Ended September 30
Nine Months Ended September 30
2008 2007 2008 2007 Cash provided by (used in) operating activities
$8,213 $13,699 $(7,249) $11,016
Change in non-cash working capital 5,493 (4,427) 37,284 10,999 Long term incentive plan (150) 0 (700) 0 Reversal of tax reserve 0 0 0 (500) Translation gain (loss) on FX (1,729) 1,788 (2,832) 3,693 Gain on sale of equipment 0 0 0 40 Net maintenance capital expenditures (483) (209) (1,969) (1,158)
Adjusted distributable cash (2) $11,344 $10,851 $24,534 $24,090 Weighted average units outstanding 12,955,000 11,225,000 12,955,000 11,225,000 Distributions declared per unit $0.48 $0.42 $1.32 $1.26 Distributable cash generated per unit (2) $0.88 $0.97 $1.89 $2.15 Payout ratio 55% 43% 70% 59%
(1) See “EBITDA and Net Earnings”. (2) See “non-GAAP Measures”.
The following table reconciles standardized distributable cash to adjusted distributable cash: (in thousands of dollars)
Three Months Ended September 30
Nine Months Ended September 30
2008 2007 2008 2007 Standardized distributable cash $6,187 $13,104 $(17,118) $8,196 Change in non-cash working capital 5,493 (4,427) 37,284 10,999 Reversal of tax reserve 0 0 0 (500) Long term incentive plan (150) 0 (700) 0 Translation gain (loss) on FX (1,729) 1,788 (2,832) 3,693 Gain on sale of equipment 0 0 0 40 Non-maintenance capital expenditures 1,543 386 7,900 1,662
Adjusted distributable cash $11,344 $10,851 $24,534 $24,090
18

The following table displays total adjusted distributable cash generated and total distributions declared since the inception of the Fund:
Adjusted Distributable Cash (in thousands of dollars)
Distributable Cash
Generated
Distributions Declared (1)
Payout Ratio
Period Ended December 31, 2004 $ 9,686 $ 9,109 94.0% Year Ended December 31, 2005 22,629 18,918 83.6% Year Ended December 31, 2006 21,979 18,858 85.8% Year Ended December 31, 2007 27,163 19,585 72.1% Nine Months Ended September 30, 2008 24,534 17,101 69.7%
Cumulative since inception $105,991 $83,571 78.8% (1) Distributions declared include special distributions of $1,328,940 in 2004 and $3,367,500 in 2005. Distributions declared for the three and nine months ended September 30, 2008 were $0.48 per unit and $1.32 per unit respectively (2007 - $0.42 per unit and $1.26 per unit). The distributions declared in the three and nine month periods ended September 30, 2008 represent a 47.7% and a 35.4% increase over the per unit distributions disclosed in the Fund’s 2004 prospectus. Distributions in a fiscal year are funded entirely through cash from operations. Due to seasonality distributions may be funded on a short-term basis by the Fund’s operating lines. The Fund's Declaration of Trust requires distribution of all taxable income earned in its fiscal periods ending December 31. Due to a number of tax deductions available to the Fund and its subsidiary entities, and to the acquisitions of its U.S. divisions, since inception the Fund has retained $22.4 million for internal purposes. The amounts retained have been used primarily to strengthen the Fund’s financial position, to fund certain strategic capital projects, to fund certain acquisition costs, and to allow for future strategic or expansionary capital expenditures. CAPITAL RESOURCES The Fund’s credit facility includes operating lines of CAD $10.0 million and USD $2.0 million, and provides for long-term debt of up to USD $66.5 million. As at September 30, 2008, $5.9 million was drawn under the operating lines compared to a cash balance of $3.3 million at September 30, 2007. The Fund’s outstanding long-term debt is CAD $42.6 million (2007 - $48.9 million), comprised of term loans of USD $37.6 million and CAD $3.0 million. Interest rates on both facilities are based on performance calculations. For the three and nine months ended September 30, 2008, the Fund’s effective interest rate on its U.S dollar term debt was 6.5% and 6.9% respectively (2007 - 8.8% and 8.8%), and after consideration of the effect of the Fund’s interest rate swap was 6.2% and 6.1% (2007 – 6.3% in both periods). For the three and nine months ended September 30, 2007, the Fund’s effective interest rate on its Canadian dollar term debt was 4.9% in both periods. See “Financial Instruments”. Under the terms of the credit facility agreement, the operating and term loan facilities will bear interest at prime plus 0.00%, 0.50%, or 1.00% per annum based on performance calculations. The loans mature August 31, 2009 and are extendible annually for an additional one-year term at the lender’s option. Under the terms of the credit facility agreement, if the bank elects to not extend
19

the operating and term loan facilities beyond the current August 31, 2009 maturity date, all amounts outstanding under the facilities become repayable in four equal quarterly instalments of principal, commencing November 30, 2010. CRITICAL ACCOUNTING ESTIMATES The preparation of financial statements in conformity with Canadian generally accepted accounting principles requires management to make estimates and assumptions that affect the reported amounts of assets and liabilities and disclosure of contingent assets and liabilities at the date of the financial statements and the reported amount of revenues and expenses during the period. The Fund believes the accounting policies that are critical to its business relate to the use of estimates regarding the recoverability of accounts receivable and the valuation of inventory, intangibles, goodwill, and future income taxes. Due to the nature of Ag Growth’s business and the credit terms it provides to its customers, estimates and judgments are inherent in the on-going assessment of the recoverability of accounts receivable. In addition, assessments and judgments are inherent in the determination of the net realizable value of inventories and the fair value of goodwill and intangible assets. Goodwill and indefinite life intangible assets are tested for impairment at least annually. Future income taxes are calculated based on assumptions related to the future interpretation of tax legislation, future income tax rates, and future operating results, acquisitions and dispositions of assets and liabilities, and distribution policy. In the normal course of its operations, the Fund may become involved in various legal actions. The Fund maintains, and regularly updates on a case-by-case basis, provisions when the expected loss is both likely and can be reasonably estimated. While management has applied judgment based on assumptions believed to be reasonable in the circumstances, actual results can vary from these assumptions. It is possible that materially different results would be reported using different assumptions. FINANCIAL INSTRUMENTS Risk from foreign exchange arises as a result of variations in exchange rates between the Canadian and the U.S. dollar. The Fund has entered into foreign exchange contracts with a Canadian chartered bank to partially hedge its foreign currency exposure on anticipated U.S. dollar sales transactions and the collection of the related accounts receivable. As at September 30, 2008, the Fund had outstanding the following foreign exchange contracts:
Foreign Exchange Option Contracts Settlement Dates Face Amount
USD (000’s) Call Rate
CND Put Rate
CDN October - December 2008 $3,000 $1.0700 $1.2115 The Canadian dollar exceeded the put rate in October 2008 and, per the terms of the contracts, the November and December options that totalled USD $1.1 million were locked in at a rate of $1.07.
20

Forward Foreign Exchange Contracts
Settlement Dates Face Amount USD (000’s)
Average Rate CDN
CAD Amount (000’s)
October - December 2008 $16,000 1.0268 $16,429 July – December 2009 $36,000 1.0387 $37,393 At September 30, 2008, the fair value of the foreign exchange contracts was a loss of $1,381,318. Subsequent to September 30, 2008 the Fund entered additional forward foreign exchange contracts with settlement dates as follows:
Forward Foreign Exchange Contracts Settlement Dates Face Amount
USD (000’s) Average Rate
CDN CAD Amount
(000’s) January - June 2009 $19,000 1.0893 $20,697 April – September 2010 $30,000 1.1741 $35,223 The Fund is subject to risks associated with fluctuating interest rates on its long-term debt. To manage this risk, as at September 30, 2008 the Fund had outstanding the following interest rate swap transactions with a Canadian chartered bank:
(i) Notional amount of USD $17.5 million, expires August 29, 2009, effective interest rate of 3.88%, resulting in interest charges to the Fund of 3.88% plus a variable rate based on performance calculations.
(ii) Notional amount of USD $2.5 million, expires August 29, 2009, effective interest rate of 3.88%, resulting in interest charges to the Fund of 3.88% plus a variable rate based on performance calculations.
(iii) Notional amount of USD $6.5 million, expires August 29, 2009, effective interest rate of 3.88%, resulting in interest charges to the Fund of 3.88% plus a variable rate based on performance calculations.
At September 30, 2008, the fair value of the interest rate swap contracts was a gain of $131,241. OUTLOOK Strong sales of portable grain handling and aeration equipment, which account for approximately two-thirds of the Fund’s total sales, have resulted in low inventory levels throughout the Fund’s distribution network. In addition, demand in the Fund’s segment of the agricultural space remains strong due to an increase in on-farm storage and successive large corn harvests. As a result, fourth quarter demand for portable grain handling and aeration equipment is expected to significantly exceed historical levels. Management anticipates that strong demand for portable grain handling and aeration equipment will continue into 2009. Consistent with prior years, demand in 2009, particularly in the second half, will be influenced by crop conditions. Demand for Hi Roller and Union Iron stationary grain handling equipment has historically been seasonally weighted towards the second and third quarters. Sales at Hi Roller remain strong but it is not expected that the fourth quarter of 2008 will match the prior year as the fourth quarter of
21

2007 was positively impacted by high levels of activity in the ethanol industry. Although demand in 2009 is contingent on a number of factors, including credit availability, management currently anticipates similar levels of activity compared to 2008. Demand for Twister storage products currently exceeds production capacity. Strong demand has resulted from positive market conditions in western Canada and the rapid development of overseas markets. As a result, Twister’s sales in the fourth quarter of 2008 and into 2009 are expected to exceed historical levels. The Fund anticipates gross margins on portable grain handling and aeration equipment will strengthen in the fourth quarter of 2008 and into 2009 as the impact of previously announced price increases, the benefit of which has been limited in the first nine months of 2008, more significantly impacts financial results. Gross margins on stationary grain handling equipment are expected to remain stable or slightly decrease as activity in this segment of the agricultural space returns to more historical levels. Gross margin on Twister product is expected to remain low over the next several quarters as management initiatives to improve manufacturing efficiency are not expected to significantly impact until the second half of 2009. In addition, the benefit of price increases at Twister in the short term will be largely offset by the impact of higher steel costs as Twister has large amounts of higher priced steel in inventory or on order. The inclusion of Twister, Union Iron and Applegate, which are inherently lower margin businesses, will reduce the consolidated gross margin percentage as compared to 2007. Gross margin percentages at all divisions are impacted by the price of steel and the rate of foreign exchange. Any softening in the price of steel will benefit gross margins, however there will be lag effect as the Fund works though higher priced steel existing in its inventory. This lag effect will be most pronounced at Twister. Any weakening of the Canadian dollar will result in improved gross margin percentages at all divisions compared to the prior year. The value of the Canadian dollar relative to its U.S. counterpart will continue to impact the financial results of the Fund. Any weakening of the Canadian dollar positively impacts sales and gross margin percentages compared to prior periods. In the fourth quarter of 2007, the Fund’s average rate of exchange was $0.99, and in the quarters ended March 31, 2008, June 30, 2008 and September 30, 2008 was $0.99, $1.01 and $1.03 respectively. The Canadian dollar weakened subsequent to September 30, 2008, and unless the rate of exchange returns to levels experienced in the first three quarters of 2008 the Fund expects a positive impact on sales and gross margins in the fourth quarter of 2008 and into 2009. The rate of foreign exchange impacts the gain or loss the Fund may realize on its foreign exchange hedging contracts. In addition, fluctuations in the rate of foreign exchange result in an accounting gain or loss when the Fund translates its U.S. dollar denominated debt into Canadian dollars at each balance sheet date. A weakening of the Canadian dollar, as has been experienced recently, may result in losses on the Fund’s foreign exchange contracts and on the translation of its U.S. dollar denominated debt. Unless the Canadian dollar appreciates significantly, the Fund expects to record a large unrealized loss on the translation of its U.S. dollar debt into Canadian dollars as at December 31, 2008. Management does not currently anticipate that recent developments in the credit markets will have a material adverse effect on the Fund. It is currently anticipated that the North American farmer will have sufficient access to capital to operate throughout this credit market. Management does expect that access to credit may negatively impact sales to commercial grain handling
22
facilities and to certain international markets. Management’s assessment is based on current conditions and may be subject to change if the credit environment deteriorates further. Overall, management expects strong demand for portable grain handling and aeration equipment to continue well into 2009. Strong demand coupled with increased capacity at Westfield and sales price increases at all divisions should allow the Fund to increase sales of portable grain handling and aeration equipment compared to prior periods. Gross margin on these products, which account for approximately two-thirds of the Fund’s total sales, are expected to increase due to previously announced sales price increases, moderating input costs and a weaker Canadian dollar. Demand for stationary grain handling equipment appears to be moderating slightly, however the financial impact on the consolidated results of the Fund is not expected to be significant. Demand for Twister product remains very strong, particularly internationally, and it is expected that margin improvements will be realized in the second half of 2009 due to improved efficiencies, sales price increases and decreasing input costs. LEGISLATION IMPOSING TAXATION ON INCOME TRUSTS In June 2007, the Government of Canada enacted legislation imposing additional income taxes upon publicly traded income trusts, including the Fund, effective January 1, 2011. Prior to June 2007, the Fund estimated the future income tax on certain temporary differences between amounts recorded on its balance sheet for book and tax purposes at a $nil effective tax rate. Upon enactment of the June 2007 legislation, the Fund estimated the effective tax rate to be 31.5% and as a result future income tax liabilities for the period increased by $11.1 million. On December 14, 2007, further legislation was enacted by the federal government to reduce the effective rate of tax on the Fund’s temporary differences from the previous rate of 31.5% to 29.5% in 2011 and 28.0% thereafter. As a result the Fund reduced its expected future income tax liability related to the legislation from $11.1 million to $9.5 million. Temporary differences reversing before 2011 will still give rise to $nil future income taxes. The amount and timing of reversals of temporary differences will depend on the Fund’s future operating results, acquisitions and dispositions of assets and liabilities, and distribution policy. A significant change in any of the preceding assumptions could materially affect the Fund’s estimate of the future tax liability.
Based on its assets and liabilities as at September 30, 2008, the Fund has estimated the amount of its temporary differences and the periods in which these differences will reverse. The Fund estimates that approximately $33.8 million net taxable temporary differences will reverse after January 1, 2011, resulting in a $10.6 million future income tax liability. The taxable temporary differences relate principally to the Fund’s intangible assets. Until 2011, the new legislation does not directly affect the Fund’s cash flow from operations. However, as enacted in its present form, the legislation will, all other things being equal, result in a reduction of cash available for distribution commencing in 2011. On July 14, 2008, the Department of Finance published proposed amendments to the Income Tax Act which are intended to facilitate the conversion of publicly traded income trusts, including the Fund, into corporate form on a tax deferred basis. The proposed amendments address many of the principal substantive and administrative issues that currently arise when structuring such a conversion. The Fund is considering these legislative changes and their possible impact on the Fund.
23

ACCOUNTING POLICY CHANGES Capital Disclosures and Financial Instruments – Presentation and Disclosure Effective January 1, 2008 the Fund has adopted the following accounting standards: The CICA issued three new accounting standards: section 1535, Capital Disclosures, section 3862, Financial Instruments – Disclosures, and section 3863, Financial Instruments – Presentation. These new standards were adopted on January 1, 2008. The required disclosure has been included in the notes to the unaudited financial statements. Section 1535 establishes disclosure requirements about an entity’s capital and how it is managed. The purpose is to enable users of the financial statements to evaluate the entity’s objectives, policies and processes for managing capital. Sections 3862 and 3863 replaced section 3861, Financial Instruments – Disclosure and Presentation, revising and enhancing its disclosure requirements, and carrying forward unchanged its presentation requirements. These new sections place increased emphasis on disclosures about the nature and extent of risks arising from financial instruments and how the entity manages those risks. Inventories The CICA issued section 3031, Inventories, which replaced section 3030, Inventories. This new standard was adopted on January 1, 2008. Section 3031 provides more extensive guidance on measurement, and expands disclosure requirements to increase transparency. The adoption of this standard has had no material impact on the Fund’s financial position or results of operations. NEW ACCOUNTING STANDARDS Goodwill and Intangible Assets As at January 1, 2009, the Fund will be required to adopt the CICA Handbook Section 3064, “Goodwill and Intangible Assets”, which will replace the existing Goodwill and Intangible Assets standard. The new standard revises the requirement for recognition, measurement, presentation and disclosure of intangible assets. The Fund is in the process of evaluating the impact of this new standard. International Financial Reporting Standards ("IFRS") On February 13, 2008, the AcSB confirmed that the use of IFRS will be required by January 1, 2011, with appropriate comparative data from the prior year. Under IFRS, the primary audience is capital markets and as a result, there is significantly more disclosure required, specifically for quarterly reporting. Further, while IFRS uses a conceptual framework similar to Canadian GAAP, there are significant differences in accounting policy that must be addressed.
24

The Fund is currently preparing its IFRS conversion plan and has initiated an assessment of the impact that the conversion may have on financial reporting, business processes, internal controls and information systems. The plan will be aimed in particular at identifying the differences between IFRS and the Fund’s current accounting policies, as well as assessing the impact of various accounting alternatives offered pursuant to IFRS. The financial impact of the transition to IFRS cannot be reasonably estimated at this time. DISCLOSURE CONTROLS AND PROCEDURES AND INTERNAL CONTROLS Disclosure controls and procedures are designed to provide reasonable assurance that all relevant information is gathered and reported to senior management, including the Fund’s Chief Executive Officer and Chief Financial Officer, on a timely basis so that appropriate decisions can be made regarding public disclosure. Management of the Fund is responsible for designing internal controls over financial reporting for the Fund as defined under Multilateral Instrument 52-109 issued by the Canadian Securities Administrators. Management has designed such internal controls over financial reporting, or caused them to be designed under their supervision, to provide reasonable assurance regarding the reliability of financial reporting and the preparation of the financial statements for external purposes in accordance with GAAP. On November 19, 2007 the Fund acquired Union Iron, Inc., and on January 15, 2008 the Fund acquired Applegate Steel Inc. Management has not fully completed its review of internal controls over financial reporting for the newly acquired operations. Management expects to have finalized the design and implementation of internal controls prior to completion of the current fiscal year. For the period covered by this MD&A, management has undertaken specific procedures to satisfy itself with respect to the accuracy and completeness of the acquired operation’s financial information. Management believes that Ag Growth’s existing internal controls over financial reporting, including Union Iron and Applegate, provide reasonable assurance regarding the reliability of financial reporting and the preparation of financial statements for external purposes in accordance with GAAP. There have been no changes in the Fund’s internal controls over financial reporting that occurred in the three month period ended September 30, 2008, that have materially affected, or are reasonably likely to materially affect, the Fund’s internal controls over financial reporting. NON-GAAP MEASURES References to “EBITDA” are to earnings before interest, income taxes, depreciation, and amortization. Management believes that, in addition to net income or loss, EBITDA is a useful supplemental measure in evaluating the Fund’s performance. EBITDA is not a financial measure recognized by GAAP and does not have a standardized meaning prescribed by GAAP. Management cautions investors that EBITDA should not replace net income or loss as an indicator of performance, or cash flows from operating, investing, and financing activities as a measure of the Fund’s liquidity and cash flows. The Fund’s method of calculating EBITDA may differ from the methods used by other issuers. References to “gross margin” are to sales less cost of goods sold. Management believes that, in addition to net income or loss, gross margin provides a useful supplemental measure in evaluating
25

its performance. Gross margin is not a financial measure recognized by Canadian generally accepted accounting principles (“GAAP”) and does not have a standardized meaning prescribed by GAAP. Management cautions investors that gross margin should not replace net income or loss as an indicator of performance, or cash flows from operating, investing, and financing activities as a measure of the Fund’s liquidity and cash flows. The Fund’s method of calculating gross margin may differ from the methods used by other issuers. Standardized and adjusted distributable cash are non-GAAP measures generally used by Canadian income funds as an indicator of financial performance. The Fund defines standardized distributable cash as cash flow from operating activities less capital expenditures. The Fund defines adjusted distributable cash as cash flow from operating activities before the net change in non-cash working capital balances and before items not affecting cash other than items that impact amortization, interest expense, future taxes, or tax reserves, less maintenance capital expenditures (see “Capital Expenditures”). Standardized and adjusted distributable cash are not financial measures recognized by GAAP and do not have a standardized meaning prescribed by GAAP. The method of calculating the Fund’s standardized and adjusted distributable cash may differ from similar computations as reported by similar entities and, accordingly, may not be comparable to distributable cash as reported by such entities. Payout ratio is a non-GAAP measure used by Canadian income funds as an indicator of the amount of generated distributable cash that is distributed to the unitholders. The Fund defines payout ratio as total distributions expressed as a percentage of standardized and adjusted distributable cash. Payout ratio is not a financial measure recognized by GAAP and does not have a standardized meaning prescribed by GAAP. The method of calculating the Fund’s payout ratio may differ from similar computations as reported by similar entities and, accordingly, may not be comparable to payout ratio as reported by such entities. RISKS AND UNCERTAINTIES The risks and uncertainties described below are not the only risks and uncertainties we face. We believe that the risks mentioned are the principal risks relating to our operations. The Fund’s Annual Information Form contains a description of these and other risks that relate to the structure of the Fund. Additional risks and uncertainties not currently known to us or that we currently deem immaterial also may impair operations. If any of the following risks actually occur, our business, results of operations and financial condition, and the amount of cash available for distribution could suffer. Industry Cyclicality The performance of the agricultural industry is cyclical, and to the extent that the agricultural sector declines or experiences a downturn, this is likely to have a negative impact on the farm equipment and commercial grain handling industry, and the business of Ag Growth. The agricultural sector has recently been positively impacted by the expansion of the ethanol industry, and to the extent the ethanol industry declines or experiences a downturn, this is likely to have a negative impact on the farm equipment and commercial grain handling industry, and the business of Ag Growth. Seasonality of Business The seasonality of the demand for Ag Growth’s products results in lower cash flow in the first three quarters of each calendar year and may impact the ability of the Fund to make cash distributions to Unitholders, or the quantum of such distributions, if any. No assurance can be
26

given that the Fund’s credit facility will be sufficient to offset the seasonal variations in Ag Growth’s cash flow. Risk of Decreased Crop Yields Decreased crop yields due to poor weather conditions and other factors are a significant risk affecting Ag Growth. Both reduced crop volumes and the accompanying decline in farm incomes can negatively affect demand for grain handling equipment. Potential Volatility of Production Costs Various materials and components are purchased in connection with Ag Growth’s manufacturing process, some or all of which may be subject to wide price variation. Consistent with past and current practices within the industry, Ag Growth manages its exposure to material and component price volatility by planning and negotiating significant purchases on an annual basis, and passing through to customers, most, if not all, of the price volatility. There can be no assurance that industry dynamics will allow Ag Growth to continue to reduce its exposure to volatility of production costs by passing through price increases to its customers. Commodity Prices, International Trade and Political Uncertainty Prices of commodities are influenced by a variety of unpredictable factors that are beyond the control of Ag Growth, including weather, government (Canadian, United States and other) farm programs and policies, and changes in global demand or other economic factors. The world grain market is subject to numerous risks and uncertainties, including risks and uncertainties related to international trade and global political conditions.
Competition Ag Growth experiences competition in the markets in which it operates. Certain of Ag Growth’s competitors may have greater financial and capital resources than Ag Growth. Ag Growth could face increased competition from newly formed or emerging entities, as well as from established entities that choose to focus (or increase their existing focus) on Ag Growth’s primary markets. As the grain handling equipment sector is fragmented, there is also a risk that a larger, formidable competitor may be created through a combination of one or more smaller competitors. Ag Growth may also face potential competition from the emergence of new products or technology. Acquisition and Expansion Risk The Fund may expand its operations, depending on certain conditions, by acquiring additional businesses, products or technologies. There can be no assurance that the Fund will be able to identify, acquire, or profitably manage additional businesses, or successfully integrate any acquired business, products, or technologies into the business without substantial expenses, delays or other operational or financial difficulties. Furthermore, acquisitions may involve a number of special risks including diversion of management’s attention, failure to retain key personnel, unanticipated events or circumstances, and legal liabilities, some or all of which could have a material adverse effect on the Fund’s performance. In addition, there can be no assurance that acquired businesses, products, or technologies, if any, will achieve anticipated revenues and income. The failure of the Fund to manage its acquisition or expansion strategy successfully could have a material adverse effect on the Fund’s results of operations and financial condition. The Fund is subject to restrictions on its ability to grow without becoming subject to additional income taxes that would otherwise not apply to the Fund until the taxation year commencing January 1, 2011.
27

Business Interruption The operation of the manufacturing facilities of Ag Growth are subject to a number of business interruption risks, including delays in obtaining production materials, plant shutdowns, labour disruptions and weather conditions/natural disasters. Ag Growth may suffer damages associated with such events that it cannot insure against or which it may elect not to insure against because of high premium costs or other reasons. For instance, Ag Growth’s Rosenort facility is located in an area that was affected by widespread floods experienced in Manitoba in 1997, and insurance coverage for this type of business interruption is limited. Ag Growth is not able to predict the occurrence of business interruptions. Litigation In the ordinary course of its business, Ag Growth may be party to various legal actions, the outcome of which cannot be predicted with certainty. One category of potential legal actions is product liability claims. Farming is an inherently dangerous occupation. Grain handling equipment used on farms may result in product liability claims that require not only proper insuring of risk, but management of the legal process as well. Dependence on Key Personnel Ag Growth’s future business, financial condition, and operating results depend on the continued contributions of certain of Ag Growth’s executive officers and other key management and personnel, certain of whom would be difficult to replace. Labour Costs and Shortages and Labour Relations The success of Ag Growth’s business depends on a large number of both hourly and salaried employees. Changes in the general conditions of the employment market could affect the ability of Ag Growth to hire or retain staff at current wage levels. The occurrence of either of these events could have an adverse effect on the Fund’s results of operations. There is no assurance that some or all of the employees of Ag Growth will not unionize in the future. If successful, such an occurrence could increase labour costs and thereby have an adverse affect on Ag Growth’s results of operations. Distribution, Sales Representative and Supply Contracts Ag Growth typically does not enter into written agreements with its dealers, distributors or suppliers. As a result, such parties may, without notice or penalty, terminate their relationship with Ag Growth at any time. In addition, even if such parties should decide to continue their relationship with Ag Growth, there can be no guarantee that the consideration or other terms of such contracts will continue on the same basis. Foreign Exchange Risk Ag Growth generates a majority of its sales in U.S. dollars, but a materially smaller proportion of its expenses are denominated in U.S. dollars. In addition, Ag Growth may denominate its long term borrowings in U.S. dollars. Accordingly, fluctuations in the rate of exchange between the Canadian dollar and the U.S. dollar may significantly impact the Fund’s financial results. To partially mitigate the effects of exchange rate fluctuation, management has implemented a foreign currency hedging strategy. Ag Growth has entered into a series of hedging arrangements to partially mitigate the potential effect of fluctuating exchange rates. To the extent that Ag Growth does not adequately hedge its foreign exchange risk, changes in the exchange rate between the Canadian dollar and the U.S. dollar may have a material adverse effect on Ag Growth’s results of operations, business, prospects and financial condition.
28

Availability of Credit The Fund’s credit facility expires August 31, 2009, and is renewable at the option of the lenders. Should the lenders decline to renew the facility, the Fund is required to repay the outstanding balance in four equal payments commencing November 30, 2010. There can be no guarantee the Fund will be able to obtain alternate financing and no guarantee that future credit facilities will have the same terms and conditions as the existing facility. This may have an adverse effect on the Fund, its ability to pay distributions and the market value of its units. In addition, the business of the Fund may be adversely impacted in the event that the Fund’s customer base does not have access to sufficient financing. Sales related to the construction of commercial grain handling facilities, sales to developing markets, and sales to North American farmers may be impacted. Interest Rates The Fund’s term and operating credit facilities bear interest at rates that are in part dependant on performance based financial ratios. The Fund’s cost of borrowing may be impacted to the extent that the ratio calculation results in an increase in the performance based component of the interest rate. The Fund is party to a number of interest rate swap arrangements to mitigate the impact of fluctuating market interest rates. These swap arrangements mature on August 29, 2009. In the event the Fund enters new interest rate swap arrangements, the rate of the new contracts will be a function of prevailing market rates. To the extent that the Fund has term and operating loans where the fluctuations in the cost of borrowing are not mitigated by interest rate swaps, the Fund’s cost of borrowing may be impacted by fluctuations in market interest rates. Uninsured and Underinsured Losses Ag Growth will use its discretion in determining amounts, coverage limits and deductibility provisions of insurance, with a view to maintaining appropriate insurance coverage on its assets and operations at a commercially reasonable cost and on suitable terms. This may result in insurance coverage that, in the event of a substantial loss, would not be sufficient to pay the full current market value or current replacement cost of its assets or cover the cost of a particular claim. Nature of Trust Units Securities such as the Trust Units are hybrids in that they share certain attributes common to both equity securities and debt instruments. The Trust Units do not represent a direct investment in the business of Ag Growth/AGLP and should not be viewed by investors as shares or debt of Ag Growth/AGLP. As holders of Trust Units, Unitholders will not have the statutory rights normally associated with ownership of shares of a corporation including, for example, the right to bring “oppression” or “derivative” actions. The Trust Units represent a fractional interest in the Fund. The Fund’s primary asset will be its interest in AGOT. The price per Trust Unit is a function of anticipated distributable cash. The rights of Unitholders are established by the Declaration of Trust. Although the Declaration of Trust confers upon a Unitholder many of the same protections, rights and remedies as an investor would have as a shareholder of a corporation governed by the Canada Business Corporations Act (the "CBCA"), significant differences exist. Taxation of Income Trusts There can be no assurance that Canadian federal income tax laws or the judicial interpretation thereof or the administrative and/or assessing practices of the Canada Revenue Agency and/or the treatment of mutual fund trusts will not be changed in a manner that adversely affects the holders of Trust Units.
29

30
As described in the Fund’s audited financial statements for the year ended December 31, 2007, in June 2007 the Government of Canada enacted legislation imposing additional income taxes on the Fund for taxation years commencing January 1, 2011. Effective January 1, 2011, taxable income generated by most income trusts will be subject to tax at a special rate based on the federal-provincial corporate tax rates. Unitholders will be taxed on such distributions as if they have received a taxable dividend paid by a taxable Canadian corporation. There will be a transitional period so that existing income trusts and their investors will not be subject to the proposed tax until 2011. The legislation also specifies that "undue growth" may result in immediate taxation of income trusts that would otherwise not be subject to taxation until 2011. The legislation provides that the maximum growth permissible is 100% of an entity's market capitalization determined as at the close of trading on October 31, 2006, and that the growth limit is phased in annually from 2007 - 2010. The legislation could have an adverse effect on the Fund, its ability to pay distributions and the market value of its units. There can be no assurance that the Fund will be able to reorganize its legal and tax structure to reduce the expected impact of the legislation. In addition, there can be no assurance that the Fund will maintain its "grandfathered" status under the legislation until 2011. If the Fund exceeds "normal growth" during the transitional period from October 31, 2006 to December 31, 2010, the legislation would become effective on a date earlier than January 1, 2011. Loss of grandfathered status could have a material and adverse effect on the value of the Units. Until June 2007 the Fund had been tax effecting the reversal of taxable temporary differences at a nil tax rate on the assumption that the Fund would make sufficient tax deductible cash distributions to unitholders such that the Fund’s taxable income would be nil for the foreseeable future. The new legislation limits the tax deductibility of cash distributions such that income taxes may become payable in the future. The Fund has estimated its future income taxes based on its best estimates of results of operations and tax pool claims and cash distributions in the future assuming no material change to the Fund’s current organizational structure. As currently interpreted, Canadian GAAP does not permit the Fund’s estimate of future income taxes to incorporate any assumptions related to a change in organizational structure until such structures are given legal effect. The Fund’s estimate of its future income taxes will vary as do the Fund’s assumptions pertaining to the factors described above, and such variations may be material. ADDITIONAL INFORMATION Additional information relating to the Fund, including the Fund’s most recent Annual Information Form, is available on SEDAR (www.sedar.com). INVESTOR RELATIONS Steve Sommerfeld 1301 Kenaston Blvd, Winnipeg, MB R3P 2P2 Phone: (204) 489-1855 Email: [email protected]

Unaudited Interim Consolidated Financial Statements Ag Growth Income Fund September 30, 2008
31

Ag Growth Income Fund
UNAUDITED INTERIM CONSOLIDATED BALANCE SHEETS
As at As at September 30, December 31, 2008 2007 $ $ ASSETS Current Cash and cash equivalents — 20,410,588 Cash held in trust [note 9[b]] 264,975 1,488,100 Accounts receivable [note 10[c]] 33,627,452 9,923,311 Inventory [note 3] 40,749,826 28,958,667 Prepaid expenses and other assets [note 10] 1,099,982 1,972,143 Total current assets 75,742,235 62,752,809 Property, plant and equipment, net 29,327,788 21,035,091 Goodwill 52,461,637 51,925,887 Intangible assets, net 72,730,567 74,969,253 Future income taxes 625,500 — 230,887,727 210,683,040 LIABILITIES AND UNITHOLDERS' EQUITY Current Bank indebtedness [note 7] 5,850,857 — Accounts payable and accrued liabilities 16,325,548 10,312,067 Customer deposits 2,847,062 11,558,632 Income taxes payable 1,555,409 369,484 Distributions payable 2,202,350 1,813,700 Acquisition, transaction and financing costs payable
[note 9[b]]
264,975
2,563,676 Current portion of long-term debt [note 17] 16,608 11,978 Total current liabilities 29,062,809 26,629,537 Long-term debt [note 17] 42,606,863 25,622,780 Future income taxes 10,600,000 9,574,500 Long-term incentive plan [note 13] 186,328 799,596 Unit award incentive plan [note 14] 2,039,135 1,402,093 Total liabilities 84,495,135 64,028,506 Unitholders' equity 146,392,592 146,654,534 230,887,727 210,683,040 See accompanying notes On behalf of the Board of Trustees: (signed) Bill Lambert (signed) John R. Brodie, FCA Trustee Trustee
32

Ag Growth Income Fund
UNAUDITED INTERIM CONSOLIDATED STATEMENTS OF EARNINGS
Three-month period ended Nine-month period ended
September 30, September 30, September 30, September 30, 2008 2007 2008 2007
$ $ $ $ Sales 60,011,730 40,762,467 151,099,644 103,807,821 Cost of goods sold 38,133,667 23,492,282 97,329,509 61,743,476 Gross margin 21,878,063 17,270,185 53,770,135 42,064,345 Expenses Selling, general and
administrative
6,565,099
4,780,057
19,304,572
13,397,095 Professional fees 164,822 157,789 522,552 463,543 Long-term incentive plan
[note 13]
150,000
157,152
700,000
471,456 Unit Award Incentive Plan
(recovery) [note 14]
(219,828)
396,896
637,042
686,312 Research and development 262,518 135,101 797,166 639,901 Capital taxes (36,493) 62,500 77,007 187,500 Foreign exchange loss (gain) 1,241,530 (1,117,489) 1,536,729 (2,253,941) Other loss (income) (71,738) 126,204 (313,036) (30,668) 8,055,910 4,698,210 23,262,032 13,561,198 Earnings before the following 13,822,153 12,571,975 30,508,103 28,503,147 Interest expense
Short-term debt 114,679 100,410 250,670 186,957 Long-term debt 657,609 754,766 1,750,980 1,954,512
772,288 855,176 2,001,650 2,141,469 Earnings before amortization and
income taxes
13,049,865
11,716,799
28,506,453
26,361,678 Amortization of property, plant
and equipment
1,321,402
994,539
3,867,065
2,172,680 Amortization of intangible assets 741,324 577,447 2,238,686 1,732,341 2,062,726 1,571,986 6,105,751 3,905,021 Earnings before income taxes 10,987,139 10,144,813 22,400,702 22,456,657 Provision for income taxes
[note 8]
Current 1,094,254 1,108,428 2,898,790 1,411,749 Future 140,000 60,000 400,000 11,353,400 1,234,254 1,168,428 3,298,790 12,765,149 Net earnings for the period 9,752,885 8,976,385 19,101,912 9,691,508 Basic and diluted net earnings
per unit [note 14]
$0.75
$0.80
$1.47
$0.86 Basic and diluted weighted
average number of units outstanding
12,955,000
11,225,000
12,955,000
11,225,000 See accompanying notes
33

Ag Growth Income Fund
UNAUDITED INTERIM CONSOLIDATED STATEMENTS OF COMPREHENSIVE INCOME
Three-month period ended Nine-month period ended September 30, September 30, September 30, September 30, 2008 2007 2008 2007
$ $ $ $ Net earnings for the period 9,752,885 8,976,385 19,101,912 9,691,508 Other comprehensive income
(loss)
Change in fair value of derivatives designated as cash flow hedges
(1,572,514)
1,352,942
(1,581,522)
3,989,262 Realized gains on derivatives
designated as cash flow hedges recognized in net earnings in the current period
(31,247)
(879,514)
(207,285)
(893,682) Unrealized losses (gains) on
dual purpose derivatives designated as cash flow hedges in prior periods recognized in net earnings in the current period
136,814
(219,219)
339,569
(603,641) Other comprehensive income
(loss) for the period
(1,466,947)
254,209
(1,449,238)
2,491,939 Comprehensive income 8,285,938 9,230,594 17,652,674 12,183,447
See accompanying notes
34

Ag Growth Income Fund
UNAUDITED INTERIM CONSOLIDATED STATEMENTS OF UNITHOLDERS' EQUITY Page 1
Nine-month period ended September 30, 2008
Accumulated other Unitholders' Accumulated Accumulated comprehensive Contributed capital earnings distributions income (loss) surplus Total $ $ $ $ $ $
Balance, December
31, 2007 152,799,626 59,784,898 (66,469,489) 539,499
— 146,654,534 Net earnings
for the period — 19,101,912 — —
— 19,101,912 Units
purchased in the market under the LTIP [note 13] (2,170,005) — — —
— (2,170,005)Settlement of
LTIP obligation [note 13] — — — —
1,364,596 1,364,596 Distributions
declared [note 16] — — (17,100,600) —
— (17,100,600)Issuance costs (8,607) — — — — (8,607)Other compre- hensive loss
for the period — — — (1,449,238)
— (1,449,238)Balance, September
30, 2008 150,621,014 78,886,810 (83,570,089) (909,739)
1,364,596 146,392,592
35

Ag Growth Income Fund
UNAUDITED INTERIM CONSOLIDATED STATEMENTS OF UNITHOLDERS' EQUITY Page 2
Nine-month period ended September 30, 2007 and year ended December 31, 2007
Accumulated other Unitholders' Accumulated Accumulated comprehensive capital earnings distributions income (loss) Total $ $ $ $ $
Balance, December 31, 2006 110,430,194 47,419,320 (46,884,889) — 110,964,625 Transition
adjustment — — — (276,679) (276,679)Net earnings for the
period — 9,691,508 — — 9,691,508 Distributions
declared [note 16] — — (14,143,500) — (14,143,500)Other
comprehensive income for the period — — — 2,491,939 2,491,939
Balance, September 30, 2007 110,430,194 57,110,828 (61,028,389) 2,215,260 108,727,893 Net earnings for the
period
—
2,674,070
—
— 2,674,070
Distributions declared
—
—
(5,441,100)
—
(5,441,100)
Other comprehensive loss for the period
—
—
—
(1,675,761)
(1,675,761)Issuance of units 44,980,000 — — — 44,980,000 Issuance costs (2,610,568) — — — (2,610,568)Balance, December 31, 2007
152,799,626
59,784,898
(66,469,489)
539,499
146,654,534 See accompanying notes
36

Ag Growth Income Fund
UNAUDITED INTERIM CONSOLIDATED STATEMENTS OF CASH FLOWS Page 1
Three-month period ended Nine-month period ended
September 30, September 30, September 30, September 30, 2008 2007 2008 2007
$ $ $ $ OPERATING ACTIVITIES Net earnings for the period 9,752,885 8,976,385 19,101,912 9,691,508 Add (deduct) items not affecting cash Amortization 2,062,726 1,571,986 6,105,751 3,905,021 Future income taxes 140,000 60,000 400,000 11,353,400 Translation loss (gain) on foreign
exchange
1,729,843
(1,787,966)
2,832,403
(3,693,222) Non-cash component of interest
expense
89,697
55,191
258,115
112,134 Long-term incentive plan [note 13] 150,000 — 700,000 — Unit award incentive plan
(recovery) [note 14]
(219,828)
396,896
637,042
686,312 Loss (gain) on sale of property,
plant and equipment
—
—
235
(39,803) 13,705,323 9,272,492 30,035,458 22,015,350 Net change in non-cash working
capital balances related to operations [note 12]
(5,492,745)
4,426,487
(37,284,097)
(10,999,840)Cash provided by (used in) operating activities
8,212,578
13,698,979
(7,248,639)
11,015,510
INVESTING ACTIVITIES Acquisition of property, plant and
equipment
(2,026,277)
(595,123)
(9,869,399)
(2,819,757)Acquisition of assets of Applegate
Steel Inc., net of cash acquired [note 9]
—
—
(3,324,435)
— Acquisition of assets of Hansen
Manufacturing Corp. [note 9]
—
—
—
(1,899,549)Acquisition of assets of Twister Pipe
Ltd. [note 9]
—
(1,143,000)
(20,030)
(7,144,408)Acquisition of shares in Union Iron,
Inc. [note 9]
(1,457)
—
(107,947)
— Increase in loan receivable — — — (903,890)Proceeds from sale of property, plant
and equipment
37,379
—
37,379
70,000 Payments in current period with
respect to acquisitions in prior periods
10,325
—
(2,298,701)
— Cash used in investing activities (1,980,030) (1,738,123) (15,583,133) (12,697,604)
37
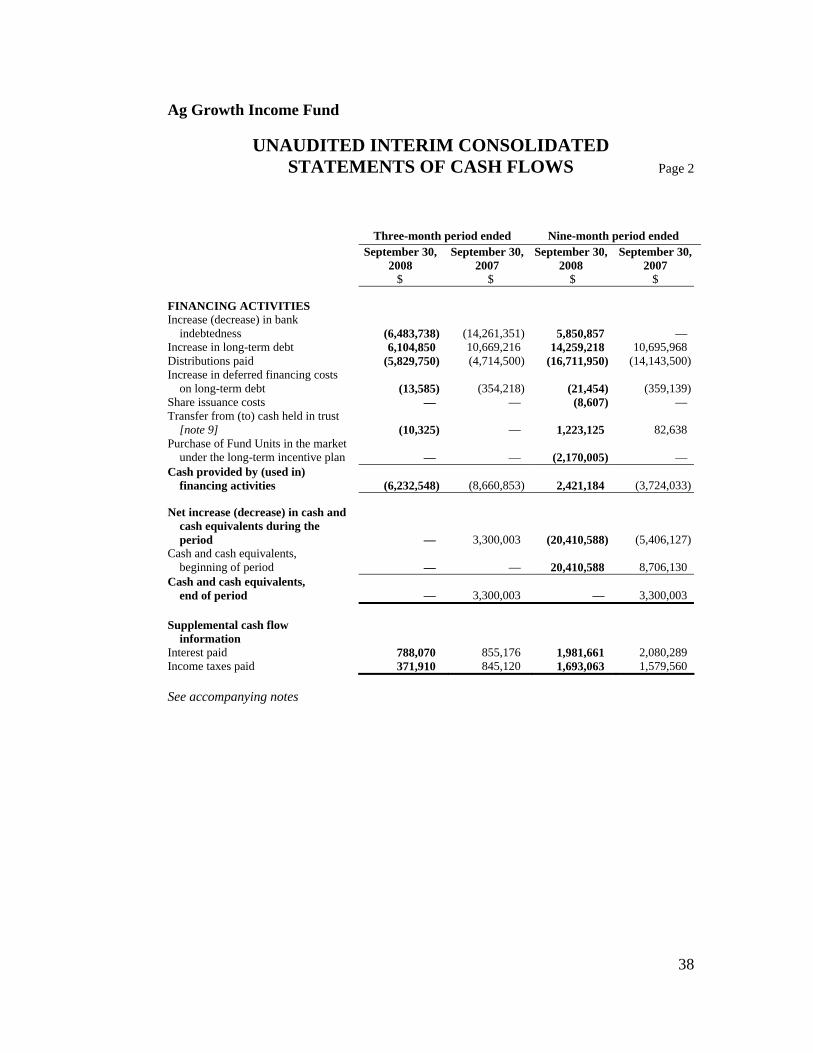
38
Ag Growth Income Fund
UNAUDITED INTERIM CONSOLIDATED STATEMENTS OF CASH FLOWS Page 2
Three-month period ended Nine-month period ended
September 30, September 30, September 30, September 30, 2008 2007 2008 2007
$ $ $ $ FINANCING ACTIVITIES Increase (decrease) in bank
indebtedness
(6,483,738)
(14,261,351)
5,850,857
— Increase in long-term debt 6,104,850 10,669,216 14,259,218 10,695,968 Distributions paid (5,829,750) (4,714,500) (16,711,950) (14,143,500)Increase in deferred financing costs
on long-term debt
(13,585)
(354,218)
(21,454)
(359,139)Share issuance costs — — (8,607) — Transfer from (to) cash held in trust
[note 9]
(10,325)
—
1,223,125
82,638 Purchase of Fund Units in the market
under the long-term incentive plan
—
—
(2,170,005)
— Cash provided by (used in) financing activities
(6,232,548)
(8,660,853)
2,421,184
(3,724,033)
Net increase (decrease) in cash and
cash equivalents during the period
—
3,300,003
(20,410,588)
(5,406,127)Cash and cash equivalents, beginning of period
—
—
20,410,588
8,706,130
Cash and cash equivalents, end of period
—
3,300,003
—
3,300,003
Supplemental cash flow
information
Interest paid 788,070 855,176 1,981,661 2,080,289 Income taxes paid 371,910 845,120 1,693,063 1,579,560 See accompanying notes

Ag Growth Income Fund
NOTES TO UNAUDITED INTERIM CONSOLIDATED FINANCIAL STATEMENTS
September 30, 2008
1. DESCRIPTION OF BUSINESS Ag Growth Income Fund [the "Fund"] is an unincorporated, open-ended, limited purpose trust established under the laws of the Province of Ontario by a Declaration of Trust made as at March 24, 2004. The Fund and its wholly-owned subsidiaries conduct business in the grain handling, storage, and conditioning market. Each unitholder participates pro rata in distributions of net earnings and, in the event of termination, participates pro rata in the net assets remaining after satisfaction of all liabilities. Income tax obligations related to the distribution of net earnings by the Fund are the obligations of the unitholders. 2. BASIS OF PRESENTATION The unaudited interim consolidated financial statements have been prepared in accordance with Canadian generally accepted accounting principles ["GAAP"]. They have been prepared using the same accounting policies and methods of application as disclosed in the Fund's audited consolidated financial statements for the year ended December 31, 2007, except as described in note 3. These unaudited interim consolidated financial statements do not include all of the information and notes to the financial statements required by Canadian GAAP for annual financial statements and therefore should be read in conjunction with the audited consolidated financial statements and notes included in the Fund's annual report for the year ended December 31, 2007. Accounting measurements at interim dates inherently involve a greater reliance on estimates than at year end. In the opinion of management, the unaudited interim consolidated financial statements include all adjustments of a normal recurring nature to present fairly the consolidated financial position of the Fund as at September 30, 2008.
39

Ag Growth Income Fund
NOTES TO UNAUDITED INTERIM CONSOLIDATED FINANCIAL STATEMENTS
September 30, 2008
3. CHANGES IN ACCOUNTING POLICIES On January 1, 2008, the Fund adopted the following Canadian Institute of Chartered Accountants ["CICA"] Handbook Sections: Section 3031, "Inventories" The new standard replaces the previous inventories standard and requires inventories to be valued on a first-in, first-out or weighted average basis, which is consistent with the Fund's accounting policies. The new standard requires the measurement of inventories at the lower of cost and net realizable value and provides guidance on the determination of cost, including any write-down to net realizable value. The adoption of this standard has had no material impact on the financial position or results of operations as reported in the Fund's unaudited interim consolidated financial statements. The Fund values inventory at the lower of cost and net realizable value. The cost of finished goods includes direct costs and an allocation of fixed manufacturing overhead. Cost is determined on a first-in, first-out basis. Section 3862, "Financial Instruments - Disclosures" and Section 3863, "Financial Instruments - Presentation" The new disclosure standards increase the Fund's disclosure regarding the nature and extent of the risks associated with financial instruments and how those risks are managed [note 10]. Section 3863 carries forward the presentation standards from Section 3861. Section 1535, "Capital Disclosures" The new standard requires the Fund to disclose its objectives, policies and processes for managing its capital structure [note 5]. 4. RECENT ACCOUNTING PRONOUNCEMENTS As at January 1, 2009, the Fund will be required to adopt the CICA Handbook Section 3064, "Goodwill and Intangible Assets", which will replace the existing "Goodwill and Intangible Assets" standard. The new standard revises the requirement for recognition, measurement, presentation and disclosure of intangible assets. The Fund is in the process of evaluating the impact of this new standard.
40

Ag Growth Income Fund
NOTES TO UNAUDITED INTERIM CONSOLIDATED FINANCIAL STATEMENTS
September 30, 2008
In February 2008, the Accounting Standards Board confirmed that International Financial Reporting Standards ["IFRS"] will replace Canadian GAAP in 2011 for profit-oriented Canadian publicly accountable enterprises. The Fund will be required to report its results in accordance with IFRS starting in 2011. The Fund is assessing the potential impacts of this changeover and development of its plan accordingly. 5. CAPITAL STRUCTURE The Fund's capital structure is comprised of unitholders' equity and long-term debt. The Fund's objectives when managing its capital structure are to maintain and preserve the Fund's access to capital markets, continue its ability to meet its financial obligations, including the payment of distributions, and finance organic growth and acquisitions. The Fund monitors its capital structure using non-GAAP financial metrics including long-term debt to earnings before interest, taxes, depreciation and amortization ["EBITDA"] for the immediately preceding 12-month period and long-term debt to unitholders' equity. The Fund's optimal capital structure targets to maintain its long-term debt to EBITDA ratio at levels below 2.5, after taking into consideration the impacts of industry cyclicality and acquisitions. The table below calculates the ratio based on EBITDA achieved in the previous 12 months: As at
September 30, 2008 As at
December 31, 2007 Long-term debt $42.6 million $25.6 million EBITDA $34.5 million $32.4 million Ratio 1.23 times 0.79 times The Fund's optimal capital structure targets to maintain its long-term debt to unitholders' equity ratio at levels below 1.0, after taking into consideration the impacts of industry cyclicality and acquisitions: As at
September 30, 2008 As at
December 31, 2007 Long-term debt $42.6 million $25.6 million Unitholders' equity $146.4 million $146.7 million Ratio 0.29 times 0.18 times
41

Ag Growth Income Fund
NOTES TO UNAUDITED INTERIM CONSOLIDATED FINANCIAL STATEMENTS
September 30, 2008
The Fund's capital management objectives, evaluation measures, definitions and targets have remained unchanged over the periods presented. The Fund is subject to certain financial covenants in its credit facility agreement which must be maintained to avoid acceleration of the termination of the agreement. The Fund is in compliance with all financial covenants. As a result of the Canadian trust taxation passed in June 2007 and effective January 1, 2011, the Fund is subject to certain capital growth restrictions referred to as "normal growth" equity rules. These rules limit the amount of unitholders' capital that can be issued by the Fund in each of the next three years. If the Fund exceeds "normal growth" during the transitional period from October 31, 2006 to December 31, 2010, the legislation would become effective on a date earlier than January 1, 2011. As at September 30, 2008, the Fund is in compliance with capital growth restrictions. 6. SEASONALITY OF BUSINESS Interim period revenues and earnings historically reflect some seasonality. The third quarter is typically the strongest primarily due to high in-season demand at the farm level. The Fund's collections of accounts receivable are weighted towards the third and fourth quarters. This collection pattern, combined with seasonally high sales in the third quarter, results in accounts receivable levels increasing throughout the year and normally peaking in the third quarter. As a result of these working capital movements, historically, the Fund's use of its bank revolver is typically highest in the first and second quarters. The revolver balance begins to decline in the third quarter as collections of accounts receivable increase. The Fund would expect to repay its revolver by the fourth quarter of each year. 7. BANK INDEBTEDNESS The Fund has operating facilities of Cdn. $10 million and U.S. $2.0 million. The facilities bear interest at a rate of prime to prime plus 1.0% per annum based on performance calculations. The effective interest rates during the three-month and nine-month periods ended September 30, 2008 on the Fund's Canadian dollar term debt were 4.5% and 4.9%, respectively [2007 - 6.2% and 6.1%]. The effective interest rates during the three-month and nine-month periods ended September 30, 2008 on the Fund's U.S. dollar term debt were 6.5% and 6.9%, respectively [2007 - 8.8%]. At September 30, 2008, there was $5,171,814 and U.S. $675,000 outstanding under these facilities, respectively [December 31, 2007 - nil]. Collateral for the operating facilities includes a general security agreement over all assets, first position collateral mortgages on land and buildings, assignments of rents and leases and security agreements for patents and trademarks.
42

Ag Growth Income Fund
NOTES TO UNAUDITED INTERIM CONSOLIDATED FINANCIAL STATEMENTS
September 30, 2008
8. INCOME TAXES Income tax obligations relating to distributions from the Fund are the obligations of the unitholders and accordingly, no current income tax provision is recorded in respect to this income. A provision for income taxes is recognized for the corporate subsidiaries of the Fund, which are subject to tax. For the three-month and nine-month periods ended September 30, 2008, the Fund has an income tax expense of $1,234,254 and $3,298,790, respectively [2007 - $1,168,428 and $12,765,149, respectively]. Due to new legislation enacted by the Government of Canada in June 2007 that imposed additional income taxes upon publicly traded income trusts effective January 1, 2011, the Fund recorded an additional future income tax provision of approximately $11.1 million for the nine-month period ended September 30, 2007. 9. ACQUISITIONS [a] Applegate Steel Inc. Effective January 15, 2008, the Fund acquired substantially all of the operating assets of Applegate Steel Inc. ["Applegate"], a manufacturer of livestock equipment, for cash consideration of $3,441,193, which includes transaction costs of $391,511. The acquisition has been accounted for by the purchase method with the results of Applegate's operations included in the Fund's earnings from the date of acquisition. As a result of the timing of the acquisition in relation to the Fund's reporting schedule, the purchase price allocation has not been finalized. Management is in the process of updating its estimates and adjustments to the initial estimates may be required, and these adjustments may be material. The assets and liabilities of Applegate have been recorded in the unaudited interim consolidated financial statements at their estimated fair values, as follows: $ Net assets acquired
Cash 116,758 Accounts receivable 1,276,610 Inventory 1,217,661 Prepaid expenses and other assets 55,731 Property, plant and equipment 2,327,977 Accounts payable and accrued liabilities (1,961,317) Goodwill 407,773 Cash consideration, including transaction costs 3,441,193
Goodwill at the time of acquisition as noted above is deductible for tax over a period of 15 years.
43

Ag Growth Income Fund
NOTES TO UNAUDITED INTERIM CONSOLIDATED FINANCIAL STATEMENTS
September 30, 2008
[b] Prior year acquisitions As described in the December 31, 2007 audited consolidated financial statements, the Fund acquired the assets of Hansen Manufacturing Corp. on December 31, 2006, the assets of Twister Pipe Ltd. on May 15, 2007 and the shares of Union Iron, Inc. on November 19, 2007. Subsequent to December 31, 2007, transaction costs were paid from cash and cash held in trust. As at September 30, 2008, the Fund had cash held in trust remaining in the amount of $264,975 relating to the acquisition of Union Iron, Inc. 10. FINANCIAL INSTRUMENTS AND FINANCIAL RISK FACTORS The Fund has the following financial instruments: cash and cash equivalents, accounts receivable, bank indebtedness, accounts payable and accrued liabilities, acquisition, transaction and financing costs payable, long-term debt, interest rate swap arrangements and foreign exchange contracts. The Fund is exposed to financial risks arising from financial assets and liabilities. The Fund's objectives in managing these risks are to protect from volatility in net earnings and to minimize exposure from fluctuations in market rates. The financial risks include foreign exchange risk, interest rate risk, credit risk and liquidity risk as follows: [a] Foreign exchange risk The Fund operates primarily in North America and, as a result, fluctuations in the rate of exchange between the U.S. and Canadian dollar can have a significant effect on the Fund's reported results. To mitigate exposure to the fluctuating exchange rates, the Fund enters into foreign exchange contracts and denominates a portion of its debt in U.S. dollars. At September 30, 2008, the Fund's U.S. dollar denominated debt totalled U.S. $37.6 million and the Fund had entered into the following foreign exchange contracts to sell U.S. dollars in order to hedge their foreign exchange risk: Settlement dates Face value Average rate U.S. $ Cdn. $ October 2008 to December 2008 16,000,000 1.0268 July 2009 to December 2009 36,000,000 1.0387
44

Ag Growth Income Fund
NOTES TO UNAUDITED INTERIM CONSOLIDATED FINANCIAL STATEMENTS
September 30, 2008
At September 30, 2008, the Fund had outstanding a series of foreign exchange call and put options as follows: Settlement dates Face value Call Put U.S. $ Cdn. $ Cdn. $ October 2008 to December 2008 3,000,000 1.07 1.2115 The Fund's sales denominated in U.S. dollars for the nine-month period ended September 30, 2008 were U.S. $114.0 million, and the total of its cost of goods sold and its selling, general and administrative expenses denominated in that currency was U.S. $53.9 million. Accordingly, a 10% increase or decrease in the exchange rate between the Canadian and U.S. dollar would result in an $11.4 million increase or decrease in sales and a total increase or decrease of $5.4 million in its cost of goods sold and its selling, general and administrative expenses and a total increase or decrease of $1.4 million in foreign exchange loss (gain). Subsequent to September 30, 2008, the Fund entered into additional forward foreign exchange contracts with a face value of U.S. $49 million. [b] Interest rate exposures The Fund is subject to risks associated with fluctuating interest rates on its long-term debt. To manage this risk, the Fund has entered into a number of interest rate swap transactions with a Canadian chartered bank and has limited its exposure to changes in interest rates on its variable rate debt as follows: Notional amounts of U.S. $17.5 million, U.S. $6.5 million and U.S. $2.5 million expire August 29, 2009, effective interest rate of 3.88%, resulting in interest charges to the Fund of 3.88% plus a variable rate based on performance calculations. At September 30, 2008, if interest rates on debt were to fluctuate by 1%, and all other variables were held constant, the impact on the Fund's earnings before income taxes would be $116,582.
45

Ag Growth Income Fund
NOTES TO UNAUDITED INTERIM CONSOLIDATED FINANCIAL STATEMENTS
September 30, 2008
[c] Credit risk Credit risk is the risk that a customer will fail to perform an obligation or fail to pay amounts due causing a financial loss. A substantial portion of the Fund's accounts receivable is with customers in the agriculture industry and is subject to normal industry credit risks. This credit exposure is mitigated through the use of credit practices that limit transactions according to the customer's credit quality and due to the accounts receivable being spread over a large number of customers. The Fund establishes a reasonable allowance for non-collectible amounts with this allowance netted against the accounts receivable on the unaudited interim consolidated balance sheets. The Fund does not hold collateral as security for these balances. The Fund does not believe it has significant concentration risk. The maximum credit risk exposure associated with accounts receivable is the total carrying value. As is typical in the agriculture sector, the Fund may offer extended terms on its accounts receivable to match the cash flow cycle of its customer. The table below sets out the details of the accounts receivable balances outstanding as at September 30, 2008, based on the status of the receivable in relation to when the receivable was due and payable: $ Neither impaired nor past due 29.5 million Not impaired and past the due date as follows:
Within 30 days 1.6 million 31 to 60 days 1.0 million 61 to 90 days 0.5 million Over 90 days 1.3 million
Allowance for doubtful accounts (0.3) million Total receivables 33.6 million There are no accounts receivable deemed uncollectible. In the event that an amount is deemed uncollectible, the credit loss is charged against the allowance.
46

Ag Growth Income Fund
NOTES TO UNAUDITED INTERIM CONSOLIDATED FINANCIAL STATEMENTS
September 30, 2008
[d] Liquidity risk Liquidity risk is the risk the Fund will encounter difficulties in meeting its financial liability obligations. The Fund manages its liquidity risk through cash and debt management. In managing liquidity risk, the Fund has access to committed short and long-term debt facilities as well as to equity markets, the availability of which is dependent on market conditions. The Fund believes it has sufficient funding through the use of these facilities to meet foreseeable borrowing requirements. Trade payables are due within one year and long-term debt is due August 31, 2009 and is extendible annually for an additional one-year term at the lender's option. Under the terms of the Fund's credit facility arrangement, if the bank elects to not extend the credit facilities beyond the current August 31, 2009 maturity date, all amounts outstanding under the facilities become repayable in four equal quarterly instalments of principal, commencing on November 30, 2010. Fair value As disclosed in the December 31, 2007 annual audited consolidated financial statements, the Fund has made the following classifications of its financial instruments: • Cash and cash equivalents are classified as "assets held-for-trading" and are measured at fair
value. Gains and losses resulting from the periodic revaluation are recorded in net earnings for the period.
• Accounts receivable are classified as "loans and receivables" and are recorded at fair value upon initial measurement. Subsequent measurements are recorded at amortized cost using the effective interest rate method.
• Bank indebtedness, accounts payable and accrued liabilities and acquisition, transaction and financing costs payable are classified as "other financial liabilities" and are measured at their fair value upon initial measurement. Subsequent measurements are recorded at amortized cost using the effective interest rate method.
• Long-term debt is classified as an "other financial liability" and is initially measured at fair value. Subsequent measurements are recorded at amortized cost using the effective interest rate method. The deferred financing costs are netted against the carrying value of the related debt and amortized into interest expense using the effective interest rate method.
• Derivative financial instruments are measured at fair value, even when they are part of a hedging relationship. All changes in fair value are recorded in earnings unless cash flow hedge accounting is used, in which case the effective portion of the changes in fair value is recorded in other comprehensive income.
47

Ag Growth Income Fund
NOTES TO UNAUDITED INTERIM CONSOLIDATED FINANCIAL STATEMENTS
September 30, 2008
At September 30, 2008, the carrying value of cash and cash equivalents, accounts receivable, bank indebtedness, accounts payable and accrued liabilities and acquisition, transaction and financing costs payable approximates their fair value due to the relatively short period to maturity. Long-term debt with a variable interest rate is carried at amortized cost, which reflects fair value as the interest rate is the current market rate available to the Fund. Derivatives are valued based on market quotations. However, when financial instruments lack an available trading market, fair value is determined using management's estimates and is calculated using market factors with similar characteristics and risk profiles. At September 30, 2008, the fair value and carrying value of the foreign exchange contracts was an unrealized loss of $1,381,318 [December 31, 2007 - gain of $647,063] and the fair value and carrying value of the interest rate swaps that are part of an effective hedging relationship was an unrealized gain of $131,241 [December 31, 2007 - loss of $107,564]. Derivative assets are included in prepaid expenses and other assets. Derivative liabilities are recorded in accounts payable and accrued liabilities. Over the next 12 months, the Fund expects to realize an estimated $1.0 million in net losses presently reported in accumulated other comprehensive income as unrealized losses as at September 30, 2008. 11. SEGMENTED DISCLOSURE The Fund operates in one business segment related to the manufacturing and distributing of grain handling, storage and conditioning equipment. Geographic information about the Fund's revenues is based on the product shipment destination. Assets are based on their physical location as at the period end: Revenue Property, plant and Three-month Nine-month equipment, goodwill and period ended period ended intangible assets as at
September 30,
2008 $
September 30,
2007 $
September 30,
2008 $
September 30,
2007 $
September 30,
2008 $
December 31, 2007
$ Canada 16,925,783 8,485,870 39,071,932 23,914,626 109,279,011 109,801,110 United States 39,513,340 30,330,296 100,441,292 75,575,783 45,240,981 38,129,121 International 3,572,607 1,946,301 11,586,420 4,317,412 — — 60,011,730 40,762,467 151,099,644 103,807,821 154,519,992 147,930,231
48

Ag Growth Income Fund
NOTES TO UNAUDITED INTERIM CONSOLIDATED FINANCIAL STATEMENTS
September 30, 2008
12. NET CHANGE IN NON-CASH WORKING CAPITAL BALANCES RELATED TO OPERATIONS Three-month period ended Nine-month period ended
September September September September 30, 30, 30, 30, 2008 2007 2008 2007
$ $ $ $ Accounts receivable (1,549,001) 1,135,977 (22,427,531) (7,563,950) Inventory (2,941,341) 2,335,683 (10,573,498) 706,902 Prepaid expenses and other
assets
(401,826)
64,607
(860,825)
(243,143) Accounts payable and accrued
liabilities
787,100
344,996
4,103,402
506,098 Customer deposits (2,146,079) 280,077 (8,711,570) (4,223,414) Income taxes payable 758,402 265,147 1,185,925 (182,333) (5,492,745) 4,426,487 (37,284,097) (10,999,840) 13. LONG-TERM INCENTIVE PLAN Effective January 1, 2007, the Fund adopted an amended long-term incentive plan ["LTIP"]. Pursuant to the LTIP, the Fund establishes the amount to be allocated to eligible participants based upon the amount by which the Fund's distributable cash, as defined in the LTIP, exceeds a predetermined threshold. Subsequent to approval of the LTIP by the Fund's Board of Trustees, the administrator of the LTIP is required to use the allocated amount to purchase units of the Fund in the market. The amount owing to participants is recorded as a long-term incentive plan liability with the offset recorded to net earnings. At such time that the units are purchased the liability is reclassified to contributed surplus under unitholders' equity. Accordingly, in April 2008, the administrator purchased 70,400 units for $2.2 million to satisfy its obligation related to fiscal 2007. These units are reflected in the unitholders' equity balance as at September 30, 2008. During the three-month period ended September 30, 2008, $1.4 million was reclassified from the long-term incentive plan liability to contributed surplus, of which $1.2 million was presented as a liability at June 30, 2008 and has been subsequently reclassified. The units awarded vest over a three-year period commencing one year after the fiscal year of the award.
49

Ag Growth Income Fund
NOTES TO UNAUDITED INTERIM CONSOLIDATED FINANCIAL STATEMENTS
September 30, 2008
As at September 30, 2008, no LTIP units have yet vested. Cash distributions paid on units held by the administrator are retained and are payable to participants in the plan on the vesting date. The expense related to the LTIP will be recorded in relation to the vesting period and accordingly the total award related to the current fiscal year will be expensed as to 36% in the current fiscal year and 36%, 20% and 8% in the three fiscal years, respectively, subsequent to the current year. For the three-month and nine-month periods ended September 30, 2008, the Fund has recorded an expense with respect to the LTIP of $150,000 and $700,000, respectively [2007 - $157,152 and $471,456, respectively]. As the Fund is the primary beneficiary, the Fund consolidates the LTIP in its financial statements. 14. UNIT AWARD INCENTIVE PLAN On May 10, 2007, the unitholders of Ag Growth approved the adoption by the Fund of the Unit Award Incentive Plan [the "UAIP"] which will authorize the Trustees to grant awards ["Unit Awards"] to employees or officers of the Fund or any affiliates of the Fund or who are consultants or other service providers to the Fund and its affiliates ["Service Providers"]. Unit Awards may not be granted to non-management Trustees. Under the terms of the UAIP, any Service Provider may be granted Unit Awards. Each Unit Award will entitle the holder to be issued the number of Fund Units designated in the Unit Award, upon payment of an exercise price of $0.10 per Fund Unit and such Fund Units will vest and may be issued as to one-third on each of January 1, 2010, January 1, 2011 and January 1, 2012 or such earlier or later dates as may be determined by the Trustees. In lieu of receiving units, the holder, with the consent of the Fund, may elect to be paid cash for market value of the units in excess of exercise price of the units. The UAIP provides for immediate vesting of the Unit Awards in the event of retirement, death, termination without cause, or in the event the Service Provider becomes disabled. On May 10, 2007, the Fund reserved for issuance 220,000 Fund Units, subject to adjustment in lieu of distributions, if applicable. The aggregate number of Unit Awards granted to any single Service Provider shall not exceed 5% of the issued and outstanding Fund Units. In addition: [a] the number of Fund Units issuable to insiders at any time, under all security based
compensation arrangements of the Fund, shall not exceed 10% of the issued and outstanding Fund Units; and
[b] the number of Fund Units issued to insiders, within any one-year period, under all security
based compensation arrangements of the Fund, shall not exceed 10% of the issued and outstanding Fund Units.
50

Ag Growth Income Fund
NOTES TO UNAUDITED INTERIM CONSOLIDATED FINANCIAL STATEMENTS
September 30, 2008
220,000 Unit Awards have been granted and remain outstanding as at September 30, 2008. For the three-month and nine-month periods ended September 30, 2008, the Fund recorded an expense (recovery) of $(219,828) and $637,042, respectively [2007 - $396,896 and $686,312, respectively], for the Unit Awards. For the period ended September 30, 2008, the 220,000 Unit Awards granted were excluded from the calculation of diluted net earnings per unit because their effect is anti-dilutive. 15. TRUSTEES' DEFERRED COMPENSATION PLAN On May 8, 2008, the unitholders of the Fund approved the adoption by the Fund of the Trustees' Deferred Compensation Plan [the "Plan"], which provides that a minimum of 20% of the remuneration of non-management Trustees be payable in Fund Units of the Fund. The principal purpose of the Plan is to encourage non-management Trustee ownership of Fund Units. A Trustee will not be entitled to be issued any of the Fund Units that he or she has been granted until a period of three years has passed since the date of grant of such Fund Units or until the Trustee ceases to be a Trustee of the Fund, whichever is earlier. The price to be used for determining the number of Fund Units to be granted pursuant to the Plan will be the weighted average trading price of Fund Units on the Toronto Stock Exchange for the 10 trading days preceding the last day of the Fund's financial quarter in respect of which the deferred Fund Unit grants are made. The total number of Fund Units issuable pursuant to the Plan shall not exceed 35,000, subject to adjustment in lieu of distributions, if applicable. As at September 30, 2008, no Fund Units had been granted under the Plan. 16. DISTRIBUTIONS TO UNITHOLDERS The Declaration of Trust provides that the Fund will, subject to applicable law, distribute to Trust Unitholders by way of monthly distributions all of its distributable cash, being all cash received from its indirect ownership in Ag Growth Industries Limited Partnership ["AGLP"], which will carry on the business of Ag Growth, less amounts set aside for: [a] administrative expenses and other obligations of the Fund; [b] amounts that may be paid by the Fund in connection with any cash redemptions or
repurchases of Trust Units; [c] satisfaction of its debt service obligations [principal and interest] on indebtedness, if any; and [d] any amount that the Trustees may reasonably consider to be necessary to provide for the
payment of any costs or expenses and for reasonable reserves. The Fund's distribution policy is to pay cash distributions on or about the 30th of each month to unitholders of record on the last business day of the preceding month.
51

Ag Growth Income Fund
NOTES TO UNAUDITED INTERIM CONSOLIDATED FINANCIAL STATEMENTS
September 30, 2008
The Fund may make additional distributions in excess of monthly distributions. The distribution in respect of the month ended December 31 of each year will include such amounts as are necessary to ensure that the Fund will not be liable for income taxes under Part I of the Tax Act. Any income of the Fund that is unavailable for cash distribution will, to the extent necessary to ensure that the Fund does not have any such income tax liability, be distributed to Trust Unitholders in the form of additional Trust Units, subject to applicable securities laws. The distribution policy may be amended only with the approval of a majority of the votes cast at a meeting of Unitholders. For the three-month and nine-month periods ended September 30, 2008, the Fund made distributions of $6,218,400 and $17,100,600, respectively [2007 - $4,714,500 and $14,143,500, respectively] which equated to $0.48 per unit and $1.32 per unit, respectively [2007 - $0.42 and $1.26, respectively]. Distributions for the three-month and nine-month periods ended September 30, 2008, include amounts paid or payable to the LTIP administrator [note 13] of $31,680 and $51,328, respectively [2007 - nil]. 17. LONG-TERM DEBT September 30, December 31, 2008 2007 $ $ Term loans of U.S. $37,630,000 [2007 - U.S. $26,500,000]
and $3,020,000, interest payable monthly at prime to prime plus 1% per annum based on performance calculations. The Fund entered into interest rate swap contracts to fix the Fund's interest rate at 2.88% on U.S. $26,500,000 plus 1.0%, 1.5% or 2.0% per annum based on performance calculations. The effective interest rate on the U.S. term loan during the nine-month period ended September 30, 2008 would have been 6.9% and after consideration of the effect of the interest rate swap was 6.1%. The effective interest rate on the Canadian dollar term loan for the nine-month period ended September 30, 2008 was 4.90%
42,904,037
26,184,650 GMAC loans, 0% maturing in 2011 and 2014, with monthly
payments of $1,384. Vehicles financed are pledged as collateral
65,599
32,934 42,969,636 26,217,584 Less current portion 16,608 11,978 Less deferred financing costs 346,165 582,826 42,606,863 25,622,780
52

Ag Growth Income Fund
NOTES TO UNAUDITED INTERIM CONSOLIDATED FINANCIAL STATEMENTS
September 30, 2008
53
The Fund's credit facility provides for long-term debt of up to U.S. $66,500,000. Collateral for the term loans and operating facility [note 7] includes a general security agreement over all assets, first position collateral mortgages on land and buildings, assignments of rents and leases and security agreements for patents and trademarks. The term loans mature August 31, 2009 and are extendible annually for an additional one-year term at the lender's option. Under the terms of the credit facility agreement, if the bank elects to not extend the operating loan and term loan facilities beyond the current August 31, 2009 maturity date, all amounts outstanding under the facilities become repayable in four equal quarterly instalments of principal, commencing on November 30, 2010. Principal repayments due within the next four fiscal years and thereafter, if the term loans are not renewed and are repayable commencing November 30, 2010, are as follows: $ 2008 4,151 2009 16,604 2010 10,742,613 2011 and thereafter 32,206,268 42,969,636 18. SUBSEQUENT EVENT On October 20, 2008, the Fund announced regulatory approval of a share repurchase program, through the facilities of the Toronto Stock Exchange, for cancellation of up to 1,262,090 units of the Fund, representing approximately 10% of the Fund's public float, by way of a normal course issuer bid. Purchases of Fund Units will be made from time to time at market prices and in accordance with the rules of the Toronto Stock Exchange. The repurchase program commenced on October 22, 2008 and will be in effect until October 21, 2009 unless terminated earlier by the Fund. 19. COMPARATIVE FIGURES Certain comparative figures have been reclassified to conform to the current period's presentation.
