to our shareholderss1.q4cdn.com/392447382/files/doc_financials/annual reports/2014... · exciting...
TRANSCRIPT


It is an honor to write my first shareholder letter as SeaWorld Entertainment’s new President and Chief
Executive O�cer.
I have worked in the theme park business for nearly 20 years, so I know how great this Company is, and
it is a privilege to lead this team. We operate some of the industry’s best theme parks. Our operations,
animal care and guest service are world-class. And, just as they have for more than 50 years, millions of
guests continue to visit our parks every year, not only to have fun, but to learn about and connect with
our animals and the natural world we share.
My job now is to build on that foundation while consistently improving and innovating in a competitive
environment. I look forward to leading our outstanding team as we build on our strategy and position
the Company for the future.
Clearly, 2014 did not meet our expectations and was not without its challenges. Despite these head-
winds, I know that our entire team continues to focus on creating personal, educational and memorable
experiences that appeal to our guests.
In 2014, we paid more than $72 million in dividends and repurchased $66 million of our own stock. In
fact, since the initial public o�ering two years ago, SeaWorld Entertainment, Inc. has delivered more than
$200 million in value to our shareholders through dividends and share repurchases. Furthermore, under
our current Board authorization, we have $235 million available for future share repurchases.
In the fourth quarter, we saw early signs of progress with a sequential improvement in attendance trends
from the previous quarter. As we move into 2015, we have launched our new national marketing and
reputation campaigns. We remain vigilant in our support of the SeaWorld brands, communicating the
facts, which are on our side. At our parks, we will continue to introduce innovative new attractions and
exciting new events – experiences I believe our guests will love.
With the early signs of improvement in business trends, our new marketing and reputation initiatives and
great new guest experiences and attractions, we feel a sense of momentum. We look forward to building
on it as 2015 progresses.
Sincerely,
Joel Manby,
President and Chief Executive O�cer
To Our Shareholders
®
It is an honor to write my first shareholder letter as SeaWorld Entertainment’s new President and Chief
Executive O�cer.
I have worked in the theme park business for nearly 20 years, so I know how great this Company is, and
it is a privilege to lead this team. We operate some of the industry’s best theme parks. Our operations,
animal care and guest service are world-class. And, just as they have for more than 50 years, millions of
guests continue to visit our parks every year, not only to have fun, but to learn about and connect with
our animals and the natural world we share.
My job now is to build on that foundation while consistently improving and innovating in a competitive
environment. I look forward to leading our outstanding team as we build on our strategy and position
the Company for the future.
Clearly, 2014 did not meet our expectations and was not without its challenges. Despite these head
winds, I know that our entire team continues to focus on creating personal, educational and memorable
experiences that appeal to our guests.
In 2014, we paid more than $72 million in dividends and repurchased $66 million of our own stock. In
fact, since the initial public o�ering two years ago, SeaWorld Entertainment, Inc. has delivered more than
$200 million in value to our shareholders through dividends and share repurchases. Furthermore, under
our current Board authorization, we have $235 million available for future share repurchases.
In the fourth quarter, we saw early signs of progress with a sequential improvement in attendance trends
from the previous quarter. As we move into 2015, we have launched our new national marketing and
reputation campaigns. We remain vigilant in our support of the SeaWorld brands, communicating the
facts, which are on our side. At our parks, we will continue to introduce innovative new attractions and
exciting new events – experiences I believe our guests will love.
With the early signs of improvement in business trends, our new marketing and reputation initiatives and
great new guest experiences and attractions, we feel a sense of momentum. We look forward to building
on it as 2015 progresses.
Sincerely,
Joel Manby,
President and Chief Executive O�cer
To Our Shareholders

Over our more than 50-year history, we have built a diversified portfolio of 11 destination
and regional theme parks that are grouped in key markets across the United States, many
of which showcase our one-of-a-kind zoological collection of approximately 89,000
marine and terrestrial animals. Our theme parks feature a diverse array of rides, shows
and other attractions with broad demographic appeal, which deliver memorable
experiences and a strong value proposition for our guests.
Caring for our community and the natural world we share is a core part of our
corporate identity and resonates with our guests. As one of the world’s foremost
zoological organizations and a global leader in animal welfare, training, husbandry
and veterinary care, we are committed to helping protect and preserve the
environment. In collaboration with the government and other members of accredited
stranding networks, we operate one of the world’s most respected programs to rescue
ill and injured marine animals, with the goal to rehabilitate and return them back to the
wild. Through 2014, our animal experts have helped more than 24,000 ill, injured,
orphaned and abandoned animals.
Our parks...
Our commitment...

®

UNITED STATESSECURITIES AND EXCHANGE COMMISSION
Washington, D.C. 20549
FORM 10-KÈ ANNUAL REPORT PURSUANT TO SECTION 13 OR 15(d) OF THE
SECURITIES EXCHANGE ACT OF 1934For the fiscal year ended December 31, 2014
or
‘ TRANSITION REPORT PURSUANT TO SECTION 13 OR 15(d) OF THESECURITIES EXCHANGE ACT OF 1934
For the transition period from toCommission File Number: 001-35883
SeaWorld Entertainment, Inc.(Exact name of registrant as specified in its charter)
Delaware 27-1220297(State or other jurisdiction of
incorporation or organization)(I.R.S. Employer
Identification No.)
9205 South Park Center Loop, Suite 400Orlando, Florida 32819
(Address of principal executive offices)(Zip Code)
(407) 226-5011(Registrant’s telephone number, including area code)
Securities registered pursuant to Section 12(b) of the Act:Title of each class Name of each exchange on which registered
Common Stock, par value $0.01 per share New York Stock ExchangeSecurities registered pursuant to Section 12(g) of the Act: None
Indicate by check mark if the registrant is a well-known seasoned issuer, as defined in Rule 405 of the Securities Act. Yes È No ‘
Indicate by check mark if the registrant is not required to file reports pursuant to Section 13 or Section 15(d) of the Act. Yes ‘ No È
Indicate by check mark whether the registrant (1) has filed all reports required to be filed by Section 13 or 15(d) of the Securities ExchangeAct of 1934 during the preceding 12 months (or for such shorter period that the registrant was required to file such reports), and (2) has beensubject to such filing requirements for the past 90 days. Yes È No ‘
Indicate by check mark whether the registrant has submitted electronically and posted on its corporate Web site, if any, every Interactive DataFile required to be submitted and posted pursuant to Rule 405 of Regulation S-T (§ 232.405 of this chapter) during the preceding 12 months(or for such shorter period that the registrant was required to submit and post such files). Yes È No ‘
Indicate by check mark if disclosure of delinquent filers pursuant to Item 405 of Regulation S-K (§ 229.405 of this chapter) is not containedherein, and will not be contained, to the best of registrant’s knowledge, in definitive proxy or information statements incorporated byreference in Part III of this Form 10-K or any amendment to this Form 10-K. È
Indicate by check mark whether the registrant is a large accelerated filer, an accelerated filer, a non-accelerated filer, or a smaller reportingcompany. See the definitions of “large accelerated filer,” “accelerated filer” and “smaller reporting company” in Rule 12b-2 of the ExchangeAct.
Large accelerated filer È Accelerated filer ‘
Non-accelerated filer ‘ (Do not check if a smaller reporting company) Smaller reporting company ‘
Indicate by check mark whether the registrant is a shell company (as defined in Rule 12b-2 of the Act). Yes ‘ No È
The aggregate market value of the voting and non-voting common equity held by non-affiliates of the registrant as of June 30, 2014, the lastbusiness day of the registrant’s most recently completed second fiscal quarter, was $1,914,102,285 based upon the closing price of theregistrant’s common stock, par value $0.01 per share, reported for such date on the New York Stock Exchange. For purposes of thiscomputation, shares of the registrant’s common stock held by each executive officer and director and each person known to the registrant toown 10% or more of the outstanding voting power of the registrant have been excluded in that such persons are affiliates. This determinationof affiliate status is not a determination for other purposes.
The registrant had outstanding 89,230,648 shares of Common Stock, par value $0.01 per share as of February 23, 2015.
DOCUMENTS INCORPORATED BY REFERENCE
Portions of the registrant’s definitive proxy statement to be filed with the Securities and Exchange Commission relating to the 2015 AnnualMeeting of Stockholders, which statement will be filed pursuant to Regulation 14A not later than 120 days after the end of the fiscal yearcovered by this Annual Report on Form 10-K, are incorporated by reference into Part III of this report.

[THIS PAGE INTENTIONALLY LEFT BLANK]
SEAWORLD ENTERTAINMENT, INC. AND SUBSIDIARIESANNUAL REPORT ON FORM 10-K
FOR THE YEAR ENDED DECEMBER 31, 2014
TABLE OF CONTENTS
PageNo.
SPECIAL NOTE REGARDING FORWARD-LOOKING STATEMENTS 1
PART I.Item 1. Business 3
Item 1A. Risk Factors 21
Item 1B. Unresolved Staff Comments 35
Item 2. Properties 36
Item 3. Legal Proceedings 36
Item 4. Mine Safety Disclosures 37
PART II.Item 5. Market for Registrant’s Common Equity, Related Stockholder Matters and Issuer Purchases of
Equity Securities 38
Item 6. Selected Financial Data 41
Item 7. Management’s Discussion and Analysis of Financial Condition and Results of Operations 43
Item 7A. Quantitative and Qualitative Disclosures About Market Risk 63
Item 8. Financial Statements and Supplementary Data 64
Item 9. Changes in and Disagreements With Accountants on Accounting and Financial Disclosure 64
Item 9A. Controls and Procedures 64
Item 9B. Other Information 65
PART III.Item 10. Directors, Executive Officers and Corporate Governance 67
Item 11. Executive Compensation 67
Item 12. Security Ownership of Certain Beneficial Owners and Management and Related StockholderMatters 67
Item 13. Certain Relationships and Related Transactions and Director Independence 67
Item 14. Principal Accounting Fees and Services 67
PART IV.Item 15. Exhibits, Financial Statement Schedules 68
Signatures 69

[THIS PAGE INTENTIONALLY LEFT BLANK]

Unless otherwise noted or the context otherwise requires, (i) references to the “Company,” “SeaWorld,”“we,” “our” or “us” in this Annual Report on Form 10-K refer to SeaWorld Entertainment, Inc. and itsconsolidated subsidiaries, (ii) references to “Blackstone” refer to certain investment funds affiliated with TheBlackstone Group L.P., (iii) references to the “Partnerships” refer, collectively, as applicable, to either (a) tenlimited partnerships owned by affiliates of Blackstone and certain co-investors, through SW Delaware L.P. (f/k/aSW Cayman L.P.), SW Delaware A L.P. (f/k/a SW Cayman A L.P.), SW Delaware B L.P. (f/k/a SW Cayman BL.P.), SW Delaware C L.P. (f/k/a SW Cayman C L.P.), SW Delaware D L.P. (f/k/a SW Cayman D L.P.), SWDelaware E L.P. (f/k/a SW Cayman E L.P.), SW Delaware F L.P. (f/k/a SW Cayman F L.P.), SW Delaware Co-Invest L.P. (f/k/a SW Cayman Co-Invest L.P.), SW Delaware (GS) L.P. (f/k/a SW Cayman (GS) L.P.) and SWDelaware (GSO) L.P. (f/k/a SW Cayman (GSO) L.P.) or (b) only nine of the aforementioned ten limitedpartnerships owned by affiliates of Blackstone and other certain co-investors to reflect that, as of August 25,2014, one of such limited partnerships – SW Delaware (GS) L.P. (f/k/a SW Cayman (GS) L.P.) – no longer ownsshares of the Company’s common stock, (iv) references to “ABI” refer to Anheuser-Busch, Incorporated,(v) references to “guests” refer to our theme park visitors, (vi) references to “customers” refer to any consumerof our products and services, including guests of our theme parks, (vii) references to the “TEA/AECOM Report”refer to the 2013 Theme Index: The Global Attractions Attendance Report, TEA/AECOM, 2014, (viii) referencesto the “2014 Amusement Today Annual Survey” or the “Amusement Today 2014 Golden Ticket Awards” refer tothe Amusement Today 2014 Golden Ticket Awards, Vol. 18, issue 6.2 dated September 2014 and (ix) referencesto the “IBISWorld Report” refer to the IBISWorld Industry Report 71311: Amusement Parks in the US datedAugust 2014. Unless otherwise noted, attendance rankings included in this Annual Report on Form 10-K arebased on the TEA/AECOM Report and theme park industry statistics are based on the IBISWorld Report.
SPECIAL NOTE REGARDING FORWARD-LOOKING STATEMENTS
In addition to historical information, this Annual Report on Form 10-K may contain “forward-lookingstatements” within the meaning of Section 27A of the Securities Act of 1933, as amended (the “Securities Act”),and Section 21E of the Securities Exchange Act of 1934, as amended (the “Exchange Act”), which are subject tothe “safe harbor” created by those sections. All statements, other than statements of historical facts, includingstatements concerning our plans, objectives, goals, beliefs, business strategies, future events, business conditions,our results of operations, financial position and our business outlook, business trends and other information, maybe forward-looking statements. Words such as “might,” “will,” “may,” “should,” “estimates,” “expects,”“continues,” “contemplates,” “anticipates,” “projects,” “plans,” “potential,” “predicts,” “intends,” “believes,”“forecasts,” “future” and variations of such words or similar expressions are intended to identify forward-lookingstatements. The forward-looking statements are not historical facts, and are based upon our current expectations,beliefs, estimates and projections, and various assumptions, many of which, by their nature, are inherentlyuncertain and beyond our control. Our expectations, beliefs, estimates and projections are expressed in good faithand we believe there is a reasonable basis for them. However, there can be no assurance that management’sexpectations, beliefs, estimates and projections will result or be achieved and actual results may vary materiallyfrom what is expressed in or indicated by the forward-looking statements.
There are a number of risks, uncertainties and other important factors, many of which are beyond ourcontrol, that could cause our actual results to differ materially from the forward-looking statements contained inthis Annual Report on Form 10-K. Such risks, uncertainties and other important factors that could cause actualresults to differ include, among others, the risks, uncertainties and factors set forth under “Risk Factors” in Part I,Item 1A of this Annual Report on Form 10-K, including the following:
• a decline in discretionary consumer spending or consumer confidence;
• various factors beyond our control adversely affecting attendance and guest spending at our themeparks;
• changes in federal and state regulations governing the treatment of animals and claims and lawsuits byactivist groups;
1

• incidents or adverse publicity concerning our theme parks;
• inability to protect our intellectual property or the infringement on intellectual property rights of others;
• featuring animals at our theme parks;
• the loss of licenses and permits required to exhibit animals;
• significant portion of revenues generated in the States of Florida, California and Virginia and theOrlando market;
• inability to compete effectively;
• loss of key personnel;
• increased labor costs;
• unionization activities or labor disputes;
• inability to meet workforce needs;
• inability to fund theme park capital expenditures;
• high fixed cost structure of theme park operations;
• inability to maintain certain commercial licenses;
• changing consumer tastes and preferences;
• restrictions in our debt agreements limiting flexibility in operating our business;
• our substantial leverage;
• seasonal fluctuations;
• inability to realize the benefits of acquisitions or other strategic initiatives;
• adverse litigation judgments or settlements;
• inadequate insurance coverage;
• inability to purchase or contract with third party manufacturers for rides and attractions;
• environmental regulations, expenditures and liabilities;
• cyber security risks;
• suspension or termination of any of our business licenses;
• our limited operating history as a stand-alone company; and
• the ability of affiliates of The Blackstone Group L.P to significantly influence our decisions.
We caution you that the risks, uncertainties and other factors referenced above may not contain all of therisks, uncertainties and other factors that are important to you. In addition, we cannot assure you that we willrealize the results, benefits or developments that we expect or anticipate or, even if substantially realized, thatthey will result in the consequences or affect us or our business in the way expected. There can be no assurancethat (i) we have correctly measured or identified all of the factors affecting our business or the extent of thesefactors’ likely impact, (ii) the available information with respect to these factors on which such analysis is basedis complete or accurate, (iii) such analysis is correct or (iv) our strategy, which is based in part on this analysis,will be successful. All forward-looking statements in this Annual Report on Form 10-K apply only as of the dateof this Annual Report on Form 10-K or as the date they were made and, except as required by applicable law, weundertake no obligation to publicly update any forward-looking statement, whether as a result of newinformation, future developments or otherwise.
2

Trademarks, Service Marks and Trade names
We own or have rights to use a number of registered and common law trademarks, service marks and tradenames in connection with our business in the United States and in certain foreign jurisdictions, includingSeaWorld Entertainment, SeaWorld Parks & Entertainment, SeaWorld®, Shamu®, Busch Gardens®, Aquatica™,Discovery Cove®, Sea Rescue™ and other names and marks that identify our theme parks, characters, rides,attractions and other businesses. In addition, we have certain rights to use Sesame Street® marks, characters andrelated indicia through certain license agreements with Sesame Workshop (f/k/a Children’s TelevisionWorkshop).
Solely for convenience, the trademarks, service marks, and trade names referred to in this Annual Report onForm 10-K are without the ® and ™ symbols, but such references are not intended to indicate, in any way, thatwe will not assert, to the fullest extent under applicable law, our rights or the rights of the applicable licensors tothese trademarks, service marks, and trade names. This Annual Report on Form 10-K may contain additionaltrademarks, service marks and trade names of others, which are the property of their respective owners. Alltrademarks, service marks and trade names appearing in this Annual Report on Form 10-K are, to our knowledge,the property of their respective owners.
PART I.
Item 1. Business
Company Overview
We are a leading theme park and entertainment company delivering personal, interactive and educationalexperiences that blend imagination with nature and enable our customers to celebrate, connect with and care forthe natural world we share. We own or license a portfolio of globally recognized brands including SeaWorld,Shamu and Busch Gardens. Over our more than 50 year history, we have built a diversified portfolio of 11destination and regional theme parks that are grouped in key markets across the United States, many of whichshowcase our one-of-a-kind zoological collection of approximately 89,000 marine and terrestrial animals. Ourtheme parks feature a diverse array of rides, shows and other attractions with broad demographic appeal whichdeliver memorable experiences and a strong value proposition for our guests.
During the year ended December 31, 2014, we hosted approximately 22.4 million guests in our theme parks,including approximately 3.6 million international guests. In the year ended December 31, 2014, we had totalrevenues of $1.38 billion and net income of $49.9 million.
We generate revenue primarily from selling admission to our theme parks and from purchases of food,merchandise and other spending. For the year ended December 31, 2014, theme park admissions accounted forapproximately 62% of our total revenue, and food, merchandise and other revenue accounted for approximately38% of our total revenue. Over the same period of time, we reported $38.37 in admission per capita (calculatedas admissions revenue divided by total attendance) and $23.14 in-park per capita spending (calculated as food,merchandise and other revenue divided by total attendance).
As one of the world’s foremost zoological organizations and a global leader in animal welfare, training,husbandry and veterinary care, we are committed to helping protect and preserve the environment and the naturalworld. For more information, see the “—Our Animals” and “—Philanthropy and Community Relations”sections.
Recent Developments
Management Changes
Effective January 15, 2015, James Atchison resigned from his role as Chief Executive Officer (“CEO”) andPresident of the Company. Mr. Atchison will continue to serve as a member of the Board of Directors of the
3

Company (the “Board”) in the role of Vice Chairman of the Board and has entered into a three-year consultingagreement with the Company. In connection with the foregoing, effective January 15, 2015, the Board appointedDavid F. D’Alessandro as the Company’s interim CEO until the Board selects a permanent successor.Mr. D’Alessandro, who has been Chairman of the Board since 2010, will continue in that position during histenure as interim CEO.
Effective February 6, 2015, Daniel B. Brown was appointed Chief Parks Operations Officer of theCompany. In this role, Mr. Brown has operational oversight over all of the Company’s theme parks. Donald W.Mills Jr., formerly the Company’s Chief Operating Officer – Busch Gardens & Sesame Place, was reassigned tothe position of Orlando Park President responsible for leading the Company’s Orlando theme parks – SeaWorld,Discovery Cove and Aquatica.
Share Repurchase Program and Share Repurchases
On August 12, 2014, our Board authorized the repurchase of up to $250.0 million of our common stockbeginning on January 1, 2015 (the “Share Repurchase Program”). On December 16, 2014, the Board approved anamendment to the Share Repurchase Program to change the start date of such program from January 1, 2015 toDecember 17, 2014 and to authorize the repurchase of up to $15.0 million of our common stock during theremainder of calendar year 2014. The other features of the Share Repurchase Program remained unchangedincluding the total amount authorized and available under the program of $250.0 million. Under the ShareRepurchase Program, we are authorized to repurchase shares through open market purchases, privately-negotiated transactions or otherwise in accordance with applicable federal securities laws, including through Rule10b5-1 trading plans and under Rule 10b-18 of the Exchange Act. The Share Repurchase Program has no timelimit and may be suspended or discontinued completely at any time. The number of shares to be purchased andthe timing of purchases will be based on the level of our cash balances, general business and market conditions,and other factors, including legal requirements, debt covenant restrictions and alternative investmentopportunities.
Pursuant to the Share Repurchase Program, during the fourth quarter of 2014, we entered into a writtentrading plan under Rule 10b5-1 of the Exchange Act and repurchased a total of 855,970 shares of common stockat an average price of $17.50 per share and a total cost of approximately $15.0 million, leaving $235.0 millionavailable for future repurchases under the Share Repurchase Program. All of the repurchased common stock washeld as treasury shares at December 31, 2014.
Restructuring Program
In December 2014, we implemented a restructuring program in an effort to centralize certain operations andreduce duplication of functions to increase efficiencies (the “Restructuring Program”). The RestructuringProgram is part of our previously announced Company-wide initiative designed to deliver approximately$50.0 million of annual cost savings by the end of 2015, as compared to our cost structure in fiscal 2014. Webelieve that these cost savings will be largely offset by annual inflationary pressures and increased spending onmarketing and advertising initiatives. The Restructuring Program involved the elimination of approximately300 positions across our eleven theme parks and corporate headquarters. As a result, we expect to recordapproximately $12.4 million in pre-tax restructuring charges, of which $11.6 million was incurred in 2014 andanother $0.8 million is expected to be incurred in the first half of 2015, due to certain continuing serviceobligations.
Costs incurred in 2014 related to the Restructuring Program are recorded as restructuring and other relatedcosts and primarily consist of severance and other employment expenses as well as third party consulting costsassociated with the development of the cost savings plan and the Restructuring Program. These restructuring andother related costs do not include any costs associated to the previously announced separation of our CEO andPresident effective January 15, 2015, which approximated $2.6 million in the fourth quarter of 2014.
4

Our Competitive Strengths
• Brands That Consumers Know and Love. We believe that our brands attract and appeal to guestsfrom around the world and have been established as a part of popular culture. Our brand portfolio isstable, which we believe reduces our exposure to changing consumer tastes. We use our brands andintellectual property to increase awareness of our theme parks, drive attendance to our theme parks andcreate “out-of-park” experiences for our guests as a way to connect with them before they visit ourtheme parks and to stay connected with them after their visit. Such experiences include various mediaand consumer product offerings, including websites, advertisements and media programming, toys,books, apparel and technology accessories. For example, we have developed iPhone and Androidsmartphone applications for our SeaWorld, Busch Gardens and Sesame Place theme parks, which offerGPS navigation through the theme parks and interactive theme park maps that show the nearest dininglocations, gift shops and ATMs and provide real-time updates on wait times for rides. Our guests havequickly adopted these products with over 2.1 million downloads of our smartphone applications fromJune 2011 through December 2014.
We have also leveraged our brands into media, entertainment and consumer products. In 2012, welaunched Sea Rescue, a Saturday morning television show airing on the ABC Network featuring ourwork to rescue injured animals in coordination with various government agencies and other rescueorganizations. Since its debut through December 2014, Sea Rescue has attracted over 195 millionviewers and has been rated as the number one show in its timeslot in a number of major U.S. markets.Additionally, in 2014, Sea Rescue was nominated for a Daytime Emmy® Award in the category ofOutstanding Children’s Series by the National Academy of Television Arts & Sciences. In October2013, we introduced our newest television program, The Wildlife Docs, which has attracted over89 million viewers from October 2013 through December 2014 and centers on the day-to-day activitiesat our Animal Care Center at Busch Gardens Tampa. Additionally, in March 2014, we introduced anew media platform, SeaWorld Kids, which features a website containing nature-based learningcontent for kids. The website includes games and animal information and showcases Sea Rescue, TheWildlife Docs and The Jungle Bunch, as well as our new monthly web series, Generation Nature. Wehave also introduced learning apps for kids and have released original songs and soundtracks from ourtheme parks for sale on iTunes, Google Play and other digital music channels.
• Differentiated Theme Parks. We own and operate 11 theme parks, including four of the top 20 themeparks in North America as measured by attendance, according to the TEA/AECOM Report. Our themeparks are beautifully themed and deliver high-quality entertainment, aesthetic appeal, shopping anddining and have won numerous awards, including the Amusement Today Golden Ticket Award for BestLandscaping. Our theme parks feature eight of the 50 highest rated steel rollercoasters in the world, ledby Apollo’s Chariot, the #7 rated steel rollercoaster in the world according to the 2014 AmusementToday Annual Survey, and have won the top three spots in the Amusement Today annual Golden TicketAward for Best Marine Life Park since the award’s inception in 2006. We have over 600 attractionsthat appeal to guests of all ages, including 99 animal habitats, 116 shows and 193 rides. In addition, wehave over 300 restaurants and specialty shops. Our theme parks appeal to the entire family and offer abroad range of experiences, ranging from emotional and educational animal encounters to thrillingrides and exciting shows. As a result of these distinctive offerings, our guest surveys routinely reportvery high “Overall Satisfaction” scores, with 97% of respondents in 2014 ranking their experiencegood or excellent.
• Diversified Business Portfolio. Our portfolio of theme parks is diversified in a number of importantrespects. Our theme parks are located across the United States, which helps protect us from the impactof localized events. Each theme park showcases a different mix of zoological, thrill-oriented andfamily-friendly attractions. This varied portfolio of entertainment offerings attracts guests from a broadrange of demographics and geographies. Our theme parks appeal to both regional and destinationguests, which provide us with a stable attendance base while allowing us to benefit from improvementsin macroeconomic conditions, including increased consumer spending and international travel.
5

• One of the World’s Largest Zoological Collections. We believe we are attractively positioned in theindustry due to our ability to present our animals in a differentiated and interactive manner. We believewe have one of the world’s largest zoological collections with approximately 89,000 animals, including8,000 marine and terrestrial animals and 81,000 fish. With 30 killer whales, we have the largest groupof killer whales in human care. We have established successful and innovative breeding programs thathave produced 32 killer whales, 165 dolphins and 148 sea lions, among other species, and our marineanimal populations are characterized by their substantial genetic diversity. More than 80% of ourmarine mammals were born in human care.
• Strong Competitive Position. Our competitive position is protected by the combination of ourpowerful brands, extensive zoological collection and expertise and attractive in-park assets located onvaluable real estate. Our zoological collection and expertise, which have evolved over our more thanfive decades of caring for animals, would be very difficult to replicate. We have made extensiveinvestments in new marketable attractions and infrastructure and we believe that our theme parks arewell capitalized. The limited supply of real estate suitable for theme park development coupled withhigh initial capital investment, long development lead-times and zoning and other land use restrictionsconstrain the number of large theme parks that can be constructed.
• Proven and Experienced Management Team and Employees with Specialized Animal Expertise.Our senior management team includes some of the most experienced theme park executives in theworld, with an average tenure of approximately 30 years in the industry (calculation excludes averagetenure for our interim CEO). The management team is comprised of highly skilled and dedicatedprofessionals with wide ranging experience in theme park operations, zoological operations, productdevelopment, business development, marketing and finance. In addition, we are one of the world’sforemost zoological organizations with an average of more than 1,500 employees dedicated to animalwelfare, training, husbandry and veterinary care.
• Proximity of Complementary Theme Parks. Our theme parks are grouped in key locations near largepopulation centers across the United States, which allows us to realize revenue and operating expenseefficiencies. Having theme parks located within close proximity to each other also enables us to crossmarket and offer bundled ticket and travel packages. In addition, closely located theme parks provideoperating efficiencies including sales, marketing, procurement and administrative synergies asoverhead expenses are shared among the theme parks within each region.
• Strong Cash Flow Generation. Our disciplined approach to capital expenditures and working capitalmanagement, enable us to generate strong and recurring cash flow. Five of our 11 theme parks are openyear-round, reducing our seasonal cash flow volatility. In addition, we have substantial tax assets,which we expect to be available to defer a portion of our cash tax burden going forward.
• Care for Our Community and the Natural World. Caring for our community and the natural worldis a core part of our corporate identity and resonates with our guests. We focus on three corephilanthropic areas: children, education and environment. Through the power of entertainment, we areable to inspire children and educate guests of all ages. We support numerous charities andorganizations across the country. For example, we are the primary supporter and corporate member ofthe SeaWorld & Busch Gardens Conservation Fund, a non-profit conservation foundation, whichmakes grants to wildlife research and conservation projects that protect wildlife and wild placesworldwide. In addition, in collaboration with the government and other members of accreditedstranding networks, we operate one of the world’s most respected programs to rescue ill and injuredmarine animals, with the goal to rehabilitate and return them back to the wild. Our animal experts havehelped more than 24,000 ill, injured, orphaned and abandoned animals for more than four decades. In2014, the SeaWorld Animal Rescue Teams based in San Diego, Orlando and San Antonio werepresented the Amusement Today 2014 Persons of the Year Award for their tireless dedication to animalwelfare.
6

Our Theme Parks
Our legacy started in 1959 with the opening of our first Busch Gardens theme park in Tampa, Florida. Sincethen, we have built our portfolio of strong brands and have strategically expanded our portfolio of theme parksacross five states and approximately 2,000 acres of owned land, including through acquisitions.
Our theme parks offer guests a variety of exhilarating experiences, from animal encounters that inviteexploration and appreciation of the natural world, to thrilling rides and spectacular shows. Our theme parks arebeautifully themed venues that are consistently recognized among the top theme parks in the world and rankamong the most highly attended in the industry. In 2013, SeaWorld Orlando and SeaWorld San Diego eachranked among the top 25 theme parks worldwide based on attendance, and Aquatica Orlando ranked among thetop 20 water parks worldwide based on attendance, according to the TEA/AECOM Report. Additionally,Discovery Cove was ranked the #1 amusement park in the world for the second consecutive year in the 2014TripAdvisor Travelers’ ChoiceTM Awards. We generally locate our theme parks in geographical clusters, whichimprove our ability to serve guests by providing them with a varied, comprehensive vacation experience andvaluable multi-park pricing packages, as well as improving our operating efficiency through shared overheadcosts. Our portfolio of branded theme parks includes the following names:
• SeaWorld. SeaWorld is widely recognized as the leading marine-life theme park brand in the world. OurSeaWorld theme parks rank among the most highly attended theme parks in the industry and offer up-closeinteractive experiences, special dining experiences, thrilling attractions and a variety of live performances thatimmerse guests in the marine-life theme. We also offer our guests numerous animal encounters, including theopportunity to work with trainers and feed marine animals, as well as themed thrill rides and theatrical showsthat creatively incorporate our one-of-kind zoological collection. Collectively, our SeaWorld theme parks havewon the top three spots in the Amusement Today annual Golden Ticket Award for Best Marine Life Park sincethe award’s inception in 2006. We currently own and operate the following SeaWorld branded theme parks:
O SeaWorld Orlando is a 279 acre theme park in Orlando, Florida and is open year-round. It is ourlargest theme park as measured by attendance and revenue. SeaWorld Orlando is home to theJourney to Atlantis watercoaster ride, Kraken, a floorless rollercoaster, and Manta, a flyingrollercoaster which integrates animals and a beautiful aquarium into its theme. In May 2013, weopened Antarctica: Empire of the Penguin, a realm within the park that immerses guests into apenguin habitat. SeaWorld Orlando is also home to TurtleTrek, one of the first attractions withtwo extensive naturalistic habitats, home to manatees and sea turtles, and a 3-D, 360-degree dometheater.
O SeaWorld San Antonio is one of the world’s largest marine-life theme parks, encompassingapproximately 415 acres in San Antonio, Texas. SeaWorld San Antonio features thrillingrollercoasters, including the Steel Eel and The Great White, along with a collection of marine-themed shows and experiences, including the killer whale show One Ocean. Guests can upgradetheir experience for an additional fee to also enjoy our Aquatica water park located withinSeaWorld San Antonio.
O SeaWorld San Diego is the original SeaWorld theme park spanning 190 acres of waterfrontproperty on Mission Bay in San Diego, California. SeaWorld San Diego is open year-round and isone of the most visited paid attractions in San Diego. Its newest attraction is Explorer’s Reef,which opened in March 2014 to coincide with the official kickoff of a “Sea of Surprises”commemorating SeaWorld’s 50th anniversary celebration. Through Explorer’s Reef, guests enterthe park under a massive wave sculpture and encounter an underwater-themed realm of animalattractions, buildings and shade structures. SeaWorld San Diego is also home to Manta, built in2012 and modeled on the successful Manta ride in SeaWorld Orlando, which includes animalhabitats featuring bat rays and other marine-life as well as a launch rollercoaster shaped like agiant manta ray.
7

• Busch Gardens. Our Busch Gardens theme parks are family-oriented destinations designed to immerseguests in foreign geographic settings. They are renowned for their beauty and cleanliness with award-winning landscaping and gardens. Our Busch Gardens theme parks allow our guests to discover thenatural side of fun by offering a family experience featuring a variety of attractions and rollercoasters,exotic animals and high-energy theatrical productions that appeal to all ages. We currently own andoperate the following Busch Gardens theme parks:
O Busch Gardens Tampa features exotic animals, thrill rides and shows on 306 acres of lush naturallandscape. Our zoological collection is a popular attraction for families, and its portfolio of rides,including four of the world’s top 50 steel rollercoasters according to the 2014 Amusement TodayAnnual Survey, broaden the theme park’s appeal to teens and thrill seekers of all ages. Its newestattraction, Falcon’s Fury, which opened in the third quarter of 2014, is the tallest freestandingdrop tower in North America, standing at 335 feet. The attraction rises more than 300 feet in theair then pivots guests 90 degrees to a face-down dive position before dropping to the ground. Alsonew in 2014 is Pantopia, a fully-revitalized realm which is home to Falcon’s Fury and includesnew culinary options, entertainment, shopping and an indoor theater.
O Busch Gardens Williamsburg is regularly recognized as one of the highest quality theme parks inthe world, capturing dozens of awards over its history for attraction and show quality, design,landscaping, culinary operations and theming. This 422 acre theme park has been named the MostBeautiful Park in the World by the National Amusement Park Historical Association for 24consecutive years and has earned the Amusement Today Golden Ticket for Best Landscaping eachyear since the category’s inception in 1998. It features some of the industry’s top thrill rides withthree steel rollercoasters, Apollo’s Chariot, Alpengeist and Griffon, ranked in the top 35 in the2014 Amusement Today Annual Survey. Its newest steel rollercoaster, Verbolten, a multi-launch,indoor/outdoor rollercoaster that ends with an 88-foot drop toward the theme park’s Rhine River,opened in 2012. In 2014, the London Rocks show debuted, which takes guests on a musicaljourney exploring the roots of rock-n-roll and the powerful role that music plays in people’s lives.
• Aquatica. Our Aquatica branded water parks are premium, family-oriented destinations that are based in aSouth Seas-themed tropical setting. Aquatica water parks build on the aquatic theme of our SeaWorld brandand feature high-energy rides, water attractions, white-sand beaches and an innovative and entertainingpresentation of marine and terrestrial animals. We position our Aquatica water parks as companions to ourSeaWorld theme parks and currently own and operate the following Aquatica branded theme parks:
O Aquatica Orlando is an 81 acre South Seas-themed water park adjacent to SeaWorld Orlando thatis open year-round. In 2013, it was the 3rd most attended water park in North America and the 7th
most attended water park worldwide, according to the TEA/AECOM Report. The theme parkfeatures state-of-the-art attractions for guests of all ages and swimming abilities, including somethat pass by or through animal habitats, such as the signature Dolphin Plunge that carries gueststhrough a Commerson’s dolphin habitat. Its newest attraction, Ihu’s Breakaway Falls, a multi-droptower slide, opened in 2014 and provides guests a dramatic vertical plunge followed by a maze ofcurving tubes before final splashdown.
O Aquatica San Antonio is a water park located within SeaWorld San Antonio and accessible toguests for an additional fee. It features a variety of waterslides, rivers, lagoons, a large beach areaand private cabanas. The water park’s signature attraction, Stingray Falls, takes four-seat raftsdown twists and turns to an underwater grotto, where guests view stingrays and tropical fish. Inaddition, Walhalla Wave, a family raft ride, sends guests to the top of a zero-gravity wall, givingriders the sense of weightlessness. Its newest attraction, Roa’s Aviary, which opened in 2014,features a 13,500 square foot aviary giving guests the chance to float, wade or walk amonghundreds of tropical birds. The aviary also contains a guest pool and waterfalls.
O Aquatica San Diego is located near our SeaWorld San Diego theme park and is the latest waterpark added to our portfolio. We acquired the Knott’s Soak City Chula Vista, a 66 acre water park,
8

from a subsidiary of Cedar Fair L.P. in November 2012 and renovated, rebranded and relaunchedthe theme park as Aquatica San Diego in June 2013. In 2014, we opened Taumata Racer, a high-speed racing water ride that sends riders down a 375-foot slide, around a 180-degree swoopingturn, and in and out of tunnels before racing them across the finish line.
• Discovery Cove. Located next to SeaWorld Orlando, Discovery Cove is a 58 acre, reservations only, all-inclusive marine-life theme park that is open year-round to guests and features premium culinary offerings.The theme park restricts its attendance to approximately 1,300 guests per day in order to assure a moreintimate experience. Discovery Cove provides guests with a full day of activities, including a 30-minutedolphin swim session and the opportunity to snorkel with thousands of tropical fish, wade in a lush lagoonwith stingrays, and hand-feed birds in a free flight aviary. Discovery Cove was ranked the #1 amusement parkin the world for the second consecutive year in the 2014 TripAdvisor Travelers’ Choice Awards. DiscoveryCove’s attractions include The Grand Reef, which includes SeaVenture, an underwater walking tour whereguests can get up close to exotic fish and sharks, and Freshwater Oasis, which offers wading adventures andface-to-face encounters with otters and marmosets.
• Sesame Place. Located on 55 acres between Philadelphia and New York City, Sesame Place is the only themepark in America entirely dedicated to the award-winning television show, Sesame Street, and its spirit ofimagination. The theme park shares SeaWorld’s “education and learning through entertainment” philosophyand allows parents and children to experience Sesame Street together through whirling rides, water slides,colorful shows and furry friends. Despite its small size and seasonal operating schedule, Sesame Place attractsapproximately one million guests annually due to its strong family appeal. Sesame Place’s newest realm,Cookie’s Monster Land, opened in 2014 and features five new family-friendly rides, a 3-story net climb, and asoft play area for the park’s youngest visitors. In addition, we have introduced Sesame Street brands in ourother theme parks through Sesame Street-themed rides, shows, children’s play areas and merchandise. Ourrights to the Sesame Street brand in the United States extend through 2021.
• Water Country USA. Located on 222 acres, Virginia’s largest family water park, Water Country USA,features state-of-the-art water rides and attractions, all set to a 1950s and 1960s surf theme. Water CountryUSA is the sixth most attended water park in North America according to the TEA/AECOM Report andfeatures a 23,000 square-foot wave pool, a science fiction themed interactive children’s play area, kid-sizedwater slides, live shows and several other attractions. One of its newest attractions is Colossal Curl, an actionpacked family thrill slide that sends riders down nearly 550 feet.
• Adventure Island. Located adjacent to Busch Gardens Tampa, Adventure Island is a 56 acre water park that isfilled with water rides, dining and other attractions that incorporate a Key West theme. The theme park is theseventh most attended water park in North America according to the TEA/AECOM Report and features afamily friendly wave pool and children’s water playground that appeal to its core constituency, local familieswith young children.
9

The following table summarizes our theme park portfolio for 2014:
LocationThemePark
YearOpened
AnimalHabitats(2) Rides(3) Shows(4) Other(5)
Orlando, FL
1973 17 14 16 27
2000 5 3 0 5
2008 6 14 0 4
Tampa, FL
1959 17 29 16 36
1980 0 12 0 7
San Diego, CA1964 30 10 20 17
1996(1) 2 9 0 4
San Antonio, TX 1988 15 23 33 51
Williamsburg, VA
1975 7 38 17 44
1984 0 16 1 9
Langhorne, PA 1980 0 25 13 23
Total(6) 99 193 116 227
(1) On November 20, 2012, we acquired the Knott’s Soak City Chula Vista water park from a subsidiary ofCedar Fair, L.P. This water park was renovated, rebranded and relaunched as Aquatica San Diego on June 1,2013.
(2) Represents animal habitats without a ride or show element, often adjacent to a similarly themed attraction.(3) Represents mechanical dry rides, water rides and water slides (including wave pools and lazy rivers).(4) Represents annual and seasonal shows with live entertainment, animals, characters and/or 3-D or 4-D
experiences.(5) Represents our 2014 portfolio for events, distinctive experiences and play areas, which collectively may
include special limited time events; distinctive experiences often limited to small groups and individualsand/or requiring a supplemental fee (such as educational tours, immersive dining experiences and swimmingwith animals); and pure play areas, typically designed for children or seasonal special events, often withouta queue (such as water splash areas or Halloween mazes).
(6) The total number of animal habitats, rides, shows, events, distinctive experiences and play areas in ourtheme park portfolio varies seasonally.
10

Capital Improvements
We make annual investments to support our existing theme park facilities and attractions, as well as enablethe development of new theme park attractions and infrastructure. Maintaining and improving our theme parks,as well as opening new attractions, is critical to remain competitive and increase attendance and our guests’length of stay. Our theme parks feature a variety of attractions for our guests. In 2014, we opened new attractionsin nine of our eleven theme parks. Some of the attractions added include:
• A Sea of Surprises, 50th Anniversary Celebration (SeaWorld Orlando, SeaWorld San Diego andSeaWorld San Antonio): All three SeaWorld parks commemorated the 50th anniversary celebrationwith new interactive experiences, shows, pathway performances, animal encounters and a SurpriseSquad, who treated guests with prizes.
• Explorer’s Reef (SeaWorld San Diego): An innovative new park entrance that immerses guests into anundersea realm from the moment they arrive.
• Falcon’s Fury (Busch Gardens Tampa): The tallest freestanding drop tower in North America, standing at335 feet, which pivots guests 90 degrees to a face-down dive position before dropping toward the ground.
• Pantopia (Busch Gardens Tampa): A fully-revitalized realm that is home to Falcon’s Fury and includesnew culinary options, entertainment, shopping and an indoor theater.
• London Rocks Show (Busch Gardens Williamsburg): A new musical production that takes guests on ajourney to explore the roots of rock and roll.
• Ihu’s Breakaway Falls (Aquatica Orlando): A multi-drop tower slide that provides guests a dramaticvertical plunge followed by a maze of curving tubes before final splashdown.
• Taumata Racer (Aquatica San Diego): A high-speed racing water ride that sends riders down a375-foot slide, around a 180-degree swooping turn, and in and out of tunnels before racing them acrossthe finish line.
• Roa’s Aviary (Aquatica San Antonio): A 13,500 square foot aviary giving guests the chance to float,wade or walk among hundreds of tropical birds. The aviary also features a guest pool and waterfalls.
• Colossal Curl (Water Country USA): An action packed family thrill slide that sends riders down nearly550 feet.
• Cookie’s Monster Land (Sesame Place): A new realm that features five new family-friendly rides, a3-story net climb, and a soft play area for the park’s youngest visitors
During 2015, we plan to open a new roller coaster at our Busch Gardens Williamsburg theme park and aColossal Curl slide at our Adventure Island water park. In addition, we announced plans to open Pacific PointPreserve at our SeaWorld San Antonio theme park, which will include new dining and merchandise venues aswell as a new sea lion show and habitat. We also have announced a new sea lion show at our SeaWorld Orlandotheme park and a new birthday parade and market style dining venue at our Sesame Place theme park.
On a longer term basis, we have announced a plan to build new killer whale environments at all three of ourSeaWorld locations. The San Diego environment is expected to open to the public in 2018 with new killer whaleenvironments to follow at SeaWorld Orlando and SeaWorld San Antonio. The total investment is expected to beapproximately $100.0 million per park by the project’s completion.
Maintenance and Inspection
Maintenance at our theme parks is a key component of guest service and safety and includes two areas offocus: (i) facilities and infrastructure and (ii) rides and attractions. Facilities and infrastructure maintenanceconsists of all functions associated with upkeep, repair, preventative maintenance, code compliance andimprovement of theme park infrastructure. This area is staffed with a combination of external contractors/suppliers and our employees.
11

Rides and attractions maintenance represents all functions dedicated to the inspection, upkeep, repair andtesting of guest experiences, particularly rides. Rides and attractions maintenance is also staffed with acombination of external suppliers, inspectors and our employees, who work to assure that ride experiences areoperating within the manufacturer’s criteria and that maintenance is conducted according to internal standards,industry best practice and standards (such as ASTM International), state or jurisdictional requirements, as well asthe ride designer or manufacturer’s specifications. All ride maintenance personnel are trained to perform theirduties according to internal training processes, in addition to recognized industry certification programs formaintenance leadership. Every ride at our theme parks is inspected regularly, according to daily, weekly,monthly and annual schedules, by both park maintenance experts and external consultants. Additionally, all ridesare inspected daily by maintenance personnel before use by guests to ensure proper and safe operation.
All maintenance activities are planned and tracked using a networked enterprise software system, in order toschedule and request work, track completion progress and manage costs of parts and materials.
Our Animals
We are one of the world’s foremost zoological organizations with an average of more than 1,500 employeesdedicated to animal welfare, training, husbandry and veterinary care. Our mission is to inspire guests througheducation and up-close experiences and to care for and protect animals. We believe we have one of the largestzoological collections in the world, with approximately 89,000 animals, including 8,000 marine and terrestrialanimals and 81,000 fish. Animals in our care include certain rare species such as the cheetah, Bengal tiger, WestIndian manatee, black rhinoceros and polar bear.
The well-being of the animals in our care is a top priority. Our zoological staff has been caring for animalsfor more than five decades, and our expertise is a resource for zoos, aquariums and conservation organizationsworldwide. Our expertise and innovation in animal husbandry have led to advances in the care of species inzoological facilities and in the conservation of wild populations.
We operate successful zoological breeding programs that help maintain a large and genetically-diverseanimal population. Those efforts have produced 32 killer whales, 165 dolphins and 148 sea lions, among otherspecies. More than 80% of the marine mammals living in our zoological theme parks were born in human care.
Many of our programs represent pioneering contributions to the zoological community. Until the birth ofour first killer whale calf in 1985, no zoological institution had successfully bred killer whales. With 30 killerwhales, we care for the largest killer whale population in zoological facilities worldwide and today have the mostgenetically diverse killer whale and dolphin population in our history. Six of these killer whales are presently onloan to a third party pursuant to an agreement entered into in February 2004. Pursuant to this agreement, wereceive an annual fee, which is not material to our results of operations. In addition to generating incrementalrevenue for our business, the agreement provides for additional housing capacity for our killer whales. Theagreement expires in 2031 and is renewable at the option of the parties.
Our commitment to animals also extends beyond our theme parks and throughout the world. We activelyparticipate in species conservation and rescue efforts as discussed in “—Conservation Efforts” and“—Philanthropy and Community Relations” below.
Our Products and Services
Admission Tickets
We generate most of our revenue from selling admission to our theme parks. For the year endedDecember 31, 2014, theme park admissions accounted for approximately 62% of our revenue. We work withtravel agents, ticket resellers and travel agencies, as well as maintain an online presence to promote advancedsales and provide guest convenience and ease of entry. Approximately 39% of our admission ticket purchases aremade online.
12

Guests who visit our theme parks have the option of purchasing multiple types of admission tickets, fromsingle and multi-day tickets to season, annual and two year passes. We also offer a Fun Card at select themeparks that allows additional visits throughout that calendar year. In addition, visitors can purchase vacationpackages with preferred hotels, behind-the-scenes tours, specialty dining packages and front of the line access toenhance their experience.
We also participate in joint programs that are designed to provide visitors to Florida and Southern Californiawith options, flexibility and value in creating their vacation itineraries. For example, we have partnered withseveral theme parks in Orlando to create the Orlando FlexTicket, which allows guests to purchase a ticketproviding access to our theme parks in Orlando and Tampa as well as Universal Studios’ Universal Orlando,Islands of Adventure and Wet ‘n Wild. We also created the 2-Park FlexTicket in conjunction with UniversalStudios, which allows guests to purchase a ticket providing access to SeaWorld San Diego and Universal StudiosHollywood. In addition, we partner with independent third parties who sell tickets and/or packages to our themeparks.
We provide discounts, actively run promotions and use dynamic pricing models to adjust to changes indemand during targeted periods to maximize revenue and manage capacity.
Theme Park Operations
Our theme park operations strive to deliver a high level of service, safety and security at our theme parks.The theme park operations team manages the planning and execution of the overall theme park experience on adaily basis, which is comprised of rides, shows and attractions operations, safety, security, environmental, waterpark and guest arrival services (including parking, tolls, admissions, guest relations, entry and exit). Our themepark operations team identifies and leverages internal best practices across all of our theme parks in order tocreate a seamless and enjoyable guest experience throughout the entire visit.
Culinary Offerings
We strive to deliver a variety of high quality, creative and memorable culinary experiences to our guests.Our culinary operations are strategically organized into five key guest-oriented disciplines designed to drive in-park per capita spending: restaurants, catering, carts and kiosks, specialty snacks and vending. Our culinary teamfocuses on providing creative menu offerings and ways to deliver those offerings that appeal to our diverse guestbase.
We offer a variety of dining programs that provide value to our guests while driving incremental revenues.While our menu offerings have broad appeal, they also cater to guests who desire healthy options and those withspecial allergy-related needs. Our successful all-day-dining program delivers convenience and value to our guestswith numerous restaurant choices for one price. We also offer creative immersive dining experiences that allowguests to dine up-close with our animals and characters. Our commitment to care for the natural world extends tothe food that we serve. Some of our menus feature sustainable, organic, seasonal and locally grown ingredientsthat aim to minimize environmental impacts to animals and their habitats. In addition, through culinary supplychain management initiatives, we are well-positioned to take advantage of changing economic and marketconditions.
Merchandise
We offer guests the opportunity to capture memories through our products and services, including throughtraditional retail shops, game venues and customized photos and videos. We make a focused effort to leveragethe emotional connection of the theme park experiences, capitalize on trends and optimize brand alignment withour merchandise product offerings.
13

We operate nearly 300 specialty retail shops at our theme parks, and our retail business encompasses theentire value chain, from product design to production and sourcing, importing and logistics and visualpresentation up to the point of sale. Our products encompass more than 60,000 unique SKUs. Whether a plushtoy, a stylish apparel item showcasing an attraction, a commemorative memento or a tote to carry it all, we createitems both big and small so that every guest has a chance to find that perfect item that is a reminder of thememories made in our theme parks.
Through real time photo and video technologies, guests can purchase visual memories to commemoratetheir experience with us. Whether on a traditional ride or during one of our numerous animal experiences, wecapture the moment through the use of state-of-the-art processes and technologies. We continue to explore anddevelop our photo and retail business with advanced offerings such as the recent introduction of Photokey toextend beyond the visit with online opportunities to further create customized products.
In-park games span from traditional theme park operations to arcade experiences, all with the goal ofcreating positive family experiences for guests of every age. Our merchandise teams also focus on making a visitto our theme parks easy, convenient and comfortable. This includes offering lockers or service vehicle rentalssuch as strollers, electric personal carts and wheelchairs.
Licensing, Consumer Products and Media Enterprises
To capitalize on our popular brands, we leverage our intellectual property and content through media andconsumer strategic licensing arrangements. We extended the reach of our brands through outbound medialicensing in areas such as films, television programs and digital e-books, as well as nature-based learning mobileapp games for kids. We have also expanded into the development of licensed consumer products to driveconsumer sales through retail channels beyond our theme parks. Our licensed consumer product offeringscurrently include toys, games, books, apparel, DVD’s and technology accessories, among other product types.
In addition, we have expanded our brand appeal through strategic alliances with well-known externalbrands, including Sesame Street and The Polar Express. We entered into an exclusive theme park license withNelvana Enterprises, a division of Corus Entertainment, for the animated character and series Franklin andFriends, which includes in-park character appearances, DVD specials, custom publishing and co-brandedmerchandise. We have also released original songs and soundtracks from our theme parks for sale on digitalmusic channels.
While currently these products do not represent a material percentage of our revenue, we believe byleveraging our brands and our intellectual property through media and consumer products, we will create newrevenue streams and enhance the value of our brands through greater brand visibility, consumer awareness andincreased consumer loyalty.
Group Events and Conventions
We host a variety of different group events, meetings and conventions at our theme parks both during theday and at night. Our venues offer indoor and outdoor space for meetings, special events, entertainment shows,picnics, teambuilding events, group tours and special group ticket packages. Park buy-outs allow groups to enjoyexclusive itineraries, including meetings and shows, up-close encounters with animals and behind the scenestours. Each of our theme parks offers attractive venues, such as SeaWorld Orlando’s Ports of Call, a 70,000square foot dedicated special events complex and banquet facility at the theme park, which is themed as anautical wharf-side warehouse district, complete with two miniature submarines. The facility offers more than30,000 square feet of dining space, with a ballroom that provides seating for more than 750 guests and a largeroutdoor garden reception area that can accommodate additional guests. For the year ended December 31, 2014,we hosted nearly 1,800 group events at our theme parks across the country.
14

Corporate Sponsorships and Strategic Alliances
We seek to secure long-term corporate sponsorships and strategic alliances with leading companies andbrands that share our core values, deliver significant brand value and influence and drive mutual business gains.We identify prospective corporate sponsors based on their industry and industry-leading position, and we selectthem based on their ability to deliver impactful value to our theme parks and our brands, as well as to consumerproducts and various entertainment platforms. Our corporate sponsors contribute to us in a multitude of ways,such as through direct marketing, advertising, media exposure and licensing opportunities, as well as through thenon-profit SeaWorld & Busch Gardens Conservation Fund.
Our Corporate Culture
Our corporate culture is built on our mission to deliver personal, interactive and educational experiences thatenable our customers to celebrate, connect with and care for the natural world we share. Our management teamand our employees are passionate about connecting people to nature and animals and are committed to workingin a socially responsible and environmentally sustainable manner. We teach our employees to be welcoming,friendly and attentive and to create an environment that allows our guests to build lasting memories with theirfamily and friends. Our consumer-oriented corporate culture is integral to our organization and the cornerstone ofour success.
Conservation Efforts
We contribute to species conservation, wildlife rescue, education and environmental stewardship programsaround the world. Through the SeaWorld & Busch Gardens Conservation Fund, a non-profit organization, wesupport wildlife research, habitat protection, animal rescue and conservation education. We also work with andsupport environmental organizations, including the National Wildlife Federation, World Wildlife Fund and TheNature Conservancy and contribute funds in support of efforts to ensure the sustainability of animal species inthe wild. Some of our animals also serve as ambassadors in helping raise awareness for species in danger throughnumerous national media and public appearances. Through our theme parks’ up-close animal encounters,educational exhibits and innovative entertainment, we strive to inspire each guest who visits one of our parks tocare for and conserve the natural world.
In addition, in collaboration with federal, state and local governments, among others, we operate one of theworld’s most respected rescue programs for ill and injured marine animals, with the goal of rehabilitating andreturning them to the wild. Over four decades, our animal experts have helped more than 24,000 ill, injured,orphaned and abandoned animals.
Our commitment to research and conservation also has led to advances in the care of animals in zoologicalfacilities and in conserving wild populations. We have pioneered new ways to rehabilitate animals in need. Forexample, we helped to create nutritional formulas and custom nursing bottles to hand-feed orphaned animals anddeveloped techniques to help save sea turtles with cracked shells, created prosthetic beaks for injured birds andoutfitted injured manatees with an “animal wetsuit” allowing them to stay afloat and warm.
We have also undertaken major sustainability initiatives in our theme parks. For example, we discontinuedthe use of plastic bags in all our gift shops in 2013 and are using only paper and reusable bags. In doing so, wekeep an estimated four million plastic bags from entering landfills and the environment each year.
Philanthropy and Community Relations
We focus our philanthropic efforts in three areas: children, education and the environment. We arecommitted to the communities in which we live, learn, work and play. We also partner with charities across thecountry whose values and missions are aligned with our own, including hospitals, organizations that serve
15
children with disabilities and animal shelter and rescue groups. Through long-term strategic support to advancethe missions of these groups, financial support, in-kind resources or hands-on volunteer work, service is an activepart of the work we do.
Our theme parks inspire and educate children and guests of all ages through the power of entertainment, andour philanthropic efforts reflect this commitment. We extend educational outreach visits to inner-city schools,host “special wish” children to enjoy theme park adventures and create Skype visits with our animals for childrentoo ill to travel.
Finally, a key component of our community outreach is our long-term commitment to honoring the serviceof members of the U.S. military and acknowledging the sacrifices that their families have made. Currently, weoffer a free admission program, which provided approximately 600,000 free single day passes to active militarypersonnel and their families for the year ended December 31, 2014.
Our Guests and Customers
Our theme parks are located near a number of large metropolitan areas, with a total population of over52 million people located within 150 miles. Additionally, because our theme parks are divided between regionaland destination theme parks, our guests are further diversified among a more stable base of local visitors, non-local domestic visitors and international tourists. Our theme parks are entertainment venues and have broaddemographic appeal. For the year ended December 31, 2014, families comprised 54% of our attendance with anaverage party size of 3.9 people. In addition to guests of our theme parks, our customers include consumers ofour various “out-of-park” product and service offerings.
Seasonality
The theme park industry is seasonal in nature. Based upon historical results, we generate the highestrevenues in the second and third quarters of each year, in part because six of our theme parks are only open for aportion of the year. Approximately two-thirds of the Company’s attendance and revenues are generated in thesecond and third quarters of the year. The percent mix of revenues by quarter is relatively constant each year, butrevenues can shift between the first and second quarters due to the timing of Easter and between the first andfourth quarters due to the timing of Christmas and New Year’s. Even for our five theme parks open year-round,attendance patterns have significant seasonality, driven by holidays, school vacations and weather conditions.One of our goals in managing our business is to continue to generate cash flow throughout the year and minimizethe effects of seasonality. In recent years, we have begun to encourage attendance during non-peak times byoffering a variety of seasonal programs and events, such as shows for kids, special concert series, and Halloweenand Christmas events. In addition, during seasonally slow times, operating costs are controlled by reducingoperating hours and show schedules. Employment levels required for peak operations are met largely throughpart-time and seasonal hiring.
Marketing
Our marketing and sales efforts are focused on generating profitable attendance, in-park per capita spendingand building the value of our brands. Through advertising, including local customization, promotions, retail andcorporate partners, digital platforms, public relations and sales initiatives, we drive awareness of and intent tovisit our theme parks, attendance and higher in-park per capita spending on an international, national andregional level. Our attractive destination locations and strategy of grouping parks together creates high appeal formulti-day visits. Our strategic priorities include: (i) building our brands, (ii) improving guest loyalty,(iii) expanding digital expertise and (iv) broadening appeal (among multi-cultural consumers, kids and domesticmarkets). With great brands and a diverse team, marketing and sales will play a significant role in driving futuregrowth.
16

Intellectual Property
Our business is affected by our ability to protect against infringement of our intellectual property, includingour trademarks, service marks, domain names, copyrights and other proprietary rights. Important intellectualproperty includes rights in names, logos, character likenesses, theme park attractions, content of televisionprograms and systems related to the study and care of certain of our animals. In addition, we are party to keylicense agreements as licensee, including our agreements with Sesame Workshop and ABI as discussed below.To protect our intellectual property rights, we rely upon a combination of trademark, copyright, trade secret andunfair competition laws of the United States and other countries, as well as contract provisions and third-partypolicies and procedures governing internet/domain name registrations.
Busch Gardens License Agreement
Our subsidiary, SeaWorld Parks & Entertainment LLC, is a party to a trademark license agreement withABI, which governs our use of the Busch Gardens name and logo. Under the license agreement, ABI granted tous a perpetual, exclusive, worldwide, royalty-free license to use the Busch Gardens trademark and certain relateddomain names in connection with the operation, marketing, promotion and advertising of our theme parks, aswell as in connection with the production, use, distribution and sale of merchandise sold in connection with suchtheme parks.
The license extends to our Busch Gardens theme parks located in Williamsburg, Virginia and Tampa,Florida, and may also include any amusement or theme park anywhere in the world that we acquire, build orrebrand with the Busch Gardens name in the future, subject to certain conditions. ABI may not assign, transfer orsell the Busch Gardens mark without first granting us a reasonable right of first refusal to purchase such mark.
We have agreed to indemnify ABI from and against third party claims and losses arising out of or inconnection with the operation of the theme parks and the related marketing or promotion thereof, anymerchandise branded with the licensed marks and the infringement of a third party’s intellectual property. We arerequired to carry certain insurance coverage throughout the term of the license.
The license agreement can be terminated by ABI under certain limited circumstances, including inconnection with certain types of change of control of SeaWorld Parks & Entertainment LLC.
Sesame Licenses
Sesame Place Theme Park License Agreements
Our subsidiary, SeaWorld Parks & Entertainment LLC (f/k/a SPI, Inc.), is a party to a license agreementwith Sesame Workshop (f/k/a Children’s Television Workshop). Under the license agreement, we were grantedthe right to use titles, marks, names, and characters from the Sesame Street and The Electric Company televisionseries, as well as certain characters and elements created by Muppets Inc. for the Sesame Street series, relatedmarketing materials, and the Sesame Place design trademark in connection with the children’s play parks inLanghorne, Pennsylvania. We pay specified royalties based on receipts from business conducted on the premisesof the theme park to Sesame Workshop. We are required to include Sesame Workshop and Muppets Inc. asinsured parties under any relevant insurance policies, and have agreed to indemnify Sesame Workshop from andagainst certain claims and expenses arising out of any personal or property injury at our Sesame Place park orbreach of the license agreement. The license agreement can be terminated by Sesame Workshop under certaincircumstances, including in connection with a specified change of control of SeaWorld Parks & EntertainmentLLC, specified uncured breaches of the license agreement or specified bankruptcy events.
Under a separate agreement, Sesame Workshop granted SeaWorld Parks & Entertainment LLC a license todevelop, manufacture, and produce in the United States (and, in some circumstances, elsewhere in the world) andto distribute and sell at Sesame Place branded play parks, certain products bearing Sesame Place, Sesame Street,
17

and Sesame Street Muppet characters, likenesses, logos, marks and materials, including apparel, flags, bags,mugs, buttons, pens, wristbands and other miscellaneous products. The parties have agreed to indemnify eachother from and against claims and expenses in connection with our respective performance under the licenseagreement and any breach thereof. Sesame Workshop may terminate the license under certain circumstances,including our uncured breach or bankruptcy.
Both agreements are scheduled to remain in effect until December 31, 2021.
Multi-Park License
Under a separate agreement, Sesame Workshop granted SeaWorld Parks & Entertainment LLC rights to usethe Sesame Place and Sesame Workshop names and logos, certain Sesame Street characters (including Elmo, BigBird and Cookie Monster), and granted a limited term right of first negotiation to utilize characters from otherSesame Workshop television series at SeaWorld San Diego, SeaWorld San Antonio, SeaWorld Orlando, and ourtwo Busch Gardens theme parks. Within these theme parks we have rights to use the marks and characters inconnection with Sesame Street themed attractions, Sesame Street shows and character appearances, and themarketing, advertising and promotion of the theme parks.
Sesame Workshop has also granted us the right to develop, manufacture, distribute and sell products withinour SeaWorld and Busch Gardens theme parks, at other parks in the United States that are owned or operated bySeaWorld Parks & Entertainment LLC, its subsidiaries or affiliated entities, and through online stores onwebsites for our parks.
Pursuant to this agreement we pay a specified annual license fee, as well as a specified royalty based onrevenues earned in connection with sales of licensed products, all food and beverage items utilizing the licensedelements and any events utilizing such elements if a separate fee is paid for such event.
The parties have agreed to indemnify each other from and against third party claims and expenses arisingfrom their respective performance under the agreement or any breach thereof. Sesame Workshop has the right toterminate the agreement under certain limited circumstances, including a change of control of SeaWorld Parks &Entertainment LLC, SeaWorld Parks & Entertainment LLC’s bankruptcy or uncured breach of the agreement, orthe termination of the license agreement regarding our Sesame Place theme park.
The agreement is scheduled to remain in effect until December 31, 2021 unless earlier terminated orextended.
Our Industry
We believe that the theme park industry is an attractive sector characterized by a proven business model thatgenerates significant cash flow and has clear avenues for growth. Theme parks offer a strong consumer valueproposition, particularly when compared to other forms of out-of-home entertainment such as concerts, sportingevents, cruises and movies. As a result, theme parks attract a broad range of guests and generally exhibit strongmargins across regions, operators, park types and macroeconomic conditions.
According to the IBISWorld Report, the U.S. amusement park industry is comprised of a large number ofvenues ranging from a small group of high attendance, heavily-themed destination theme parks to a large groupof lower attendance local theme parks and family entertainment centers. According to the TEA/AECOM Report,the United States is the largest theme park market in the world with five of the ten largest theme park operatorsand 11 of the 25 most-visited theme parks in the world. In 2014, the U.S. amusement park industry was expectedto generate approximately $15.4 billion in revenues, according to the IBISWorld Report.
Competition
Our theme parks and other product and entertainment offerings compete directly for discretionary spendingwith other destination and regional theme parks and water and amusement parks and indirectly with other types
18

of recreational facilities and forms of entertainment, including movies, home entertainment options, sportsattractions, restaurants and vacation travel. Principal direct competitors of our theme parks include theme parksoperated by The Walt Disney Company, Universal Studios, Six Flags, Cedar Fair, Merlin Entertainments andHershey Entertainment and Resorts Company. Our highly differentiated products provide a complementaryexperience to those offered by fantasy-themed Disney and Universal parks. In addition, we benefit from thesignificant capital investments made in developing the tourism industry in the Orlando area. The Orlando themepark market is extremely competitive, with a high concentration of theme parks operated by several companies.
Competition is based on multiple factors including location, price, the originality and perceived quality ofthe rides and attractions, the atmosphere and cleanliness of the theme park, the quality of food and entertainment,weather conditions, ease of travel to the theme park (including direct flights by major airlines), and availabilityand cost of transportation to a theme park. We believe we compete effectively, and our competitive position isprotected, due to our strong brand recognition, extensive zoological collection, high historical capital investmentand valuable real estate. Additionally, we believe that our theme parks feature a sufficient quality and variety ofrides and attractions, educational and interactive experiences, merchandise locations, restaurants and familyorientation to make them highly competitive with other destination and regional theme parks, as well as otherforms of entertainment.
Employees
As of December 31, 2014, we employed approximately 5,000 full-time employees and approximately 6,100part-time employees. During our peak operating season in 2014, we employed approximately 13,700 seasonalemployees, many of whom are high school and college students. None of our employees are covered by acollective bargaining agreement, and we consider our employee relations to be good.
Regulatory
Our operations are subject to a variety of federal, state and local laws, regulations and ordinances including,but not limited to, those regulating the environment, display, possession and care of our animals, amusement parkrides, building and construction, health and safety, labor and employment, workplace safety, zoning and land useand alcoholic beverage and food service. Key statutes and treaties relating to the display, possession and care ofour zoological collection include the Endangered Species Act, Marine Mammal Protection Act, Animal WelfareAct, Convention on International Trade in Endangered Species and Fauna Protection Act and the Lacey Act. Wemust also comply with the Migratory Bird Treaty Act, Bald and Golden Eagle Protection Act, Wild BirdConservation Act and National Environmental Policy Act, among other laws and regulations. We believe that weare in substantial compliance with applicable laws, regulations and ordinances; however, such requirements maychange over time, and there can be no assurance that new requirements, changes in enforcement policies ornewly discovered conditions relating to our properties or operations will not require significant expenditures inthe future.
Insurance
We maintain insurance of the type and in the amounts that we believe to be commercially reasonable forbusinesses in our industry. We maintain primary and excess casualty coverage of up to $100 million. As part ofthis coverage, we retain deductible/self-insured retention exposures of $1 million per occurrence for generalliability claims, $250,000 per accident for automobile liability claims, and $750,000 per occurrence for workerscompensation claims. We maintain employers’ liability and all coverage required by law in the states in whichwe operate. Defense costs are included in the insurance coverage we obtain against losses in these areas. Basedupon our historical experience of reported claims and an estimate for incurred-but-not-reported claims, we accruea liability for our deductible/self-insured retention contingencies regarding general liability, automobile liabilityand workers compensation exposures. We maintain additional forms of special casualty coverage appropriate forbusinesses in our industry. We also maintain commercial property coverage against fire, natural perils, so-called
19

“extended coverage” perils such as civil commotion, business interruption and terrorism exposures for protectionof our real and personal properties (other than land). We generally renegotiate our insurance policies on anannual basis. We cannot predict the amounts of premium cost that we may be required to pay for future insurancecoverage, the level of any deductibles/self-insured retentions we may retain applicable thereto, the level ofaggregate excess coverage available or the availability of coverage for special or specific risks.
Corporate History
On December 1, 2009, investment funds affiliated with The Blackstone Group L.P. and certain co-investors,through SeaWorld Entertainment, Inc. and its wholly-owned subsidiary, SeaWorld Parks & Entertainment, Inc.(“SEA”), acquired 100% of the equity interests of Sea World LLC (f/k/a Sea World, Inc.) and SeaWorld Parks &Entertainment LLC (f/k/a Busch Entertainment Corporation) from certain subsidiaries of Anheuser-BuschCompanies, Inc. We refer to this acquisition and related financing transactions as the “2009 Transactions.”
SeaWorld Entertainment, Inc. was incorporated in Delaware on October 2, 2009 in connection with the2009 Transactions and changed its name from SW Holdco, Inc. to SeaWorld Entertainment, Inc. in December2012. We completed our initial public offering in April 2013 and our common stock is listed on the New YorkStock Exchange under the symbol “SEAS”. As of December 31, 2014, Blackstone and the other co-investorsowned, through the Partnerships, approximately 21.9% of our total outstanding common stock.
Available Information
Our website is http://www.seaworldentertainment.com. Information contained on our website is notincorporated by reference herein and is not a part of this Annual Report on Form 10-K. We make available freeof charge, on or through the “Investor Relations” section of our website, our Annual Report on Form 10-K,Quarterly Reports on Form 10-Q, Current Reports on Form 8-K and amendments to those reports, if any, or otherfilings filed or furnished pursuant to Section 13(a) or 15(d) of the Exchange Act as soon as reasonablypracticable after electronically filing or furnishing these reports with the Securities and Exchange Commission(“SEC”). We have adopted a Code of Business Conduct and Ethics applicable to our employees including ourprincipal executive, financial and accounting officers, and it is available free of charge, on or through the“Investor Relations” section of our website along with our Corporate Governance Guidelines, and the charters ofour Audit Committee, Compensation Committee and Nominating and Corporate Governance Committee.
The SEC maintains a website at http://www.sec.gov that contains our Annual Report on Form 10-K,Quarterly Reports on Form 10-Q, Current Reports on Form 8-K and amendments to those reports, if any, or otherfilings filed or furnished pursuant to Section 13(a) or 15(d) of the Exchange Act, and our proxy and informationstatements. All reports that we file with the SEC may be read and copied at the SEC’s Public Reference Room at100 F Street, N.E., Washington, DC, 20549. Information about the operation of the Public Reference Room canbe obtained by calling the SEC at 1-800-SEC-0330.
Website and Social Media Disclosure
We use our website (www.seaworldentertainment.com) and our corporate Twitter account (@Seaworld) aschannels of distribution of company information. The information we post through these channels may bedeemed material. Accordingly, investors should monitor these channels, in addition to following our pressreleases, SEC filings and public conference calls and webcasts. In addition, you may automatically receive e-mailalerts and other information about SeaWorld when you enroll your e-mail address by visiting the “E-mail Alerts”section of our website at www.seaworldinvestors.com. The contents of our website and social media channels arenot, however, a part of this Annual Report on Form 10-K.
20

Item 1A. Risk Factors
The following risk factors should be read carefully in connection with evaluating us and this Annual Reporton Form 10-K. Certain statements in “Risk Factors” are forward-looking statements. See “Special NoteRegarding Forward-Looking Statements” elsewhere in this report.
Risks Related to Our Business and Our Industry
We could be adversely affected by a decline in discretionary consumer spending or consumer confidence.
Our success depends to a significant extent on discretionary consumer spending, which is heavily influencedby general economic conditions and the availability of discretionary income. In the past, severe economicdownturns, coupled with high volatility and uncertainty as to the future global economic landscape, have had anadverse effect on consumers’ discretionary income and consumer confidence.
Difficult economic conditions and recessionary periods may adversely impact attendance figures, thefrequency with which guests choose to visit our theme parks and guest spending patterns at our theme parks. Theactual or perceived weakness in the economy could also lead to decreased spending by our guests. For example,in 2009 and 2010, we experienced a decline in attendance as a result of the global economic crisis, which in turnadversely affected our revenue and profitability. Both attendance and total per capita spending at our theme parksare key drivers of our revenue and profitability, and reductions in either can materially adversely affect ourbusiness, financial condition and results of operations.
Various factors beyond our control could adversely affect attendance and guest spending patterns at ourtheme parks.
Various factors beyond our control could adversely affect attendance and guest spending patterns at ourtheme parks. These factors could also affect our suppliers, vendors, insurance carriers and other contractualcounterparties. Such factors include:
• war, terrorist activities or threats and heightened travel security measures instituted in response to theseevents;
• outbreaks of pandemic or contagious diseases or consumers’ concerns relating to potential exposure tocontagious diseases;
• natural disasters, such as hurricanes, fires, earthquakes, tsunamis, tornados, floods and volcaniceruptions and man-made disasters such as the oil spill in the Gulf of Mexico, which may deter travelersfrom scheduling vacations or cause them to cancel travel or vacation plans;
• bad weather and even forecasts of bad weather, including abnormally hot, cold and/or wet weather,particularly during weekends, holidays or other peak periods;
• changes in the desirability of particular locations or travel patterns of our guests;
• low consumer confidence;
• oil prices and travel costs and the financial condition of the airline, automotive and othertransportation-related industries, any travel-related disruptions or incidents and their impact on travel;
• actions or statements by U.S. and foreign governmental officials related to travel and corporate travel-related activities (including changes to the U.S. visa rules) and the resulting public perception of suchtravel and activities; and
• interruption of public or private utility services to our theme parks.
Any one or more of these factors could adversely affect attendance and total per capita spending at ourtheme parks, which could materially adversely affect our business, financial condition and results of operations.
21

We are subject to complex federal and state regulations governing the treatment of animals, which canchange, and to claims and lawsuits by activist groups before government regulators and in the courts.
We operate in a complex and evolving regulatory environment and are subject to various federal and statestatutes and regulations and international treaties implemented by federal law. The states in which we operatealso regulate zoological activity involving the import and export of exotic and native wildlife, endangered and/orotherwise protected species, zoological display and anti-cruelty statutes. We incur significant compliance costs inconnection with these regulations and violation of such regulations could subject us to fines and penalties andresult in the loss of our licenses and permits, which, if occurred, could impact our ability to display certainanimals. Future amendments to existing statutes, regulations and treaties or new statutes, regulations and treatiesmay potentially restrict our ability to maintain our animals, or to acquire new ones to supplement or sustain ourbreeding programs or otherwise adversely affect our business. For instance, in March of 2014 a bill was proposedby a California lawmaker that seeks to restrict our ability to display certain animals in that state. Also, in June of2014 the U.S. House of Representatives adopted an amendment that, if enacted, would encourage the Animal andPlant Health Inspection Service to update existing regulations for marine mammals in domestic zoos and aquaria.It is unclear whether the language of the amendment may be further modified or if the underlying legislation willbe enacted into law.
From time to time, animal activist and other third-party groups may make claims before governmentagencies, bring lawsuits against us, and/or attempt to generate negative publicity associated with our business.Such activities sometimes are based on allegations that we do not properly care for some of our featured animals.On other occasions, such activities are specifically designed to change existing law or enact new law in order toimpede our ability to retain, exhibit, acquire or breed animals. While we seek to structure our operations tocomply with all applicable federal and state laws and vigorously defend ourselves when sued, there are noassurances as to the outcome of future claims and lawsuits that could be brought against us. In addition, negativepublicity associated with such activities could adversely affect our reputation and results of operations. At times,activists and other third-party groups have also attempted to generate negative publicity related to ourrelationships with our business partners, such as corporate sponsors, promotional partners, vendors, ticketresellers and others. For example, in 2014, we experienced demand pressures, particularly in California, whichwe believe were partly due to media attention relating to the recent legislation proposed in that state. In addition,we experienced increased media attention in 2014 extending to our relationships with some of our businesspartners.
Incidents or adverse publicity concerning our theme parks or the theme park industry generally could harmour brands or reputation as well as negatively impact our revenues and profitability.
Our brands and our reputation are among our most important assets. Our ability to attract and retaincustomers depends, in part, upon the external perceptions of the Company, the quality of our theme parks andservices and our corporate and management integrity. The operation of theme parks involves the risk ofaccidents, illnesses, environmental incidents and other incidents which may negatively affect the perception ofguest and employee safety, health, security and guest satisfaction and which could negatively impact our brandsor reputation and our business and results of operations. An accident or an injury at any of our theme parks or attheme parks operated by competitors, particularly an accident or an injury involving the safety of guests andemployees, that receives media attention, is the topic of a book, film, documentary or is otherwise the subject ofpublic discussions, may harm our brands or reputation, cause a loss of consumer confidence in the Company,reduce attendance at our theme parks and negatively impact our results of operations. Such incidents haveoccurred in the past and may occur in the future. In addition, other types of adverse publicity concerning ourbusiness or the theme park industry generally could harm our brands, reputation and results of operations. Theconsiderable expansion in the use of social media over recent years has compounded the impact of negativepublicity.
22

Our intellectual property rights are valuable, and any inability to protect them could adversely affect ourbusiness.
Our intellectual property, including our trademarks, service marks, domain names, copyrights, patent andother proprietary rights, constitutes a significant part of the value of the Company. To protect our intellectualproperty rights, we rely upon a combination of trademark, copyright, patent, trade secret and unfair competitionlaws of the United States and other countries, as well as contract provisions and third-party policies andprocedures governing internet/domain name registrations. However, there can be no assurance that thesemeasures will be successful in any given case, particularly in those countries where the laws do not protect ourproprietary rights as fully as in the United States. We may be unable to prevent the misappropriation,infringement or violation of our intellectual property rights, breaching any contractual obligations to us, orindependently developing intellectual property that is similar to ours, any of which could reduce or eliminate anycompetitive advantage we have developed, adversely affect our revenues or otherwise harm our business.
We have obtained and applied for numerous U.S. and foreign trademark and service mark registrations andwill continue to evaluate the registration of additional trademarks and service marks or other intellectualproperty, as appropriate. We cannot guarantee that any of our pending applications will be approved by theapplicable governmental authorities. Moreover, even if the applications are approved, third parties may seek tooppose or otherwise challenge these registrations. A failure to obtain registrations for our intellectual property inthe United States and other countries could limit our ability to protect our intellectual property rights and impedeour marketing efforts in those jurisdictions.
We are actively engaged in enforcement and other activities to protect our intellectual property rights. If itbecame necessary for us to resort to litigation to protect these rights, any proceedings could be burdensome,costly and divert the attention of our personnel, and we may not prevail. In addition, any repeal or weakening oflaws or enforcement in the United States or internationally intended to protect intellectual property rights couldmake it more difficult for us to adequately protect our intellectual property rights, negatively impacting theirvalue and increasing the cost of enforcing our rights.
We may be subject to claims for infringing the intellectual property rights of others, which could be costly andresult in the loss of significant intellectual property rights.
We cannot be certain that we do not and will not infringe the intellectual property rights of others. We have beenin the past, and may be in the future, subject to litigation and other claims in the ordinary course of our businessbased on allegations of infringement or other violations of the intellectual property rights of others. Regardless oftheir merits, intellectual property claims can divert the efforts of our personnel and are often time-consuming andexpensive to litigate or settle. In addition, to the extent claims against us are successful, we may have to paysubstantial money damages or discontinue, modify or rename certain products or services that are found to be inviolation of another party’s rights. We may have to seek a license (if available on acceptable terms, or at all) tocontinue offering products and services, which may significantly increase our operating expenses.
Animals in our care are important to our theme parks, and they could be exposed to infectious diseases.
Many of our theme parks are distinguished from those of our competitors in that we offer guest interactions withanimals. Individual animals, specific species of animals or groups of animals in our zoological collection couldbe exposed to infectious diseases. While we have never had any such experiences, an outbreak of an infectiousdisease among any animals in our theme parks or the public’s perception that a certain disease could be harmfulto human health may materially adversely affect our zoological collection, our business, financial condition andresults of operations.
Featuring animals at our theme parks involves risks.
Our theme parks feature numerous displays and interactions that include animals. All animal enterprisesinvolve some degree of risk. All animal interaction by our employees and our guests in attractions in our theme
23

parks, where offered, involves risk. While we maintain strict safety procedures for the protection of ouremployees and guests, injuries or death, while rare, have occurred in the past. For example, in February 2010, atrainer was killed while engaged in an interaction with a killer whale. Following this incident, we were subject toan inspection by the U.S. Department of Labor’s Occupational Safety and Health Administration (“OSHA”),which resulted in three citations concerning alleged violations of the Occupational Safety and Health Act andcertain regulations thereunder. In 2012, we initiated an appeal of certain of these citations with the U.S. Court ofAppeals for the District of Columbia Circuit. On April 11, 2014, the Court of Appeals denied our appeal and wehave elected to not pursue further appeal. In connection with this incident, we reviewed and revised our safetyprotocols and made certain safety-related facility enhancements such as revising training protocols used in showperformances. This incident has also been and continues to be the subject of significant media attention,including extensive television and newspaper coverage, a documentary and a book, as well as discussions insocial media. This incident and similar events that may occur in the future may harm our reputation, reduceattendance and negatively impact our business, financial condition and results of operations.
In addition, six killer whales are presently on loan to a third party. Although the occurrence of any accidentor injury involving these killer whales would be outside of our control, any such occurrence could negativelyaffect our business and reputation.
We maintain insurance of the type and in amounts that we believe is commercially reasonable and that isavailable to animal enterprise related businesses in the theme park industry. We cannot predict the level of thepremiums that we may be required to pay for subsequent insurance coverage, the level of any self-insuranceretention applicable thereto, the level of aggregate coverage available, or the availability of coverage for specificrisks.
If we lose licenses and permits required to exhibit animals and/or violate laws and regulations, our businesswill be adversely affected.
We are required to hold government licenses and permits, some of which are subject to yearly or periodicrenewal, for purposes of possessing, exhibiting and maintaining animals. Although our theme parks’ licenses andpermits have always been renewed in the past, in the event that any of our licenses or permits are not renewed orany of our licenses or permits are revoked, portions of the affected theme park might not be able to remain openfor purpose of displaying or retaining the animals covered by such license or permit. Such an outcome couldmaterially adversely affect our business, financial condition and results of operations.
In addition, we are subject to periodic inspections by federal and state agencies and the subsequent issuanceof inspection reports. While we believe that we comply with, or exceed, requisite care and maintenance standardsthat apply to our animals, government inspectors can cite us for alleged statutory or regulatory violations. Inunusual instances when we are cited for an alleged deficiency, we are most often given the opportunity to correctany purported deficiencies without penalty. It is possible, however, that in some cases a federal or state regulatorcould seek to impose monetary fines on us. In the past, when we have been subjected to governmental claims forfines, the amounts involved were not material to our business, financial condition or results of operations.However, while highly unlikely, we cannot predict whether any future fines that regulators might seek to imposewould materially adversely affect our business, financial condition or results of operations.
Moreover, many of the statutes under which we operate allow for the imposition of criminalsanctions. While neither of the foregoing situations are likely to occur, either could negatively affect thebusiness, financial condition or results of operations at our theme parks.
24

A significant portion of our revenues are generated in the States of Florida, California and Virginia and inthe Orlando market. Any risks affecting such markets, such as natural disasters and travel-related disruptionsor incidents, may materially adversely affect our business, financial condition and results of operations.
Approximately 56%, 19% and 13% of our revenues in 2014 were generated in the States of Florida,California and Virginia, respectively. In addition, our revenues and results of operations depend significantly onthe results of our Orlando theme parks. The Orlando theme park market is extremely competitive, with a highconcentration of theme parks operated by several companies.
Any risks described in this Annual Report on Form 10-K, such as the occurrence of natural disasters andtravel-related disruptions or incidents, affecting the States of Florida, California and Virginia generally or ourOrlando theme parks in particular may materially adversely affect our business, financial condition or results ofoperations, especially if they have the effect of decreasing attendance at our theme parks or, in extreme cases,cause us to close any of our theme parks for any period of time. For example, in 2004, the State of Florida wasimpacted by Hurricanes Charley, Frances and Jeanne, which caused extensive physical damage and poweroutages in various parts of the State of Florida. Although we attempted to manage our exposure to such events byimplementing our hurricane preparedness plan, our theme parks located in Orlando and Tampa, Floridaexperienced closures of several days as a result of these storms.
Because we operate in a highly competitive industry, our revenues, profits or market share could be harmed ifwe are unable to compete effectively.
The entertainment industry, and the theme park industry in particular, is highly competitive. Our themeparks compete with other theme, water and amusement parks and with other types of recreational facilities andforms of entertainment, including movies, home entertainment options, sports attractions, restaurants andvacation travel.
Principal direct competitors of our theme parks include theme parks operated by The Walt DisneyCompany, Universal Studios, Six Flags, Cedar Fair, Merlin Entertainments and Hershey Entertainment andResorts Company. The principal competitive factors of a theme park include location, price, originality andperceived quality of the rides and attractions, the atmosphere and cleanliness of the theme park, the quality of itsfood and entertainment, weather conditions, ease of travel to the theme park (including direct flights by majorairlines), and availability and cost of transportation to a theme park. Certain of our direct competitors havesubstantially greater financial resources than we do, and they may be able to adapt more quickly to changes inguest preferences or devote greater resources to promotion of their offerings and attractions than us. Ourcompetitors may be able to attract guests to their theme parks in lieu of our own through the development oracquisition of new rides, attractions or shows that are perceived by guests to be of a higher quality andentertainment value. As a result, we may not be able to compete successfully against such competitors. Forexample, in 2014, we experienced negative attendance trends, primarily at our destination parks in Florida, whichwe believe was due in part to significant new attraction offerings at competitor destination parks, along with adelay in the scheduled opening of one of our new rides at our Busch Gardens Tampa park.
If we lose key personnel, our business may be adversely affected.
Our success depends in part upon a number of key employees, including members of our senior managementteam who have extensive experience in the industry. The loss of the services of our key employees could have amaterially adverse effect on our business. Presently, we do not have any employment agreements with any of ourkey employees.
Increased labor costs and employee health and welfare benefits may reduce our results of operations.
Labor is a primary component in the cost of operating our business. We devote significant resources torecruiting and training our managers and employees. Increased labor costs due to competition, increased
25

minimum wage or employee benefit costs or otherwise, would adversely impact our operating expenses. ThePatient Protection and Affordable Care Act of 2010 and the amendments thereto contain provisions that haveimpacted our healthcare costs. It is possible that any future amendments could significantly increase ourcompensation costs, which would reduce our net income and adversely affect our cash flows.
Unionization activities or labor disputes may disrupt our operations and affect our profitability.
Although none of our employees are currently covered under collective bargaining agreements, we cannotguarantee that our employees will not elect to be represented by labor unions in the future. If some or all of ouremployees were to become unionized and collective bargaining agreement terms were significantly differentfrom our current compensation arrangements, it could adversely affect our business, financial condition or resultsof operations. In addition, a labor dispute involving some or all of our employees may disrupt our operations andreduce our revenues, and resolution of disputes may increase our costs.
Although we maintain binding policies that require employees to submit to a mandatory alternative disputeresolution procedure in lieu of other remedies, as employers, we may be subject to various employment-relatedclaims, such as individual or class actions or government enforcement actions relating to alleged employmentdiscrimination, employee classification and related withholding, wage-hour, labor standards or healthcare andbenefit issues. Such actions, if brought against us and successful in whole or in part, may affect our ability tocompete or materially adversely affect our business, financial condition or results of operations.
Our business depends on our ability to meet our workforce needs.
Our success depends on our ability to attract, train, motivate and retain qualified employees to keep pacewith our needs, including employees with certain specialized skills in the field of animal training and care. If weare unable to do so, our results of operations and cash flows may be adversely affected.
In addition, we employ a significant seasonal workforce. We recruit year-round to fill thousands of seasonalstaffing positions each season and work to manage seasonal wages and the timing of the hiring process to ensurethe appropriate workforce is in place. There is no assurance that we will be able to recruit and hire adequateseasonal personnel as the business requires or that we will not experience material increases in the cost ofsecuring our seasonal workforce in the future. Increased seasonal wages or an inadequate workforce couldmaterially adversely affect our business, financial condition or results of operations.
Our growth strategy may not achieve the anticipated results.
Our future success will depend on our ability to grow our business, including through capital investments toimprove existing and create new theme parks, rides, attractions and shows, as well as in-park product offeringsand product offerings outside of our theme parks. Our growth and innovation strategies require significantcommitments of management resources and capital investments and may not grow our revenues at the rate weexpect or at all. As a result, we may not be able to recover the costs incurred in developing our new projects andinitiatives or to realize their intended or projected benefits, which could materially adversely affect our business,financial condition or results of operations.
We may not be able to fund theme park capital expenditures and investment in future attractions and projects.
A principal competitive factor for a theme park is the originality and perceived quality of its rides andattractions. We need to make continued capital investments through maintenance and the regular addition of newrides and attractions. We recently announced an initiative called the Blue World Project that involves buildingfirst-of-its-kind killer whale environments at all three SeaWorld parks. The total investment is expected to beapproximately $100.0 million per park by the project’s completion. The first of these environments will be builtat SeaWorld San Diego and is expected to open to the public in 2018 with new killer whale environments to
26
follow at SeaWorld Orlando and SeaWorld San Antonio. Our ability to fund capital expenditures will depend onour ability to generate sufficient cash flow from operations and to raise capital from third parties. We cannotassure you that our operations will be able to generate sufficient cash flow to fund such costs, or that we will beable to obtain sufficient financing on adequate terms, or at all, which could cause us to delay or abandon certainprojects or plans.
The high fixed cost structure of theme park operations can result in significantly lower margins if revenuesdecline.
A large portion of our expenses is relatively fixed because the costs for full-time employees, maintenance,animal care, utilities, advertising and insurance do not vary significantly with attendance. These fixed costs mayincrease at a greater rate than our revenues and may not be able to be reduced at the same rate as decliningrevenues. If cost-cutting efforts are insufficient to offset declines in revenues or are impracticable, we couldexperience a material decline in margins, revenues, profitability and reduced or negative cash flows. Such effectscan be especially pronounced during periods of economic contraction or slow economic growth, such as therecent economic recession.
If we are unable to maintain certain commercial licenses, our business, reputation and brand could beadversely affected.
We rely on licenses from Sesame Workshop to use the Sesame Place trade name and trademark and certainother intellectual property rights, including titles, marks, characters, logos and designs from the Sesame Streettelevision series within our Sesame Place theme park and with respect to Sesame Street themed areas withincertain areas of some of our other theme parks, as well as in connection with the sales of certain Sesame Streetthemed products. Our use of these intellectual property rights is subject to the approval of Sesame Workshop andthe licenses may be terminated in certain limited circumstances or in the event of our bankruptcy. Furthermore,the current term of both the Sesame Place theme park license and the multi-park license expire on December 31,2021, and there is no assurance that we will be able to renegotiate the use of such intellectual property oncommercially acceptable terms or at all. The new terms of the licenses may significantly increase our operatingexpenses, or otherwise adversely affect our business.
ABI is the owner of the Busch Gardens trademarks and domain names. ABI has granted us a perpetual,exclusive, worldwide, royalty-free license to use the Busch Gardens trademark and certain related domain namesin connection with the operation, marketing, promotion and advertising of certain of our theme parks, as well asin connection with the production, use, distribution and sale of merchandise sold in connection with such themeparks. Under the license, we are required to indemnify ABI against losses related to our use of the marks. If wewere to lose or have to renegotiate this license, our business may be adversely affected.
Changes in consumer tastes and preferences for entertainment and consumer products could reduce demandfor our entertainment offerings and products and adversely affect the profitability of our business.
The success of our business depends on our ability to consistently provide, maintain and expand theme parkattractions as well as create and distribute media programming, online material and consumer products that meetchanging consumer preferences. In addition, consumers from outside the United States constitute an increasinglyimportant portion of our theme park attendance, and our success depends in part on our ability to successfullypredict and adapt to tastes and preferences of this consumer group. If our entertainment offerings and products donot achieve sufficient consumer acceptance or if consumer preferences change, our business, financial conditionor results of operations could be materially adversely affected.
27

Our existing debt agreements contain, and future debt agreements may contain, restrictions that may limit ourflexibility in operating our business.
Our existing debt agreements contain, and documents governing our future indebtedness may contain,numerous financial and operating covenants that limit the discretion of management with respect to certainbusiness matters. These covenants place restrictions on, among other things, our ability to incur additionalindebtedness, pay dividends and other distributions, make capital expenditures, make certain loans, investmentsand other restricted payments, enter into agreements restricting our subsidiaries’ ability to pay dividends, engagein certain transactions with stockholders or affiliates, sell certain assets or engage in mergers, acquisitions andother business combinations, amend or otherwise alter the terms of our indebtedness, alter the business that weconduct, guarantee indebtedness or incur other contingent obligations and create liens. Our existing debtagreements also require, and documents governing our future indebtedness may require, us to meet certainfinancial ratios and tests. Our ability to comply with these and other provisions of the existing debt agreements isdependent on our future performance, which will be subject to many factors, some of which are beyond ourcontrol. The breach of any of these covenants or non-compliance with any of these financial ratios and tests couldresult in an event of default under the existing debt agreements, which, if not cured or waived, could result inacceleration of the related debt and the acceleration of debt under other instruments evidencing indebtedness thatmay contain cross-acceleration or cross-default provisions. Variable rate indebtedness subjects us to the risk ofhigher interest rates, which could cause our future debt service obligations to increase significantly.
Our substantial leverage could adversely affect our ability to raise additional capital to fund our operations,limit our ability to react to changes in the economy or our industry, expose us to interest rate risk to the extentof our variable rate debt and prevent us from meeting our obligations under our indebtedness.
We are highly leveraged. As of December 31, 2014, our total indebtedness was approximately$1,603.5 million. Our high degree of leverage could have important consequences, including the following: (i) asubstantial portion of our cash flow from operations is dedicated to the payment of principal and interest onindebtedness, thereby reducing the funds available for operations, future business opportunities, sharerepurchases pursuant to the Share Repurchase Program and capital expenditures; (ii) our ability to obtainadditional financing for working capital, capital expenditures, debt service requirements, acquisitions and generalcorporate purposes in the future may be limited; (iii) certain of the borrowings are at variable rates of interest,which will increase our vulnerability to increases in interest rates; (iv) we are at a competitive disadvantage toless leveraged competitors; (v) we may be unable to adjust rapidly to changing market conditions; (vi) the debtservice requirements of our other indebtedness could make it more difficult for us to satisfy our financialobligations; and (vii) we may be vulnerable in a downturn in general economic conditions or in our business andwe may be unable to carry out activities that are important to our growth.
Our ability to make scheduled payments of the principal of, or to pay interest on, or to refinanceindebtedness depends on and is subject to our financial and operating performance, which in turn is affected bygeneral and regional economic, financial, competitive, business and other factors beyond our control, includingthe availability of financing in the international banking and capital markets. If unable to generate sufficient cashflow to service our debt or to fund our other liquidity needs, we will need to restructure or refinance all or aportion of our debt, which could cause us to default on our obligations and impair our liquidity. Any refinancingof our indebtedness could be at higher interest rates and may require us to comply with more onerous covenantsthat could further restrict our business operations. We from time to time may increase the amount of ourindebtedness, modify the terms of our financing arrangements, issue dividends, make capital expenditures andtake other actions that may substantially increase our leverage.
Despite our significant leverage, we may be able to incur significant additional amounts of debt, whichcould further exacerbate the risks associated with our significant leverage.
28

Our operating results are subject to seasonal fluctuations.
We have historically experienced and expect to continue to experience seasonal fluctuations in our annualtheme park attendance and revenue, which are typically higher in our second and third quarters, partly becausesix of our theme parks are only open for a portion of the year. Approximately two-thirds of our attendance andrevenues are generated in the second and third quarters of the year and we typically incur a net loss in the firstand fourth quarters. In addition, school vacations and school start dates also cause fluctuations in our quarterlytheme park attendance and revenue.
Furthermore, the operating season at some of our theme parks, including Adventure Island, Aquatica SanDiego, Busch Gardens Williamsburg, Water Country USA and Sesame Place, is of limited duration. In addition,most of our expenses for maintenance and costs of adding new attractions at our seasonal theme parks areincurred when the operating season is over, which may increase the need for borrowing to fund such expensesduring such periods.
When conditions or events described in this section occur during the operating season, particularly duringthe second and third quarters, there is only a limited period of time during which the impact of those conditionsor events can be mitigated. Accordingly, such conditions or events may have a disproportionately adverse effecton our revenues and cash flow.
We may not realize the benefits of acquisitions or other strategic initiatives.
Our business strategy may include selective expansion, both domestically and internationally, throughacquisitions of assets or other strategic initiatives, such as joint ventures, that allow us to profitably expand ourbusiness and leverage our brands. The success of our acquisitions depends on effective integration of acquiredbusinesses and assets into our operations, which is subject to risks and uncertainties, including realization ofanticipated synergies and cost savings, the ability to retain and attract personnel, the diversion of management’sattention from other business concerns, and undisclosed or potential legal liabilities of an acquired businesses orassets. Additionally, any international transactions are subject to additional risks, including the impact ofeconomic fluctuations in economies outside of the United States, difficulties and costs of staffing and managingforeign operations due to distance, language and cultural differences, as well as political instability and lesserdegree of legal protection in certain jurisdictions, currency exchange fluctuations and potentially adverse taxconsequences of overseas operations.
Adverse litigation judgments or settlements resulting from legal proceedings in which we may be involved inthe normal course of our business could reduce our profits or limit our ability to operate our business.
We are subject to allegations, claims and legal actions arising in the ordinary course of our business, whichmay include claims by third parties, including guests who visit our theme parks, our employees or regulators. Weare currently subject to securities litigation. We discuss this case and other litigation to which we are subject to ingreater detail below under the caption “Item 3. Legal Proceedings” and Note 14 to our consolidated financialstatements. The outcome of many of these proceedings cannot be predicted. If any of these proceedings were tobe determined adversely to us, a judgment, a fine or a settlement involving a payment of a material sum ofmoney were to occur, or injunctive relief were issued against us, our business, financial condition and results ofoperations could be materially adversely affected.
Our insurance coverage may not be adequate to cover all possible losses that we could suffer and ourinsurance costs may increase.
We seek to maintain comprehensive insurance coverage at commercially reasonable rates. Although wemaintain various safety and loss prevention programs and carry property and casualty insurance to cover certainrisks, our insurance policies do not cover all types of losses and liabilities. There can be no assurance that our
29

insurance will be sufficient to cover the full extent of all losses or liabilities for which we are insured, and wecannot guarantee that we will be able to renew our current insurance policies on favorable terms, or at all. Inaddition, if we or other theme park operators sustain significant losses or make significant insurance claims, thenour ability to obtain future insurance coverage at commercially reasonable rates could be materially adverselyaffected.
We may be unable to purchase or contract with third-party manufacturers for our theme park rides andattractions.
We may be unable to purchase or contract with third parties to build high quality rides and attractions and tocontinue to service and maintain those rides and attractions at competitive or beneficial prices, or to provide thereplacement parts needed to maintain the operation of such rides. In addition, if our third-party suppliers’financial condition deteriorates or they go out of business, we may not be able to obtain the full benefit ofmanufacturer warranties or indemnities typically contained in our contracts or may need to incur greater costs forthe maintenance, repair, replacement or insurance of these assets.
Our operations and our ownership of property subject us to environmental requirements, and toenvironmental expenditures and liabilities.
We incur costs to comply with environmental requirements, such as those relating to water use, wastewaterand storm water management and disposal, air emissions control, hazardous materials management, solid andhazardous waste disposal, and the clean-up of properties affected by regulated materials.
We have been required and continue to investigate and clean-up hazardous or toxic substances or chemicalreleases, and other releases, from current or formerly owned or operated facilities. In addition, in the ordinarycourse of our business, we generate, use and dispose of large volumes of water, including saltwater, whichrequires us to comply with a number of federal, state and local regulations and to incur significant expenses.Failure to comply with such regulations could subject us to fines and penalties and/or require us to incuradditional expenses. Although we are not now classified as a large quantity generator of hazardous waste, we dostore and handle hazardous materials to operate and maintain our equipment and facilities and have done sohistorically.
We cannot assure you that we will not be required to incur substantial costs to comply with new orexpanded environmental requirements in the future or to investigate or clean-up new or newly identifiedenvironmental conditions, which could also impair our ability to use or transfer the affected properties and toobtain financing.
Cyber security risks and the failure to maintain the integrity of internal or guest data could result in damagesto our reputation and/or subject us to costs, fines or lawsuits.
We collect and retain large volumes of internal and guest data, including credit card numbers and otherpersonally identifiable information, for business purposes, including for transactional or target marketing andpromotional purposes, and our various information technology systems enter, process, summarize and reportsuch data. We also maintain personally identifiable information about our employees. The integrity andprotection of our guest, employee and Company data is critical to our business and our guests and employeeshave a high expectation that we will adequately protect their personal information. The regulatory environment,as well as the requirements imposed on us by the credit card industry, governing information, security andprivacy laws is increasingly demanding and continues to evolve. Maintaining compliance with applicablesecurity and privacy regulations may increase our operating costs and/or adversely impact our ability to marketour theme parks, products and services to our guests. We face various security threats, including cyber securityattacks on our data (including our vendors’ and customers’ data) and/or information technology infrastructure.Although we utilize various procedures and controls to monitor and mitigate these threats, there can be no
30

assurance that these procedures and controls will be sufficient to prevent penetrations or disruptions to oursystems. Furthermore, a penetrated or compromised data system or the intentional, inadvertent or negligentrelease or disclosure of data could result in theft, loss, fraudulent or unlawful use of guest, employee or Companydata which could harm our reputation or result in remedial and other costs, fines or lawsuits and requiresignificant management attention and resources to be spent. In addition, our insurance coverage andindemnification arrangements that we enter into, if any, may not be adequate to cover all the costs related tocyber security attacks or disruptions resulting from such events. To date, cyber security attacks directed at ushave not had a material impact on our financial results. Due to the evolving nature of security threats, however,the impact of any future incident cannot be predicted.
The suspension or termination of any of our business licenses may have a negative impact on our business.
We maintain a variety of business licenses issued by federal, state and local authorities that are renewableon a periodic basis. We cannot guarantee that we will be successful in renewing all of our licenses on a periodicbasis. The suspension, termination or expiration of one or more of these licenses could materially adverselyaffect our revenues and profits. In addition, any changes to the licensing requirements for any of our licensescould affect our ability to maintain the licenses.
We have a limited operating history as a stand-alone company, which makes it difficult to predict our futureprospects and financial performance.
Immediately following the 2009 Transactions, we began operating as a stand-alone company, and, as aresult, have a limited operating history as an independent company. Accordingly, you should consider our futureprospects in light of the risks and challenges encountered by a company with a limited operating history. Therecan be no assurance that we will be able to successfully meet the challenges, uncertainties, expenses anddifficulties encountered by us or that we will be successful in accomplishing our objectives. Our limitedoperating history as a stand-alone company makes it difficult to predict our future prospects and financialperformance.
Affiliates of Blackstone will continue to be able to significantly influence our decisions and their interests mayconflict with ours or yours in the future.
Affiliates of Blackstone beneficially own approximately 21.9% of our common stock. As a result,investment funds associated with or designated by affiliates of Blackstone will have the ability to elect membersof our Board of Directors and thereby continue to influence our policies and operations, including theappointment of management, future issuances of our common stock or other securities, the payment of dividends,if any, on our common stock, the incurrence or modification of debt by us, amendments to our amended andrestated certificate of incorporation and amended and restated bylaws and the entering into of extraordinarytransactions, and their interests may not in all cases be aligned with your interests. In addition, Blackstone mayhave an interest in pursuing acquisitions, divestitures and other transactions that, in its judgment, could enhanceits investment, even though such transactions might involve risks to you. For example, Blackstone may beinterested in making acquisitions that increase our indebtedness or in selling revenue-generating assets.Additionally, in certain circumstances, acquisitions of debt at a discount by purchasers that are related to a debtorcan give rise to cancellation of indebtedness income to such debtor for U.S. federal income tax purposes.
Blackstone is in the business of making investments in companies and may from time to time acquire andhold interests in businesses that compete directly or indirectly with us. For example, Blackstone owns a stake inMerlin Entertainments Group, which operates the Legoland theme parks, and certain other investments in theleisure and hospitality industries.
Our amended and restated certificate of incorporation provides that none of Blackstone, any of its affiliatesor any director who is not employed by us (including any non-employee director who serves as one of our
31

officers in both his director and officer capacities) or his or her affiliates will have any duty to refrain fromengaging, directly or indirectly, in the same business activities or similar business activities or lines of businessin which we operate. Blackstone also may pursue acquisition opportunities that may be complementary to ourbusiness, and, as a result, those acquisition opportunities may not be available to us. So long as affiliates ofBlackstone continue to own a significant amount of our combined voting power, even if such amount is less than50%, Blackstone will continue to be able to influence our decisions and, so long as Blackstone and its affiliatescollectively own at least 5% of all outstanding shares of our stock entitled to vote generally in the election ofdirectors, it will be able to appoint individuals to our Board of Directors under the stockholders agreement. Inaddition, Blackstone will be able to influence the outcome of all matters requiring stockholder approval andprevent a change of control of the Company or a change in the composition of our Board of Directors and couldpreclude any unsolicited acquisition of the Company. The concentration of ownership could deprive you of anopportunity to receive a premium for your shares of common stock as part of a sale of the Company andultimately might affect the market price of our common stock.
Risks Related to Ownership of Our Common Stock
Our stock price may change significantly, and you may not be able to resell shares of our common stock at orabove the price you paid or at all, and you could lose all or part of your investment as a result.
The trading price of our common stock has been, and is likely to continue to be, volatile. Since shares of ourcommon stock were sold in our IPO in April 2013 through December 31, 2014, our common stock price hasranged from $15.43 to $38.92. In addition to the risk factors discussed in this Annual Report on Form 10-K, thetrading price of our common stock may be adversely affected due to a number of factors, many of which arebeyond or control, including:
• results of operations that vary from the expectations of securities analysts and investors;
• results of operations that vary from those of our competitors;
• changes in expectations as to our future financial performance, including financial estimates andinvestment recommendations by securities analysts and investors;
• declines in the market prices of stocks generally, or those of amusement and theme parks companies;
• strategic actions by us or our competitors;
• announcements by us or our competitors of significant contracts, new products, acquisitions, jointmarketing relationships, joint ventures, other strategic relationships or capital commitments;
• changes in general economic or market conditions or trends in our industry or markets;
• changes in business or regulatory conditions;
• future sales of our common stock or other securities;
• repurchases of our common stock pursuant to the Share Repurchase Program;
• investor perceptions or the investment opportunity associated with our common stock relative to otherinvestment alternatives;
• the public’s response to press releases or other public announcements by us or third parties, includingour filings with the SEC;
• announcements relating to litigation;
• guidance, if any, that we provide to the public, any changes in this guidance or our failure to meet thisguidance;
• the development and sustainability of an active trading market for our stock;
• changes in accounting principles; and
32

• other events or factors, including those resulting from natural disasters, war, acts of terrorism orresponses to these events.
We cannot assure you that we will continue to pay dividends on our common stock, and our indebtednesscould limit our ability to continue to pay dividends on our common stock.
We intend to continue to pay cash dividends on our common stock, subject to our compliance withapplicable law, and depending on, among other things, our results of operations, financial condition, level ofindebtedness, capital requirements, contractual restrictions, restrictions in our debt agreements and in anypreferred stock, business prospects and other factors that our Board of Directors may deem relevant. However,the payment of any future dividends will be at the discretion of our Board of Directors and there can be noassurance that we will continue to pay dividends in the future. Based on the Company’s debt covenantcalculations as of September 30, 2014, the Company was limited for the remainder of calendar year 2014 in itsability to declare dividends in an amount consistent with its previously announced dividend policy. The amountavailable for dividend payments under the Company’s debt covenants resets on January 1, 2015, which causedour Board of Directors to shift the timing of the fourth quarter 2014 dividend from mid-December 2014 to earlyJanuary 2015.
We cannot guarantee that we will repurchase our common stock pursuant to our recently announced sharerepurchase program or that our share repurchase program will enhance long-term stockholder value. Sharerepurchases could also increase the volatility of the price of our common stock.
On August 12, 2014, our Board of Directors authorized a share repurchase program of up to $250.0 millionof our common stock beginning on January 1, 2015 (the “Share Repurchase Program”). On December 16, 2014,our Board of Directors approved an amendment to the Share Repurchase Program to change the start date of suchprogram from January 1, 2015 to December 17, 2014 and to authorize the repurchase of up to $15.0 million ofour common stock during the remainder of calendar year 2014. Under the Share Repurchase Program, we areauthorized to repurchase shares through open market purchases, privately-negotiated transactions or otherwise inaccordance with applicable federal securities laws, including through Rule 10b5-1 trading plans and under Rule10b-18 of the Exchange Act. Pursuant to the Share Repurchase Program, in the fourth quarter of 2014, werepurchased a total of 855,970 shares of our common stock for a total cost of approximately $15.0 million,leaving $235.0 million available for future repurchases.
Repurchases of our common stock pursuant to the Share Repurchase Program could affect our stock priceand increase its volatility. The existence of the Share Repurchase Program could cause our stock price to behigher than it would be in the absence of such a program and could potentially reduce the market liquidity for ourstock. There can be no assurance that any share repurchases will enhance stockholder value because the marketprice of our common stock may decline below the levels at which we repurchased shares of stock. Although theShare Repurchase Program is intended to enhance long-term stockholder value, there is no assurance that it willdo so and short-term stock price fluctuations could reduce such program’s effectiveness.
If securities analysts do not publish research or reports about our business or if they downgrade our stock orour sector, our stock price and trading volume could decline.
The trading market for our common stock relies in part on the research and reports that industry or financialanalysts publish about us or our business. We do not control these analysts. Furthermore, if one or more of theanalysts who do cover us downgrade our stock or our industry, or the stock of any of our competitors, or publishinaccurate or unfavorable research about our business, the price of our stock could decline. If one or more ofthese analysts ceases coverage of the Company or fail to publish reports on us regularly, we could lose visibilityin the market, which in turn could cause our stock price or trading volume to decline.
33

Future sales, or the perception of future sales, by us or our existing stockholders in the public market couldcause the market price for our common stock to decline.
The sale of a substantial number of shares of our common stock in the public market, or the perception thatsuch sales could occur, could harm the prevailing market price of shares of our common stock. These sales, orthe possibility that these sales may occur, also might make it more difficult for us to sell equity securities in thefuture at a time and at a price that we deem appropriate.
Shares held by the Partnerships and certain of our directors, officers and employees are eligible for resale,subject to volume, manner of sale and other limitations under Rule 144. In addition, pursuant to a registrationrights agreement entered into in connection with the 2009 Transactions, we granted the Partnerships the right,subject to certain conditions, to require us to register the sale of their shares of our common stock under theSecurities Act.
As restrictions on resale end or if the Partnerships exercise their registration rights, the market price of ourshares of common stock could drop significantly if the holders of these shares sell them or are perceived by themarket as intending to sell them. These factors could also make it more difficult for us to raise additional fundsthrough future offerings of our shares of common stock or other securities.
In addition, the shares of our common stock reserved for future issuance under the Omnibus Incentive Planwill become eligible for sale in the public market once those shares are issued, subject to provisions relating tovarious vesting agreements, lock-up agreements and Rule 144, as applicable. A total of 15,000,000 shares ofcommon stock was reserved for issuance under the Omnibus Incentive Plan, of which 14,408,339 shares ofcommon stock remain available for future issuance at February 23, 2015. In the future, we may also issue oursecurities in connection with investments or acquisitions. The amount of shares of our common stock issued inconnection with an investment or acquisition could constitute a material portion of our then-outstanding shares ofour common stock. Any issuance of additional securities in connection with investments or acquisitions mayresult in additional dilution to you.
Our restructuring program may not achieve its intended results.
We recently embarked on a restructuring program in an effort to centralize certain operations and reduceduplication of functions to increase efficiencies as part our Company-wide initiative designed to deliverapproximately $50.0 million of annual cost savings in comparison to our current cost structure by the end of2015. Achieving our anticipated cost savings goal is subject to a number of uncertainties, including additionalunanticipated costs, expenses, liabilities or necessary competitive responses. There can be no assurance regardingwhen or the extent to which we will be able to realize our goals.
Anti-takeover provisions in our organizational documents could delay or prevent a change of control.
Certain provisions of our amended and restated certificate of incorporation and amended and restatedbylaws may have an anti-takeover effect and may delay, defer or prevent a merger, acquisition, tender offer,takeover attempt or other change of control transaction that a stockholder might consider in its best interest,including those attempts that might result in a premium over the market price for the shares held by ourstockholders.
These provisions provide for, among other things:
• a classified Board of Directors with staggered three-year terms;
• the ability of our Board of Directors to issue one or more series of preferred stock;
• advance notice for nominations of directors by stockholders and for stockholders to include matters tobe considered at our annual meetings;
34

• certain limitations on convening special stockholder meetings;
• the removal of directors only for cause and only upon the affirmative vote of the holders of at least66 2⁄3% in voting power of all the then-outstanding shares of stock of the Company entitled to votethereon, voting together as a single class; and
• that certain provisions may be amended only by the affirmative vote of the holders of at least 66 2⁄3%in voting power of all the then-outstanding shares of stock of the Company entitled to vote thereon,voting together as a single class.
These anti-takeover provisions could make it more difficult for a third party to acquire us, even if the third-party’s offer may be considered beneficial by many of our stockholders. As a result, our stockholders may belimited in their ability to obtain a premium for their shares.
The requirements of being a public entity and sustaining our growth may strain our resources.
As a result of becoming a public company, we are subject to the reporting requirements of the Exchange Actand requirements pursuant to Section 404 of the Sarbanes-Oxley Act of 2002. These requirements may place astrain on our systems and resources. The Exchange Act requires that we file annual, quarterly and current reportswith respect to our business and financial condition. The Sarbanes-Oxley Act requires that we maintain effectivedisclosure controls and procedures and internal controls over financial reporting. In order to maintain andimprove the effectiveness of our disclosure controls and procedures and internal controls over financial reportingas required by the Exchange Act, significant resources and management oversight are required. We haveimplemented additional procedures and processes for the purpose of addressing the standards and requirementsapplicable to public companies. In addition, sustaining our growth also requires us to commit additionalmanagement, operational, and financial resources to identify new professionals to join the Company and tomaintain appropriate operational and financial systems to adequately support expansion.
Any failure to develop or maintain effective controls or any difficulties encountered in our implementationof our internal controls over financial reporting could result in material misstatements that are not prevented ordetected on a timely basis. Ineffective internal controls could cause investors to lose confidence in us and thereliability of our financial statements and cause a decline in the price of our common stock. If we identify anysignificant deficiencies or material weaknesses in the future, or encounter problems or delays in theimplementation of internal controls over financial reporting, we may be unable to conclude that our internalcontrols over financial reporting are effective.
Non-U.S. holders who own or owned more than a certain ownership threshold may be subject to United Statesfederal income tax on gains realized on the disposition of our common stock.
We believe that we are currently a U.S. real property holding corporation for U.S. federal income taxpurposes. So long as our common stock continues to be regularly traded on an established securities market, anon-U.S. stockholder who holds or held (at any time during the shorter of the five year period preceding the dateof disposition or the holder’s holding period) more than 5% of our common stock will be subject to United Statesfederal income tax on the disposition of our common stock. Non-U.S. holders should consult their own taxadvisors concerning the consequences of disposing of shares of our common stock.
Item 1B. Unresolved Staff Comments
None.
35

Item 2. Properties
The following table summarizes our principal properties, which includes approximately 400 acres of landavailable for future development.
Location Size Use
Orlando, FL 76,360 sq ft Leased Office Space (corporate headquarters)Orlando, FL 9,636 sq ft Leased Office Space (call center)San Diego, CA 190 acres(1) Leased LandChula Vista, CA 66 acres Owned Water ParkOrlando, FL 279 acres Owned Theme ParkOrlando, FL 58 acres Owned All-inclusive Interactive ParkOrlando, FL 81 acres Owned Water ParkTampa, FL 56 acres Owned Water ParkTampa, FL 306 acres Owned Theme ParkDade City, FL 109 acres Owned Breeding and Holding FacilityLanghorne, PA 55 acres Owned Theme ParkSan Antonio, TX 415 acres Owned Theme ParkWilliamsburg, VA 222 acres Owned Water ParkWilliamsburg, VA 422 acres Owned Theme ParkWilliamsburg, VA 5 acres Owned Warehouse SpaceWilliamsburg, VA 5 acres Owned Seasonal Worker Lodging
(1) Includes approximately 17 acres of water in Mission Bay Park, California.
We believe that our properties are in good operating condition and adequately serve our current businessoperations.
Lease Agreement with City of San Diego
Our subsidiary, Sea World LLC (f/k/a Sea World Inc.), leases approximately 190 acres from the City of SanDiego, including approximately 17 acres of water in Mission Bay Park, California (the “Premises”). The currentlease term commenced on July 1, 1998 and extends for 50 years or the maximum period allowed by law. Underthe lease, the Premises must be used as a marine park facility and related uses. In addition, we may not operateanother marine park facility within a radius of 560 miles from the City of San Diego.
The annual rent under the lease is calculated on the basis of a specified percentage of Sea World LLC’sgross income from the Premises, or the minimum yearly rent, whichever is greater. The minimum yearly rent isadjusted every three years to an amount equal to 80% of the average accounting year rent actually paid for thethree previous years. The current minimum yearly rent is approximately $10.4 million, which is subject toadjustment on January 1, 2017.
Item 3. Legal Proceedings
We are subject to various allegations, claims and legal actions arising in the ordinary course of business.While it is impossible to determine with certainty the ultimate outcome of any of these proceedings, lawsuits andclaims, management believes that adequate provisions have been made and insurance secured for all currentlypending proceedings so that the ultimate outcomes will not have a material adverse effect on our financialposition.
On September 9, 2014, a purported stockholder class action lawsuit consisting of purchasers of theCompany’s common stock during the periods between April 18, 2013 to August 13, 2014, captioned Baker v.SeaWorld Entertainment, Inc., et al., Case No. 14-CV-02129-MMA (KSC), was filed in the U.S. District Court
36

for the Southern District of California (the “Court”) against the Company, the Chairman of our Board ofDirectors, certain of our executive officers and Blackstone. The complaint alleges that the prospectus andregistration statements filed contained materially false and misleading information in violation of the federalsecurities laws and seeks unspecified compensatory damages and other relief. On December 10, 2014, the Courtentered an Order Granting Motion for Appointment as Lead Plaintiff and Selection of Counsel, appointingPensionskassen For Børne- Og Ungdomspædagoger and Arkansas Public Employees Retirement System as LeadPlaintiffs. On December 29, 2014, the Court entered an Order Granting Joint Motion for Scheduling Ordersetting Lead Plaintiffs’ time to file any amended complaint on or before February 27, 2015. The Companybelieves that the class action lawsuit is without merit and intends to defend the lawsuit vigorously; however,there can be no assurance regarding the ultimate outcome of this lawsuit.
On December 8, 2014, a putative derivative lawsuit captioned Kistenmacher v. Atchison, et al., Civil ActionNo. 10437, was filed in the Court of Chancery of the State of Delaware against, among others, the Chairman ofour Board of Directors, certain of our executive officers, directors and shareholders, and Blackstone. TheCompany is a “Nominal Defendant” in the lawsuit. The complaint alleges, among other things, that thedefendants breached their fiduciary duties and were unjustly enriched by (i) including materially false andmisleading information in the prospectus and registration statements; and (ii) causing the Company to repurchasecertain shares of its common stock from certain shareholders at an alleged artificially inflated price. OnFebruary 25, 2015, the Court of Chancery granted the parties’ joint stipulation setting forth deadlines for thefiling of an amended complaint, defendants’ response, and a briefing schedule in the event defendants file amotion to dismiss that trails behind the due dates in the class action lawsuit by thirty days. We do not maintainany direct exposure to loss in connection with this shareholder derivative lawsuit. The lawsuit does not assert anyclaims against us. Our status as a “Nominal Defendant” in the action reflects the fact that the lawsuit ismaintained by the named plaintiff on behalf of the Company and that the plaintiff seeks damages on our behalf.
Item 4. Mine Safety Disclosures
Not applicable.
37

PART II.
Item 5. Market for the Registrant’s Common Equity, Related Stockholder Matters and IssuerPurchases of Equity Securities
Market Information
Shares of our common stock began trading on April 19, 2013 and are quoted on the New York StockExchange (“NYSE”) under the ticker symbol “SEAS.” Prior to that date there was no public market for ourcommon stock. As of February 23, 2015, there were approximately 164 holders of record of our outstandingcommon stock. This does not include persons who hold our common stock in nominee or “street name” accountsthrough brokers or banks. The following table sets forth the high and low closing sales prices per share of ourcommon stock during the periods indicated and the amount of cash dividends declared per share:
Calendar Period High Low
CashDividendDeclaredPer Share
2014Quarter ended March 31, 2014 $35.11 $27.79 $0.20Quarter ended June 30, 2014 $31.75 $28.00 $0.21Quarter ended September 30, 2014 $29.59 $18.00 $0.21Quarter ended December 31, 2014 $19.25 $15.43 (a)
2013Quarter ended June 30, 2013 (from April 19, 2013) $38.88 $32.32 $0.20Quarter ended September 30, 2013 $38.92 $28.65 $0.20Quarter ended December 31, 2013 $32.82 $27.66 $0.20
(a) Cash dividend of $0.21 per share was declared on January 5, 2015 to all common stockholders of record atthe close of business on January 13, 2015, which was paid on January 22, 2015.
Dividends
Our Board adopted a policy to pay, subject to legally available funds, a regular quarterly dividend. Wedeclared cash dividends of $0.62 per share in 2014 and $0.60 per share in 2013. Our ability to declare dividendsand make other restricted payments is limited by covenants in our senior secured credit facilities pursuant to acredit agreement dated as of December 1, 2009 (the “Senior Secured Credit Facilities”) and the indenturegoverning the senior notes entered into on December 1, 2009 (the “Senior Notes”).
Based on our debt covenant calculations through the third quarter of 2014, our restricted payments capacitywas limited to an aggregate amount of up to approximately $15.1 million in the fourth quarter of 2014 to declaredividends or make other restricted payments. As a result, the Board elected to postpone the declaration of theCompany’s fourth quarter 2014 dividend to January 2015 and instead authorized the repurchase of up to$15.0 million of our common stock in December 2014. On January 5, 2015, the Board declared a cash dividendof $0.21 per share to all common stockholders of record at the close of business on January 13, 2015, which waspaid on January 22, 2015. The fiscal amount available for dividend declarations, share repurchases and otherrestricted payments under the covenant restrictions in the debt agreements adjusts at the beginning of eachquarter. See “Management’s Discussion and Analysis of Financial Condition and Results of Operations” for adescription of the restrictions on our ability to pay dividends and Note 11–Long-term Debt in the notes to theconsolidated financial statements included elsewhere in this Annual Report on Form 10-K.
We intend to continue to pay cash dividends on our common stock, subject to our compliance withapplicable law, and depending on, among other things, our results of operations, financial condition, level ofindebtedness, capital requirements, contractual restrictions, restrictions in our debt agreements and in any
38

preferred stock, business prospects and other factors that our Board may deem relevant. However, the payment ofany future dividends will be at the discretion of our Board and our Board may, at any time, modify or revoke ourdividend policy on our common stock. For tax purposes, a portion of the dividends paid in 2014 will be treated asa return of capital to stockholders and we expect a portion of the dividends paid in 2015 will also be treated as areturn of capital to stockholders.
Our ability to pay dividends depends on our receipt of cash dividends from our operating subsidiaries, whichmay further restrict our ability to pay dividends as a result of the laws of their jurisdiction of organization,agreements of our subsidiaries or covenants under any existing and future outstanding indebtedness we or oursubsidiaries incur. In particular, the ability of our subsidiaries to distribute cash to SeaWorld Entertainment, Inc.to pay dividends is limited by covenants in the Senior Secured Credit Facilities and the indenture governing theSenior Notes as discussed above.
Securities Authorized for Issuance Under Equity Compensation Plans
The information called for by this item is incorporated by reference from our definitive proxy statementrelating to our 2015 Annual Meeting of Stockholders, which we will file with the SEC within 120 days after ourDecember 31, 2014 fiscal year end.
39

Stock Price Performance
This performance graph shall not be deemed “filed” for purposes of Section 18 of the Exchange Act, orincorporated by reference into any filing of SeaWorld under the Securities Act or the Exchange Act, except asshall be expressly set forth by specific reference in such filing.
The following graph shows a comparison from April 19, 2013 (the date our common stock commencedtrading on the New York Stock Exchange) through December 31, 2014 of the cumulative total return for ourcommon stock, The Standard & Poor’s (“S&P”) 500 Stock Index, The S&P Midcap 400 Index and The S&PEntertainment Movies & Entertainment Index. The graph assumes that $100 was invested in the Company’scommon stock and in each index at the market close on April 19, 2013 and assumes that all dividends werereinvested. The stock price performance of the following graph is not necessarily indicative of future stock priceperformance.
Comparison of Cumulative Total ReturnSeaWorld Entertainment, Inc.
$160.00
$140.00
$120.00
$100.00
$80.00
$60.00
$40.00
$20.00
$0.004/19/2013 6/30/2013 9/30/2013 12/31/2013 3/31/2014 6/30/2014 9/30/2014 12/31/2014
S&P 500 Index - Total Returns S&P Midcap 400 Index S&P 400 Movies & Entertainment Index
4/19/2013 6/30/2013 9/30/2013 12/31/2013 3/31/2014 6/30/2014 9/30/2014 12/31/2014
SeaWorld Entertainment, Inc. $100.00 $130.68 $111.02 $108.53 $114.75 $108.29 $ 74.29 $ 69.15S&P 500 Index - Total Returns $100.00 $103.74 $109.18 $120.66 $122.84 $129.27 $130.73 $137.17S&P Midcap 400 Index $100.00 $103.87 $111.71 $121.01 $124.69 $130.09 $124.91 $132.84S&P 400 Movies & Entertainment Index $100.00 $107.64 $121.82 $137.70 $113.28 $124.70 $125.85 $127.70
Note: Data complete through last fiscal year. Prepared by Zacks Investment Research, Inc. Used with permission. All rights reserved.Copyright 1980-2015.
Index Data: Copyright Standard and Poor’s, Inc. Used with permission. All rights reserved.
Unregistered Sales of Equity Securities
There were no unregistered sales of equity securities which have not been previously disclosed in aQuarterly Report on Form 10-Q or a current report on Form 8-K during the year ended December 31, 2014.
40
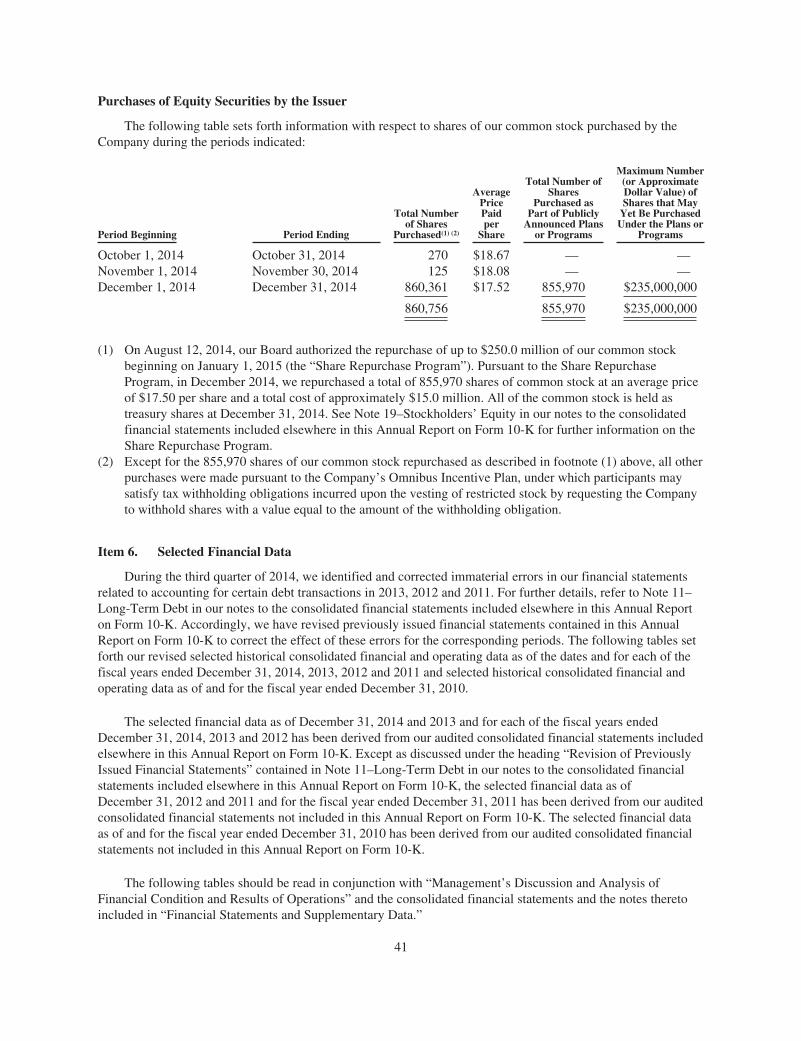
Purchases of Equity Securities by the Issuer
The following table sets forth information with respect to shares of our common stock purchased by theCompany during the periods indicated:
Period Beginning Period Ending
Total Numberof Shares
Purchased(1) (2)
AveragePricePaidper
Share
Total Number ofShares
Purchased asPart of Publicly
Announced Plansor Programs
Maximum Number(or ApproximateDollar Value) ofShares that May
Yet Be PurchasedUnder the Plans or
Programs
October 1, 2014 October 31, 2014 270 $18.67 — —November 1, 2014 November 30, 2014 125 $18.08 — —December 1, 2014 December 31, 2014 860,361 $17.52 855,970 $235,000,000
860,756 855,970 $235,000,000
(1) On August 12, 2014, our Board authorized the repurchase of up to $250.0 million of our common stockbeginning on January 1, 2015 (the “Share Repurchase Program”). Pursuant to the Share RepurchaseProgram, in December 2014, we repurchased a total of 855,970 shares of common stock at an average priceof $17.50 per share and a total cost of approximately $15.0 million. All of the common stock is held astreasury shares at December 31, 2014. See Note 19–Stockholders’ Equity in our notes to the consolidatedfinancial statements included elsewhere in this Annual Report on Form 10-K for further information on theShare Repurchase Program.
(2) Except for the 855,970 shares of our common stock repurchased as described in footnote (1) above, all otherpurchases were made pursuant to the Company’s Omnibus Incentive Plan, under which participants maysatisfy tax withholding obligations incurred upon the vesting of restricted stock by requesting the Companyto withhold shares with a value equal to the amount of the withholding obligation.
Item 6. Selected Financial Data
During the third quarter of 2014, we identified and corrected immaterial errors in our financial statementsrelated to accounting for certain debt transactions in 2013, 2012 and 2011. For further details, refer to Note 11–Long-Term Debt in our notes to the consolidated financial statements included elsewhere in this Annual Reporton Form 10-K. Accordingly, we have revised previously issued financial statements contained in this AnnualReport on Form 10-K to correct the effect of these errors for the corresponding periods. The following tables setforth our revised selected historical consolidated financial and operating data as of the dates and for each of thefiscal years ended December 31, 2014, 2013, 2012 and 2011 and selected historical consolidated financial andoperating data as of and for the fiscal year ended December 31, 2010.
The selected financial data as of December 31, 2014 and 2013 and for each of the fiscal years endedDecember 31, 2014, 2013 and 2012 has been derived from our audited consolidated financial statements includedelsewhere in this Annual Report on Form 10-K. Except as discussed under the heading “Revision of PreviouslyIssued Financial Statements” contained in Note 11–Long-Term Debt in our notes to the consolidated financialstatements included elsewhere in this Annual Report on Form 10-K, the selected financial data as ofDecember 31, 2012 and 2011 and for the fiscal year ended December 31, 2011 has been derived from our auditedconsolidated financial statements not included in this Annual Report on Form 10-K. The selected financial dataas of and for the fiscal year ended December 31, 2010 has been derived from our audited consolidated financialstatements not included in this Annual Report on Form 10-K.
The following tables should be read in conjunction with “Management’s Discussion and Analysis ofFinancial Condition and Results of Operations” and the consolidated financial statements and the notes theretoincluded in “Financial Statements and Supplementary Data.”
41

SEAWORLD ENTERTAINMENT, INC. AND SUBSIDIARIESSELECTED HISTORICAL CONSOLIDATED FINANCIAL DATA
Year Ended December 31,
2014 2013 2012 2011 2010
Statement of Comprehensive Income Data: (In thousands, except per share and per capita amounts)
Net revenues:Admissions $ 859,426 $ 921,016 $ 884,407 $ 824,937 $ 730,368Food, merchandise and other 518,386 539,234 539,345 505,837 465,735
Total revenues 1,377,812 1,460,250 1,423,752 1,330,774 1,196,103
Costs and expenses:Cost of food, merchandise and other
revenues 109,024 114,192 118,559 112,498 97,871Operating expenses (exclusive of
depreciation and amortization shownseparately below) 727,659 743,322 730,582 692,325 673,829
Selling, general and administrative 189,369 187,298 184,920 172,368 159,506Restructuring and other related costs 11,567 — — — —Separation costs 2,574 — — — —Secondary offering costs 747 1,407 — — —Termination of advisory agreement — 50,072 — — —Depreciation and amortization 176,275 166,086 166,975 213,592 207,156
Total costs and expenses 1,217,215 1,262,377 1,201,036 1,190,783 1,138,362
Operating income 160,597 197,873 222,716 139,991 57,741Other (income) expense, net (198) (241) (1,563) 1,679 (1,937)Interest expense 81,543 90,622 110,565 97,741 134,383Loss on early extinguishment of debt
and write-off of discounts anddeferred financing costs 461 29,858 2,053 15,129 —
Income (loss) before income taxes 78,791 77,634 111,661 25,442 (74,705)Provision for (benefit from) income
taxes 28,872 25,714 37,440 10,653 (29,241)
Net income (loss) $ 49,919 $ 51,920 $ 74,221 $ 14,789 $ (45,464)
Per share data (1):Net income (loss) per share, basic $ 0.57 $ 0.59 $ 0.90 $ 0.18 $ (0.56)
Net income (loss) per share, diluted $ 0.57 $ 0.59 $ 0.89 $ 0.18 $ (0.56)
Cash dividends declared per share $ 0.62 $ 0.60 $ 6.07 $ 1.34 $ —
Weighted average commons sharesoutstanding:
Basic 87,183 87,537 82,480 81,392 80,800
Diluted 87,480 88,152 83,552 82,024 80,800
Other financial and operating data:Capital expenditures $ 154,641 $ 166,258 $ 191,745 $ 225,316 $ 120,196Attendance 22,399 23,391 24,391 23,631 22,433Total revenue per capita(2) $ 61.51 $ 62.43 $ 58.37 $ 56.31 $ 53.32
42

As of December 31,
2014 2013 2012 2011 2010
Consolidated Balance Sheet Data: (In thousands)
Cash and cash equivalents $ 43,906 $ 116,841 $ 45,675 $ 66,663 $ 123,697Total assets $2,442,474 $2,577,410 $2,516,856 $2,546,867 $2,621,281Total long-term debt $1,603,453 $1,646,581 $1,827,324 $1,421,983 $1,410,529Total equity $ 579,535 $ 648,027 $ 442,302 $ 868,143 $ 949,795
(1) All share and per share amounts reflect an eight-for-one stock split of our common stock effected onApril 8, 2013.
(2) Calculated as total revenue divided by total attendance.
Item 7. Management’s Discussion and Analysis of Financial Condition and Results of Operations
The following discussion contains management’s discussion and analysis of our financial condition andresults of operations and should be read together with “Selected Financial Data” and the historical consolidatedfinancial statements and the notes thereto included in “Financial Statements and Supplementary Data”. Thisdiscussion contains forward-looking statements that reflect our plans, estimates and beliefs and involvenumerous risks and uncertainties, including but not limited to those described in the “Risk Factors” section ofthis Annual Report on Form 10-K. Actual results may differ materially from those contained in any forward-looking statements. You should carefully read “Special Note Regarding Forward-Looking Statements” and “RiskFactors.”
Business Overview
We are a leading theme park and entertainment company delivering personal, interactive and educationalexperiences that blend imagination with nature and enable our customers to celebrate, connect with and care forthe natural world we share. We own or license a portfolio of globally recognized brands, including SeaWorld,Shamu and Busch Gardens. Over our more than 50 year history, we have built a diversified portfolio of 11destination and regional theme parks that are grouped in key markets across the United States, many of whichshowcase our one-of-a-kind zoological collection of approximately 89,000 marine and terrestrial animals. Ourtheme parks feature a diverse array of rides, shows and other attractions with broad demographic appeal whichdeliver memorable experiences and a strong value proposition for our guests. During the year endedDecember 31, 2014, we hosted approximately 22.4 million guests, including approximately 3.6 millioninternational guests. In the year ended December 31, 2014, we had total revenues of $1.38 billion and net incomeof $49.9 million.
Revision of Prior Period Financial Statements
During the third quarter of 2014, we identified and corrected immaterial errors in our financial statementsrelated to accounting for certain debt transactions in 2013, 2012 and 2011. For further details, refer to Note 11–Long-Term Debt in our notes to the consolidated financial statements. Accordingly, we have revised previouslyissued financial statements contained in this Annual Report on Form 10-K to correct the effect of these errors forthe corresponding periods. Management’s discussion and analysis included herein is based on the revisedfinancial results for the years ended December 31, 2013 and 2012.
Key Business Metrics Evaluated by Management
Attendance
We define attendance as the number of guest visits to our theme parks. Increased attendance drivesincreased admissions revenue to our theme parks as well as total in-park spending. The level of attendance at our
43

theme parks is a function of many factors, including the opening of new attractions and shows, weather, globaland regional economic conditions, competitive offerings and overall consumer confidence in the economy.
Total Revenue Per Capita
Total revenue per capita, defined as total revenue divided by total attendance, consists of admission percapita and in-park per capita spending:
• Admission Per Capita. We calculate admission per capita for any period as total admissions revenuedivided by total attendance. Theme park admissions accounted for approximately 62% of our totalrevenue for the year ended December 31, 2014. Over the same time period, we reported $38.37 inadmission per capita, representing a decrease of 2.6% from $39.37 for the year ended December 31,2013. Admission per capita is driven by ticket pricing, the admissions product mix and the parkattendance mix. The admissions product mix is defined as the mix of tickets purchased such as singleday, multi-day or annual passes and the park attendance mix is defined as the mix of attendance bytheme parks visited.
• In-Park Per Capita Spending. We calculate in-park per capita spending for any period as total food,merchandise and other revenue divided by total attendance. For the year ended December 31, 2014,food, merchandise and other revenue accounted for approximately 38% of our total revenue. Over thesame time period, we reported $23.14 of in-park per capita spending, representing a slight increase of0.4% from $23.05 for the year ended December 31, 2013. In-park per capita spending is driven bypricing changes, penetration levels (percentage of guests purchasing), new product offerings, the mixof guests and the mix of in-park spending.
Trends Affecting Our Results of Operations
We have experienced negative attendance trends in 2014 which we believe resulted from a combination offactors affecting our business and our destination parks in particular. We believe negative media attention inCalifornia and a challenging competitive environment in Florida are the key factors which contributed to thedecline in attendance and resulting decrease in admissions revenue. To address our near term challenges, we areadjusting our attraction and marketing plans while also executing a cost savings plan which is expected to deliverapproximately $50.0 million of annual cost savings by the end of 2015, as compared to our cost structure in fiscal2014. We believe that these cost savings will be largely offset by annual inflationary pressures and increasedspending on marketing and advertising initiatives. As part of this cost savings plan, in December 2014, weimplemented a restructuring program (the “Restructuring Program”) which involved the elimination ofapproximately 300 positions in an effort to centralize certain operations and reduce duplication of functions toincrease efficiencies.
Our ability to attract and retain customers depends, in part, upon the external perceptions of our brands andreputation. Adverse publicity concerning our business generally could harm our brands, reputation and results ofoperations. The considerable expansion in the use of social media over recent years has amplified and is expectedto continue to amplify the impact of any negative publicity. Recently, our business and SeaWorld-branded parks,in particular, have been the target of negative media attention, particularly in the state of California wherelegislation was proposed in March 2014 seeking to restrict our ability to display certain animals in that state. Webelieve we are experiencing demand pressures, particularly in California, partly due to such media attention. Wehave introduced and are considering a number of initiatives to address public perceptions and raise and protectbrand awareness.
Our success also depends to a significant extent on discretionary consumer spending, which is heavilyinfluenced by general economic conditions and the availability of discretionary income. In the past, severeeconomic downturns, coupled with high volatility and uncertainty as to the future global economic landscape,have had and continues to have an adverse effect on consumers’ discretionary income and consumer confidence.
44

Difficult economic conditions and recessionary periods may adversely impact attendance figures, the frequencywith which guests choose to visit our theme parks and guest spending patterns at our theme parks. Historically,our revenue and attendance growth have been highly correlated with domestic economic growth, as reflected inthe gross domestic product (“GDP”) and the overall level of growth in domestic consumer spending. Forexample, in 2009 and 2010, we experienced a decline in attendance as a result of the global economic crisis,which, in turn, adversely affected our revenue and profitability. We expect that forecasted moderateimprovements in GDP and growth in domestic consumer spending will have a positive impact on our futureperformance.
Both attendance and total revenue per capita at our theme parks are key drivers of our revenue andprofitability, and reductions in either can materially adversely affect our business, financial condition, results ofoperations and cash flows.
Seasonality
The theme park industry is seasonal in nature. Based upon historical results, we generate the highestrevenues in the second and third quarters of each year, in part because six of our theme parks are only open for aportion of the year. Approximately two-thirds of our attendance and revenues are generated in the second andthird quarters of the year and we typically incur a net loss in the first and fourth quarters. The mix of revenues byquarter is relatively constant, but revenues can shift between the first and second quarters due to the timing ofEaster or between the first and fourth quarters due to the timing of Christmas and New Year’s. Even for our fivetheme parks open year-round, attendance patterns have significant seasonality, driven by holidays, schoolvacations and weather conditions. One of our goals in managing our business is to continue to generate cash flowthroughout the year and minimize the effects of seasonality. In recent years, we have begun to encourageattendance during non-peak times by offering a variety of seasonal programs and events, such as shows for kids,special concert series, and Halloween and Christmas events. In addition, during seasonally slow times, operatingcosts are controlled by reducing operating hours and show schedules. Employment levels required for peakoperations are met largely through part-time and seasonal hiring.
Principal Factors Affecting Our Results of Operations
Revenues
Our revenues are driven primarily by attendance in our theme parks and the level of per capita spending foradmission to the theme parks and per capita spending inside the theme parks for culinary, merchandise and otherin-park experiences. The level of attendance in our theme parks is a function of many factors, including theopening of new attractions and shows, weather, global and regional economic conditions, competitive offeringsand consumer confidence. Admission per capita is driven by ticket pricing, the mix of ticket type purchased(such as single day, multi-day and annual pass) and the mix of attendance by theme parks visited. In-park percapita spending is driven by pricing changes, penetration levels (percentage of guests purchasing), new productofferings, the mix of guests and the mix of in-park spending. For other factors affecting our revenues, see “RiskFactors—Risks Related to Our Business and Our Industry.”
In addition to the theme parks, we are also involved in entertainment, media and consumer productbusinesses that leverage our intellectual property. While these businesses currently do not represent a materialpercentage of our revenue, they are important strategic drivers in terms of consumer awareness and brandbuilding. We aim to expand these businesses into a greater source of revenue in the future.
Costs and Expenses
The principal costs of our operations are employee salaries, employee benefits, advertising, maintenance,animal care, utilities and insurance. Factors that affect our costs and expenses include commodity prices, costs
45

for construction, repairs and maintenance, other inflationary pressures and attendance levels. A large portion ofour expenses is relatively fixed because the costs for full-time employees, maintenance, animal care, utilities,advertising and insurance do not vary significantly with attendance. For factors affecting our costs and expenses,see “Risk Factors—Risks Related to Our Business and Our Industry.”
For details regarding the costs related to our Restructuring Program, refer to Note 4–Restructuring Programand Separation Costs in our notes to the consolidated financial statements.
We barter theme park admission products for advertising and various other products and services. The fairvalue of the products or services is recognized into admissions revenue and related expenses at the time of theexchange and approximates the estimated fair value of the goods or services received or provided, whichever ismore readily determinable.
Results of Operations
The following discussion provides an analysis of our consolidated financial data for the years endedDecember 31, 2014, 2013 and 2012. This data should be read in conjunction with our consolidated financialstatements and the notes thereto included in “Financial Statements and Supplementary Data.”
46

Comparison of the Years Ended December 31, 2014 and 2013
The following table presents key operating and financial information for the years ended December 31,2014 and 2013:
For the Year EndedDecember 31,
2014 2013
Statement of Comprehensive Income Data:(In thousands, except per
capita data)
Net revenues:Admissions $ 859,426 $ 921,016Food, merchandise and other 518,386 539,234
Total revenues 1,377,812 1,460,250
Costs and expenses:Cost of food, merchandise and other revenues 109,024 114,192Operating expenses (exclusive of depreciation
and amortization shown separately below) 727,659 743,322Selling, general and administrative 189,369 187,298Restructuring and other related costs 11,567 —Separation costs 2,574 —Secondary offering costs 747 1,407Termination of advisory agreement — 50,072Depreciation and amortization 176,275 166,086
Total costs and expenses 1,217,215 1,262,377
Operating income 160,597 197,873Other income, net (198) (241)Interest expense 81,543 90,622Loss on early extinguishment of debt and write-
off of discounts and deferred financing costs 461 29,858
Income before income taxes 78,791 77,634Provision for income taxes 28,872 25,714
Net income $ 49,919 $ 51,920
Other data:Attendance 22,399 23,391
Total revenue per capita $ 61.51 $ 62.43
Admissions revenue. Admissions revenue for the year ended December 31, 2014 decreased $61.6 million(6.7%) to $859.4 million as compared to $921.0 million for the year ended December 31, 2013. The decrease inrevenue was a result of a 4.2% decline in attendance combined with a decrease of 2.6% in admission per capitafrom $39.37 in 2013 to $38.37 in 2014. Attendance for 2014 declined as the negative trends we experienced inthe second quarter of 2014 primarily at our destination parks in California and Florida extended into our thirdquarter, with attendance for the third quarter of 2014 down 5.2% compared to the third quarter of 2013. Thesetrends showed some improvement in the fourth quarter of 2014 with attendance down 2.2% compared to thefourth quarter of 2013, due in part to the success of our seasonal events. We believe the overall decline inattendance for 2014 results from a combination of factors, including negative media attention in California, alongwith a challenging competitive environment, particularly in Florida. Part of the challenges in Florida relate tosignificant new attraction offerings at competitor destination parks and a delay in the opening of one of our newrides at our Busch Gardens Tampa park. The prior year also included the impact from the opening of Antarctica:Empire of the Penguin® at our SeaWorld Orlando park which helped drive record revenue for 2013. Attendance
47

for 2014 was also impacted, to a lesser extent, by adverse weather during the first quarter in the Florida andTexas markets. The decrease in admission per capita was primarily a result of an unfavorable change in the parkattendance mix along with an increase in promotional offerings.
Food, merchandise and other revenue. Food, merchandise and other revenue for the year endedDecember 31, 2014 decreased by $20.8 million (3.9%) to $518.4 million as compared to $539.2 million for theyear ended December 31, 2013. This decrease was primarily a result of the decrease in attendance offset slightlyby a 0.4% increase in in-park per capita spending from $23.05 in 2013 to $23.14 in 2014.
Costs of food, merchandise and other revenues. Costs of food, merchandise and other revenues for theyear ended December 31, 2014 decreased $5.2 million (4.5%) to $109.0 million as compared to $114.2 millionfor the year ended December 31, 2013. These costs represent 21.0% of related revenue earned for the year endedDecember 31, 2014 and 21.2% of related revenue earned for the year ended December 31, 2013.
Operating expenses. Operating expenses for the year ended December 31, 2014 decreased by$15.7 million (2.1%) to $727.7 million as compared to $743.3 million for the year ended December 31, 2013.The decrease was primarily a result of a reduction in variable labor costs and other cost mitigation effortsemployed by our park operators. Operating expenses were 52.8% of total revenues in 2014 compared to 50.9% in2013.
Selling, general and administrative. Selling, general and administrative expenses for the year endedDecember 31, 2014 increased by $2.1 million (1.1%) to $189.4 million as compared to $187.3 million for theyear ended December 31, 2013. The increase was primarily related to marketing costs driven by reputationinitiatives along with the launch of our SeaWorld brand 50th anniversary celebration. These increased costs werepartially offset by the elimination of the 2009 Advisory Agreement fees due to the termination of this agreementin April 2013 and a decrease in equity compensation when compared to the prior year period. As a percentage oftotal revenue, selling, general and administrative expenses were 13.7% in 2014 compared to 12.8% in 2013.
Restructuring and other related costs. Restructuring and other related costs for the year endedDecember 31, 2014 represent severance and other related expenses incurred in connection with the restructuringprogram which we implemented in December 2014. The restructuring involved the elimination of approximately300 positions across our eleven theme parks and corporate headquarters in an effort to centralize certainoperations and reduce duplication of functions to increase efficiencies. The restructuring is part of our previouslyannounced company-wide cost initiative to deliver approximately $50.0 million of annual cost savings by the endof 2015, as compared to our cost structure in fiscal 2014. We believe that these cost savings will be largely offsetby annual inflationary pressures and increased spending on marketing and advertising initiatives.
Separation costs. Separation costs for the year ended December 31, 2014 represent costs incurred pursuantto the previously announced separation of our former Chief Executive Officer and President.
Secondary offering costs. On April 9, 2014 and December 17, 2013, the selling stockholders completedunderwritten secondary offerings of our common stock. Pursuant to the Registration Rights Agreement, we paidall expenses related to the offerings, other than underwriting discounts and commissions. No shares were sold byus in the secondary offerings and the selling stockholders received all of the net proceeds from the offerings. Inconnection with these secondary offerings, we incurred fees and expenses of $0.7 million for the year endedDecember 31, 2014 and $1.4 million for the year ended December 31, 2013.
Termination of advisory agreement. In connection with the completion of our initial public offering onApril 24, 2013, the 2009 Advisory Agreement was terminated. In connection with such termination, we paid atermination fee of $46.3 million to an affiliate of Blackstone and recorded a write-off of $3.8 million in 2013prepaid advisory fees.
48

Depreciation and amortization. Depreciation and amortization expense for the year ended December 31,2014 increased by $10.2 million (6.1%) to $176.3 million as compared to $166.1 million for the year endedDecember 31, 2013 due to the impact of new asset additions along with accelerated depreciation on certain assetsimpacted by our cost reduction initiatives offset by fully depreciated assets.
Interest expense. Interest expense for the year ended December 31, 2014 decreased $9.1 million(10.0%) to $81.5 million as compared to $90.6 million for the year ended December 31, 2013, primarilyreflecting the effects of the redemption of $140.0 million of our Senior Notes and the repayment of $37.0 millionin term loan under our Senior Secured Credit Facilities in April 2013 with a portion of the net proceeds from ourinitial public offering as well as the impact of Amendment No. 5 to our Senior Secured Credit Facilities, whichreduced the interest rate applicable to borrowings under our Senior Secured Credit Facilities.
Loss on early extinguishment of debt and write-off of discounts and deferred financing costs. Loss on earlyextinguishment of debt and write-off of discounts and deferred financing costs of $0.5 million for the year endedDecember 31, 2014 relates to a write-off in discounts and deferred financing costs related to the voluntaryprepayment of $31.5 million on our Senior Secured Credit Facilities during the third quarter of 2014. Loss onearly extinguishment of debt and write-off of discounts and deferred financing costs of $29.9 million for the yearended December 31, 2013 primarily relates to a $15.4 million premium paid for the early redemption of$140.0 million of our Senior Notes with a portion of the net proceeds from our initial public offering in April2013, along with a write-off of approximately $5.5 million in related discounts and deferred financing costs andthe write-off of approximately $8.1 million of certain debt issuance costs in connection with Amendment No. 5to our Senior Secured Credit Facilities.
Provision for income taxes. The provision for income taxes for the year ended December 31, 2014 was$28.9 million compared to $25.7 million in the year ended December 31, 2013. The increase primarily resultsfrom an increase in pretax income in 2014 compared to 2013, along with an increase in our effective income taxrate (from 33.1% to 36.6%). Our effective income tax rate increased primarily due to a valuation allowancerecorded on charitable contribution carryforwards expiring in 2015, a change in the income mix of the affiliatedentities, as well as the impact of non-deductible costs, including certain officer compensation and certain equitycompensation awards, which was offset in part by the benefit of a prior year adjustment and tax credits.
49

Comparison of the Years Ended December 31, 2013 and 2012
The following table presents key operating and financial information for the years ended December 31,2013 and 2012:
For the Year EndedDecember 31,
2013 2012
Statement of Comprehensive Income Data:(In thousands, except per
capita data)
Net revenues:Admissions $ 921,016 $ 884,407Food, merchandise and other 539,234 539,345
Total revenues 1,460,250 1,423,752
Costs and expenses:Cost of food, merchandise and other revenues 114,192 118,559Operating expenses (exclusive of depreciation
and amortization shown separately below) 743,322 730,582Selling, general and administrative 187,298 184,920Termination of advisory agreement 50,072 —Secondary offering costs 1,407 —Depreciation and amortization 166,086 166,975
Total costs and expenses 1,262,377 1,201,036
Operating income 197,873 222,716Other income, net (241) (1,563)Interest expense 90,622 110,565Loss on early extinguishment of debt and write-
off of discounts and deferred financing costs 29,858 2,053
Income before income taxes 77,634 111,661Provision for income taxes 25,714 37,440
Net income $ 51,920 $ 74,221
Other data:Attendance 23,391 24,391
Total revenue per capita $ 62.43 $ 58.37
Admissions revenue. Admissions revenue for the year ended December 31, 2013 increased $36.6 million(4.1%) to $921.0 million as compared to $884.4 million for the year ended December 31, 2012. The increase inrevenue was a result of an 8.6% increase in admission per capita from $36.26 in 2012 to $39.37 in 2013 offset bya 4.1% decrease in total attendance. The improvement in admission per capita was primarily a result of higherticket pricing and yield management strategies implemented at the beginning of 2013. Attendance for 2013declined primarily due to the anticipated impact of these new pricing and yield management strategies, whichincreased revenue but reduced low yielding and free attendance. Also contributing to the decline was unexpectedadverse weather conditions, particularly during the second quarter and in July of 2013. The unfavorable timing ofEaster on March 31 in 2013 also contributed to the attendance decline as it caused an overlap with the springbreak holiday period for schools in many of our key markets.
Food, merchandise and other revenue. Food, merchandise and other revenue for the year endedDecember 31, 2013 decreased slightly by $0.1 million (less than 0.1%) to $539.2 million as compared to$539.3 million for the year ended December 31, 2012. This decrease was a result of the decrease in attendanceoffset by a 4.3% increase in in-park per capita spending from $22.11 in 2012 to $23.05 in 2013. The increase in
50

in-park per capita spending was primarily due to targeted price increases and increased in-park offeringsreflecting our continued efforts to provide incremental and enhanced service offerings.
Costs of food, merchandise and other revenues. Costs of food, merchandise and other revenues for theyear ended December 31, 2013 decreased $4.4 million (3.7%) to $114.2 million as compared to $118.6 millionfor the year ended December 31, 2012, due primarily to improved culinary margins from leveraged purchasingefforts and operational efficiencies. These costs represent 21.2% of related revenue earned for the year endedDecember 31, 2013 and 21.9% of related revenue earned for the year ended December 31, 2012.
Operating expenses. Operating expenses for the year ended December 31, 2013 increased by$12.7 million (1.7%) to $743.3 million as compared to $730.6 million for the year ended December 31, 2012.The increase was primarily a result of increased direct labor costs, additional operating costs to support newattractions and our new Aquatica San Diego park which opened in 2013, partially offset by decreasedmiscellaneous asset write-offs and successful expense reductions implemented during the year. Operatingexpenses reflected 50.9% of total revenues for the year ended December 31, 2013 and 51.3% for the year endedDecember 31, 2012.
Selling, general and administrative. Selling, general and administrative expenses for the year endedDecember 31, 2013 increased by $2.4 million (1.3%) to $187.3 million as compared to $184.9 million for theyear ended December 31, 2012. This increase was primarily a result of additional equity compensation expenseprimarily related to a new restricted stock grant in April 2013 as well as an increase in corporate salaries due toplanned additions to our corporate structure as a result of our initial public offering and the related increasedpublic company requirements offset by the elimination of the 2009 Advisory Agreement fees due to thetermination of this agreement in April 2013. Also contributing were expense savings from utilizing moreefficient marketing channels and consolidation of our media buying. As a percentage of total revenue, selling,general and administrative expenses were 12.8% in the year ended December 31, 2013 compared to 13.0% in theyear ended December 31, 2012.
Termination of advisory agreement. In connection with the completion of our initial public offering onApril 24, 2013, the 2009 Advisory Agreement was terminated. In connection with such termination, we paid atermination fee of $46.3 million to an affiliate of Blackstone and recorded a write-off of $3.8 million in 2013prepaid advisory fees.
Secondary offering costs. On December 17, 2013, the selling stockholders completed an underwrittensecondary offering of our common stock. The selling stockholders received all of the net proceeds from theoffering and no shares were sold by us. In connection with this secondary offering, we incurred fees andexpenses of $1.4 million for the year ended December 31, 2013.
Depreciation and amortization. Depreciation and amortization expense for the year ended December 31,2013 decreased by $0.9 million (0.5%) to $166.1 million as compared to $167.0 million for the year endedDecember 31, 2012 due to the impact of fully depreciated assets offset by new asset additions.
Interest expense. Interest expense for the year ended December 31, 2013 decreased $19.9 million(18.0%) to $90.6 million as compared to $110.6 million for the year ended December 31, 2012, primarilyreflecting the effects of our March 2012 and May 2013 amendments to the terms of our Senior Secured CreditFacilities, which reduced our interest rates as well as the redemption of $140.0 million of our Senior Notes andthe repayment of $37.0 million under our Term B Loan in April 2013 with a portion of the net proceeds from ourinitial public offering.
Loss on early extinguishment of debt and write-off of discounts and deferred financing costs. Loss on earlyextinguishment of debt and write-off of discounts and deferred financing costs of $29.9 million for the yearended December 31, 2013 relates to a $15.4 million premium paid for the early redemption of $140.0 million of
51
our Senior Notes with a portion of the net proceeds from our initial public offering in April 2013, along with awrite-off of approximately $5.5 million in related discounts and deferred financing costs and the write-off ofapproximately $8.1 million of certain debt issuance costs in connection with Amendment No. 5 to our SeniorSecured Credit Facilities. Loss on early extinguishment of debt and write-off of discounts and deferred financingcosts for the year ended December 31, 2012 relates to the write-off of discounts and deferred financing costsrelated to prepayments and Amendment No. 3 to our Senior Secured Credit Facilities.
Provision for income taxes. The provision for income taxes for the year ended December 31, 2013 was$25.7 million compared to $37.4 million in the year ended December 31, 2012. The decrease primarily resultsfrom the decrease in pretax income in the year ended 2013 compared to the year ended 2012, along with adecrease in our effective income tax rate (from 33.5% to 33.1%). Our effective income tax rate decreased due toa benefit arising from certain federal tax credits and prior year true-ups offset by the impact of non-deductiblecosts, including non-deductible offering costs, certain officer compensation and certain equity compensationawards.
Liquidity and Capital Resources
Overview
Our principal sources of liquidity are cash generated from operations, funds from borrowings and existingcash on hand. Our principal uses of cash include the funding of working capital obligations, debt service,investments in theme parks (including capital projects), common stock dividends and share repurchases. As ofDecember 31, 2014, we had a working capital deficit of approximately $78.9 million. We typically operate with aworking capital deficit and we expect that we will continue to have working capital deficits in the future. Theworking capital deficits are due in part to a significant deferred revenue balance from revenues paid in advancefor our theme park admissions products and high turnover of in-park products that results in a limited inventorybalance. Our cash flow from operations, along with our revolving credit facilities, have allowed us to meet ourliquidity needs while maintaining a working capital deficit.
As market conditions warrant and subject to our contractual restrictions and liquidity position, we, ouraffiliates and/or our major stockholders, including Blackstone and its affiliates, may from time to time repurchaseour outstanding equity and/or debt securities, including the Senior Notes and/or our outstanding bank loans inprivately negotiated or open market transactions, by tender offer or otherwise. Any such repurchases may befunded by incurring new debt, including additional borrowings under the Senior Secured Credit Facilities. Anynew debt may be secured debt. We may also use available cash on our balance sheet. The amounts involved inany such transactions, individually or in the aggregate, may be material. Further, since some of our debt maytrade at a discount to the face amount, any such purchases may result in our acquiring and retiring a substantialamount of any particular series, with the attendant reduction in the trading liquidity of any such series.Depending on conditions in the credit and capital markets and other factors, we will, from time to time, considerother financing transactions, the proceeds of which could be used to refinance our indebtedness or for otherpurposes.
Dividends
The Company’s Board of Directors (the “Board”) has adopted a policy to pay, subject to legally availablefunds, a regular quarterly dividend. Dividends paid to stockholders were $72.1 million and $36.2 million in theyears ended December 31, 2014 and 2013, respectively. The amount and timing of any future dividends payableon our common stock is within the sole discretion of the Board. See “Market for the Registrant’s CommonEquity, Related Stockholder Matters and Issuer Purchases of Equity Securities-Dividends.”
Subsequent to December 31, 2014, on January 5, 2015, the Board declared a cash dividend of $0.21 pershare to all common stockholders of record at the close of business on January 13, 2015, which was paid onJanuary 22, 2015. The Company expects that for tax purposes, a portion of the dividends paid in 2014 and 2015will be treated as a return of capital to stockholders.
52

In March 2012, our Board declared a $500.0 million cash dividend to our common stockholders, which atthat time consisted of entities controlled by certain affiliates of Blackstone. Approximately $503.0 million waspaid in the year ended December 31, 2012, related to such dividends and a $3.0 million portion of the dividenddeclared in 2011.
Approximately $0.2 million of dividends declared through December 31, 2014, will be paid if certain timerestricted shares vest over their requisite service periods. Dividends on certain performance restricted shares wereapproximately $3.5 million and will accumulate and be paid only if and to the extent the shares vest inaccordance with their terms. See Note 19–Stockholders’ Equity to our consolidated financial statements includedelsewhere in this Annual Report on Form 10-K
Share Repurchases
On August 12, 2014, our Board authorized a share repurchase program of up to $250.0 million of ourcommon stock beginning on January 1, 2015 (the “Share Repurchase Program”). On December 16, 2014, theBoard approved an amendment to the Share Repurchase Program to change the start date of such program fromJanuary 1, 2015 to December 17, 2014 and to authorize the repurchase of up to $15.0 million of our commonstock during the remainder of calendar year 2014. The other features of the Share Repurchase Program remainunchanged including the total amount authorized and available under the program of $250.0 million. Under theShare Repurchase Program, we are authorized to repurchase shares through open market purchases, privately-negotiated transactions or otherwise in accordance with applicable federal securities laws, including throughRule 10b5-1 trading plans and under Rule 10b-18 of the Exchange Act. The Share Repurchase Program has notime limit and may be suspended or discontinued completely at any time. The number of shares to be purchasedand the timing of purchases will be based on the level of our cash balances, general business and marketconditions, and other factors, including legal requirements, debt covenant restrictions and alternative investmentopportunities.
Pursuant to the Share Repurchase Program, in the fourth quarter of 2014, we entered into a written tradingplan under Rule 10b5-1 of the Exchange Act and repurchased a total of 855,970 shares of our common stock atan average price of $17.50 per share and a total cost of approximately $15.0 million, leaving $235.0 millionavailable for future repurchases under the Share Repurchase Program.
Concurrently with the closing of the secondary offerings in April 2014 and December 2013, we repurchased1.75 million and 1.5 million shares, respectively, of our common stock directly from the selling stockholders inprivate, non-underwritten transactions at a price per share equal to the price per share paid to the sellingstockholders by the underwriters in the respective secondary offerings.
All of the repurchased shares from the Share Repurchase Program and shares purchased concurrently withthe secondary offerings were recorded as treasury stock at a total cost of $109.9 million and $44.2 million as ofDecember 31, 2014 and 2013, respectively, and are reflected as a reduction to stockholders’ equity on theaccompanying consolidated balance sheets and consolidated statement of changes in stockholders’ equity.
Other
In March 2014, we executed a new interest rate swap agreement to effectively fix the interest rate on$450.0 million of the Term B Loans. The interest rate swap has an effective date of March 31, 2014, has anotional amount of $450.0 million and is scheduled to mature on September 30, 2016.
We believe that existing cash and cash equivalents, cash flow from operations, and available borrowingsunder the Senior Secured Credit Facilities will be adequate to meet the capital expenditures, dividends andworking capital requirements of our operations for at least the next 12 months.
53

The following table presents a summary of our cash flows provided by (used in) operating, investing andfinancing activities for the periods indicated:
For the Year Ended December 31,
2014 2013 2012
(In thousands)
Net cash provided by operating activities $ 261,532 $ 286,461 $ 299,440Net cash used in investing activities (156,546) (166,376) (204,318)Net cash used in financing activities (177,921) (48,919) (116,110)
Net (decrease) increase in cash and cashequivalents $ (72,935) $ 71,166 $ (20,988)
Cash Flows from Operating Activities
Net cash provided by operating activities was $261.5 million during the year ended December 31, 2014 ascompared to $286.5 million during the year ended December 31, 2013, which included a cash payment of$46.3 million for the 2009 Advisory Agreement termination fee paid in conjunction with our initial publicoffering in April 2013. The change in net cash provided by operating activities was also impacted by a decreasein total revenue in 2014 primarily related to a decline in attendance offset by favorable changes in our workingcapital accounts when compared to the prior year.
Net cash provided by operating activities was $286.5 million during the year ended December 31, 2013 ascompared to $299.4 million during the year ended December 31, 2012. Cash provided by operating activitiesdecreased primarily as a result of the cash payment of $46.3 million for the 2009 Advisory Agreementtermination fee in conjunction with our initial public offering in April 2013, offset by additional cash generatedfrom theme park operations due to an increase in total revenue primarily related to higher admissions revenue.
Cash Flows from Investing Activities
Investing activities consist principally of capital investments we make in our theme parks for futureattractions and infrastructure. Net cash used in investing activities during the year ended December 31, 2014consisted primarily of capital expenditures of $154.6 million largely related to future attractions.
Net cash used in investing activities during the year ended December 31, 2013 consisted primarily of capitalexpenditures of $166.3 million largely related to attractions that opened in 2014.
Net cash used in investing activities during the year ended December 31, 2012 consisted primarily of capitalexpenditures of $191.7 million, as well as $12.0 million for the purchase of Knott’s Soak City Chula Vista waterpark in November 2012. The capital expenditures were largely related to new attractions and zoological safetyinfrastructure.
The amount of our capital expenditures may be affected by general economic and financial conditions,among other things, including restrictions imposed by our borrowing arrangements. We expect 2015 capitalexpenditures to be in the range of $180.0 to $190.0 million. We generally expect to fund our 2015 capitalexpenditures through our operating cash flow.
Cash Flows from Financing Activities
Net cash used in financing activities during the year ended December 31, 2014 was primarily attributable to$72.1 million in cash dividends paid to common stockholders, $60.1 million used to repurchase 2.6 millionshares of our common stock and $45.5 million paid on our Term B-2 Loan under the Senior Secured CreditFacilities, as defined below, which included a voluntary prepayment of $31.5 million.
54
Net cash used in financing activities during the year ended December 31, 2013 was primarily attributable tothe receipt of $253.8 million proceeds from our initial public offering, net of underwriter discounts andcommissions, offset by the following: (i) repayments of $189.3 million of debt which consisted primarily of theredemption of $140.0 million of our Senior Notes and a repayment of $37.0 million of indebtedness under ourTerm B Loan, (ii) $44.2 million used to repurchase 1.5 million shares of our stock, (iii) payments of$36.2 million in cash dividends, (iv) $15.4 million paid in a redemption premium for the Senior Notes,(v) $10.6 million paid in debt issuance costs, (vi) $4.7 million in costs incurred in connection with our initialpublic offering and (vii) $3.0 million related to a note payable which was due on September 1, 2013 for theNovember 2012 acquisition of Knott’s Soak City from an affiliate of Cedar Fair L.P.
Net cash used in financing activities during the year ended December 31, 2012 was primarily attributable tothe following: (i) the payment of a $503.0 million portion of our dividends described above (net of requiredwithholdings), (ii) repayment of $93.7 million of debt under our Senior Secured Credit Facilities and (iii) costs of$3.0 million related to an amendment to the indenture governing our Senior Notes and an amendment to ourSenior Secured Credit Facilities. This was partially offset by proceeds of $487.2 million from the term loanborrowings under our Senior Secured Credit Facilities.
Our Indebtedness
The Company is a holding company and conducts its operations through its subsidiaries, which haveincurred or guaranteed indebtedness as described below.
Senior Secured Credit Facilities
SeaWorld Parks & Entertainment, Inc. (“SEA”) is the borrower under our senior secured credit facilities(the “Senior Secured Credit Facilities”) pursuant to a credit agreement dated as of December 1, 2009, by andamong SEA, as borrower, Bank of America, N.A., as administrative agent, collateral agent, letter of credit issuerand swing line lender and the other agents and lenders party thereto, as the same may be amended, restated,supplemented or modified from time to time.
As of December 31, 2014, our Senior Secured Credit Facilities consisted of a $1,352.4 million seniorsecured term loan facility (the “Term B-2 Loans”), which will mature on May 14, 2020 and a $192.5 millionsenior secured revolving credit facility (the “Revolving Credit Facility”), which was not drawn upon atDecember 31, 2014. The Revolving Credit Facility will mature on the earlier of (a) April 24, 2018 and (b) the91st day prior to the earlier of (1) the maturity date of Senior Notes with an aggregate principal amount greaterthan $50.0 million outstanding and (2) the maturity date of any indebtedness incurred to refinance the Term B-2Loans or the Senior Notes, and includes borrowing capacity available for letters of credit and for short-termborrowings referred to as the swing line borrowings. As of December 31, 2014, SEA had approximately$18.1 million of outstanding letters of credit. Subsequent to December 31, 2014, SEA borrowed $45.0 millionunder the Revolving Credit Facility.
Borrowings under our Senior Secured Credit Facilities bear interest, at SEA’s option, at a rate equal to amargin over either (a) a base rate determined by reference to the higher of (1) Bank of America’s prime lendingrate and (2) the federal funds effective rate plus 1/2 of 1% or (b) a LIBOR rate determined by reference to theBritish Bankers Association (“BBA”) LIBOR rate, or the successor thereto if the BBA is no longer making aLIBOR rate available, for the interest period relevant to such borrowing. The applicable margin for the Term B-2Loans is 1.25%, in the case of base rate loans and 2.25%, in the case of LIBOR rate loans, subject to a base ratefloor of 1.75% and a LIBOR floor of 0.75%. The applicable margin for the Term B-2 Loans (under either a baserate or LIBOR rate) is subject to one 25 basis point step-down upon achievement by SEA of a certain totalleverage ratio. At December 31, 2014, SEA selected the LIBOR rate (interest rate of 3.00% at December 31,2014).
55

The applicable margin for borrowings under the Revolving Credit Facility is 1.75%, in the case of base rateloans and 2.75%, in the case of LIBOR rate loans, subject to one 25 basis point step-down based on SEA’scorporate credit ratings. The applicable margin (under either a base rate or LIBOR rate) is subject to one 25 basispoint step-down upon achievement by SEA of certain corporate credit ratings. At December 31, 2014, SEAselected the LIBOR rate and achieved the corporate credit ratings for an applicable margin of 2.50%.
In addition to paying interest on outstanding principal under our Senior Secured Credit Facilities, SEA isrequired to pay a commitment fee to the lenders under the Revolving Credit Facility in respect of the unutilizedcommitments thereunder at a rate of 0.50% per annum. SEA is also required to pay customary letter of credit fees.
Term B-2 Loans amortize in equal quarterly installments in an aggregate annual amount equal to 1.0% ofthe original principal amount of the Term B-2 Loans, with the balance due on the final maturity date. SEA mayvoluntarily repay amounts outstanding under our Senior Secured Credit Facilities at any time without premium orpenalty, other than customary “breakage” costs with respect to LIBOR loans. In 2014, SEA made a voluntaryprincipal repayment of approximately $31.5 million on the Term B-2 Loans. The Term B-2 loans were initiallyborrowed in an aggregate principal amount of $1,405.0 million.
SEA is required to prepay outstanding term loans, subject to certain exceptions, with (i) 50% of SEA’sannual “excess cash flow” (with step-downs to 25% and 0%, as applicable, based upon achievement by SEA of acertain total net leverage ratio), subject to certain exceptions; (ii) 100% of the net cash proceeds of certain non-ordinary course asset sales or other dispositions subject to reinvestment rights and certain exceptions; and(iii) 100% of the net cash proceeds of any incurrence of debt by SEA or any of its restricted subsidiaries, otherthan debt permitted to be incurred or issued under our Senior Secured Credit Facilities.
The obligations under our Senior Secured Credit Facilities are fully, unconditionally and irrevocablyguaranteed by each of the Company, any subsidiary of the Company that directly or indirectly owns 100% of theissued and outstanding equity interests of SEA, and, subject to certain exceptions, each of SEA’s existing andfuture material domestic wholly-owned subsidiaries (collectively, the “Guarantors”). Our Senior Secured CreditFacilities are collateralized by first priority or equivalent security interests in (i) all the capital stock of, or otherequity interests in, substantially all SEA’s direct or indirect material domestic subsidiaries (subject to certainexceptions and qualifications) and 65% of the capital stock of, or other equity interests in, any of SEA’s first tierforeign subsidiaries and (ii) certain tangible and intangible assets of SEA and those of the Guarantors (subject tocertain exceptions and qualifications).
Our Senior Secured Credit Facilities contain a number of customary negative covenants. Such covenants,among other things, restrict, subject to certain exceptions, the ability of SEA and its restricted subsidiaries toincur additional indebtedness; make guarantees; create liens on assets; enter into sale and leaseback transactions;engage in mergers or consolidations; sell assets; make fundamental changes; pay dividends and distributions orrepurchase SEA’s capital stock; make investments, loans and advances, including acquisitions; engage in certaintransactions with affiliates; make changes in nature of the business; and make prepayments of junior debt. OurSenior Secured Credit Facilities also contain covenants requiring SEA to maintain specified maximum annualcapital expenditures, a maximum total net leverage ratio and a minimum interest coverage ratio. In addition, ourSenior Secured Credit Facilities contain certain customary representations and warranties, affirmative covenantsand events of default. See also the “Covenant Compliance” section which follows.
The Senior Notes
On December 1, 2009, SEA issued $400.0 million aggregate principal amount of 13.5% Senior Notes due2016. On March 30, 2012, pursuant to an amendment to the indenture governing the Senior Notes, the interestrate was reduced from 13.5% to 11.0%. Interest on the Senior Notes is payable semi-annually in arrears. Theobligations under the Senior Notes are guaranteed by the same entities as those that guarantee our Senior SecuredCredit Facilities. As of December 31, 2014, SEA had $260.0 million aggregate principal amount of the SeniorNotes outstanding.
56

The Senior Notes are senior unsecured obligations and:
• rank senior in right of payment to all existing and future debt and other obligations that are, by theirterms, expressly subordinated in right of payment to the Senior Notes;
• rank equally in right of payment to all existing and future senior debt and other obligations that are not,by their terms, expressly subordinated in right of payment to the Senior Notes; and
• are effectively subordinated in right of payment to all existing and future secured debt (includingobligations under our Senior Secured Credit Facilities), to the extent of the value of the assets securingsuch debt, and are structurally subordinated to all obligations of each of our subsidiaries that is not aguarantor of the Senior Notes.
On or after December 1, 2014, the Senior Notes may be redeemed at 105.5% and 102.75% of the principalamount beginning on December 1, 2014 and 2015, respectively.
We used a portion of the net proceeds received by us in our initial public offering to redeem $140.0 millionin aggregate principal amount of the Senior Notes in April 2013 at a redemption price of 111.0%. Theredemption premium of $15.4 million, along with a write-off of approximately $5.5 million in related discountsand deferred financing costs was recorded as a loss on early extinguishment of debt and write-off of discountsand deferred financing costs for the year ended December 31, 2013.
The indenture governing the Senior Notes contains a number of covenants that, among other things, restrictSEA’s ability and the ability of its restricted subsidiaries to, among other things, dispose of certain assets; incuradditional indebtedness; pay dividends; prepay subordinated indebtedness; incur liens; make capitalexpenditures; make investments or acquisitions; engage in mergers or consolidations; and engage in certain typesof transactions with affiliates. These covenants are subject to a number of important limitations and exceptions.See also the “Covenant Compliance” section which follows.
See Note 11–Long-Term Debt to our consolidated financial statements included elsewhere in this AnnualReport on Form 10-K for further discussion regarding our Senior Secured Credit Facilities and Senior Notes.
Covenant Compliance
As of December 31, 2014, we were in compliance with all covenants in the credit agreement governing theSenior Secured Credit Facilities and the indenture governing our Senior Notes.
The indenture governing the Senior Notes and the credit agreement governing the Senior Secured CreditFacilities provide for certain events of default which, if any of them were to occur, would permit or require theprincipal of and accrued interest, if any, on the Senior Notes or the loans under the Senior Secured CreditFacilities, respectively, to become or be declared due and payable (subject, in some cases, to specified graceperiods). Also, under the indenture governing the Senior Notes and under the credit agreement governing theSenior Secured Credit Facilities, our ability to engage in activities such as incurring additional indebtedness,making investments, refinancing certain indebtedness, paying dividends and entering into certain mergertransactions is governed, in part, by our ability to satisfy tests based on covenant Adjusted EBITDA.
The Senior Notes and the Senior Secured Credit Facilities generally define “Adjusted EBITDA” as netincome (loss) before interest expense, income tax expense (benefit), depreciation and amortization, as furtheradjusted to exclude certain unusual, non-cash, and other items permitted in calculating covenant complianceunder the indenture governing the Senior Notes and the Senior Secured Credit Facilities.
We believe that the presentation of Adjusted EBITDA is appropriate to provide additional information toinvestors about the calculation of, and compliance with, certain financial covenants in the indenture governingthe Senior Notes and in the Senior Secured Credit Facilities. Adjusted EBITDA is a material component of these
57

covenants. In addition, investors, lenders, financial analysts and rating agencies have historically used EBITDArelated measures in our industry, along with other measures, to evaluate a company’s ability to meet its debtservice requirements, to estimate the value of a company and to make informed investment decisions. We alsouse Adjusted EBITDA in connection with certain components of our executive compensation program. AdjustedEBITDA eliminates the effect of certain non-cash depreciation of tangible assets and amortization of intangibleassets, along with the effects of interest rates and changes in capitalization which management believes may notnecessarily be indicative of a company’s underlying operating performance.
Adjusted EBITDA is not a recognized term under accounting principles generally accepted in the UnitedStates of America (“GAAP”), and should not be considered in isolation or as a substitute for a measure of ourliquidity or performance prepared in accordance with GAAP and is not indicative of income from operations asdetermined under GAAP. Adjusted EBITDA and other non-GAAP financial measures have limitations whichshould be considered before using these measures to evaluate our liquidity or financial performance. AdjustedEBITDA, as presented by us, may not be comparable to similarly titled measures of other companies due tovarying methods of calculation. The following table reconciles net income to Adjusted EBITDA:
For the Year Ended December 31,
2014 2013 2012
(In thousands)
Net income $ 49,919 $ 51,920 $ 74,221Provision for income taxes 28,872 25,714 37,440Loss on early extinguishment of debt and write-off of
discounts and deferred financing costs (a) 461 29,858 2,053Interest expense 81,543 90,622 110,565Depreciation and amortization 176,275 166,086 166,975Restructuring and other related costs (b) 11,567 — —Secondary offering costs (c) 747 1,407 —Termination of advisory agreement (d) — 50,072 —Advisory fees (e) — 2,799 6,201Equity-based compensation expense (f) 2,349 6,026 1,681Debt refinancing costs (g) — 4,225 5,073Other adjusting items (h) 3,331 843 630Other non-cash expenses (i) 5,036 9,556 10,367Estimated cost savings (j) 10,000 — —
Adjusted EBITDA $370,100 $439,128 $415,206
(a) Reflects the write-off of discounts and deferred financing costs in the year ended December 31, 2014relating to the voluntary prepayment of $31.5 million of the outstanding indebtedness under our SeniorSecured Credit Facilities. For the year ended December 31, 2013, reflects a $15.4 million premium paid forthe early redemption of $140.0 million of our existing Senior Notes using net proceeds from our initialpublic offering in April 2013, along with a write-off of approximately $5.5 million in related discounts anddeferred financing costs and a write-off of approximately $8.1 million of certain capitalized debt issuancecosts in connection with Amendment No. 5 to our Senior Secured Credit Facilities. For the year endedDecember 31, 2012, reflects the write-off of discounts and deferred financing costs related to prepaymentsand Amendment No. 3 to our Senior Secured Credit Facilities.
(b) Reflects restructuring and other related costs for the year ended December 31, 2014. Restructuring and otherrelated costs consist of $8.6 million related to severance and other employment expenses and $3.0 millionrelated to third party consulting costs associated with the development of the cost savings plan andrestructuring program.
(c) Reflects fees and expenses incurred in connection with the secondary offering of our common stock in April2014 for the year ended December 31, 2014 and fees and expenses incurred in connection with the
58

secondary offering of our common stock in December 2013 for the year ended December 31, 2013.Pursuant to the Registration Rights Agreement, we paid all expenses related to the offerings, other thanunderwriting discounts and commissions. No shares were sold by us in the secondary offerings and theselling stockholders received all of the net proceeds from the offerings.
(d) Reflects a one-time fee of $46.3 million paid to an affiliate of Blackstone in connection with the terminationof the 2009 Advisory Agreement, and a related write-off of prepaid advisory fees of $3.8 million. Inconnection with our initial public offering, the 2009 Advisory Agreement was terminated on April 24, 2013in accordance with its terms.
(e) Reflects historical fees paid to an affiliate of Blackstone under the 2009 Advisory Agreement.(f) Reflects non-cash compensation expenses associated with the grants of equity compensation.(g) Reflects costs which were expensed related to the amendments to our Senior Secured Credit Facilities.(h) Reflects certain initial product and intellectual property development costs incurred in the year ended
December 31, 2014. The product and intellectual property development costs were not material in the priorperiods. For the years ended December 31, 2013 and 2012, other adjusting items reflects costs related to ouracquisition of the Knott’s Soak City Chula Vista water park and pre-opening costs related to Aquatica San Diego.
(i) Reflects non-cash expenses related to miscellaneous asset write-offs and non-cash gains/losses on foreigncurrencies which were expensed.
(j) Reflects estimated 2014 cost savings related to the previously announced restructuring program. Theseestimated cost savings are a non-GAAP Adjusted EBITDA item only that does not impact the Company’sreported GAAP net income. Pursuant to the credit agreement governing our Senior Secured CreditFacilities, we are permitted to reflect in our calculation of Adjusted EBITDA, subject to certain limitations,estimated cost savings resulting from certain specified actions, including restructurings and cost savingsinitiatives. The credit agreement governing our Senior Secured Credit Facilities limits the amount ofestimated cost savings that do not result from acquisitions or dispositions which may be reflected in thecalculation of Adjusted EBITDA to $10.0 million for any applicable consecutive four quarter period and$30.0 million in the aggregate. In addition, the indenture governing our Senior Notes does not provide for asimilar adjustment. Accordingly, we will not include the estimated cost savings related to the restructuringprogram for the purposes of covenant calculations under the indenture governing the Senior Notes.
The Senior Secured Credit Facilities and the indenture governing the Senior Notes contain covenants that,among other things, restrict our ability and the ability of our restricted subsidiaries to, among other things, makecertain restricted payments (as defined in the applicable agreement), including dividend payments and sharerepurchases. In particular, the Senior Secured Credit Facilities and the indenture permit restricted payments in anaggregate amount per annum not to exceed the greater of (1) 6% of initial public offering net proceeds receivedby SEA or (2) (a) $90.0 million, so long as, on a pro forma basis (as defined in the applicable agreement) aftergiving effect to the payment of any such restricted payment, the Total Leverage Ratio, (as defined in theapplicable Agreement and calculated as of the end of the prior quarter), is no greater than 5.00 to 1.00 and greaterthan 4.50 to 1.00, (b) $120.0 million, so long as, on a pro forma basis after giving effect to the payment of anysuch restricted payment, the Total Leverage Ratio is no greater than 4.50 to 1.00 and greater than 4.00 to 1.00,(c) the greater of (A) $120.0 million and (B) 7.5% of market capitalization, so long as, on a pro forma basis aftergiving effect to the payment of any such restricted payment, the Total Leverage Ratio is no greater than 4.00 to1.00 and greater than 3.50 to 1.00 and (d) an unlimited amount, so long as, on a pro forma basis after givingeffect to the payment of any such restricted payment, the Total Leverage Ratio is no greater than 3.50 to 1.00.
For the year ended December 31, 2014, we had a $120.0 million capacity for restricted payments under theprovision described above. Through the third quarter of 2014, we had used approximately $104.9 million of ouravailable restricted payments capacity leaving an aggregate amount of approximately $15.1 million available inthe fourth quarter of 2014 to declare dividends or make other restricted payments. As a result, the Board electedto postpone the declaration of the our fourth quarter 2014 dividend to January 2015 and instead authorized therepurchase of up to $15.0 million of our common stock in December 2014. See Note 19–Stockholders’ Equity tothe consolidated financial statements included elsewhere in this Annual Report on Form 10-K for furtherdiscussion on the Share Repurchase Program.
59

As of December 31, 2014, the Total Leverage Ratio as calculated under the Senior Notes was 4.48 to 1.00and as calculated under the Senior Secured Credit Facilities was 4.25 to 1.00, which results in an estimated$120.0 million capacity for restricted payments in the year ended December 31, 2015. The annual amountavailable for dividend declarations, share repurchases and other restricted payments under the covenantrestrictions in the debt agreements adjusts at the beginning of each quarter as set forth above.
Contractual Obligations
The following table summarizes our principal contractual obligations as of December 31, 2014:
TotalLess than 1
Year 1-3 Years3-5
YearsMore than 5
Years
(In thousands)
Long-term debt (including current portion)(a) $1,612,438 $14,050 $288,100 $28,100 $1,282,188Operating leases(b) 373,039 15,648 30,090 28,850 298,451Purchase obligations(c) 44,468 41,626 2,842 — —
Total contractual obligations $2,029,945 $71,324 $321,032 $56,950 $1,580,639
(a) Represents principal payments of long-term debt and does not include estimated interest obligations of$73,402; $111,352; $77,880; and $12,813 payable in less than 1 year, 1-3 years, 3-5 years and more than5 years, respectively.
(b) Represents commitments under long-term operating leases, primarily consisting of the lease for the land ofour SeaWorld theme park in San Diego, California, requiring annual minimum lease payments.
(c) We have minimum purchase commitments with various vendors through December 2016. Outstandingminimum purchase commitments consist primarily of capital expenditures related to future attractions,infrastructure enhancements for existing facilities and information technology products and services.
Off-Balance Sheet Arrangements
We had no off-balance sheet arrangements as of December 31, 2014.
Critical Accounting Policies and Estimates
The preparation of financial statements in conformity with GAAP requires management to make estimatesand assumptions that affect the reported amounts of certain assets and liabilities, revenues and expenses, anddisclosure of contingencies during the reporting period. Significant estimates and assumptions include thevaluation and useful lives of long-lived tangible and intangible assets, the valuation of goodwill and otherindefinite-lived intangible assets, the accounting for income taxes, the accounting for self-insurance, revenuerecognition and equity-based compensation. Actual results could differ from those estimates. We believe that thefollowing discussion addresses our critical accounting policies which require management’s most difficult,subjective and complex judgments, often as a result of the need to make estimates about the effect of matters thatare inherently uncertain.
Property and Equipment
Property and equipment additions are recorded at cost and the carrying value is depreciated on a straight-line basis over the estimated useful lives of those assets. Development costs associated with new attractions, ridesand products are capitalized after necessary feasibility studies have been completed and final concept or contractshave been approved. Interest is capitalized on all construction projects. It is possible that changes incircumstances such as technological advances, changes to our business model or changes in capital strategy couldresult in the actual useful lives differing from estimates. In those cases in which we determine that the useful lifeof property and equipment should be shortened, we depreciate the remaining net book value in excess of the
60

salvage value over the revised remaining useful life, thereby increasing depreciation expense evenly through theremaining expected life.
Impairment of Long-Lived Assets
All long-lived assets, including property and equipment and finite-lived intangible assets, are reviewed forimpairment upon the occurrence of events or changes in circumstances that would indicate that the carrying valueof the assets may not be recoverable. The impairment indicators considered important that may trigger animpairment review, if significant, include the following:
• underperformance relative to historical or projected future operating results;
• changes in the manner of use of the assets;
• changes in management, strategy or customers;
• negative industry or economic trends; and
• macroeconomic conditions.
An impairment loss may be recognized when estimated undiscounted future cash flows expected to resultfrom the use of the asset, including disposition, are less than the carrying value of the asset. The measurement ofthe impairment loss to be recognized is based upon the difference between the fair value and the carryingamounts of the assets. Fair value is generally determined based upon a discounted cash flow analysis. In order todetermine if an asset has been impaired, assets are grouped and tested at the lowest level for which identifiable,independent cash flows are available.
The determination of both undiscounted and discounted future cash flows requires management to makesignificant estimates and consider an anticipated course of action as of the balance sheet date. Subsequentchanges in estimated undiscounted and discounted future cash flows arising from changes in anticipated actionscould impact the determination of whether impairment exists. There was no impairment of any long-lived assetsin 2014, 2013 or 2012.
Goodwill and Other Indefinite-Lived Intangible Assets
Goodwill and other indefinite-lived intangible assets are reviewed for impairment annually, and as of aninterim date should factors or indicators become apparent that would require an interim test, for ongoingrecoverability based on applicable reporting unit performance and consideration of significant events or changesin the overall business environment.
In assessing goodwill for impairment, we may choose to initially evaluate qualitative factors to determine ifit is more likely than not that the fair value of a reporting unit is less than its carrying amount. We considerseveral factors, including macroeconomic conditions, industry and market conditions, overall financialperformance of the reporting unit, changes in management, strategy or customers, and relevant reporting unitspecific events such as a change in the carrying amount of net assets, a more-likely-than-not expectation ofselling or disposing all, or a portion, of a reporting unit, and the testing of recoverability of a significant assetgroup within a reporting unit. If the qualitative assessment is not conclusive, then the impairment analysis forgoodwill is performed at the reporting unit level using a two-step approach. We may also choose to perform thistwo-step impairment analysis instead of the qualitative analysis. The first step is a comparison of the fair value ofthe reporting unit, determined using the income and market approach, to its recorded amount. If the recordedamount exceeds the fair value, the second step quantifies any impairment write-down by comparing the currentimplied value of goodwill to the recorded goodwill balance.
Significant judgments required in this testing process may include projecting future cash flows, determiningappropriate discount rates and other assumptions. Projections are based on management’s best estimates given
61

recent financial performance, market trends, strategic plans and other available information which in recent yearshave been materially accurate. Although not currently anticipated, changes in these estimates and assumptionscould materially affect the determination of fair value or impairment. It is possible that our assumptions aboutfuture performance, as well as the economic outlook and related conclusions regarding the valuation of ourassets, could change adversely, which may result in impairment that would have a material effect on our financialposition and results of operations in future periods. At December 1, 2014, a quantitative assessment wasperformed and we determined that we had no reporting units that were considered impaired as a result of thisgoodwill impairment test. During this quantitative assessment, we calculated that the fair value of the reportingunits exceeded their respective carrying values by 12% and 106%. A key assumption utilized in the goodwillanalysis was a weighted average cost of capital of 9%.
At December 1, 2013, a qualitative assessment was performed and we determined, after assessing thetotality of relevant events and circumstances, that it was not more likely than not that the carrying value exceededthe fair value of the reporting units. Accordingly, based upon the qualitative assessment test that was performedin 2013, and the quantitative assessment that was performed as of December 1, 2014, we had no reporting unitsthat were considered at risk of failing step one of the goodwill impairment test.
Our other indefinite-lived intangible assets consist of certain trade names/trademarks which, afterconsidering legal, regulatory, contractual, and other competitive and economic factors, are determined to haveindefinite lives and are valued annually using the relief from royalty method. Significant estimates required inthis valuation method include estimated future revenues impacted by the trade names/trademarks, royalty rate bypark, and appropriate discount rates. Projections are based on management’s best estimates given recent financialperformance, market trends, strategic plans, brand awareness, operating characteristics by park, and otheravailable information which in recent years have been materially accurate. Changes in these estimates andassumptions could materially affect the fair value determination used in the assessment of impairment. Based ona quantitative assessment performed at December 1, 2014 and a qualitative assessment performed at December 1,2013, there was no impairment as the fair value of trade names/trademarks were substantially in excess of theircarrying values. For the December 1, 2014 quantitative assessment of other indefinite-lived intangible assets, wecalculated that the fair value of the trade names/trademarks exceeded their carrying values by 68% to 85%. Keyassumptions utilized in the other indefinite-lived intangible asset analysis were a discount rate of 9% and anestimated royalty rate ranging from 2% to 3%.
Accounting for Income Taxes
We are required to estimate income taxes in each of the jurisdictions in which we operate. This processinvolves estimating actual current tax exposure together with assessing temporary differences resulting fromdiffering treatment of items, such as depreciation periods for property and equipment and deferred revenue, fortax and financial accounting purposes. These differences result in deferred tax assets and liabilities, which areincluded within our consolidated balance sheet. We must then assess the likelihood that deferred tax assets(primarily net operating loss and charitable contribution carryforwards) will be recovered from future taxableincome. To the extent that we believe that recovery is not likely, a valuation allowance against those amounts isrecognized. To the extent that we recognize a valuation allowance or an increase in the valuation allowanceduring a period, we recognize these amounts as income tax expense in the consolidated statements ofcomprehensive income. Section 382 of the Internal Revenue Code of 1986, as amended (the “Code”) containsrules that limit the ability of a company that undergoes an ownership change, which is generally any change inownership of more than 50% of its stock over a rolling three-year period, to utilize its net operating losscarryforwards in years after the ownership change. These rules generally operate by focusing on ownership shiftsamong stockholders owning directly or indirectly 5% or more of the stock of a company and any change inownership arising from shares of stock sold by these same stockholders.
Significant management judgment is required in determining our provision or benefit for income taxes,deferred tax assets and liabilities and any valuation allowance recorded against net deferred tax assets.
62

Management has analyzed all available evidence, both positive and negative, using a more likely than notstandard in assessing the need for a valuation allowance against its deferred income tax assets. This assessmentconsiders, among other matters, the nature, frequency and severity of recent losses, forecast of futureprofitability, the duration of the statutory carryback and carryforward periods and tax planning alternatives. Dueto the uncertainty of realizing a benefit from the deferred tax assets recorded for charitable contributioncarryforwards expiring in 2015, a valuation allowance of approximately $1.5 million was recognized for the yearended December 31, 2014.
Although the secondary offerings that were completed in December 2013 and April 2014 gave rise to anownership change under Section 382, we believe that the resulting limitations imposed by Section 382 will notaffect our ability to use our existing net operating loss carryforwards. Any future ownership change may,however, result in further limitations imposed by Section 382. Any such limitation may have the effect ofreducing our after-tax cash flow in future years and may affect our need for a valuation allowance on ourdeferred tax assets related to federal tax and state net operating loss carryforwards.
Self-Insurance Reserves
Reserves are recorded for the estimated amounts of guest and employee claims and expenses incurred eachperiod that are not covered by insurance. Reserves are established for both identified claims and incurred but notreported (“IBNR”) claims. Such amounts are accrued for when claim amounts become probable and estimable.Reserves for identified claims are based upon our own historical claims experience and third-party estimates ofsettlement costs. Reserves for IBNR claims are based upon our own claims data history, as well as industryaverages. All reserves are periodically reviewed for changes in facts and circumstances and adjustments are madeas necessary.
Revenue Recognition
We recognize revenue upon admission into a theme park for single day tickets and when products arereceived by customers for merchandise, culinary or other in-park spending. For season passes and other multi-useadmission products, revenue is deferred and recognized based on the terms of the admission product and itsestimated usage and is adjusted periodically.
We have entered into agreements with certain external theme park, zoo and other attraction operators, tojointly market and sell admission products. These joint products allow admission to both a Company park and anexternal park, zoo or other attraction. The agreements with the external parks specify the allocation of revenue tous from any jointly sold products. Deferred revenue is recorded based on the terms of the respective agreementand the related revenue is recognized over its related use.
Recently Issued Financial Accounting Standards
Refer to Note 3- Recently Issued Accounting Pronouncements, in our notes to the consolidated financialstatements included elsewhere in this Annual Report on Form 10-K.
Item 7A. Quantitative and Qualitative Disclosures about Market Risk
Inflation
The impact of inflation has affected, and will continue to affect, our operations significantly. Our costs offood, merchandise and other revenues are influenced by inflation and fluctuations in global commodity prices. Inaddition, costs for construction, repairs and maintenance are all subject to inflationary pressures.
63

Interest Rate Risk
We are exposed to market risks from fluctuations in interest rates, and to a lesser extent on currencyexchange rates, from time to time, on imported rides and equipment. The objective of our financial riskmanagement is to reduce the potential negative impact of interest rate and foreign currency exchange ratefluctuations to acceptable levels. We do not acquire market risk sensitive instruments for trading purposes.
We manage interest rate risk through the use of a combination of fixed-rate long-term debt and interest rateswaps that fix a portion of our variable-rate long-term debt.
The effective portion of changes in the fair value of derivatives designated and that qualify as cash flowhedges is recorded in accumulated other comprehensive (loss) income and is subsequently reclassified intoearnings in the period that the hedged forecasted transaction affects earnings. The ineffective portion of thechange in fair value of the derivatives is recognized directly in earnings. Amounts reported in accumulated othercomprehensive (loss) income related to derivatives will be reclassified to interest expense as interest paymentsare made on our variable-rate debt. During the next 12 months, our estimate is that an additional $2.5 million willbe reclassified as an increase to interest expense.
After considering the impact of interest rate swap agreements, at December 31, 2014, approximately$1,260.0 million of our outstanding long-term debt represents fixed-rate debt and approximately $352.4 millionrepresents variable-rate debt. Assuming an average balance on our revolving credit borrowings of approximately$40.0 million, a hypothetical 100 bps increase in 30-day LIBOR on our variable-rate debt would lead to anincrease of approximately $2.2 million in annual cash interest costs due to the impact of our fixed-rate swapagreements.
Item 8. Financial Statements and Supplementary Data
Our consolidated financial statements and the notes thereto are provided in Part IV, Item 15 of this AnnualReport on Form 10-K.
Item 9. Changes in and Disagreements with Accountants on Accounting and Financial Disclosure
None.
Item 9A. Controls and Procedures
Evaluation of Disclosure Controls and Procedures
Regulations under the Securities Exchange Act of 1934, as amended (the “Exchange Act”), require publiccompanies, including us, to maintain “disclosure controls and procedures,” which are defined in Rule 13a-15(e)and Rule 15d-15(e) of the Exchange Act to mean a company’s controls and other procedures that are designed toensure that information required to be disclosed in the reports that it files or submits under the Exchange Act isrecorded, processed, summarized and reported within the time periods specified in the SEC’s rules and forms andthat such information is accumulated and communicated to management, including our principal executiveofficer and principal financial officer, or persons performing similar functions, as appropriate to allow timelydecisions regarding required or necessary disclosures. In designing and evaluating our disclosure controls andprocedures, management recognizes that disclosure controls and procedures, no matter how well conceived andoperated, can provide only reasonable, not absolute, assurance that the objectives of the disclosure controls andprocedures are met. The design of any controls and procedures also is based on certain assumptions about thelikelihood of future events, and there can be no assurance that any design will succeed in achieving its statedgoals under all potential future conditions. Additionally, in designing disclosure controls and procedures, ourmanagement necessarily was required to apply its judgment in evaluating the cost-benefit relationship of possibledisclosure controls and procedures. Our management, with the participation of our principal executive officer and
64

principal financial officer, has evaluated the effectiveness of the design and operation of our disclosure controlsand procedures as of the end of the period covered by this report. Based upon that evaluation and subject to theforegoing, our principal executive officer and principal financial officer concluded that, as of the end of theperiod covered by this report, the design and operation of our disclosure controls and procedures were effectiveto accomplish their objectives at a reasonable assurance level.
Changes in Internal Control over Financial Reporting
Regulations under the Exchange Act require public companies, including our Company, to evaluate anychange in our “internal control over financial reporting” as such term is defined in Rule 13a-15(f) andRule 15d-15(f) of the Exchange Act. There have been no changes in our internal control over financial reportingduring the fiscal quarter ended December 31, 2014 that have materially affected, or that are reasonably likely tomaterially affect, our internal control over financial reporting.
Management’s Report on Internal Control Over Financial Reporting
As required by the SEC’s rules and regulations for the implementation of Section 404 of the Sarbanes-OxleyAct, our management is responsible for establishing and maintaining adequate internal control over financialreporting. Our internal control over financial reporting is designed to provide reasonable assurance regarding thereliability of financial reporting and the preparation of our consolidated financial statements for externalreporting purposes in accordance with accounting principles generally accepted in the United States of America.Our internal control over financial reporting includes those policies and procedures that (1) pertain to themaintenance of records that, in reasonable detail, accurately and fairly reflect the transactions and dispositions ofthe assets of the Company, (2) provide reasonable assurance that transactions are recorded as necessary to permitpreparation of consolidated financial statements in accordance with accounting principles generally accepted inthe United States of America, and that our receipts and expenditures are being made only in accordance withauthorizations of our management and directors, and (3) provide reasonable assurance regarding prevention ortimely detection of unauthorized acquisition, use or disposition of our assets that could have a material effect onthe consolidated financial statements.
Because of its inherent limitations, internal control over financial reporting may not prevent or detectmisstatements in our consolidated financial statements. Also, projections of any evaluation of effectiveness tofuture periods are subject to the risk that controls may become inadequate because of changes in conditions, orthat the degree of compliance with the policies or procedures may deteriorate.
Management assessed the effectiveness of the Company’s internal control over financial reporting as ofDecember 31, 2014. In making these assessments, management used the criteria set forth by the Committee ofSponsoring Organizations of the Treadway Commission (COSO) in Internal Control — Integrated Framework(2013). Based on our assessments and those criteria, management determined that the Company maintainedeffective internal control over financial reporting as of December 31, 2014.
The Company’s independent registered public accounting firm has issued a report on the Company’sinternal control over financial reporting. This report appears on page F-2 in this Annual Report on Form 10-K.
Item 9B. Other Information
Rule 10b5-1 Plans
Our policy governing transactions in our securities by our directors, officers and employees permits suchpersons to adopt stock trading plans pursuant to Rule 10b5-1 promulgated by the Securities and ExchangeCommission under the Securities Exchange Act of 1934, as amended. Our directors, officers and employees havein the past and may from time to time establish such stock trading plans. We do not undertake any obligation todisclose, or to update or revise any disclosure regarding, any such plans and specifically do not undertake todisclose the adoption, amendment, termination or expiration of any such plans.
65

Iran Threat Reduction and Syria Human Rights Act of 2012
Pursuant to Section 219 of the Iran Threat Reduction and Syria Human Rights Act of 2012, which addedSection 13(r) of the Exchange Act, the Company hereby incorporates by reference herein Exhibit 99.1 of thisreport, which includes disclosures publicly filed and/or provided to Blackstone, an affiliate of our majorstockholders, by Travelport Limited and Travelport Worldwide Limited., which may be considered theCompany’s affiliates.
66

PART III.
Item 10. Director, Executive Officers and Corporate Governance
The information required by this item will be included in our definitive proxy statement to be filed not laterthan 120 days after the end of the fiscal year covered by this Annual Report on Form 10-K and is incorporatedherein by reference.
Item 11. Executive Compensation
The information required by this item will be included in our definitive proxy statement to be filed not laterthan 120 days after the end of the fiscal year covered by this Annual Report on Form 10-K and is incorporatedherein by reference.
Item 12. Security Ownership of Certain Beneficial Owners and Management and Related StockholderMatters
The information required by this item will be included in our definitive proxy statement to be filed not laterthan 120 days after the end of the fiscal year covered by this Annual Report on Form 10-K and is incorporatedherein by reference.
Item 13. Certain Relationships and Related Transactions, and Director Independence
The information required by this item will be included in our definitive proxy statement to be filed not laterthan 120 days after the end of the fiscal year covered by this Annual Report on Form 10-K and is incorporatedherein by reference.
Item 14. Principal Accounting Fees and Services
The information required by this item will be included in our definitive proxy statement to be filed not laterthan 120 days after the end of the fiscal year covered by this Annual Report on Form 10-K and is incorporatedherein by reference.
67

PART IV.
Item 15. Exhibits, Financial Statement Schedules
(a) The following documents are filed as part of this report:
1. Consolidated Financial Statements
Report of Independent Registered Public Accounting Firm F-2
Consolidated Balance Sheets F-4
Consolidated Statements of Comprehensive Income F-5
Consolidated Statements of Changes in Stockholders’ Equity F-6
Consolidated Statements of Cash Flows F-7
Notes to Consolidated Financial Statements F-8 to F-46
2. Financial Statement Schedules
Schedule I—Registrant’s Condensed Financial Statements F-47 to F-53
Schedules not listed above have been omitted because the information required to be set forth therein isnot applicable or is shown in the financial statements or notes herein.
3. Exhibits
See the Exhibit Index beginning on page 70.
68

Pursuant to the requirements of Section 13 or 15(d) of the Securities Exchange Act of 1934, the Registranthas duly caused this report to be signed on its behalf by the undersigned, thereunto duly authorized.
SeaWorld Entertainment, Inc.Date: February 27, 2015
/s/ DAVID F. D’ALESSANDRO
Name: David F. D’AlessandroTitle: Interim Chief Executive Officer
Pursuant to the requirements of the Securities Exchange Act of 1934, this report has been signed below bythe following persons on behalf of the Registrant and in the capacities indicated:
Signature Date Capacity
/S/ DAVID F. D’ALESSANDRO
David F. D’Alessandro
February 27, 2015 Interim Chief Executive Officer andDirector (Principal Executive Officer)
/S/ JAMES M. HEANEY
James M. Heaney
February 27, 2015 Chief Financial Officer (PrincipalFinancial Officer)
/S/ MARC G. SWANSON
Marc G. Swanson
February 27, 2015 Chief Accounting Officer (PrincipalAccounting Officer)
/S/ JAMES ATCHISON
James Atchison
February 27, 2015 Director
/S/ JOSEPH BARATTA
Joseph Baratta
February 27, 2015 Director
/S/ WILLIAM GRAY
William Gray
February 27, 2015 Director
/S/ JUDITH A. MCHALE
Judith A. McHale
February 27, 2015 Director
/S/ THOMAS MOLONEY
Thomas Moloney
February 27, 2015 Director
/S/ ELLEN TAUSCHER
Ellen Tauscher
February 27, 2015 Director
/S/ DEBORAH M. THOMAS
Deborah M. Thomas
February 27, 2015 Director
/S/ PETER WALLACE
Peter Wallace
February 27, 2015 Director
69

Exhibit Index
Exhibit No. Description
3.1 Amended and Restated Certificate of Incorporation of SeaWorld Entertainment, Inc. (incorporatedby reference to Exhibit 3.1 to the Registrant’s Current Report on Form 8-K filed on April 24,2013) (No. 001-35883)
3.2 Amended and Restated Bylaws of SeaWorld Entertainment, Inc. (incorporated by reference toExhibit 3.2 to the Registrant’s Current Report on Form 8-K filed on December 12, 2014)(No. 001-35883)
4.1 Stockholders Agreement, dated as of April 24, 2013, among SeaWorld Entertainment, Inc. and theother parties thereto (incorporated by reference to Exhibit 4.1 to the Registrant’s Current Reporton Form 8-K filed on April 24, 2013)
10.1 Indenture, dated as of December 1, 2009, among SW Acquisitions Co., Inc., the guarantors namedtherein and Wilmington Trust FSB, as trustee (incorporated by reference to Exhibit 10.1 to theRegistrant’s Registration Statement on Form S-1 (No. 333-185697))
10.2 First Supplemental Indenture, dated as of August 30, 2011, among SeaWorld Parks &Entertainment, Inc. (f/k/a SW Acquisitions Co., Inc.), the guarantors named therein andWilmington Trust, National Association (as successor by merger to Wilmington Trust FSB), astrustee (incorporated by reference to Exhibit 10.2 to the Registrant’s Registration Statement onForm S-1 (No. 333-185697))
10.3 Second Supplemental Indenture, dated as of March 30, 2012, among SeaWorld Parks &Entertainment, Inc. (f/k/a SW Acquisitions Co., Inc.), the guarantors named therein andWilmington Trust, National Association (as successor by merger to Wilmington Trust FSB), astrustee (incorporated by reference to Exhibit 10.3 to the Registrant’s Registration Statement onForm S-1 (No. 333-185697))
10.4 Third Supplemental Indenture, dated as of December 17, 2012, among SeaWorld Parks &Entertainment, Inc., (f/k/a SW Acquisitions Co., Inc.), the guarantors named therein andWilmington Trust, National Association (as successor by merger to Wilmington Trust FSB), astrustee (incorporated by reference to Exhibit 10.4 to the Registrant’s Registration Statement onForm S-1 (No. 333-185697))
10.5 Fourth Supplemental Indenture, dated as of April 12, 2013, among SeaWorld Parks &Entertainment, Inc. (f/k/a SW Acquisition Co., Inc.), the guarantors named therein andWilmington Trust, National Association (as successor by merger to Wilmington Trust FSB), astrustee (incorporated by reference to Exhibit 10.42 to the Registrant’s Registration Statement onForm S-1 (No. 333-185697))
10.6 Fifth Supplemental Indenture, dated as of November 22, 2013, among SeaWorld Parks &Entertainment, Inc. (f/k/a SW Acquisition Co., Inc.), the guarantors named therein andWilmington Trust, National Association (as successor by merger to Wilmington Trust FSB), astrustee (incorporated by reference to Exhibit 10.1 to the Registrant’s Current Report on Form 8-Kfiled on November 25, 2013) (No. 001-35883)
10.7 Amendment No. 4, dated as of April 5, 2013, to the Credit Agreement, among SeaWorld Parks &Entertainment, Inc. (f/k/a SW Acquisitions Co., Inc.), the guarantors party thereto from time totime, Bank of America, N.A., as administrative agent, collateral agent, letter of credit issuer andswing line lender, Bank of America, N.A., as lead arranger and bookrunner, and the other agentsand lenders from time to time party thereto (the amended and restated Credit Agreement isincluded as Exhibit A hereto) (incorporated by reference to Exhibit 10.41 to the Registrant’sRegistration Statement on Form S-1 (No. 333-185697))
70

Exhibit No. Description
10.8 Amendment No. 5, dated as of May 14, 2013, to the Credit Agreement, among SeaWorld Parks &Entertainment, Inc. (f/k/a SW Acquisitions Co., Inc.), the guarantors party thereto from time totime, Bank of America, N.A., as administrative agent, collateral agent, Letter of Credit issuer andswing line lender, Merrill Lynch, Pierce, Fenner & Smith Incorporated and Bank of America,N.A., as joint lead arrangers, Merrill Lynch, Pierce, Fenner & Smith Incorporated, BarclaysCapital, Deutsche Bank Securities Inc., Goldman Sachs Lending Partners LLC, J.P. MorganSecurities LLC, Macquarie Capital (USA) Inc. and Mizuho Corporate Banks, Ltd. as jointbookrunners, Deutsche Bank Securities Inc. and Barclays Bank plc, as co-syndication agents, andthe other agents and lenders from time to time party thereto (the amended and restated CreditAgreement is included as Exhibit A hereto) (incorporated by reference to Exhibit 10.1 to theRegistrant’s Quarterly Report on Form 10-Q filed on May 23, 2013) (No. 001-35883)
10.9 Amendment No. 6, dated as of August 9, 2013, to the Credit Agreement, among SeaWorldParks & Entertainment, Inc. (f/k/a SW Acquisitions Co., Inc.), the guarantors party thereto fromtime to time, Bank of America, N.A., as administrative agent, collateral agent, Letter of Creditissuer and swing line lender, Merrill Lynch, Pierce, Fenner & Smith Incorporated and Bank ofAmerica, N.A., as joint lead arrangers, Merrill Lynch, Pierce, Fenner & Smith Incorporated,Barclays Capital, Deutsche Bank Securities Inc., Goldman Sachs Lending Partners LLC, J.P.Morgan Securities LLC, Macquarie Capital (USA) Inc. and Mizuho Corporate Banks, Ltd. as jointbookrunners, Deutsche Bank Securities Inc. and Barclays Bank plc, as co-syndication agents, andthe other agents and lenders from time to time party thereto (incorporated by reference to Exhibit10.7 to the Registrant’s Quarterly Report on Form 10-Q filed on August 14, 2013)(No. 001-35883)
10.10 Joinder Agreement, dated as of December 17, 2012, under the Credit Agreement, amongSeaWorld of Texas Holdings, LLC, SeaWorld of Texas Management, LLC, SeaWorld of TexasBeverage, LLC and Bank of America, N.A., as administrative agent and collateral agent(incorporated by reference to Exhibit 10.6 to the Registrant’s Registration Statement on Form S-1(No. 333-185697))
10.11 Security Agreement, dated as of December 1, 2009, among SW Acquisitions Co., Inc., the othergrantors named therein and Bank of America, N.A., as collateral agent (incorporated by referenceto Exhibit 10.7 to the Registrant’s Registration Statement on Form S-1 (No. 333-185697))
10.12 Supplement No. 1, dated as of December 17, 2012, to the Security Agreement among the grantorsidentified therein and Bank of America, N.A., as collateral agent (incorporated by reference toExhibit 10.8 to the Registrant’s Registration Statement on Form S-1 (No. 333-185697))
10.13 Pledge Agreement, dated as of December 1, 2009, between SeaWorld Entertainment, Inc.(f/k/a/SW Holdco, Inc.) and Bank of America, N.A., as collateral agent (incorporated by referenceto Exhibit 10.9 to the Registrant’s Registration Statement on Form S-1 (No. 333-185697))
10.14 Patent Security Agreement, dated as of December 1, 2009, by SeaWorld Parks & Entertainment(f/k/a Busch Entertainment LLC) in favor of Bank of America, N.A., as collateral agent(incorporated by reference to Exhibit 10.10 to the Registrant’s Registration Statement on Form S-1(No. 333-185697))
10.15 Trademark Security Agreement, dated as of December 1, 2009, by SeaWorld Parks &Entertainment (f/k/a Busch Entertainment LLC) in favor of Bank of America, N.A., as collateralagent (incorporated by reference to Exhibit 10.11 to the Registrant’s Registration Statement onForm S-1 (No. 333-185697))
10.16 Trademark Security Agreement, dated as of December 1, 2009, by Sea World LLC in favor ofBank of America, N.A., as collateral agent (incorporated by reference to Exhibit 10.12 to theRegistrant’s Registration Statement on Form S-1 (No. 333-185697))
71

Exhibit No. Description
10.17 Copyright Security Agreement, dated as of December 1, 2009, by SeaWorld Parks &Entertainment (f/k/a Busch Entertainment LLC) in favor of Bank of America, N.A., as collateralagent (incorporated by reference to Exhibit 10.13 to the Registrant’s Registration Statement onForm S-1 (No. 333-185697))
10.18 Copyright Security Agreement, dated as of December 1, 2009, by Sea World LLC in favor ofBank of America, N.A., as collateral agent (incorporated by reference to Exhibit 10.14 to theRegistrant’s Registration Statement on Form S-1 (No. 333-185697))
10.19 Registration Rights Agreement, dated December 1, 2009, by and among SeaWorld Entertainment,Inc. (f/k/a SW Holdco, Inc.), SW Cayman L.P. and the equityholders named therein (incorporatedby reference to Exhibit 10.17 to the Registrant’s Registration Statement on Form S-1(No. 333-185697))
10.20 Lease Amendment, dated January 9, 1978, by and between the City of San Diego and Sea WorldInc. (incorporated by reference to Exhibit 10.18 to the Registrant’s Registration Statement onForm S-1 (No. 333-185697))
10.21 Lease Amendment, dated March 6, 1979, by and between the City of San Diego and Sea WorldInc. (incorporated by reference to Exhibit 10.19 to the Registrant’s Registration Statement onForm S-1 (No. 333-185697))
10.22 Lease Amendment, dated December 12, 1983, by and between the City of San Diego and SeaWorld Inc. (incorporated by reference to Exhibit 10.20 to the Registrant’s Registration Statementon Form S-1 (No. 333-185697))
10.23 Lease Amendment, dated June 24, 1985, by and between the City of San Diego and Sea WorldInc. (incorporated by reference to Exhibit 10.21 to the Registrant’s Registration Statement onForm S-1 (No. 333-185697))
10.24 Lease Amendment, dated September 22, 1986, by and between the City of San Diego and SeaWorld Inc. (incorporated by reference to Exhibit 10.22 to the Registrant’s Registration Statementon Form S-1 (No. 333-185697))
10.25 Lease Amendment, dated June 29, 1998, by and between the City of San Diego and Sea WorldInc. (incorporated by reference to Exhibit 10.23 to the Registrant’s Registration Statement onForm S-1 (No. 333-185697))
10.26 Lease Amendment, dated July 9, 2002, by and between the City of San Diego and Sea World Inc.(incorporated by reference to Exhibit 10.24 to the Registrant’s Registration Statement on Form S-1(No. 333-185697))
10.27 Trademark License Agreement, dated December 1, 2009, by and between Anheuser- BuschIncorporated and Busch Entertainment LLC (incorporated by reference to Exhibit 10.25 to theRegistrant’s Registration Statement on Form S-1 (No. 333-185697))
10.28 Amended and Restated Agreement, dated April 1, 1983, by and between SeaWorld Parks &Entertainment LLC (f/k/a SPI, Inc.) and Sesame Workshop (f/k/a Children’s TelevisionWorkshop) (Portions of this exhibit have been omitted pursuant to a request for confidentialtreatment) (incorporated by reference to Exhibit 10.26 to the Registrant’s Registration Statementon Form S-1 (No. 333-185697))
10.29 Amendment, dated August 24, 2006, to the Amended and Restated Agreement, dated April 1,1983, by and between SeaWorld Parks & Entertainment LLC (f/k/a SPI, Inc.) and SesameWorkshop (f/k/a Children’s Television Workshop) (incorporated by reference to Exhibit 10.27 tothe Registrant’s Registration Statement on Form S-1 (No. 333-185697))
72

Exhibit No. Description
10.30 License Agreement, dated August 24, 2006, by and between Sesame Workshop and SeaWorldParks & Entertainment LLC (f/k/a Busch Entertainment Corporation) (Portions of this exhibithave been omitted pursuant to a request for confidential treatment) (incorporated by reference toExhibit 10.28 to the Registrant’s Registration Statement on Form S-1 (No. 333-185697))
10.31 Change in Control Notification and Consent, dated October 6, 2009, pursuant to the licenseagreement, dated April 1, 1983, as amended on August 24, 2006, between SeaWorld Parks &Entertainment LLC (f/k/a Busch Entertainment Corporation) and Sesame Workshop (incorporatedby reference to Exhibit 10.29 to the Registrant’s Registration Statement on Form S-1(No. 333-185697))
10.32 Change in Control Notification and Consent, dated October 6, 2009, pursuant to the licenseagreement, dated August 24, 2006, between SeaWorld Parks & Entertainment LLC (f/k/a BuschEntertainment Corporation) and Sesame Workshop (incorporated by reference to Exhibit 10.30 tothe Registrant’s Registration Statement on Form S-1 (No. 333-185697))
10.33 Second Amended and Restated Equityholders Agreement, dated as of April 11, 2011 (incorporatedby reference to Exhibit 10.38 to the Registrant’s Registration Statement on Form S-1(No. 333-185697))
10.34 Amended and Restated 2009 Advisory Agreement, dated as of March 22, 2013 (incorporated byreference to Exhibit 10.32 to the Registrant’s Registration Statement on Form S-1(No. 333-185697))
10.35† 2013 Omnibus Incentive Plan (incorporated by reference to Exhibit 10.31 to the Registrant’sRegistration Statement on Form S-1 (No. 333-185697))
10.36† Form of Restricted Stock Grant and Acknowledgment (incorporated by reference to Exhibit 10.15to the Registrant’s Registration Statement on Form S-1 (No. 333-185697))
10.37† Form of Restricted Stock Agreement (incorporated by reference to Exhibit 10.40 to theRegistrant’s Registration Statement on Form S-1 (No. 333-185697))
10.38† SeaWorld Parks & Entertainment, Inc. Key Employee Severance Plan, effective August 1, 2010(incorporated by reference to Exhibit 10.37 to the Registrant’s Registration Statement on Form S-1(No. 333-185697))
10.39† Offer Letter to James M. Heaney, dated January 17, 2012 (incorporated by reference toExhibit 10.33 to the Registrant’s Registration Statement on Form S-1 (No. 333-185697))
10.40† Offer Letter to Scott D. Helmstedter, dated February 16, 2011 (incorporated by reference toExhibit 10.34 to the Registrant’s Registration Statement on Form S-1 (No. 333-185697))
10.41† Offer Letter to David D’Alessandro, dated September 1, 2010 (incorporated by reference toExhibit 10.35 to the Registrant’s Registration Statement on Form S-1 (No. 333-185697))
10.42† Summary Compensation Letter to Donald W. Mills Jr., dated April 22, 2010 (incorporated byreference to Exhibit 10.36 to the Registrant’s Registration Statement on Form S-1(No. 333-185697))
10.43 Form of Share Repurchase Agreement between SeaWorld Entertainment, Inc. and the Partnerships(incorporated by reference to Exhibit 10.45 to the Registrant’s Registration Statement on Form S-1(No. 333-192420))
10.44† Amended and Restated Outside Director Compensation Policy (incorporated by reference toExhibit 10.3 to the Registrant’s Quarterly Report on Form 10-Q for the quarter ended March 31,2014) (No. 001-35883)
73

Exhibit No. Description
10.45†* Separation and Consulting Agreement, dated December 10, 2014, by and between SeaWorldEntertainment, Inc. and James Atchison
10.46†* Restricted Stock Award Agreement, dated January 15, 2015, by and between SeaWorldEntertainment, Inc. and David D’Alessandro
21.1 List of Subsidiaries (incorporated by reference to Exhibit 21.1 to the Registrant’s RegistrationStatement on Form S-1 (No. 333-185697))
23.1* Consent of Deloitte & Touche LLP
31.1* Certification of Annual Report by Chief Executive Officer under Section 302 of the Sarbanes-Oxley Act of 2002
31.2* Certification of Annual Report by Chief Financial Officer under Section 302 of the Sarbanes-Oxley Act of 2002
32.1* Certification of Chief Executive Officer Pursuant to 18 U.S.C Section 1350 as adopted pursuant toSection 906 of the Sarbanes-Oxley Act of 2002
32.2* Certification of Chief Financial Officer Pursuant to 18 U.S.C Section 1350 as adopted pursuant toSection 906 of the Sarbanes-Oxley Act of 2002
99.1* Section 13(r) Disclosure
101.INS** XBRL Instance Document
101.SCH** XBRL Taxonomy Extension Schema Document
101.CAL** XBRL Taxonomy Extension Calculation Linkbase Document
101.DEF** XBRL Taxonomy Extension Definition Linkbase Document
101.LAB** XBRL Taxonomy Extension Label Linkbase Document
101.PRE** XBRL Taxonomy Extension Presentation Linkbase Document
† Identifies exhibits that consist of a management contract or compensatory plan or arrangement.* Filed herewith.** XBRL (Extensible Business Reporting Language) information is furnished and not filed for purposes of
Sections 11 and 12 of the Securities Act of 1933 and Section 18 of the Securities Exchange Act of 1934.
74

SEAWORLD ENTERTAINMENT, INC.
Index to Consolidated Financial Statements
PageNumber
Report of Independent Registered Public Accounting Firm F-2
Consolidated Balance Sheets as of December 31, 2014 and 2013 F-4
Consolidated Statements of Comprehensive Income for the Years Ended December 31, 2014, 2013 and2012 F-5
Consolidated Statements of Changes in Stockholders’ Equity for the Years Ended December 31, 2014,2013 and 2012 F-6
Consolidated Statements of Cash Flows for the Years Ended December 31, 2014, 2013 and 2012 F-7
Notes to Consolidated Financial Statements F-8
Schedule I—Registrant’s Condensed Financial Statements F-47
F-1

REPORT OF INDEPENDENT REGISTERED PUBLIC ACCOUNTING FIRM
To the Board of Directors and Stockholders ofSeaWorld Entertainment, Inc.Orlando, Florida
We have audited the accompanying consolidated balance sheets of SeaWorld Entertainment, Inc. and subsidiaries(the “Company”) as of December 31, 2014 and 2013, and the related consolidated statements of comprehensiveincome, changes in stockholders’ equity, and cash flows for each of the three years in the period endedDecember 31, 2014. Our audits also included the financial statement schedule listed in the Index at Page F-1. Wealso have audited the Company’s internal control over financial reporting as of December 31, 2014, based oncriteria established in Internal Control — Integrated Framework (2013) issued by the Committee of SponsoringOrganizations of the Treadway Commission. The Company’s management is responsible for these financialstatements and financial statement schedule, for maintaining effective internal control over financial reporting,and for its assessment of the effectiveness of internal control over financial reporting, included in theaccompanying Management’s Report on Internal Control over Financial Reporting. Our responsibility is toexpress an opinion on these financial statements and financial statement schedule and an opinion on theCompany’s internal control over financial reporting based on our audits.
We conducted our audits in accordance with the standards of the Public Company Accounting Oversight Board(United States). Those standards require that we plan and perform the audit to obtain reasonable assurance aboutwhether the financial statements are free of material misstatement and whether effective internal control overfinancial reporting was maintained in all material respects. Our audits of the financial statements includedexamining, on a test basis, evidence supporting the amounts and disclosures in the financial statements, assessingthe accounting principles used and significant estimates made by management, and evaluating the overallfinancial statement presentation. Our audit of internal control over financial reporting included obtaining anunderstanding of internal control over financial reporting, assessing the risk that a material weakness exists, andtesting and evaluating the design and operating effectiveness of internal control based on the assessed risk. Ouraudits also included performing such other procedures as we considered necessary in the circumstances. Webelieve that our audits provide a reasonable basis for our opinions.
A company’s internal control over financial reporting is a process designed by, or under the supervision of, thecompany’s principal executive and principal financial officers, or persons performing similar functions, andeffected by the company’s board of directors, management, and other personnel to provide reasonable assuranceregarding the reliability of financial reporting and the preparation of financial statements for external purposes inaccordance with generally accepted accounting principles. A company’s internal control over financial reportingincludes those policies and procedures that (1) pertain to the maintenance of records that, in reasonable detail,accurately and fairly reflect the transactions and dispositions of the assets of the company; (2) provide reasonableassurance that transactions are recorded as necessary to permit preparation of financial statements in accordancewith generally accepted accounting principles and that receipts and expenditures of the company are being madeonly in accordance with authorizations of management and directors of the company; and (3) provide reasonableassurance regarding prevention or timely detection of unauthorized acquisition, use, or disposition of thecompany’s assets that could have a material effect on the financial statements.
Because of the inherent limitations of internal control over financial reporting, including the possibility ofcollusion or improper management override of controls, material misstatements due to error or fraud may not beprevented or detected on a timely basis. Also, projections of any evaluation of the effectiveness of the internalcontrol over financial reporting to future periods are subject to the risk that the controls may become inadequatebecause of changes in conditions, or that the degree of compliance with the policies or procedures maydeteriorate.
In our opinion, the consolidated financial statements referred to above present fairly, in all material respects, thefinancial position of SeaWorld Entertainment, Inc. and subsidiaries as of December 31, 2014 and 2013, and the
F-2

results of their operations and their cash flows for each of the three years in the period ended December 31, 2014,in conformity with accounting principles generally accepted in the United States of America. Also, in ouropinion, such financial statement schedule, when considered in relation to the basic consolidated financialstatements taken as a whole, presents fairly, in all material respects, the information set forth therein. Also, in ouropinion, the Company maintained, in all material respects, effective internal control over financial reporting as ofDecember 31, 2014, based on the criteria established in Internal Control — Integrated Framework (2013) issuedby the Committee of Sponsoring Organizations of the Treadway Commission.
/s/ DELOITTE & TOUCHE LLP
Certified Public AccountantsTampa, FloridaFebruary 26, 2015
F-3

SEAWORLD ENTERTAINMENT, INC. AND SUBSIDIARIESCONSOLIDATED BALANCE SHEETS
(In thousands, except share and per share amounts)
December 31,
2014 2013
AssetsCurrent assets:
Cash and cash equivalents $ 43,906 $ 116,841Accounts receivable, net 37,002 41,509Inventories 33,134 36,209Prepaid expenses and other current assets 20,894 19,613Deferred tax assets, net 7,268 28,887
Total current assets 142,204 243,059Property and equipment, at cost 2,612,052 2,485,805Accumulated depreciation (867,421) (714,305)
Property and equipment, net 1,744,631 1,771,500Goodwill 335,610 335,610Trade names/trademarks, net 164,188 163,508Other intangible assets, net 24,525 27,843Other assets 31,316 35,890
Total assets $2,442,474 $2,577,410
Liabilities and Stockholders’ EquityCurrent liabilities:
Accounts payable $ 88,279 $ 98,500Current maturities on long-term debt 14,050 14,050Accrued salaries, wages and benefits 19,068 23,996Deferred revenue 79,367 82,945Dividends payable 172 17,939Other accrued expenses 20,149 15,264
Total current liabilities 221,085 252,694Long-term debt 1,589,403 1,632,531Deferred tax liabilities, net 31,760 25,670Other liabilities 20,691 18,488
Total liabilities 1,862,939 1,929,383
Commitments and contingencies (Note 14)Stockholders’ Equity:
Preferred stock, $0.01 par value—authorized, 100,000,000 shares, no sharesissued or outstanding at December 31, 2014 and 2013 — —
Common stock, $0.01 par value—authorized, 1,000,000,000 shares;90,191,100 shares issued at December 31, 2014 and 89,900,453 sharesissued at December 31, 2013 902 899
Additional paid-in capital 655,471 689,394Accumulated other comprehensive (loss) income (483) 11Retained earnings 33,516 1,886Treasury stock, at cost (4,105,970 shares at December 31, 2014 and
1,500,000 shares at December 31, 2013) (109,871) (44,163)
Total stockholders’ equity 579,535 648,027
Total liabilities and stockholders’ equity $2,442,474 $2,577,410
See accompanying notes to consolidated financial statements.
F-4

SEAWORLD ENTERTAINMENT, INC. AND SUBSIDIARIESCONSOLIDATED STATEMENTS OF COMPREHENSIVE INCOME
FOR THE YEARS ENDED DECEMBER 31, 2014, 2013 AND 2012(In thousands, except per share amounts)
Year Ended December 31,
2014 2013 2012
Net revenues:Admissions $ 859,426 $ 921,016 $ 884,407Food, merchandise and other 518,386 539,234 539,345
Total revenues 1,377,812 1,460,250 1,423,752
Costs and expenses:Cost of food, merchandise and other revenues 109,024 114,192 118,559Operating expenses (exclusive of depreciation and amortization
shown separately below) 727,659 743,322 730,582Selling, general and administrative 189,369 187,298 184,920Restructuring and other related costs 11,567 — —Separation costs 2,574 — —Secondary offering costs 747 1,407 —Termination of advisory agreement — 50,072 —Depreciation and amortization 176,275 166,086 166,975
Total costs and expenses 1,217,215 1,262,377 1,201,036
Operating income 160,597 197,873 222,716Other income, net (198) (241) (1,563)Interest expense 81,543 90,622 110,565Loss on early extinguishment of debt and write-off of discounts
and deferred financing costs 461 29,858 2,053
Income before income taxes 78,791 77,634 111,661Provision for income taxes 28,872 25,714 37,440
Net income $ 49,919 $ 51,920 $ 74,221
Other comprehensive income:Unrealized (loss) gain on derivatives, net of tax (494) 1,265 (1,254)
Comprehensive income $ 49,425 $ 53,185 $ 72,967
Earnings per share:Net income per share, basic $ 0.57 $ 0.59 $ 0.90
Net income per share, diluted $ 0.57 $ 0.59 $ 0.89
Weighted average commons shares outstanding:Basic 87,183 87,537 82,480
Diluted 87,480 88,152 83,552
See accompanying notes to consolidated financial statements.
F-5

SEAWORLD ENTERTAINMENT, INC. AND SUBSIDIARIESCONSOLIDATED STATEMENTS OF CHANGES IN STOCKHOLDERS’ EQUITY
FOR THE YEARS ENDED DECEMBER 31, 2014, 2013 AND 2012(In thousands, except per share and share amounts)
Shares ofCommon Stock
IssuedCommon
Stock
AdditionalPaid-InCapital
(AccumulatedDeficit)
RetainedEarnings
AccumulatedOther
Comprehensive(Loss) Income
TreasuryStock, at
Cost
TotalStockholders’
Equity
Balance at December 31, 2011 82,418,808 $824 $ 955,735 $(88,416) $ — $ — $ 868,143Equity-based compensation 318,200 3 1,188 — — — 1,191Unrealized loss on derivatives,
net of tax benefit of $627 — — — — (1,254) — (1,254)Cash dividends declared to
stockholders ($6.07 per share) — — (500,000) — — — (500,000)Net income — — — 74,221 — — 74,221
Balance at December 31, 2012 82,737,008 827 456,923 (14,195) (1,254) — 442,301Equity-based compensation 74,561 1 6,025 — — — 6,026Unrealized gain on derivatives,
net of tax expense of $632 — — — — 1,265 — 1,265Issuance of common stock in
initial public offering, net ofunderwriter commissions andoffering costs 10,000,000 100 245,341 — — — 245,441
Conversion of common stockinto unvested restricted shares (3,216,719) (32) 32 — — — —
Vesting of restricted shares 334,066 3 (3) — — — —Shares withheld for tax
withholdings (28,463) — (852) — — — (852)Cash dividends declared to
stockholders ($0.60 pershare), net of forfeitures — — (18,072) (35,839) — — (53,911)
Repurchase of 1,500,000 sharesof treasury stock, at cost — — — — — (44,163) (44,163)
Net income — — — 51,920 — — 51,920
Balance at December 31, 2013 89,900,453 899 689,394 1,886 11 (44,163) 648,027Equity-based compensation — — 2,349 — — — 2,349Unrealized loss on derivatives,
net of tax benefit of $286 — — — — (494) — (494)Vesting of restricted shares 299,583 3 (3) — — — —Shares withheld for tax
withholdings (8,936) — (213) — — — (213)Cash dividends declared to
stockholders ($0.62 pershare), net of forfeitures — — (36,056) (18,289) — — (54,345)
Repurchase of 2,605,970 sharesof treasury stock, at cost — — — — — (65,708) (65,708)
Net income — — — 49,919 — — 49,919
Balance at December 31, 2014 90,191,100 $902 $ 655,471 $ 33,516 $ (483) $(109,871) $ 579,535
See accompanying notes to consolidated financial statements.
F-6

SEAWORLD ENTERTAINMENT, INC. AND SUBSIDIARIESCONSOLIDATED STATEMENTS OF CASH FLOWS
FOR THE YEARS ENDED DECEMBER 31, 2014, 2013 AND 2012(In thousands)
Year Ended December 31,
2014 2013 2012
Cash Flows From Operating Activities:Net income $ 49,919 $ 51,920 $ 74,221
Adjustments to reconcile net income to net cash provided by operating activities:Depreciation and amortization 176,275 166,086 166,975Amortization of debt issuance costs and discounts 9,399 10,869 13,896Loss on sale or disposal of assets 5,792 10,100 11,223Loss on early extinguishment of debt and write-off of discounts and deferred financing
costs 461 29,858 2,053Deferred income tax provision 28,000 24,728 36,937Equity-based compensation 2,349 6,025 1,191
Changes in assets and liabilities:Accounts receivable 6,256 (3,215) 4,651Inventories 2,709 (166) (4,156)Prepaid expenses and other current assets (1,276) (5,343) (1,327)Accounts payable (8,791) 4,293 (6,247)Accrued salaries, wages and benefits (4,928) (9,092) 899Deferred revenue (6,089) 94 (1,444)Other accrued expenses (763) (824) (760)Other assets and liabilities 2,219 1,128 1,328
Net cash provided by operating activities 261,532 286,461 299,440
Cash Flows From Investing Activities:Capital expenditures (154,641) (166,258) (191,745)Acquisition of Knott’s Soak City Water Park — — (12,000)Acquisition of intangible assets (1,900) — —Change in restricted cash (5) (118) (573)
Net cash used in investing activities (156,546) (166,376) (204,318)
Cash Flows From Financing Activities:Repayment of long-term debt (45,537) (189,255) (57,680)Purchase of treasury stock (60,058) (44,163) —Proceeds from draw on revolving credit facility 40,000 35,000 61,000Repayment of revolving credit facility (40,000) (35,000) (97,000)Dividends paid to stockholders (72,113) (36,175) (502,977)Proceeds from the issuance of debt — 1,455 487,163Debt issuance costs — (10,635) (2,951)Payment of tax withholdings on equity-based compensation through shares withheld (213) (852) —Proceeds from issuance of common stock in initial public offering, net of underwriter
commissions — 253,800 —Repayment of note payable — (3,000) —Redemption premium payment — (15,400) —Offering costs — (4,694) (3,665)
Net cash used in financing activities (177,921) (48,919) (116,110)
Change in Cash and Cash Equivalents (72,935) 71,166 (20,988)Cash and Cash Equivalents—Beginning of period 116,841 45,675 66,663
Cash and Cash Equivalents—End of period $ 43,906 $ 116,841 $ 45,675
Supplemental Disclosures of Noncash Investing and Financing ActivitiesDividends declared, but unpaid $ 172 $ 17,939 $ 203
Capital expenditures in accounts payable $ 25,730 $ 27,160 $ 22,696
Issuance of notes payable related to business acquisition $ — $ — $ 3,000
Treasury stock purchases settled in January 2015 $ 5,650 $ — $ —
See accompanying notes to consolidated financial statements.
F-7

SEAWORLD ENTERTAINMENT, INC. AND SUBSIDIARIESNOTES TO CONSOLIDATED FINANCIAL STATEMENTS
(DOLLARS IN THOUSANDS, EXCEPT PER SHARE AMOUNTS)
1. DESCRIPTION OF THE BUSINESS
SeaWorld Entertainment, Inc., through its wholly-owned subsidiary, SeaWorld Parks & Entertainment, Inc.(“SEA”) (collectively, the “Company”), owns and operates eleven theme parks within the United States. Prior toDecember 1, 2009, the Company did not have any operations. On December 1, 2009, the Company acquired allof the outstanding equity interests of Busch Entertainment LLC and affiliates from Anheuser-Busch Companies,Inc. and Anheuser-Busch InBev SA/NV (“ABI”). At that time, the Company was owned by ten limitedpartnerships (the “Partnerships” or the “selling stockholders”), ultimately owned by affiliates of The BlackstoneGroup L.P. (“Blackstone”) and certain co-investors. The Company completed an initial public offering in April2013, and the selling stockholders sold shares of common stock in April 2013, December 2013 and April 2014.See further discussion in Note 19–Stockholders’ Equity.
The Company operates SeaWorld theme parks in Orlando, Florida; San Antonio, Texas; and San Diego,California, and Busch Gardens theme parks in Tampa, Florida, and Williamsburg, Virginia. The Companyoperates water park attractions in Orlando, Florida (Aquatica); San Diego, California (Aquatica); Tampa, Florida(Adventure Island); and Williamsburg, Virginia (Water Country USA). The Company also operates areservations-only attraction offering interaction with marine animals (Discovery Cove) and a seasonal park inLanghorne, Pennsylvania (Sesame Place).
During the years ended December 31, 2014, 2013 and 2012 approximately 56%, 55% and 55% of the Company’srevenues were generated in the State of Florida, respectively.
2. SUMMARY OF SIGNIFICANT ACCOUNTING POLICIES
Basis of Presentation and Principles of Consolidation
The accompanying consolidated financial statements of the Company have been prepared in accordance withaccounting principles generally accepted in the United States of America (“GAAP”). All intercompany accountshave been eliminated in consolidation.
Use of Estimates
The preparation of financial statements and related disclosures in conformity with GAAP requires managementto make estimates and assumptions that affect the reported amounts of assets and liabilities and disclosure ofcontingent assets and liabilities at the date of the consolidated financial statements and the reported amounts ofrevenues and expenses during the reporting periods. Significant estimates and assumptions include, but are notlimited to, the accounting for self-insurance, deferred tax assets, deferred revenue, equity compensation and thevaluation of goodwill and other indefinite-lived intangible assets. Actual results could differ from thoseestimates.
Revision of Previously Issued Financial Statements
In the third quarter of 2014, the Company conducted an internal review of its application of the guidance inAccounting Standards Codification (“ASC”) 470-50, Debt-Modifications and Extinguishments, to its accountingfor certain debt transactions in 2013, 2012 and 2011. As a result of this review and analysis, the Companydetermined that it had incorrectly applied the accounting guidance in ASC 470-50 and inappropriately accountedfor certain fees as a result of modifications and prepayments in certain years. In accordance with ASC 250(Securities and Exchange Commission (“SEC”) Staff Accounting Bulletin 99, Assessing Materiality), theCompany concluded that the correction of the errors was not material to any of its previously issued annual or
F-8

SEAWORLD ENTERTAINMENT, INC. AND SUBSIDIARIESNOTES TO CONSOLIDATED FINANCIAL STATEMENTS
(DOLLARS IN THOUSANDS, EXCEPT PER SHARE AMOUNTS)
interim financial statements. The Company has revised its previously issued financial statements contained inthis Annual Report on Form 10-K to correct the effect of these immaterial errors for the corresponding periods.See further discussion in the Revision of Previously Issued Financial Statements section of Note 11–Long-TermDebt.
Cash and Cash Equivalents
Cash and cash equivalents include cash held at financial institutions as well as operating cash onsite at eachtheme park to fund daily operations and amounts due from third-party credit card companies with settlementterms of less than four days. The amounts due from third-party credit card companies totaled $8,381 and $9,776at December 31, 2014 and 2013, respectively. The cash balances in non-interest bearing accounts held atfinancial institutions are fully insured by the Federal Deposit Insurance Corporation (“FDIC”) throughDecember 31, 2014. Interest bearing accounts are insured up to $250. At times, cash balances may exceedfederally insured amounts and potentially subject the Company to a concentration of credit risk. Managementbelieves that no significant concentration of credit risk exists with respect to these cash balances because of itsassessment of the creditworthiness and financial viability of the respective financial institutions.
Accounts Receivable—Net
Accounts receivable are reported at net realizable value and consist primarily of amounts due from customers forthe sale of admission products. The Company is not exposed to a significant concentration of credit risk. TheCompany records an allowance for estimated uncollectible receivables, based on the amount and status of past-due accounts, contractual terms of the receivables and the Company’s history of uncollectible accounts. For allperiods presented, the allowance for uncollectible accounts and the related provision were insignificant.
Inventories
Inventories are stated at the lower of cost or market value with the cost being determined by the weightedaverage cost method. Inventories consist primarily of products for resale, including merchandise, culinary itemsand miscellaneous supplies. Obsolete or excess inventories are recorded at their estimated realizable value.
Restricted Cash
Restricted cash is recorded in other current assets and consists of funds received from strategic partners for use inapproved marketing and promotional activities.
Property and Equipment—Net
Property and equipment are recorded at cost. The cost of ordinary or routine maintenance, repairs, spare parts andminor renewals is expensed as incurred. Internal development costs associated with new attractions, rides andproduct development are capitalized after necessary feasibility studies have been completed and final concept orcontracts have been approved. The cost of assets is depreciated using the straight-line method based on thefollowing estimated useful lives:
Land improvements 10-40 yearsBuildings 5-40 yearsRides, attractions and equipment 3-20 yearsAnimals 1-50 years
F-9

SEAWORLD ENTERTAINMENT, INC. AND SUBSIDIARIESNOTES TO CONSOLIDATED FINANCIAL STATEMENTS
(DOLLARS IN THOUSANDS, EXCEPT PER SHARE AMOUNTS)
Material costs to purchase animals exhibited in the theme parks are capitalized and amortized over theirestimated lives (1-50 years). All costs to maintain animals are expensed as incurred, including in-house animalbreeding costs, as they are insignificant to the consolidated financial statements. Construction in process assetsconsist primarily of new rides, attractions and infrastructure improvements that have not yet been placed inservice. These assets are stated at cost and are not depreciated. Once construction of the assets is completed andplaced into service, assets are reclassified to the appropriate asset class based on their nature and depreciated inaccordance with the useful lives above. Debt interest is capitalized on all construction projects. Total interestcapitalized for the years ended December 31, 2014 and 2013, was $2,629 and $4,347, respectively.
Computer System Development Costs
The Company capitalizes computer system development costs that meet established criteria and, once placed inservice, amortizes those costs to expense on a straight-line basis over five years. Total capitalized costs related tocomputer system development costs, net of accumulated amortization, were $10,287 and $7,350, as ofDecember 31, 2014 and 2013, respectively, and are recorded in other assets in the accompanying consolidatedbalance sheets. Accumulated amortization was $8,841 and $6,199 as of December 31, 2014 and 2013,respectively. Amortization expense of capitalized computer system development costs during the years endedDecember 31, 2014, 2013 and 2012 was $2,703, $1,949 and $969, respectively, and is recorded in depreciationand amortization in the accompanying consolidated statements of comprehensive income. Systems reengineeringcosts do not meet the proper criteria for capitalization and are expensed as incurred.
Impairment of Long-Lived Assets
All long-lived assets are reviewed for impairment upon the occurrence of events or changes in circumstances thatwould indicate that the carrying value of the assets may not be recoverable. An impairment loss may berecognized when estimated undiscounted future cash flows expected to result from the use of the asset, includingdisposition, are less than the carrying value of the asset. The measurement of the impairment loss to berecognized is based upon the difference between the fair value and the carrying amounts of the assets. Fair valueis generally determined based upon a discounted cash flow analysis. In order to determine if an asset has beenimpaired, assets are grouped and tested at the lowest level for which identifiable independent cash flows areavailable (generally a theme park). No impairment losses were recognized during the years ended December 31,2014, 2013 and 2012.
Goodwill and Other Indefinite-Lived Intangible Assets
Goodwill and other indefinite-lived intangible assets are not amortized, but instead reviewed for impairment atleast annually on December 1, and as of an interim date should factors or indicators become apparent that wouldrequire an interim test, with ongoing recoverability based on applicable reporting unit performance andconsideration of significant events or changes in the overall business environment. In assessing goodwill forimpairment, the Company may choose to initially evaluate qualitative factors to determine if it is more likelythan not that the fair value of a reporting unit is less than its carrying amount. The Company considers severalfactors, including macroeconomic conditions, industry and market conditions, overall financial performance ofthe reporting unit, changes in management, strategy or customers, and relevant reporting unit specific events suchas a change in the carrying amount of net assets, a more-likely-than-not expectation of selling or disposing all, ora portion, of a reporting unit, and the testing for recoverability of a significant asset group within a reporting unit.If this qualitative assessment results in a conclusion that it is more likely than not that the fair value of a reportingunit exceeds the carrying value, then no further testing is performed for that reporting unit. If the qualitativeassessment is not conclusive and it is necessary to calculate the fair value of a reporting unit, then the impairment
F-10

SEAWORLD ENTERTAINMENT, INC. AND SUBSIDIARIESNOTES TO CONSOLIDATED FINANCIAL STATEMENTS
(DOLLARS IN THOUSANDS, EXCEPT PER SHARE AMOUNTS)
analysis for goodwill is performed at the reporting unit level using a two-step approach. The Company may alsochoose to perform this two-step impairment analysis instead of the qualitative analysis. The first step is acomparison of the fair value of the reporting unit, determined using the income and market approach, to itsrecorded amount. If the recorded amount exceeds the fair value, the second step quantifies any impairment write-down by comparing the current implied value of goodwill to the recorded goodwill balance. The Company’sother indefinite-lived intangible assets consist of certain trade names/trademarks which, after considering legal,regulatory, contractual, and other competitive and economic factors, are determined to have indefinite lives andare tested for impairment using the relief from royalty method. The Company performed a quantitativeassessment of goodwill and other indefinite-lived intangible assets at December 1, 2014 and 2012 and aqualitative assessment of goodwill and other indefinite-lived intangible assets at December 1, 2013 and found noimpairments.
Other Intangible Assets
The Company’s other intangible assets consist primarily of certain trade names/trademarks, relationships withticket resellers, a favorable lease asset and a non-compete agreement. These intangible assets are amortized onthe straight-line basis over their estimated remaining lives.
Self-Insurance Reserves
Reserves are recorded for the estimated amounts of guest and employee claims and expenses incurred eachperiod that are not covered by insurance. Reserves are established for both identified claims and incurred but notreported (“IBNR”) claims. Such amounts are accrued for when claim amounts become probable and estimable.Reserves for identified claims are based upon the Company’s historical claims experience and third-partyestimates of settlement costs. Reserves for IBNR claims are based upon the Company’s claims data history,actuarially determined loss development factors and qualitative considerations such as claims managementactivities. The Company maintains self-insurance reserves for healthcare, auto, general liability and workerscompensation claims. Total claims reserves were $27,127 at December 31, 2014, of which $2,977 is recorded inaccrued salaries, wages and benefits, $7,800 is recorded in other accrued expenses and the remaining long-termportion is recorded in other liabilities in the accompanying consolidated balance sheets. Total claims reserveswere $24,643 at December 31, 2013, of which $2,905 is recorded in accrued salaries, wages and benefits, $7,800is recorded in other accrued expenses and the remaining long-term portion is recorded in other liabilities in theaccompanying consolidated balance sheets. All reserves are periodically reviewed for changes in facts andcircumstances and adjustments are made as necessary.
Debt Financing Costs
Deferred financing costs are amortized to interest expense using the effective interest method over the term of theSenior Secured Credit Facilities or the Senior Notes and are included in other assets in the accompanyingconsolidated balance sheets.
Share Repurchase Program and Treasury Stock
From time to time, the Company’s Board of Directors (the “Board”) may authorize share repurchases of commonstock. Shares repurchased under Board authorizations are held in treasury for general corporate purposes. TheCompany accounts for treasury stock on the trade date under the cost method. Treasury stock at December 31,2014 and 2013 is recorded as a reduction to stockholders’ equity as the Company does not currently intend toretire the treasury stock held. See further discussion of the Company’s Share Repurchase Program in Note 19–Stockholders’ Equity.
F-11

SEAWORLD ENTERTAINMENT, INC. AND SUBSIDIARIESNOTES TO CONSOLIDATED FINANCIAL STATEMENTS
(DOLLARS IN THOUSANDS, EXCEPT PER SHARE AMOUNTS)
Revenue Recognition
The Company recognizes revenue upon admission into a park for single day tickets and when products arereceived by customers for merchandise, culinary or other in-park spending. For season passes and other multi-useadmission products, deferred revenue is recorded and the related revenue is recognized over the terms of theadmission product and its estimated usage. Deferred revenue includes a current and long-term portion. AtDecember 31, 2014 and 2013, long-term deferred revenue of $2,414 and $3,176, respectively, is included inother liabilities in the accompanying consolidated balance sheets. The Company has entered into agreementswith certain external theme park, zoo and other attraction operators to jointly market and sell single and multi-useadmission products. These joint products allow admission to both a Company park and an external park, zoo orother attraction. The agreements with the external parks specify the allocation of revenue to the Company fromany jointly sold products. The Company’s portion of revenue is deferred and recognized in a manner consistentwith the Company’s own admission products over its related use. The Company barters theme park admissionproducts and sponsorship opportunities for advertising, employee recognition awards, and various other services.The fair value of the products or services is recognized into admissions revenue and related expense at the timeof the exchange and approximates the estimated fair value of either the products or services received or provided,whichever is more readily determinable. For the years ended December 31, 2014, 2013 and 2012, approximately$17,700, $20,000 and $19,600, respectively, were included within admissions revenue with an offset in eitherselling, general and administrative expenses or operating expenses in the accompanying consolidated statementsof comprehensive income related to bartered ticket transactions.
Advertising and Promotional Costs
Advertising production costs are deferred and expensed the first time the advertisement is shown. Advertisingand media costs are expensed as incurred and for the years ended December 31, 2014, 2013 and 2012, totaledapproximately $110,500, $112,000 and $116,700, respectively, and are included in selling, general andadministrative expenses in the accompanying consolidated statements of comprehensive income.
Equity-Based Compensation
The Company measures the cost of employee services rendered in exchange for share-based compensation basedupon the grant date fair market value. The cost is recognized over the requisite service period, which is generallythe vesting period. See further discussion in Note 18–Equity-Based Compensation.
Restructuring Costs
The Company accounts for exit or disposal of activities in accordance with ASC 420, Exit or Disposal CostObligations. The Company defines a business restructuring as an exit or disposal activity that includes but is notlimited to a program which is planned and controlled by management and materially changes either the scope ofa business or the manner in which that business is conducted. Business restructuring charges may include (i) one-time termination benefits related to employee separations, (ii) contract termination costs and (iii) other relatedcosts associated with exit or disposal activities.
A liability is recognized and measured at its fair value for one-time termination benefits once the plan oftermination is communicated to affected employees and it meets all of the following criteria: (i) managementcommits to a plan of termination, (ii) the plan identifies the number of employees to be terminated and their jobclassifications or functions, locations and the expected completion date, (iii) the plan establishes the terms of thebenefit arrangement and (iv) it is unlikely that significant changes to the plan will be made or the plan will bewithdrawn. Contract termination costs include costs to terminate a contract or costs that will continue to be
F-12

SEAWORLD ENTERTAINMENT, INC. AND SUBSIDIARIESNOTES TO CONSOLIDATED FINANCIAL STATEMENTS
(DOLLARS IN THOUSANDS, EXCEPT PER SHARE AMOUNTS)
incurred under the contract without benefit to the Company. A liability is recognized and measured at its fairvalue when the Company either terminates the contract or ceases using the rights conveyed by the contract.
Income Taxes
Income taxes are accounted for under the asset and liability method. Deferred tax assets and liabilities arerecognized for the future tax consequences attributable to differences between the financial statement carryingamounts of existing assets and liabilities and their respective tax bases. Deferred tax assets and liabilities aremeasured using enacted tax rates expected to apply to taxable income in the years in which those differences areexpected to be recovered or settled. The effect on deferred tax assets and liabilities of a change in tax rates isrecognized in operations in the period that includes the enactment date. A valuation allowance is established fordeferred tax assets when it is more likely than not that some portion or all of the deferred tax assets will not berealized. Realization is dependent on generating future taxable income or the reversal of deferred tax liabilitiesduring the periods in which those temporary differences become deductible. The Company evaluates its taxpositions by determining if it is more likely than not a tax position is sustainable upon examination, based uponthe technical merits of the position, before any of the benefit is recorded for financial statement purposes. Thebenefit is measured as the largest dollar amount of position that is more likely than not to be sustained uponsettlement. Previously recorded benefits that no longer meet the more-likely than not threshold are charged toearnings in the period that the determination is made. Interest and penalties accrued related to uncertain positionsare charged to the provision/benefit for income taxes.
Fair Value Measurements
Fair value is defined as an exit price, representing the amount that would be received to sell an asset or paid totransfer a liability in an orderly transaction between market participants.
An entity is permitted to measure certain financial assets and financial liabilities at fair value with changes in fairvalue recognized in earnings each period. The Company has not elected to use the fair value option for any of itsfinancial assets and financial liabilities that are not already recorded at fair value. Carrying values of financialinstruments classified as current assets and current liabilities approximate fair value, due to their short-termnature. A description of the Company’s policies regarding fair value measurement is summarized below.
Fair Value Hierarchy—Fair value is determined for assets and liabilities, which are grouped according to ahierarchy, based upon significant levels of observable or unobservable inputs. Observable inputs reflect marketdata obtained from independent sources, while unobservable inputs reflect the Company’s market assumptions.This hierarchy requires the use of observable market data when available. These two types of inputs have createdthe following fair value hierarchy:
Level 1—Quoted prices for identical instruments in active markets.
Level 2—Quoted prices for similar instruments in active markets, quoted prices for identical or similarinstruments in markets that are not active and model-derived valuations in which all significant inputs andsignificant value drivers are observable in active markets.
Level 3—Valuations derived from valuation techniques in which one or more significant inputs orsignificant value drivers are unobservable.
Determination of Fair Value—The Company generally uses quoted market prices (unadjusted) in active marketsfor identical assets or liabilities that the Company has the ability to access to determine fair value, and classifies
F-13

SEAWORLD ENTERTAINMENT, INC. AND SUBSIDIARIESNOTES TO CONSOLIDATED FINANCIAL STATEMENTS
(DOLLARS IN THOUSANDS, EXCEPT PER SHARE AMOUNTS)
such items in Level 1. Fair values determined by Level 2 inputs utilize inputs other than quoted market pricesincluded in Level 1 that are observable for the asset or liability, either directly or indirectly. Level 2 inputsinclude quoted market prices in active markets for similar assets or liabilities, and inputs other than quotedmarket prices that are observable for the asset or liability. Level 3 inputs are unobservable inputs for the asset orliability, and include situations where there is little, if any, market activity for the asset or liability. If quotedmarket prices are not available, fair value is based upon internally developed valuation techniques that use, wherepossible, current market-based or independently sourced market parameters, such as interest and currency rates,and the like. Assets or liabilities valued using such internally generated valuation techniques are classifiedaccording to the lowest level input or value driver that is significant to the valuation. Thus, an item may beclassified in Level 3 even though there may be some significant inputs that are readily observable.
Segment Reporting
The Company maintains discrete financial information for each of its eleven theme parks, which is used by theChief Operating Decision Maker (“CODM”), identified as the Chief Executive Officer, as a basis for allocatingresources. Each theme park has been identified as an operating segment and meets the criteria for aggregationdue to similar economic characteristics. In addition, all of the theme parks provide similar products and servicesand share similar processes for delivering services. The theme parks have a high degree of similarity in theworkforces and target the same consumer group. Accordingly, based on these economic and operationalsimilarities and the way the CODM monitors the operations, the Company has concluded that its operatingsegments may be aggregated and that it has one reportable segment.
Derivative Instruments and Hedging Activities
During fiscal year 2012, the Company entered into certain derivative transactions, as detailed in Note 12-Derivative Instruments and Hedging Activities, and elected the related derivative instruments and hedgingactivities accounting policy described herein. ASC 815, Derivatives and Hedging, provides the disclosurerequirements for derivatives and hedging activities with the intent to provide users of financial statements with anenhanced understanding of: (a) how and why an entity uses derivative instruments, (b) how the entity accountsfor derivative instruments and related hedged items, and (c) how derivative instruments and related hedged itemsaffect an entity’s financial position, results of operations and cash flows. Further, qualitative disclosures arerequired that explain the Company’s objectives and strategies for using derivatives, as well as quantitativedisclosures about the fair value of, and gains and losses on, derivative instruments, and disclosures about credit-risk-related contingent features in derivative instruments.
As required by ASC 815, the Company records all derivatives on the balance sheet at fair value. The accountingfor changes in the fair value of derivatives depends on the intended use of the derivative, whether the Companyhas elected to designate a derivative in a hedging relationship and apply hedge accounting and whether thehedging relationship has satisfied the criteria necessary to apply hedge accounting. Derivatives designated andqualifying as a hedge of the exposure to changes in the fair value of an asset, liability, or firm commitmentattributable to a particular risk, such as interest rate risk, are considered fair value hedges. Derivatives designatedand qualifying as a hedge of the exposure to variability in expected future cash flows, or other types of forecastedtransactions, are considered cash flow hedges. Hedge accounting generally provides for the matching of thetiming of gain or loss recognition on the hedging instrument with the recognition of the changes in the fair valueof the hedged asset or liability that are attributable to the hedged risk in a fair value hedge or the earnings effectof the hedged forecasted transactions in a cash flow hedge. The Company may enter into derivative contracts thatare intended to economically hedge certain of its risk, even though hedge accounting does not apply or theCompany elects not to apply hedge accounting.
F-14

SEAWORLD ENTERTAINMENT, INC. AND SUBSIDIARIESNOTES TO CONSOLIDATED FINANCIAL STATEMENTS
(DOLLARS IN THOUSANDS, EXCEPT PER SHARE AMOUNTS)
3. RECENTLY ISSUED ACCOUNTING PRONOUNCEMENTS
The Company reviews new accounting pronouncements as they are issued or proposed by the FinancialAccounting Standards Board (“FASB”). The Company is not aware of any new accounting pronouncements thatwill have a material impact on the Company’s financial position, results of operations or cash flows.
In June 2014, the FASB issued Accounting Standard Update (“ASU”) No. 2014-12, Compensation—StockCompensation (Topic 718): Accounting for Share-Based Payments When the Terms of an Award Provide That aPerformance Target Could Be Achieved after the Requisite Service Period. This ASU provides explicit guidanceon the treatment of awards with performance targets that could be achieved after the requisite service period. TheASU is effective for annual periods and interim periods within those annual periods beginning afterDecember 15, 2015 with earlier adoption permitted. The adoption of ASU 2014-12 is not expected to have amaterial impact on the Company’s consolidated financial statements.
In May 2014, the FASB issued ASU No. 2014-09, Revenue from Contracts with Customers (Topic 606), whichsupersedes the revenue recognition requirements in ASC Topic 605, Revenue Recognition. This ASU is based onthe principle that revenue is recognized to depict the transfer of goods or services to customers in an amount thatreflects the consideration to which the entity expects to be entitled in exchange for those goods or services. TheASU also requires additional disclosure about the nature, amount, timing and uncertainty of revenue and cashflows arising from customer contracts, including significant judgments and changes in judgments and assetsrecognized from costs incurred to obtain or fulfill a contract. The effective date will be annual reporting periodsbeginning after December 15, 2016 using one of two retrospective application methods. The Company isevaluating the accounting and disclosure requirements on its consolidated financial statements but does notcurrently anticipate a material impact to the consolidated financial statements upon adoption.
4. RESTRUCTURING PROGRAM AND SEPARATION COSTS
Restructuring Program
In December 2014, the Company implemented a restructuring program in an effort to centralize certainoperations and reduce duplication of functions to increase efficiencies (the “Restructuring Program”). TheRestructuring Program involved the elimination of approximately 300 positions across the Company’s eleventheme parks and corporate headquarters. As a result, the Company expects to record approximately $12,400 inpre-tax restructuring and other related costs associated with this Restructuring Program, of which $11,567 wasincurred in 2014 and approximately $800 is expected to be incurred in the first half of 2015, due to certaincontinuing service obligations which are expected to be completed by the second quarter of 2015.
The Restructuring Program activity for the year ended December 31, 2014 was as follows:
Severanceand Other
EmploymentExpenses
OtherRelated
RestructuringExpenses
TotalRestructuring and
Other RelatedCosts
Costs incurred in 2014 $8,578 $ 2,989 $11,567Payments made in 2014 (887) (2,989) (3,876)
Liability as of December 31, 2014 $7,691 $ — $ 7,691
Costs incurred in 2014 related to the Restructuring Program are recorded as restructuring and other related costson the accompanying consolidated statements of comprehensive income and primarily consist of severance andother employment expenses. Other related restructuring expenses include third party consulting costs associated
F-15

SEAWORLD ENTERTAINMENT, INC. AND SUBSIDIARIESNOTES TO CONSOLIDATED FINANCIAL STATEMENTS
(DOLLARS IN THOUSANDS, EXCEPT PER SHARE AMOUNTS)
with the development of the cost savings plan and the Restructuring Program. The liability related to severanceand other employment expenses is included in accrued salaries, wages and benefits as of December 31, 2014 onthe accompanying consolidated balance sheet.
Restructuring and other related costs do not include any costs associated with the separation of the Company’sChief Executive Officer and President effective January 15, 2015 (the “Former CEO”) as discussed below.
Separation Costs
On December 11, 2014, the Company announced that its Chief Executive Officer would resign from his roleeffective on January 15, 2015. Pursuant to a separation and consulting agreement entered into by the Companyand the Former CEO on December 10, 2014, the Former CEO will remain involved with the Company as amember of the Board and in a consulting capacity to the Company for a three-year consulting term. TheCompany recorded $2,574 as separation costs on the accompanying consolidated statements of comprehensiveincome for the year ended December 31, 2014 related to this separation. This amount is included in accruedsalaries, wages and benefits as of December 31, 2014 on the accompanying consolidated balance sheet and waspaid in January 2015.
Additionally, in connection with the Restructuring Program and the separation of the Former CEO, conditions foreligibility on certain unvested performance restricted shares of common stock were modified to allow thoseparticipants who are separating from the Company, including the Former CEO, to vest in their respective awardsif the performance conditions are achieved after their employment ends with the Company. See Note 18–Equity-Based Compensation for further details.
5. EARNINGS PER SHARE
Earnings per share is computed as follows (in thousands, except per share data):
Year Ended December 31,
2014 2013 2012
NetIncome Shares
PerShare
AmountNet
Income Shares
PerShare
AmountNet
Income Shares
PerShare
Amount
Basic earnings per share $49,919 87,183 $0.57 $51,920 87,537 $0.59 $74,221 82,480 $0.90Effect of dilutive incentive-
based awards 297 615 1,072
Diluted earnings per share $49,919 87,480 $0.57 $51,920 88,152 $0.59 $74,221 83,552 $0.89
In accordance with the Earnings Per Share Topic of the ASC, basic earnings per share is computed by dividingnet income by the weighted average number of shares of common stock outstanding during the period (excludingunvested restricted stock). The shares of unvested restricted stock are eligible to receive dividends; however,dividend rights will be forfeited if the award does not vest. Accordingly, only vested shares of outstandingrestricted stock are included in the calculation of basic earnings per share. The weighted average number ofrepurchased shares during the period that are held as treasury stock are excluded from common stockoutstanding.
Diluted earnings per share is determined based on the dilutive effect of unvested restricted stock probable ofvesting using the treasury stock method. During the year ended December 31, 2014, there were approximately21,000 antidilutive shares of common stock excluded from the computation of diluted earnings per share. During
F-16

SEAWORLD ENTERTAINMENT, INC. AND SUBSIDIARIESNOTES TO CONSOLIDATED FINANCIAL STATEMENTS
(DOLLARS IN THOUSANDS, EXCEPT PER SHARE AMOUNTS)
the years ended December 31, 2013 and 2012, there were no antidilutive shares of common stock excluded fromthe computation of diluted earnings per share.
6. INVENTORIES
Inventories as of December 31, 2014 and 2013, consisted of the following:
2014 2013
Merchandise $28,356 $30,586Food and beverage 4,778 5,623
Total inventories $33,134 $36,209
7. PREPAID EXPENSES AND OTHER CURRENT ASSETS
Prepaid expenses and other current assets as of December 31, 2014 and 2013, consisted of the following:
2014 2013
Prepaid insurance $ 8,047 $ 8,418Prepaid marketing and advertising costs 6,965 6,817Other 5,882 4,378
Total prepaid expenses and other current assets $20,894 $19,613
8. PROPERTY AND EQUIPMENT, NET
The components of property and equipment, net as of December 31, 2014 and 2013, consisted of the following:
2014 2013
Land $ 286,200 $ 286,200Land improvements 289,892 259,722Buildings 566,112 537,532Rides, attractions and equipment 1,267,832 1,173,746Animals 158,362 157,160Construction in process 43,654 71,445Less accumulated depreciation (867,421) (714,305)
Total property and equipment, net $1,744,631 $1,771,500
Depreciation expense was approximately $169,000, $159,700 and $161,700 for the years ended December 31,2014, 2013 and 2012, respectively.
9. TRADE NAMES/TRADEMARKS AND OTHER INTANGIBLE ASSETS, NET
Trade names/trademarks, net are comprised of the following at December 31, 2014:
Weighted AverageAmortization
Period
GrossCarryingAmount
AccumulatedAmortization
NetCarrying
Value
Trade names/trademarks—indefinite lives $157,000 $ — $157,000Trade names/trademarks—definite lives 9.3 years 12,900 5,712 7,188
Total trade names/trademarks, net $169,900 $5,712 $164,188
F-17

SEAWORLD ENTERTAINMENT, INC. AND SUBSIDIARIESNOTES TO CONSOLIDATED FINANCIAL STATEMENTS
(DOLLARS IN THOUSANDS, EXCEPT PER SHARE AMOUNTS)
Trade names/trademarks, net are comprised of the following at December 31, 2013:
Weighted AverageAmortization
Period
GrossCarryingAmount
AccumulatedAmortization
NetCarrying
Value
Trade names/trademarks—indefinite lives $157,000 $ — $157,000Trade names/trademarks—definite lives 10 years 11,000 4,492 6,508
Total trade names/trademarks, net $168,000 $4,492 $163,508
Other intangible assets, net at December 31, 2014, consisted of the following:
Weighted AverageAmortization
Period
GrossCarryingAmount
AccumulatedAmortization
NetCarrying
Value
Favorable lease asset 39 years $18,200 $ 2,333 $15,867Reseller agreements 8.1 years 22,300 13,984 8,316Non-compete agreement 5 years 500 158 342
Total other intangible assets, net $41,000 $16,475 $24,525
Other intangible assets, net at December 31, 2013, consisted of the following:
Weighted AverageAmortization
Period
GrossCarryingAmount
AccumulatedAmortization
NetCarrying
Value
Favorable lease asset 39 years $18,200 $ 1,867 $16,333Reseller agreements 8.1 years 22,300 11,232 11,068Non-compete agreement 5 years 500 58 442
Total other intangible assets, net $41,000 $13,157 $27,843
Total amortization was approximately $4,600, $4,400 and $4,300 for the years ended December 31, 2014, 2013and 2012, respectively. The total weighted average amortization period of all finite-lived intangibles is18.8 years.
Total expected amortization of the finite-lived intangible assets for the succeeding five years and thereafter is asfollows:
Years Ending December 31
2015 $ 4,7802016 4,7802017 4,5742018 2,2352019 1,849
Thereafter 13,495
$31,713
F-18

SEAWORLD ENTERTAINMENT, INC. AND SUBSIDIARIESNOTES TO CONSOLIDATED FINANCIAL STATEMENTS
(DOLLARS IN THOUSANDS, EXCEPT PER SHARE AMOUNTS)
10. OTHER ACCRUED EXPENSES
Other accrued expenses at December 31, 2014 and 2013, consisted of the following:
2014 2013
Accrued property taxes $ 2,039 $ 2,113Accrued interest 2,604 2,636Self-insurance reserve 7,800 7,800Other 7,706 2,715
Total other accrued expenses $20,149 $15,264
As of December 31, 2014, the Company accrued $5,650 related to the 2014 repurchase of certain shares ofcommon stock, which settled and was paid in January 2015. See Note 19–Stockholders’ Equity for furtherdiscussion on the Share Repurchase Program.
11. LONG-TERM DEBT
Long-term debt as of December 31, 2014 and 2013 consisted of the following:
2014 2013
Term B-2 Loans $1,352,438 $1,397,975Revolving credit agreement — —Senior Notes 260,000 260,000
Total long-term debt 1,612,438 1,657,975Less discounts (8,985) (11,394)Less current maturities (14,050) (14,050)
Total long-term debt, net of current maturities $1,589,403 $1,632,531
SEA is the borrower under the senior secured credit facilities, as amended pursuant to a credit agreement dated asof December 1, 2009 (“Senior Secured Credit Facilities”). Also, on December 1, 2009, SEA issued $400,000aggregate principal amount of unsecured senior notes due December 1, 2016 (the “Senior Notes”).
Deferred financing costs, net of accumulated amortization and amounts written-off for early extinguishment ofdebt, were $20,003 and $27,453 as of December 31, 2014 and 2013, respectively. Deferred financing costs areamortized to interest expense using the effective interest method over the term of the Senior Secured CreditFacilities or the Senior Notes and are included in other assets in the accompanying consolidated balance sheets.
As of December 31, 2014, the Company was in compliance with all covenants in the provisions contained in thedocuments governing the Senior Secured Credit Facilities and in the indenture governing the Senior Notes.
Senior Secured Credit Facilities
As of December 31, 2014, the Senior Secured Credit Facilities consisted of a $1,352,438 senior secured termloan facility (the “Term B-2 Loans”), which will mature on May 14, 2020 and a $192,500 senior securedrevolving credit facility (the “Revolving Credit Facility”), which was not drawn upon at December 31, 2014. The
F-19

SEAWORLD ENTERTAINMENT, INC. AND SUBSIDIARIESNOTES TO CONSOLIDATED FINANCIAL STATEMENTS
(DOLLARS IN THOUSANDS, EXCEPT PER SHARE AMOUNTS)
Revolving Credit Facility will mature on the earlier of (a) April 24, 2018 and (b) the 91st day prior to the earlierof (1) the maturity date of Senior Notes with an aggregate principal amount greater than $50,000 outstanding and(2) the maturity date of any indebtedness incurred to refinance any of the term loans or the Senior Notes.
SEA entered into Amendments No. 1, 2, 3, 4, 5 and 6 of the Senior Secured Credit Facilities effective onFebruary 17, 2011, April 15, 2011, March 30, 2012, April 24, 2013, May 14, 2013 and August 9, 2013,respectively (collectively, the “Amendments”).
Revision of Previously Issued Financial Statements
In the third quarter of 2014, the Company conducted an internal review of its application of the guidance inASC 470-50, Debt-Modifications and Extinguishments, to its accounting for certain debt transactions in 2013,2012 and 2011. As a result of this review and analysis, the Company determined that it had incorrectly appliedthe accounting guidance in ASC 470-50 and inappropriately accounted for certain fees as a result ofmodifications related to the Amendments and prepayments in certain years.
In particular, for Amendment No. 1 in 2011, the Company determined that $1,074 should have been capitalized,$4,326 should have been expensed and $13,939 should have been written off and reflected as a loss on earlyextinguishment of debt and write-off of discounts and deferred financing costs. Additionally, for AmendmentNo. 2 and prepayments in 2011, the Company determined that $45 and $1,145, respectively, should have beenwritten off and reflected as a loss on early extinguishment of debt and write-off of discounts and deferredfinancing costs. The cumulative impact of the corrections as of January 1, 2012 was an increase to accumulateddeficit of $4,324.
For Amendment No. 3 in 2012, the Company determined that $10,789 should have been capitalized,$5,072 should have been expensed and $992 should have been written off and reflected as a loss on earlyextinguishment of debt and write-off of discounts and deferred financing costs. The Company also determinedthat for prepayments in 2012, fees and discounts of $1,061 should have been written off and reflected as a loss onearly extinguishment of debt and write-off of discounts and deferred financing costs. The Company recorded a$5,265 reduction in income before taxes for the 2012 corrections, primarily related to the accounting forAmendment No. 3.
For Amendment No. 4 and Amendment No. 6 in 2013, the Company determined that the original accounting wasappropriate and there were no corrections necessary. For Amendment No. 5 in 2013, the Company determinedthat $4,854 should have been capitalized, $3,871 should have been expensed and $8,121 should have beenwritten off and reflected as a loss on early extinguishment of debt and write-off of discounts and deferredfinancing costs. Additionally, for prepayments in 2013, the Company determined that $856 should have beenwritten off and reflected as a loss on early extinguishment of debt and write-off of discounts and deferredfinancing costs. The Company recorded an additional $2,152 in income before taxes for the 2013 corrections,primarily related to a reduction in interest expense due to the 2013 amortization impact of the corrections madein 2011, 2012 and 2013.
In accordance with ASC 250 (SEC Staff Accounting Bulletin 99, Assessing Materiality), the Company concludedthat the correction of the errors was not material to any of its previously issued annual or interim financialstatements. The Company has revised its previously issued financial statements contained in this Annual Reporton Form 10-K to correct the effect of these immaterial errors for the corresponding periods.
F-20

SEAWORLD ENTERTAINMENT, INC. AND SUBSIDIARIESNOTES TO CONSOLIDATED FINANCIAL STATEMENTS
(DOLLARS IN THOUSANDS, EXCEPT PER SHARE AMOUNTS)
The following table presents the impact of these corrections on affected consolidated balance sheet line items asof December 31, 2013:
As of December 31, 2013
As PreviouslyReported Adjustments
AsRevised
Selected Balance Sheet Data:Other assets $ 40,753 $(4,863) $ 35,890
Total assets $2,582,273 $(4,863) $2,577,410
Long-term debt $1,627,183 $ 5,348 $1,632,531
Deferred tax liabilities, net $ 29,776 $(4,106) $ 25,670
Retained earnings $ 7,991 $(6,105) $ 1,886
Total stockholders’ equity $ 654,132 $(6,105) $ 648,027
Total liabilities and stockholders’ equity $2,582,273 $(4,863) $2,577,410
The following tables present the additional impact of the corrections for other previously issued annual periods asindicated:
For the Year Ended December 31, 2013 For the Year Ended December 31, 2012
AsPreviouslyReported Adjustments
AsRevised
AsPreviouslyReported Adjustments
AsRevised
Selected Statements ofComprehensive Income Data:
Operating expenses $739,989 $ 3,333 $743,322 $ 726,509 $ 4,073 $ 730,582
Interest expense $ 93,536 $(2,914) $ 90,622 $ 111,426 $ (861) $ 110,565
Loss on early extinguishment of debtand write-off of discounts anddeferred financing costs $ 32,429 $(2,571) $ 29,858 $ — $ 2,053 $ 2,053
Income before income taxes $ 75,482 $ 2,152 $ 77,634 $ 116,926 $(5,265) $ 111,661
Provision for income taxes $ 25,004 $ 710 $ 25,714 $ 39,482 $(2,042) $ 37,440
Net income $ 50,478 $ 1,442 $ 51,920 $ 77,444 $(3,223) $ 74,221
Earnings per share:Net income per share, basic $ 0.58 $ 0.01 $ 0.59 $ 0.94 $ (0.04) $ 0.90Net income per share, diluted $ 0.57 $ 0.02 $ 0.59 $ 0.93 $ (0.04) $ 0.89
Selected Statements of Cash FlowsData:
Net cash provided by operatingactivities $289,794 $(3,333) $286,461 $ 303,513 $(4,073) $ 299,440
Net cash used in financingactivities $ (52,252) $ 3,333 $ (48,919) $(120,183) $ 4,073 $(116,110)
F-21

SEAWORLD ENTERTAINMENT, INC. AND SUBSIDIARIESNOTES TO CONSOLIDATED FINANCIAL STATEMENTS
(DOLLARS IN THOUSANDS, EXCEPT PER SHARE AMOUNTS)
The following tables present the impact of these corrections on the unaudited summary quarterly financial datafor the previously issued quarterly periods as indicated (see also Note 21–Summary Quarterly Financial Data(Unaudited)):
For the Three Months EndedMarch 31, 2013
For the Three Months EndedJune 30, 2013
AsPreviouslyReported Adjustments
AsRevised
AsPreviouslyReported Adjustments
AsRevised
Selected Summary Quarterly FinancialData: (Unaudited)
Total revenues $238,610 $ — $238,610 $411,292 $ — $411,292
Operating expenses $173,260 $ — $173,260 $194,674 $ 3,333 $198,007
Operating (loss) income $ (35,873) $ — $ (35,873) $ 30,980 $(3,333) $ 27,647
Interest expense $ 28,606 $(610) $ 27,996 $ 22,926 $ (694) $ 22,232
Loss on early extinguishment of debt andwrite-off of discounts and deferredfinancing costs $ — $ — $ — $ 32,429 $(2,571) $ 29,858
Loss before income taxes $ (64,406) $ 610 $ (63,796) $ (24,268) $ (68) $ (24,336)
Benefit from income taxes $ (24,046) $ 201 $ (23,845) $ (8,414) $ (22) $ (8,436)
Net loss $ (40,360) $ 409 $ (39,951) $ (15,854) $ (46) $ (15,900)
Loss per share:Net loss per share, basic $ (0.49) $0.01 $ (0.48) $ (0.18) $ — $ (0.18)Net loss per share, diluted $ (0.49) $0.01 $ (0.48) $ (0.18) $ — $ (0.18)
For the Three Months EndedSeptember 30, 2013
For the Three Months EndedDecember 31, 2013
Reported AdjustmentsAs
Revised Reported AdjustmentsAs
Revised
Selected Summary Quarterly FinancialData: (Unaudited)
Total revenues $538,389 $ — $538,389 $271,959 $ — $271,959
Operating expenses $202,625 $ — $202,625 $169,430 $ — $169,430
Operating income $205,594 $ — $205,594 $ 505 $ — $ 505
Interest expense $ 21,018 $(807) $ 20,211 $ 20,986 $(803) $ 20,183
Loss on early extinguishment of debt andwrite-off of discounts and deferredfinancing costs $ — $ — $ — $ — $ — $ —
Income (loss) before income taxes $184,589 $ 807 $185,396 $ (20,433) $ 803 $ (19,630)
Provision for (benefit from) income taxes $ 64,390 $ 266 $ 64,656 $ (6,926) $ 265 $ (6,661)
Net income (loss) $120,199 $ 541 $120,740 $ (13,507) $ 538 $ (12,969)
Earnings (loss) per share:Net income (loss) per share, basic $ 1.34 $0.01 $ 1.35 $ (0.15) $0.01 $ (0.14)Net income (loss) per share, diluted $ 1.33 $0.01 $ 1.34 $ (0.15) $0.01 $ (0.14)
F-22

SEAWORLD ENTERTAINMENT, INC. AND SUBSIDIARIESNOTES TO CONSOLIDATED FINANCIAL STATEMENTS
(DOLLARS IN THOUSANDS, EXCEPT PER SHARE AMOUNTS)
For the Three Months EndedMarch 31, 2014
For the Three Months EndedJune 30, 2014
AsPreviouslyReported Adjustments
AsRevised
AsPreviouslyReported Adjustments
AsRevised
Selected Summary Quarterly FinancialData: (Unaudited)
Total revenues $212,290 $ — $212,290 $405,151 $ — $405,151
Operating expenses $167,912 $ — $167,912 $189,190 $ — $189,190
Operating (loss) income $ (59,408) $ — $ (59,408) $ 80,587 $ — $ 80,587
Interest expense $ 20,046 $(342) $ 19,704 $ 20,638 $(112) $ 20,526
Loss on early extinguishment of debt andwrite-off of discounts and deferredfinancing costs $ — $ — $ — $ — $ — $ —
(Loss) income before income taxes $ (79,471) $ 342 $ (79,129) $ 59,994 $ 112 $ 60,106
(Benefit from) provision for income taxes $ (30,040) $ 128 $ (29,912) $ 22,658 $ 42 $ 22,700
Net (loss) income $ (49,431) $ 214 $ (49,217) $ 37,336 $ 70 $ 37,406
(Loss) earnings per share:Net (loss) income per share, basic $ (0.56) $ — $ (0.56) $ 0.43 $ — $ 0.43Net (loss) income per share, diluted $ (0.56) $ — $ (0.56) $ 0.43 $ — $ 0.43
Term B-2 Loans
The Term B-2 Loans were initially borrowed in an aggregate principal amount of $1,405,000. Borrowings underthe Senior Secured Credit Facilities bear interest, at SEA’s option, at a rate equal to a margin over either (a) abase rate determined by reference to the higher of (1) the Bank of America’s prime lending rate and (2) thefederal funds effective rate plus 1/2 of 1% or (b) a LIBOR rate determined by reference to the British BankersAssociation (“BBA”) LIBOR rate, or the successor thereto if the BBA is no longer making a LIBOR rateavailable, for the interest period relevant to such borrowing. The applicable margin for the Term B-2 Loans is1.25%, in the case of base rate loans, and 2.25%, in the case of LIBOR rate loans, subject to a base rate floor of1.75% and a LIBOR floor of 0.75%. The applicable margin for the Term B-2 Loans (under either a base rate orLIBOR rate) is subject to one 25 basis point step-down upon achievement by SEA of a certain total leverageratio. At December 31, 2014, SEA selected the LIBOR rate (interest rate of 3.00% at December 31, 2014).
The applicable margin for borrowings under the Revolving Credit Facility is 1.75%, in the case of base rateloans, and 2.75%, in the case of LIBOR rate loans. The applicable margin (under either a base rate or LIBORrate) is subject to one 25 basis point step-down upon achievement by SEA of certain corporate credit ratings. AtDecember 31, 2014, SEA selected the LIBOR rate and achieved the corporate credit ratings for an applicablemargin of 2.50%.
In addition to paying interest on outstanding principal under the Senior Secured Credit Facilities, SEA is requiredto pay a commitment fee to the lenders under the Revolving Credit Facility in respect of the unutilizedcommitments thereunder. The commitment fee rate is 0.50% per annum. SEA is also required to pay customaryletter of credit fees.
The Term B-2 Loans amortize in equal quarterly installments in an aggregate annual amount equal to 1.0% of theoriginal principal amount of the Term B-2 Loans on May 14, 2013, with the first payment due and paid on
F-23

SEAWORLD ENTERTAINMENT, INC. AND SUBSIDIARIESNOTES TO CONSOLIDATED FINANCIAL STATEMENTS
(DOLLARS IN THOUSANDS, EXCEPT PER SHARE AMOUNTS)
September 30, 2013 and the balance due on the final maturity date of May 14, 2020. SEA may voluntarily repayamounts outstanding under the Senior Secured Credit Facilities at any time without premium or penalty, otherthan customary “breakage” costs with respect to LIBOR loans.
SEA may also increase and/or add one or more incremental term loan facilities to the Senior Secured CreditFacilities and/or increase commitments under the Revolving Credit Facility in an aggregate principal amount ofup to $350,000. SEA may also incur additional incremental term loans provided that, among other things, on apro forma basis after giving effect to the incurrence of such incremental term loans, the first lien secured leverageratio, as defined in the Senior Secured Credit Facility, is no greater than 3.50 to 1.00.
SEA had no amounts outstanding at December 31, 2014 and 2013, relating to the Revolving Credit Facility. Therevolving credit commitment includes up to $20,000 in short-term loans (five days in duration) and up to $50,000in letters of credit. Any amounts borrowed under the short-term loans or as letters of credit reduce the totalamount available under the revolving credit loan. All amounts outstanding under the revolving creditcommitment are due on the Revolving Credit Facility maturity date, except for borrowings under the short termloans, which are payable within five business days of the original borrowing. As of December 31, 2014, theCompany had approximately $18,100 of outstanding letters of credit, leaving approximately $174,400 availablefor borrowing.
SEA is required to prepay the outstanding Term B-2 loans, subject to certain exceptions, with:
• 50% of SEA’s annual “excess cash flow” (with step-downs to 25% and 0%, as applicable, based uponachievement by SEA of a certain total net leverage ratio), subject to certain exceptions;
• 100% of the net cash proceeds of certain non-ordinary course asset sales or other dispositions subject toreinvestment rights and certain exceptions; and
• 100% of the net cash proceeds of any incurrence of debt by SEA or any of its restricted subsidiaries,other than debt permitted to be incurred or issued under the Senior Secured Credit Facilities.
Notwithstanding any of the foregoing, each lender of term loans has the right to reject its pro rata share ofmandatory prepayments described above, in which case SEA may retain the amounts so rejected. The foregoingmandatory prepayments will be applied pro rata to installments of term loans in direct order of maturity. Therewere no mandatory prepayments during the years ended December 31, 2014 or 2013 since none of the eventsindicated above occurred during the year. On September 30, 2014, the Company made a voluntary principalrepayment of approximately $31,500 on the Term B-2 Loans with available cash on hand.
The obligations under the Senior Secured Credit Facilities are fully, unconditionally and irrevocably guaranteedby the Company, any subsidiary of the Company that directly or indirectly owns 100% of the issued andoutstanding equity interests of SEA, and, subject to certain exceptions, each of SEA’s existing and futurematerial domestic wholly-owned subsidiaries. The Senior Secured Credit Facilities are collateralized by firstpriority or equivalent security interests, subject to certain exceptions, in (i) all the capital stock of, or other equityinterests in, substantially all of the Company’s direct or indirect material domestic subsidiaries and 65% of thecapital stock of, or other equity interests in, any “first tier” foreign subsidiaries and (ii) certain tangible andintangible assets of SEA and the Company. Certain financial, affirmative and negative covenants, including amaximum total net leverage ratio, minimum interest coverage ratio and maximum capital expenditures areincluded in the Senior Secured Credit Facilities. If an event of default occurs, the lenders under the SeniorSecured Credit Facilities will be entitled to take various actions, including the acceleration of amounts due underthe Senior Secured Credit Facilities and all actions permitted to be taken by a secured creditor.
F-24

SEAWORLD ENTERTAINMENT, INC. AND SUBSIDIARIESNOTES TO CONSOLIDATED FINANCIAL STATEMENTS
(DOLLARS IN THOUSANDS, EXCEPT PER SHARE AMOUNTS)
Senior Notes
The Senior Notes accrue interest at a rate of 11.0% per annum. Interest is payable semi-annually in arrears. Theobligations under the Senior Notes are guaranteed by the same entities as those that guarantee the Senior SecuredCredit Facilities. On or after December 1, 2014, the Senior Notes may be redeemed at 105.5% and 102.75% ofthe principal balance beginning on December 1, 2014 and 2015, respectively.
In connection with the issuance of the Senior Notes in 2009, the holders of the Senior Notes received warrants topurchase 101,000 (not in thousands) Partnerships units for $100 (not in thousands) per unit. The Partnerships, inturn, received warrants to acquire 808,000 (not in thousands) shares of the Company’s common stock. The totalvalue of the warrants at December 1, 2009 was $5,000 and was recorded by the Company as additional paid-incapital and a discount on the Senior Notes. The additional discount is being amortized to interest expense overthe term of the Senior Notes. The unamortized discount at December 31, 2014 and 2013, of $1,369 and $2,083,respectively, is presented as a reduction of the carrying value of the Senior Notes in the accompanyingconsolidated financial statements.
Restrictive Covenants
The Senior Secured Credit Facilities contain a number of customary negative covenants. Such covenants, amongother things, restrict, subject to certain exceptions, the ability of SEA and its restricted subsidiaries to incuradditional indebtedness; make guarantees; create liens on assets; enter into sale and leaseback transactions;engage in mergers or consolidations; sell assets; make fundamental changes; pay dividends and distributions orrepurchase SEA’s capital stock; make investments, loans and advances, including acquisitions; engage in certaintransactions with affiliates; make changes in nature of the business; and make prepayments of junior debt. TheSenior Secured Credit Facilities also contain covenants requiring SEA to maintain specified maximum annualcapital expenditures, a maximum total net leverage ratio and a minimum interest coverage ratio. All of the netassets of SEA and its consolidated subsidiaries are restricted and there are no unconsolidated subsidiaries ofSEA.
The indenture governing the Senior Notes contain a number of covenants that, among other things, restrict SEA’sability and the ability of its restricted subsidiaries to, among other things, dispose of certain assets; incuradditional indebtedness; pay dividends; prepay subordinated indebtedness; incur liens; make capitalexpenditures; make investments or acquisitions; engage in mergers or consolidations; and engage in certain typesof transactions with affiliates. These covenants are subject to a number of important limitations and exceptions.
The Senior Secured Credit Facilities and the indenture permit restricted payments in an aggregate amount perannum not to exceed the greater of (1) 6% of initial public offering net proceeds received by SEA or(2) (a) $90,000, so long as, on a pro forma basis (as defined in the applicable agreement) after giving effect to thepayment of any such restricted payment, the Total Leverage Ratio, (as defined in the applicable agreement andcalculated as of the end of the prior quarter), is no greater than 5.00 to 1.00 and greater than 4.50 to 1.00,(b) $120,000, so long as, on a pro forma basis after giving effect to the payment of any such restricted payment,the Total Leverage Ratio is no greater than 4.50 to 1.00 and greater than 4.00 to 1.00, (c) the greater of(A) $120,000 and (B) 7.5% of market capitalization, so long as, on a pro forma basis after giving effect to thepayment of any such restricted payment, the Total Leverage Ratio is no greater than 4.00 to 1.00 and greater than3.50 to 1.00 and (d) an unlimited amount, so long as, on a pro forma basis after giving effect to the payment ofany such restricted payment, the Total Leverage Ratio is no greater than 3.50 to 1.00.
For the year ended December 31, 2014, the Company had a $120,000 capacity for restricted payments, calculatedas set forth above. Through the third quarter of 2014, the Company had used approximately $104,900 of its
F-25

SEAWORLD ENTERTAINMENT, INC. AND SUBSIDIARIESNOTES TO CONSOLIDATED FINANCIAL STATEMENTS
(DOLLARS IN THOUSANDS, EXCEPT PER SHARE AMOUNTS)
available restricted payments capacity leaving an aggregate amount of approximately $15,100 available in thefourth quarter of 2014 to declare dividends or make other restricted payments. As a result, the Board elected topostpone the declaration of the Company’s fourth quarter 2014 dividend to January 2015 and instead authorizedthe repurchase of up to $15,000 of its common stock in December 2014. See Note 19–Stockholders’ Equity forfurther discussion on the Share Repurchase Program.
As of December 31, 2014, the Total Leverage Ratio as calculated under the Senior Notes was 4.48 to 1.00 and ascalculated under the Senior Secured Credit Facilities was 4.25 to 1.00, which results in an estimated $120,000capacity for restricted payments in the year ended December 31, 2015. This amount adjusts at the beginning ofeach quarter as set forth above.
Long-term debt at December 31, 2014, is repayable as follows, not including any possible prepayments describedabove:
Years Ending December 31,
2015 $ 14,0502016 274,0502017 14,0502018 14,0502019 14,050
Thereafter 1,282,188
Total $1,612,438
Interest Rate Swap Agreements
On August 23, 2012, SEA executed two interest rate swap agreements (the “Interest Rate Swap Agreements”) toeffectively fix the interest rate on $550,000 of the then existing Term B Loans. Each interest rate swap had anotional amount of $275,000; was scheduled to mature on September 30, 2016; required the Company to pay afixed rate of interest of 1.247% per annum; entitled SEA to receive a variable rate of interest based upon threemonth BBA LIBOR; and had interest settlement dates occurring on the last day of December, March, June andSeptember through maturity. SEA had designated such interest rate swap agreements as qualifying cash flowhedge accounting relationships.
As a result of an amendment to the Senior Secured Credit Facilities in May 2013, the Interest Rate SwapAgreements were restructured into two interest rate swaps. Each interest rate swap has a notional amount of$275,000; matures on September 30, 2016; requires the Company to pay a fixed rate of interest between 1.049%and 1.051% per annum; entitles SEA to receive a variable rate of interest based upon the greater of 0.75% orthree month BBA LIBOR; and has interest settlement dates occurring on the last day of December, March, Juneand September through maturity.
In March 2014, the Company executed a new interest rate swap agreement to effectively fix the interest rate on$450,000 of the Term B-2 Loans. The new interest rate swap has an effective date of March 31, 2014; has anotional amount of $450,000; matures on September 30, 2016; requires the Company to pay a fixed rate ofinterest of 1.051% per annum; entitles SEA to receive a variable rate of interest based upon the greater of 0.75%or three month BBA LIBOR; and has interest settlement dates occurring on the last day of December, March,June and September through maturity.
SEA designated the interest rate swap agreements above as qualifying cash flow hedge accounting relationshipsas further discussed in Note 12–Derivative Instruments and Hedging Activities which follows.
F-26

SEAWORLD ENTERTAINMENT, INC. AND SUBSIDIARIESNOTES TO CONSOLIDATED FINANCIAL STATEMENTS
(DOLLARS IN THOUSANDS, EXCEPT PER SHARE AMOUNTS)
Cash paid for interest relating to the Senior Secured Credit Facilities, the Senior Notes and the interest rate swapagreements was $74,933, $85,514 and $102,551 during the years ended December 31, 2014, 2013 and 2012,respectively.
12. DERIVATIVE INSTRUMENTS AND HEDGING ACTIVITIES
Risk Management Objective of Using Derivatives
The Company is exposed to certain risks arising from both its business operations and economic conditions. TheCompany principally manages its exposures to a wide variety of business and operational risks throughmanagement of its core business activities. The Company manages economic risks, including interest rate,liquidity and credit risk primarily by managing the amount, sources and duration of its debt funding and the useof derivative financial instruments. Specifically, the Company enters into derivative financial instruments tomanage exposures that arise from business activities that result in the receipt or payment of future known anduncertain cash amounts, the value of which are determined by interest rates. The Company’s derivative financialinstruments are used to manage differences in the amount, timing and duration of the Company’s known orexpected cash receipts and its known or expected cash payments principally related to the Company’sborrowings.
As of December 31, 2014 and 2013, the Company did not have any derivatives outstanding that were notdesignated in hedge accounting relationships.
Cash Flow Hedges of Interest Rate Risk
The Company’s objectives in using interest rate derivatives are to add stability to interest expense and to manageits exposure to interest rate movements. To accomplish this objective, the Company primarily uses interest rateswaps as part of its interest rate risk management strategy. During the year ended December 31, 2014, suchderivatives were used to hedge the variable cash flows associated with existing variable-rate debt. As ofDecember 31, 2014, the Company had three outstanding interest rate swaps with a combined notional value of$1,000,000 that were designated as cash flow hedges of interest rate risk. In connection with Amendment No. 5to the Senior Secured Credit Facility on May 14, 2013, the Company restructured two of its then existing interestrate swaps to match the refinanced debt. The restructuring of the interest rate swaps required a re-designation ofthe hedge accounting relationship. The re-designation is expected to result in the recognition of a minimalamount of ineffectiveness throughout the remaining term of the interest rate swaps.
The effective portion of changes in the fair value of derivatives designated and that qualify as cash flow hedges isrecorded in accumulated other comprehensive (loss) income and is subsequently reclassified into earnings in theperiod that the hedged forecasted transaction affects earnings. The ineffective portion of the change in fair valueof the derivatives is recognized directly in earnings. During the year ended December 31, 2014, there was noineffective portion recognized in earnings. Amounts reported in accumulated other comprehensive (loss) incomerelated to derivatives will be reclassified to interest expense as interest payments are made on the Company’svariable-rate debt. During the next 12 months, the Company estimates that an additional $2,510 will bereclassified as an increase to interest expense.
F-27

SEAWORLD ENTERTAINMENT, INC. AND SUBSIDIARIESNOTES TO CONSOLIDATED FINANCIAL STATEMENTS
(DOLLARS IN THOUSANDS, EXCEPT PER SHARE AMOUNTS)
Tabular Disclosure of Fair Values of Derivative Instruments on the Balance Sheet
The table below presents the fair value of the Company’s derivative financial instruments as well as theirclassification on the consolidated balance sheet as of December 31, 2014 and 2013:
Liability DerivativesAs of December 31, 2014
Asset DerivativesAs of December 31, 2013
Balance SheetLocation Fair Value
Balance SheetLocation Fair Value
Derivatives designated as hedging instruments:Interest rate swaps Other liabilities $628 Other assets $71
Total derivatives designated as hedging instruments $628 $71
The unrealized loss on derivatives is recorded net of a tax benefit of $286 for the year ended December 31, 2014,and is included within the accompanying consolidated statements of comprehensive income. The unrealized gainon derivatives is recorded net of a tax expense of $632 for the year ended December 31, 2013, and is includedwithin the accompanying consolidated statements of comprehensive income.
Tabular Disclosure of the Effect of Derivative Instruments on the Statements of Comprehensive Income
The table below presents the pre-tax effect of the Company’s derivative financial instruments on theaccompanying consolidated statements of comprehensive income for the years ended December 31, 2014 and2013:
2014 2013
Derivatives in Cash Flow Hedging Relationships:Gain related to effective portion of derivatives recognized in
accumulated other comprehensive income (loss) $ 1,846 $ 386(Loss) gain related to effective portion of derivatives reclassified
from accumulated other comprehensive income (loss) tointerest expense $(2,626) $1,511
Gain (loss) related to ineffective portion of derivatives recognizedin other (income) expense $ — $ —
Credit Risk-Related Contingent Features
The Company has agreements with each of its derivative counterparties that contain a provision where if theCompany defaults on any of its indebtedness, including default where repayment of the indebtedness has notbeen accelerated by the lender, then the Company could also be declared in default on its derivative obligations.As of December 31, 2014, the termination value of derivatives in a net liability position, which includes accruedinterest but excludes any adjustment for nonperformance risk, related to these agreements was $662. As ofDecember 31, 2014, the Company has posted no collateral related to these agreements. If the Company hadbreached any of these provisions at December 31, 2014, it could have been required to settle its obligations underthe agreements at their termination value of $662.
F-28

SEAWORLD ENTERTAINMENT, INC. AND SUBSIDIARIESNOTES TO CONSOLIDATED FINANCIAL STATEMENTS
(DOLLARS IN THOUSANDS, EXCEPT PER SHARE AMOUNTS)
Changes in Accumulated Other Comprehensive Income (Loss)
The following table reflects the changes in accumulated other comprehensive income (loss) for the year endedDecember 31, 2014, net of tax:
Gains (Losses) onCash Flow Hedges
Accumulated other comprehensive income (loss):Balance at December 31, 2013 $ 11
Other comprehensive income beforereclassifications 1,169
Amounts reclassified from accumulated othercomprehensive income (loss) to interestexpense (1,663)
Unrealized loss on derivatives, net of tax (494)
Balance at December 31, 2014 $ (483)
13. INCOME TAXES
For the years ended December 31, 2014, 2013 and 2012, the provision for income taxes is comprised of thefollowing:
2014 2013 2012
Current income tax (benefit) provisionFederal $ (70) $ (113) $ (70)State 937 1,086 542Foreign 5 13 31
Total current income tax provision 872 986 503
Deferred income tax provision (benefit):Federal 30,414 28,628 36,030State (2,414) (3,900) 907
Total deferred income tax provision 28,000 24,728 36,937
Total income tax provision $28,872 $25,714 $37,440
The deferred income tax provision represents the net tax effects of temporary differences between the carryingamounts of assets and liabilities for financial reporting purposes and the amounts used for income tax purposes.Cash paid for income taxes totaled $858, $923 and $767, for the years ended December 31, 2014, 2013 and 2012,respectively.
F-29

SEAWORLD ENTERTAINMENT, INC. AND SUBSIDIARIESNOTES TO CONSOLIDATED FINANCIAL STATEMENTS
(DOLLARS IN THOUSANDS, EXCEPT PER SHARE AMOUNTS)
The components of deferred income tax assets and liabilities as of December 31, 2014 and 2013 are as follows:
2014 2013
Deferred income tax assets:Acquisition and debt related costs $ 20,319 $ 8,640Net operating loss 269,002 270,467Self-insurance 9,666 8,686Deferred revenue 1,021 2,134Other 10,689 8,156
Total deferred income tax assets 310,697 298,083Valuation allowance (1,507) —
Net deferred tax assets 309,190 298,083Deferred income tax liabilities:
Property and equipment (278,851) (245,418)Goodwill (35,396) (28,242)Amortization (15,226) (12,613)Other (4,209) (8,593)
Total deferred income tax liabilities (333,682) (294,866)
Net deferred income tax (liabilities) assets $ (24,492) $ 3,217
The Company files federal, state and provincial income tax returns in various jurisdictions with varying statute oflimitation expiration dates. Under the tax statute of limitations applicable to the Internal Revenue Code of 1986,as amended (the “Code”), the Company is no longer subject to U.S. federal income tax examinations by theInternal Revenue Service for years before 2011. However, because the Company is carrying forward income taxattributes, such as net operating losses and tax credits from 2010 and earlier tax years, these attributes can still beaudited when utilized on returns filed in the future. The Company has determined that there are no positionscurrently taken that would rise to a level requiring an amount to be recorded or disclosed as an uncertain taxposition. If such positions do arise, it is the Company’s intent that any interest or penalty amount related to suchpositions will be recorded as a component of the income tax provision in the applicable period.
The Company has federal tax net operating loss carryforwards of approximately $650,000 as of December 31,2014 and state net operating loss carryforwards spread across various jurisdictions with a combined total ofapproximately $970,000 as of December 31, 2014. These net operating loss carryforwards, if not used to reducetaxable income in future periods, will begin to expire in 2029, for both federal and state tax purposes.
Realization of the deferred income tax assets, primarily arising from these net operating loss carryforwards andcharitable contribution carryforwards, is dependent upon generating sufficient taxable income prior to expirationof the carryforwards, which may include the reversal of deferred tax liability components. The 2009 charitablecontribution that was due to expire in the current year was written off in the Company’s deferred analysis. TheCompany believes it is more likely than not that the benefit from certain charitable contribution carryforwardsexpiring in 2015 will not be realized. Due to the uncertainty of realizing a benefit from the deferred tax assetsrecorded for charitable contribution carryforwards expiring in 2015, a valuation allowance of approximately$1,500 was recognized for the year ended December 31, 2014.
Due to the secondary offerings in December 2013 and April 2014, there were ownership shifts of more than 50%,as defined by Section 382 of the Code. The Company determined that, while an ownership shift occurred and
F-30

SEAWORLD ENTERTAINMENT, INC. AND SUBSIDIARIESNOTES TO CONSOLIDATED FINANCIAL STATEMENTS
(DOLLARS IN THOUSANDS, EXCEPT PER SHARE AMOUNTS)
limits were determined under Section 382 and the regulations and guidance thereunder, the applicable limitswould not impair the value or anticipated use of the Company’s federal and state net operating losses. Althoughrealization is not assured, management believes it is more likely than not that all of the deferred income tax assetsrelated to federal and state tax net operating loss carryforwards will be realized.
The provision for income taxes for the years ended December 31, 2014, 2013 and 2012 differs from the amountcomputed by applying the U.S. federal statutory income tax rate to the Company’s income before income taxesprimarily due to state income taxes, a prior year adjustment, and federal tax credits. The prior year adjustmentrelates to the revaluation of state net operating loss carryforwards resulting in a net benefit of $2,977. In additionto these items, for the year ended December 31, 2014, non-deductible offering costs, certain officercompensation, certain equity compensation awards and a valuation allowance related to certain charitablecontribution carryforwards also impacted the provision for income taxes.
The reconciliation between the U.S. federal statutory income tax rate and the Company’s effective income taxprovision rate for the years ended December 31, 2014, 2013 and 2012, is as follows:
2014 2013 2012
Income tax rate at federal statutory rates 35.00% 35.00% 35.00%State taxes, net of federal benefit 1.32 (0.77) 1.24State net operating loss revaluation (3.78) — —Charitable contribution carryforward valuation allowance 1.91 — —Other 2.19 (1.11) (2.71)
Income tax rate 36.64% 33.12% 33.53%
14. COMMITMENTS AND CONTINGENCIES
At December 31, 2014, the Company has commitments under long-term operating leases requiring annualminimum lease payments as follows:
Years Ending December 31,
2015 $ 15,6482016 15,0342017 15,0562018 14,9232019 13,927
Thereafter 298,451
Total $373,039
Rental expense was $21,643, $24,338 and $23,886 for the years ended December 31, 2014, 2013 and 2012,respectively.
The SeaWorld theme park in San Diego, California, leases the land for the theme park from the City of SanDiego. The lease term is for 50 years ending on July 1, 2048. Lease payments are based upon gross revenue fromthe San Diego theme park subject to certain minimums. On January 1, 2014, the minimum annual rent paymentwas recalculated in accordance with the lease agreement as approximately $10,400 and is included in the tableabove for all periods presented. This annual rent will remain in effect until January 1, 2017, at which time thenext recalculation will be completed in accordance with the lease agreement.
F-31

SEAWORLD ENTERTAINMENT, INC. AND SUBSIDIARIESNOTES TO CONSOLIDATED FINANCIAL STATEMENTS
(DOLLARS IN THOUSANDS, EXCEPT PER SHARE AMOUNTS)
Pursuant to license agreements with Sesame Workshop, the Company pays a specified annual license fee, as wellas a specified royalty based on revenues earned in connection with sales of licensed products, all food andbeverage items utilizing the licensed elements and any events utilizing such elements if a separate fee is paid forsuch event.
ABI has granted the Company a perpetual, exclusive, worldwide, royalty-free license to use the Busch Gardenstrademark and certain related domain names in connection with the operation, marketing, promotion andadvertising of certain of the Company’s theme parks, as well as in connection with the production, use,distribution and sale of merchandise sold in connection with such theme parks. Under the license, the Companyis required to indemnify ABI against losses related to the use of the marks.
The Company has commenced construction of certain new theme park attractions and other projects undercontracts with various third parties. At December 31, 2014, additional capital payments of approximately$43,000 are necessary to complete these projects. The majority of these projects are expected to be completed in2015.
On September 9, 2014, a purported stockholder class action lawsuit consisting of purchasers of the Company’scommon stock during the periods between April 18, 2013 to August 13, 2014, captioned Baker v. SeaWorldEntertainment, Inc., et al., Case No. 14-CV-02129-MMA (KSC), was filed in the U.S. District Court for theSouthern District of California (the “Court”) against the Company, the Chairman of the Company’s Board ofDirectors, certain of its executive officers and Blackstone. The complaint alleges that the prospectus andregistration statements filed contained materially false and misleading information in violation of the federalsecurities laws and seeks unspecified compensatory damages and other relief. On December 10, 2014, the Courtentered an Order Granting Motion for Appointment as Lead Plaintiff and Selection of Counsel, appointingPensionskassen For Børne- Og Ungdomspædagoger and Arkansas Public Employees Retirement System as LeadPlaintiffs. On December 29, 2014, the Court entered an Order Granting Joint Motion for Scheduling Ordersetting Lead Plaintiffs’ time to file any amended complaint on or before February 27, 2015. The Companybelieves that the class action lawsuit is without merit and intends to defend the lawsuit vigorously; however,there can be no assurance regarding the ultimate outcome of this lawsuit.
On December 8, 2014, a putative derivative lawsuit captioned Kistenmacher v. Atchison, et al., Civil ActionNo. 10437, was filed in the Court of Chancery of the State of Delaware against, among others, the Chairman ofthe Board of Directors, certain of the Company’s executive officers, directors and shareholders, and Blackstone.The Company is a “Nominal Defendant” in the lawsuit. The complaint alleges, among other things, that thedefendants breached their fiduciary duties and were unjustly enriched by (i) including materially false andmisleading information in the prospectus and registration statements; and (ii) causing the Company to repurchasecertain shares of its common stock from certain shareholders at an alleged artificially inflated price. OnFebruary 25, 2015, the Court of Chancery granted the parties’ joint stipulation setting forth deadlines for thefiling of an amended complaint, defendants’ response, and a briefing schedule in the event defendants file amotion to dismiss that trails behind the due dates in the class action lawsuit by thirty days. The Company doesnot maintain any direct exposure to loss in connection with this shareholder derivative lawsuit as the lawsuit doesnot assert any claims against the Company. The Company’s status as a “Nominal Defendant” in the actionreflects the fact that the lawsuit is maintained by the named plaintiff on behalf of the Company and that theplaintiff seeks damages on the Company’s behalf.
In addition, the Company is a party to other various claims and legal proceedings arising in the normal course ofbusiness. From time to time, third-party groups may also bring lawsuits against the Company. Matters where anunfavorable outcome to the Company is probable and which can be reasonably estimated are accrued. Suchaccruals, which are not material for any period presented, are based on information known about the matters, the
F-32

SEAWORLD ENTERTAINMENT, INC. AND SUBSIDIARIESNOTES TO CONSOLIDATED FINANCIAL STATEMENTS
(DOLLARS IN THOUSANDS, EXCEPT PER SHARE AMOUNTS)
Company’s estimate of the outcomes of such matters, and the Company’s experience in contesting, litigating andsettling similar matters. Matters that are considered reasonably possible to result in a material loss are notaccrued for, but an estimate of the possible loss or range of loss is disclosed, if such amount or range can bedetermined. Management does not expect any known claims or legal proceedings to have a material adverseeffect on the Company’s consolidated financial position, results of operations or cash flows.
15. FAIR VALUE MEASUREMENTS
Fair value is a market-based measurement, not an entity-specific measurement. Therefore, a fair valuemeasurement is required to be determined based on the assumptions that market participants would use in pricingthe asset or liability. As a basis for considering market participant assumptions in fair value measurements, fairvalue accounting standards establish a fair value hierarchy that distinguishes between market participantassumptions based on market data obtained from sources independent of the reporting entity (observable inputsthat are classified within Levels 1 and 2 of the hierarchy) and the reporting entity’s own assumptions aboutmarket participant assumptions (unobservable inputs classified within Level 3 of the hierarchy).
The Company has determined that the majority of the inputs used to value its derivative financial instrumentsusing the income approach fall within Level 2 of the fair value hierarchy. The Company uses readily availablemarket data to value its derivatives, such as interest rate curves and discount factors. ASC 820, Fair ValueMeasurement also requires consideration of credit risk in the valuation. The Company uses a potential futureexposure model to estimate this credit valuation adjustment (“CVA”). The inputs to the CVA are largely basedon observable market data, with the exception of certain assumptions regarding credit worthiness which make theCVA a Level 3 input. Based on the magnitude of the CVA, it is not considered a significant input and thederivatives are classified as Level 2. Of the Company’s long-term obligations, the Term B-2 Loans are classifiedin Level 2 of the fair value hierarchy. The fair value of the term loans as of December 31, 2014 approximatestheir carrying value due to the variable nature of the underlying interest rates and the frequent intervals at whichsuch interest rates are reset. The Senior Notes are classified in Level 3 of the fair value hierarchy and have beenvalued using significant inputs that are not observable in the market including a discount rate of 11.37% andprojected cash flows of the underlying Senior Notes.
The Company did not have any assets measured at fair value at December 31, 2014. There were no transfersbetween Levels 1, 2 or 3 during the year ended December 31, 2014. The following table presents the Company’sestimated fair value measurements and related classifications as of December 31, 2014:
Quoted Prices inActive Markets
for IdenticalAssets andLiabilities(Level 1)
SignificantOther
ObservableInputs
(Level 2)
SignificantUnobservable
Inputs(Level 3)
Balance atDecember 31,
2014
Liabilities:Derivative financial instruments (a) $ — $ 628 $ — $ 628Long-term obligations (b) $ — $1,352,438 $263,197 $1,615,635
(a) Reflected at fair value in the consolidated balance sheet as other liabilities of $628.(b) Reflected at carrying value in the consolidated balance sheet as current maturities on long-term debt of
$14,050 and long-term debt of $1,589,403 as of December 31, 2014.
F-33

SEAWORLD ENTERTAINMENT, INC. AND SUBSIDIARIESNOTES TO CONSOLIDATED FINANCIAL STATEMENTS
(DOLLARS IN THOUSANDS, EXCEPT PER SHARE AMOUNTS)
There were no transfers between Levels 1, 2 or 3 during the year ended December 31, 2013. The following tablepresents the Company’s estimated fair value measurements and related classifications as of December 31, 2013:
Quoted Prices inActive Markets
for IdenticalAssets andLiabilities(Level 1)
SignificantOther
ObservableInputs
(Level 2)
SignificantUnobservable
Inputs(Level 3)
Balance atDecember 31,
2013
Assets:Derivative financial instruments (a) $ — $ 71 $ — $ 71
Liabilities:Long-term obligations (b) $ — $1,397,975 $264,781 $1,662,756
(a) Reflected at fair value in the consolidated balance sheet as other assets of $71.(b) Reflected at carrying value in the consolidated balance sheet as current maturities on long-term debt of
$14,050 and long-term debt of $1,632,531 as of December 31, 2013.
16. RELATED-PARTY TRANSACTIONS
Dividend Payments
On January 5, 2015, the Board declared a cash dividend of $0.21 per share to all common stockholders of recordat the close of business on January 13, 2015, which was paid on January 22, 2015. In connection with thisdividend declaration, certain affiliates of Blackstone were paid dividends in the amount of $4,095.
In March 2014, the Board declared a cash dividend of $0.20 per share to all common stockholders of record atthe close of business on March 20, 2014. In May and September 2014, the Board declared a cash dividend of$0.21 per share to all common stockholders of record at the close of business on June 20 and September 29,2014, respectively (see Note 19–Stockholders’ Equity). In connection with these dividend declarations, certainaffiliates of Blackstone were paid dividends in the amount of $7,849, $4,252 and $4,095 on April 1, July 1, andOctober 6, 2014, respectively.
In June, September and December 2013, the Board declared a cash dividend of $0.20 per share to all commonstockholders of record at the close of business on June 20, September 20 and December 20, 2013, respectively(see Note 19–Stockholders’ Equity). In connection with these dividend declarations, certain affiliates ofBlackstone were paid dividends in the amount of $11,749, $11,749 and $7,849, on July 1, 2013, October 1, 2013,and January 3, 2014, respectively.
In March 2012, the Company declared and subsequently paid a $500,000 cash dividend to its commonstockholders, which at that time consisted of entities controlled by certain affiliates of Blackstone.
Share Repurchases
The Company repurchased shares of its common stock from the selling stockholders concurrently with theclosing of the respective secondary offerings in December 2013 and April 2014. See further discussion inNote 19—Stockholders’ Equity.
Advisory Agreement
Prior to April 2013, certain affiliates of Blackstone provided monitoring, advisory and consulting services to theCompany under an advisory fee agreement (the “2009 Advisory Agreement”), which was terminated on April 24,
F-34

SEAWORLD ENTERTAINMENT, INC. AND SUBSIDIARIESNOTES TO CONSOLIDATED FINANCIAL STATEMENTS
(DOLLARS IN THOUSANDS, EXCEPT PER SHARE AMOUNTS)
2013 in connection with the completion of the initial public offering (see Note 19–Stockholders’ Equity). Feesrelated to these services, which were based upon a multiple of Adjusted EBITDA as defined in the 2009Advisory Agreement, amounted to $2,799 and $6,201 for the years ended December 31, 2013 and 2012,respectively. These amounts are included in selling, general and administrative expenses in the accompanyingconsolidated statements of comprehensive income. There were no fees related to these services in the year endedDecember 31, 2014 due to the termination of the 2009 Advisory Agreement in April 2013.
In connection with the completion of the initial public offering in April 2013 (see Note 19–Stockholders’Equity), the 2009 Advisory Agreement between the Company and affiliates of Blackstone was terminated(except for certain provisions relating to indemnification and certain other provisions, which survivedtermination). In connection with such termination, the Company paid a termination fee of $46,300 to Blackstoneusing a portion of the net proceeds from the offering and wrote-off $3,772 of the 2013 prepaid advisory fee. Thecombined expense of $50,072 was recorded as termination of advisory agreement during the year endedDecember 31, 2013 in the accompanying consolidated statements of comprehensive income.
17. RETIREMENT PLAN
The Company sponsors a defined contribution plan, under Section 401(k) of the Internal Revenue Code. The planis a qualified automatic contributions arrangement, which automatically enrolls employees, once eligible, unlessthey opt out. The Company makes matching cash contributions subject to certain restrictions, structured as a100% match on the first 1% contributed by the employee and a 50% match on the next 5% contributed by theemployee. Employer matching contributions for the years ended December 31, 2014, 2013 and 2012, totaled$7,790, $8,956 and $8,767, respectively.
18. EQUITY-BASED COMPENSATION
In accordance with ASC 718, Compensation-Stock Compensation, the Company measures the cost of employeeservices rendered in exchange for share-based compensation based upon the grant date fair market value. Thecost is recognized over the requisite service period, which is generally the vesting period.
Pre-IPO Incentive Plan
Employee Units Surrendered for Common Stock
Prior to April 18, 2013, the Partnerships granted Employee Units to certain key employees of SEA (“EmployeeUnits”) under the Employee Unit Incentive Plan (“Pre-IPO Incentive Plan”). The Employee Units which weregranted were accounted for as equity awards and were divided into three tranches, Time-Vesting Units(“TVUs”), 2.25x Performance Vesting Units (“PVUs”) and 2.75x PVUs. There was no related cost to theemployee upon vesting of the units. Separately, certain members of management in 2011 also purchased Class DUnits of the Partnerships (“Class D Units”).
Prior to the consummation of the Company’s initial public offering, on April 18, 2013, the Employee Units andClass D Units held by certain of the Company’s directors, officers, employees and consultants were surrenderedto the Partnerships and such individuals received an aggregate of 4,165,861 shares of the Company’s issued andoutstanding common stock from the Partnerships. The number of shares of the Company’s common stockreceived by such individuals from the Partnerships was determined in a manner intended to replicate theeconomic value to each equity holder immediately prior to the transaction. The Class D Units and vested
F-35

SEAWORLD ENTERTAINMENT, INC. AND SUBSIDIARIESNOTES TO CONSOLIDATED FINANCIAL STATEMENTS
(DOLLARS IN THOUSANDS, EXCEPT PER SHARE AMOUNTS)
Employee Units were surrendered for an aggregate of 949,142 shares of common stock. The unvested EmployeeUnits were surrendered for an aggregate of 3,216,719 unvested restricted shares of the Company’s commonstock, which were subject to vesting terms substantially similar to those applicable to the unvested EmployeeUnits immediately prior to the transaction. These unvested restricted shares consisted of Time Restricted shares,and 2.25x and 2.75x Performance Restricted shares, which, for accounting purposes, were removed from issuedshares until their restrictions are met, as shown on the accompanying consolidated statement of changes instockholders’ equity.
Pre-IPO Incentive Plan TVUs and Time Restricted Shares
One-third of the Pre-IPO Incentive Plan Employee Units originally granted were TVUs and vested over fiveyears (20% per year). Vesting was contingent upon continued employment. The TVUs were originally recordedat the fair market value at the date of grant and were being amortized to compensation expense over the vestingperiod.
The unvested Time Restricted shares received upon surrender of the TVUs contained substantially the sameterms, conditions and vesting schedules as the previously outstanding TVUs. In accordance with the guidance inASC 718-20, Compensation-Stock Compensation, the surrender of the TVUs for shares of common stock andTime Restricted shares qualified as a modification of an equity compensation plan. As such, the Companycalculated the incremental fair value of the TVUs immediately prior to and after their modification anddetermined that $282 of incremental equity compensation cost would be recorded upon surrender of the vestedTVUs for vested shares of stock in the year ended December 31, 2013. The remaining incremental compensationcost of $220 which represented the incremental cost on the unvested TVUs surrendered for unvested TimeRestricted shares, was added to the original grant date fair value of the respective awards and is being amortizedto compensation expense over the remaining vesting period.
Total combined compensation expense related to these Pre-IPO Incentive Plan TVU and Time Restricted shareawards was $955, $1,938 and $1,191 for the years ended December 31, 2014, 2013 and 2012, respectively, and isincluded in selling, general and administrative expenses in the accompanying consolidated statement ofcomprehensive income and as contributed capital in the accompanying consolidated statements of stockholders’equity. Total unrecognized compensation cost related to the unvested Pre-IPO Incentive Plan Time Restrictedshares, expected to be recognized over the remaining vesting term was approximately $358 as of December 31,2014.
The activity related to the Pre-IPO Incentive Plan Time Restricted share awards for the year ended December 31,2014, is as follows:
Shares
Weighted AverageGrant Date FairValue per Share
Weighted AverageRemaining
Contractual Term
Pre-IPO Incentive Plan Time Restricted shares: (not in thousands)Outstanding at December 31, 2013 375,480 $4.19Granted — —Vested (258,064) $3.95Forfeited (3,343) $3.82
Outstanding at December 31, 2014 114,073 $4.72 11 months
There were no Pre-IPO Incentive Plan TVUs or Time Restricted shares granted in the years ended December 31,2014 or 2013. The weighted average grant date fair value of Pre-IPO Incentive Plan TVUs granted during the
F-36

SEAWORLD ENTERTAINMENT, INC. AND SUBSIDIARIESNOTES TO CONSOLIDATED FINANCIAL STATEMENTS
(DOLLARS IN THOUSANDS, EXCEPT PER SHARE AMOUNTS)
year ended December 31, 2012 was $23.15 per share. The total fair value of Pre-IPO Incentive Plan TVUs andTime Restricted shares which vested during the years ended December 31, 2014, 2013 and 2012 wasapproximately $1,020, $1,050 and $850, respectively.
Pre-IPO Incentive Plan 2.25x and 2.75x PVUs and Performance Restricted Shares
One-third of the Pre-IPO Incentive Plan Employee Units originally granted were 2.25x PVUs and the remainingone-third of the Pre-IPO Incentive Plan Employee Units were 2.75x PVUs. The 2.25x and 2.75x PVUs containedvesting conditions based on certain events occurring. The unvested 2.25x and 2.75x Performance Restrictedshares received upon surrender of the unvested 2.25x and 2.75x PVUs contained substantially the same terms andvesting conditions as the previously outstanding 2.25x and 2.75x PVUs.
The 2.25x Performance Restricted shares received upon surrender of the 2.25x PVUs will vest if the employee isemployed by the Company when and if certain investment funds affiliated with Blackstone receive cash proceeds(not subject to any clawback, indemnity or similar contractual obligation) in respect of its Partnerships unitsequal to (x) a 20% annualized effective compounded return rate on such funds’ investment and (y) a 2.25xmultiple on such funds’ investment.
The 2.75x Performance Restricted shares received upon surrender of the 2.75x PVUs will vest if the employee isemployed by the Company when and if such funds receive cash proceeds (not subject to any clawback,indemnity or similar contractual obligation) in respect of its Partnerships units equal to (x) a 15% annualizedeffective compounded return rate on such funds’ investment and (y) a 2.75x multiple on such funds’ investment.
The 2.25x and 2.75x Performance Restricted shares received upon surrender of the 2.25x and 2.75x PVUs haveno termination date other than termination of employment from the Company and no service or time vestingconditions other than continued employment through the time the performance benchmark is reached. Nocompensation expense was recorded related to the Pre-IPO Incentive Plan 2.25x and 2.75x PVUs prior toApril 18, 2013, since their vesting was not considered probable. No compensation expense will be recordedrelated to the Pre-IPO Incentive Plan 2.25x and 2.75x Performance Restricted shares until their vesting isprobable. Accordingly, no compensation expense has been recorded during the years ended December 31, 2014,2013 or 2012 related to these PVUs or Performance Restricted shares.
In accordance with the guidance in ASC 718-20, Compensation-Stock Compensation, the surrender of theunvested PVUs for unvested Performance Restricted shares of stock qualified as a modification of an equitycompensation plan. In December 2014, conditions for eligibility on approximately 576,000 Pre-IPO IncentivePlan Performance Restricted shares were modified to allow those participants holding such shares who wereseparating from the Company to vest in their respective shares if the performance conditions are achieved aftertheir employment ends with the Company, subject to their continued compliance with applicable post-termination restrictive covenants (see Note 4–Restructuring Program and Separation Costs). This also qualifiedas a modification of an equity award. As the 2.25x and 2.75x Performance Restricted shares were not consideredprobable of vesting before or after either modification, the Company will use the respective modification datefair value to record compensation expense related to these shares if the performance conditions become probablewithin a future reporting period. The impact of this modification reduced the fair value of the respective sharesby approximately $1,650 and $3,230 for the Pre-IPO Incentive Plan 2.25x and 2.75x Performance Restrictedshares, respectively. Unrecognized compensation expense as of December 31, 2014, was approximately $26,085and $15,350 for the Pre-IPO Incentive Plan 2.25x and 2.75x Performance Restricted shares, respectively.
F-37

SEAWORLD ENTERTAINMENT, INC. AND SUBSIDIARIESNOTES TO CONSOLIDATED FINANCIAL STATEMENTS
(DOLLARS IN THOUSANDS, EXCEPT PER SHARE AMOUNTS)
The activity related to the Pre-IPO Incentive Plan 2.25x Performance Restricted shares for the year endedDecember 31, 2014, is as follows:
Shares
Weighted AverageGrant Date FairValue per Share
Pre-IPO Incentive Plan 2.25x Performance Restricted shares: (not in thousands)Outstanding at December 31, 2013 1,308,752 $21.49Granted — —Vested — —Forfeited (18,217) $21.49
Outstanding at December 31, 2014 1,290,535 $20.21
There were no Pre-IPO Incentive Plan 2.25x PVUs or Performance Restricted shares granted in the years endedDecember 31, 2014 or 2013. The weighted average grant date fair value of the Pre-IPO Incentive Plan 2.25xPVUs granted during the year ended December 31, 2012 was $15.66 per share. There were no Pre-IPO IncentivePlan 2.25x PVUs or Performance Restricted shares which vested in the years ended December 31, 2014, 2013and 2012.
The activity related to the Pre-IPO Incentive Plan 2.75x Performance Restricted shares for the year endedDecember 31, 2014, is as follows:
Shares
Weighted AverageGrant Date FairValue per Share
Pre-IPO Incentive Plan 2.75x Performance Restricted shares: (not in thousands)Outstanding at December 31, 2013 1,308,752 $14.40Granted — —Vested — —Forfeited (18,217) $14.40
Outstanding at December 31, 2014 1,290,535 $11.89
There were no Pre-IPO Incentive Plan 2.75x PVUs or Performance Restricted shares granted in the years endedDecember 31, 2014 or 2013. The weighted average grant date fair value of the Pre-IPO Incentive Plan 2.75xPVUs granted during the year ended December 31, 2012 was $10.52 per share. There were no Pre-IPO IncentivePlan 2.75x PVUs or Performance Restricted shares which vested in the years ended December 31, 2014, 2013and 2012.
Pre-IPO Incentive Plan Fair Value Assumptions
The fair value of each Pre-IPO Incentive Plan Employee Unit originally granted prior to April 18, 2013 wasestimated on the date of grant using a composite of the discounted cash flow model and the guideline publiccompany approach to determine the underlying enterprise value. The discounted cash flow model was basedupon significant inputs that are not observable in the market. Key assumptions included projected cash flows, adiscount rate of 10.5%, and a terminal value. The guideline public company approach uses relevant publiccompany valuation multiples to determine fair value. The value of the individual equity tranches was allocatedbased upon the Option-Pricing Method model. Significant assumptions included a holding period of 2.6 to 3.6years, a risk free rate of 0.33% to 1.22%, volatility of approximately 49% to 57%, a discount for lack of
F-38

SEAWORLD ENTERTAINMENT, INC. AND SUBSIDIARIESNOTES TO CONSOLIDATED FINANCIAL STATEMENTS
(DOLLARS IN THOUSANDS, EXCEPT PER SHARE AMOUNTS)
marketability, depending upon the units, from 31% to 53% and a 0% dividend yield. Volatility for SEA’s stock atthe date of grant was estimated using the average volatility calculated for a peer group, which is based upon dailyprice observations over the estimated term of units granted.
In order to calculate the incremental fair value when the unvested Employee Units were surrendered for unvestedrestricted shares on April 18, 2013, the Option-Pricing Method model was used to estimate the fair value prior tothe modification. For the fair value after the modification, the initial public offering price of $27.00 per share wasused to calculate the fair value of the TVUs while the fair value of the PVUs was estimated using an asset-or-nothing call option approach. Significant assumptions used in both the Option-Pricing Method model and theasset-or-nothing call option approach included a holding period of approximately 2 years from the initial publicoffering date, a risk free rate of 0.24%, a volatility of approximately 37.6% based on re-levered historical andimplied equity volatility of comparable companies and a 0% dividend yield.
In order to calculate the modification date fair value in December 2014, for certain Performance Restrictedshares, the asset-or-nothing call option approach was used. Significant assumptions included a holding period ofapproximately 1.5 years from the date of modification, a risk free rate of 0.38%, a volatility of approximately45.4% based on re-levered historical and implied equity volatility of comparable companies and a 0% dividendyield.
Omnibus Incentive Plan
The Company reserved 15,000,000 shares of common stock for future issuance under the Company’s 2013Omnibus Incentive Plan (“Omnibus Incentive Plan”). The Omnibus Incentive Plan is administered by thecompensation committee of the Board of Directors, and provides that the Company may grant equity incentiveawards to eligible employees, directors, consultants or advisors in the form of stock options, stock appreciationrights, restricted stock, restricted stock units and other stock-based and performance compensation awards. If anaward under the Omnibus Incentive Plan terminates, lapses, or is settled without the payment of the full numberof shares subject to the award, the undelivered shares may be granted again under the Omnibus Incentive Plan.
During the year ended December 31, 2014, the Company granted 33,273 time vesting restricted shares(“Omnibus Plan Time Restricted shares”) under the Omnibus Incentive Plan primarily to certain Board ofDirector members. These shares generally vest ratably over a three year term.
On April 19, 2013, 494,557 shares of restricted stock were granted to the Company’s directors, officers andemployees under the Omnibus Incentive Plan (the “2013 Grant”). The shares granted were in the form ofOmnibus Plan Time Restricted shares, 2.25x performance restricted shares (“Omnibus Plan 2.25x PerformanceRestricted shares”) and 2.75x performance restricted shares (“Omnibus Plan 2.75x Performance Restrictedshares”). The vesting terms and conditions of the 2013 Grant were substantially the same as those of the previousIncentive Plan (see the previous section under the caption Pre-IPO Incentive Plan 2.25x and 2.75x PVUs andPerformance Restricted Awards). After an initial 180 day post initial public offering lock up period, the vestingschedule from the Pre-IPO Incentive Plan carried over so that each recipient vested in the 2013 Grant in the sameproportion as they were vested in the previous Pre-IPO Incentive Plan. The remaining unvested shares vest overthe remaining service period, subject to substantially the same vesting conditions which carried over from theprevious Pre-IPO Incentive Plan.
F-39

SEAWORLD ENTERTAINMENT, INC. AND SUBSIDIARIESNOTES TO CONSOLIDATED FINANCIAL STATEMENTS
(DOLLARS IN THOUSANDS, EXCEPT PER SHARE AMOUNTS)
The activity related to the Omnibus Plan Time Restricted shares for the year ended December 31, 2014, is asfollows:
Shares
Weighted AverageGrant Date FairValue per Share
Weighted AverageRemaining
Contractual Term
Omnibus Plan Time Restricted shares: (not in thousands)Outstanding at December 31, 2013 59,160 $33.35Granted 33,273 $24.59Vested (41,519) $33.58Forfeited (442) $32.88
Outstanding at December 31, 2014 50,472 $27.40 17 months
The weighted average grant date fair value of the Omnibus Plan Time Restricted shares granted during the yearsended December 31, 2014 and 2013 was $24.59 and $33.45 per share, respectively. The total fair value ofOmnibus Plan Time Restricted shares which vested during the years ended December 31, 2014 and 2013 wasapproximately $1,390 and $3,770, respectively. There were no Omnibus Plan Time Restricted shares which weregranted or vested in the year ended December 31, 2012.
The activity related to the Omnibus Plan 2.25x Performance Restricted shares for the year ended December 31,2014, is as follows:
Shares
Weighted AverageGrant Date FairValue per Share
Omnibus Plan 2.25x Performance Restricted shares: (not in thousands)Outstanding at December 31, 2013 163,310 $30.46Granted — —Vested — —Forfeited (2,392) $30.46
Outstanding at December 31, 2014 160,918 $26.96
There were no Omnibus Plan 2.25x Performance Restricted shares granted in the years ended December 31, 2014or 2012. The weighted average grant date fair value of the Omnibus Plan 2.25x Performance Restricted sharesgranted during the year ended December 31, 2013 was $30.46 per share. There were no Omnibus Plan 2.25xPerformance Restricted shares which vested in the years ended December 31, 2014, 2013 and 2012.
The activity related to the Omnibus Plan 2.75x Performance Restricted shares for the year ended December 31,2014, is as follows:
Shares
Weighted AverageGrant Date FairValue per Share
Omnibus Plan 2.75x Performance Restricted shares: (not in thousands)Outstanding at December 31, 2013 163,310 $23.05Granted — —Vested — —Forfeited (2,392) $23.05
Outstanding at December 31, 2014 160,918 $18.32
F-40

SEAWORLD ENTERTAINMENT, INC. AND SUBSIDIARIESNOTES TO CONSOLIDATED FINANCIAL STATEMENTS
(DOLLARS IN THOUSANDS, EXCEPT PER SHARE AMOUNTS)
There were no Omnibus Plan 2.75x Performance Restricted shares granted in the years ended December 31, 2014or 2012. The weighted average grant date fair value of the Omnibus Plan 2.75x Performance Restricted sharesgranted during the year ended December 31, 2013 was $23.05 per share. There were no Omnibus Plan 2.75xPerformance Restricted shares which vested in the years ended December 31, 2014, 2013 and 2012.
Approximately $1,394 and $4,088 of compensation expense was recognized in the years ended December 31,2014 and 2013, respectively, related to grants under the Omnibus Incentive Plan. As of December 31, 2014,unrecognized compensation expense related to the Omnibus Plan Time Restricted shares was approximately$1,060 to be recognized over the remaining requisite service period.
Additionally, in December 2014, conditions for eligibility on approximately 77,000 Omnibus Plan PerformanceRestricted shares were modified to allow those participants holding such awards who were separating from theCompany to vest in their respective awards if the performance conditions are achieved after their employmentends with the Company, subject to their continued compliance with applicable post-termination restrictivecovenants (see Note 4–Restructuring Program and Separation Costs). There is no compensation expense recordedrelated to the Omnibus Plan 2.25x and 2.75x Performance Restricted shares until their vesting is probable. Theimpact of the modification reduced the fair value of the respective awards by approximately $560 and $760 forthe Omnibus Plan 2.25x and 2.75x Performance Restricted shares, respectively. Total unrecognizedcompensation expense as of December 31, 2014 was approximately $4,339 and $2,948 for the Omnibus Plan2.25x and 2.75x Performance Restricted shares, respectively.
Omnibus Incentive Plan Fair Value Assumptions
For Omnibus Plan Time Restricted Shares, the grant date fair value is determined based on the closing marketprice of the Company’s stock at the date of grant applied to the total number of shares that are anticipated to fullyvest. The grant date fair value of the Omnibus Plan 2.25x and 2.75x Performance Restricted shares was measuredusing the asset-or-nothing option pricing model. Significant assumptions included a holding period ofapproximately 2 years from the initial public offering date, a risk free rate of 0.24%, a volatility of approximately33.2% based on re-levered historical and implied equity volatility of comparable companies and a 0% dividendyield.
In order to calculate the modification date fair value in December 2014 for certain Performance Restricted shareswhich were modified, the asset-or-nothing call option approach was used. Significant assumptions included aholding period of approximately 1.5 years from the date of modification, a risk free rate of 0.38%, a volatility ofapproximately 45.4% based on re-levered historical and implied equity volatility of comparable companies and a0% dividend yield.
Other
Based on cash proceeds previously received by certain investment funds affiliated with Blackstone from theCompany’s initial public offering and subsequent secondary offerings of stock in December 2013 and April2014, the Company’s repurchase of shares directly from such funds and the cumulative dividends paid by theCompany through January 31, 2015, if such funds receive additional future cash proceeds of approximately$14,000, and other vesting conditions are satisfied, the Pre-IPO Incentive Plan 2.25x Performance Restrictedshares and Omnibus Plan 2.25x Performance Restricted shares will vest. Similarly, if such funds receiveadditional future cash proceeds of approximately $441,000, and other vesting conditions are satisfied, the Pre-IPO Incentive Plan 2.75x Performance Restricted shares and the Omnibus Plan 2.75x Performance Restricted
F-41

SEAWORLD ENTERTAINMENT, INC. AND SUBSIDIARIESNOTES TO CONSOLIDATED FINANCIAL STATEMENTS
(DOLLARS IN THOUSANDS, EXCEPT PER SHARE AMOUNTS)
shares will vest. As receipt of these future cash proceeds will be primarily related to liquidity events, such assecondary offerings of stock, the shares are not considered to be probable of vesting until such events areconsummated.
For the year ended December 31, 2014, the Company withheld an aggregate of 8,936 shares of its common stockfrom employees to satisfy minimum tax withholding obligations related to the vesting of restricted stock awards.As a result, these shares were added back to the number of shares of common stock available for future issuanceunder the Company’s Omnibus Incentive Plan. As of December 31, 2014, there were 14,511,216 shares ofcommon stock available for future issuance under the Company’s Omnibus Incentive Plan.
Subsequent Grants
On January 15, 2015, the Company granted 100,000 Omnibus Plan Time Restricted shares to its Interim ChiefExecutive Officer (the “Interim CEO”) in accordance with his appointment to such role (see further discussion inNote 4–Restructuring Program and Separation Costs). The shares had a grant date fair value per share of $16.50and will vest on the earlier of the start date of a new Chief Executive Officer or June 30, 2015. Also onJanuary 15, 2015, the Company granted 7,272 Omnibus Plan Time Restricted shares to a new Board member inaccordance with the Company’s Outside Director Compensation Policy. These shares had a grant date fair valueper share of $16.50 and vest ratably over a three year term.
19. STOCKHOLDERS’ EQUITY
As of December 31, 2014, 90,191,100 shares of common stock were issued on the accompanying consolidatedbalance sheet, which excludes 3,067,451 unvested shares of common stock held by certain participants in theCompany’s equity compensation plan (see Note 18–Equity-Based Compensation) and includes 4,105,970 sharesof treasury stock held by the Company (see Secondary Offerings and Concurrent Share Repurchases and ShareRepurchase Program discussion which follows).
Stock Split
On April 7, 2013, the Board authorized an eight-for-one split of the Company’s common stock, which waseffective on April 8, 2013. The Company retained the current par value of $0.01 per share for all shares ofcommon stock after the stock split, and accordingly, stockholders’ equity on the accompanying consolidatedbalance sheets and the consolidated statements of changes in stockholders’ equity reflects the stock split. TheCompany’s historical share and per share information has been retroactively adjusted to give effect to this stocksplit.
Contemporaneously with the stock split, the Board approved an increase in the number of authorized shares ofcommon stock to 1 billion shares. Additionally, in connection with the consummation of the initial publicoffering, the Board authorized 100,000,000 shares of preferred stock at a par value of $0.01 per share.
Initial Public Offering and Use of Proceeds
On April 24, 2013, the Company completed an initial public offering of its common stock in which it offered andsold 10,000,000 shares of common stock and the selling stockholders offered and sold 19,900,000 shares ofcommon stock including 3,900,000 shares of common stock pursuant to the exercise in full of the underwriters’over-allotment option. The common stock is listed on the New York Stock Exchange under the symbol “SEAS”.
F-42

SEAWORLD ENTERTAINMENT, INC. AND SUBSIDIARIESNOTES TO CONSOLIDATED FINANCIAL STATEMENTS
(DOLLARS IN THOUSANDS, EXCEPT PER SHARE AMOUNTS)
The Company’s shares of common stock were sold at an initial public offering price of $27.00 per share, whichgenerated net proceeds of approximately $245,400 to the Company after deducting underwriting discounts andcommissions, expenses and transaction costs. The Company did not receive any proceeds from shares sold by theselling stockholders. The Company used a portion of the net proceeds received in the offering to redeem(1) $140,000 in aggregate principal amount of its Senior Notes at a redemption price of 111.0% plus accrued andunpaid interest thereon and (2) to repay $37,000 of the outstanding indebtedness under the then existing Term BLoan. In addition, the Company used approximately $46,300 of the net proceeds received from the offering tomake a one-time payment to an affiliate of Blackstone in connection with the termination of the 2009 AdvisoryAgreement (see Note 16–Related-Party Transactions).
Secondary Offerings and Concurrent Share Repurchases
On December 17, 2013, the selling stockholders completed an underwritten secondary offering of 18,000,000shares of common stock. The selling stockholders received all of the net proceeds from the offering and noshares were sold by the Company. The Company incurred fees and expenses of $1,407 in connection with thissecondary offering which is shown as secondary offering expenses on the consolidated statement ofcomprehensive income for the year ended December 31, 2013.
On April 9, 2014, the selling stockholders completed an underwritten secondary offering of 17,250,000 shares ofcommon stock, including 2,250,000 shares pursuant to the exercise in full of the underwriters’ option to purchaseadditional shares. The selling stockholders received all of the net proceeds from the offering and no shares weresold by the Company. In the year ended December 31, 2014, the Company incurred fees and expenses of $747 inconnection with this secondary offering which is shown as secondary offering expenses on the accompanyingconsolidated statement of comprehensive income.
Concurrently with the closing of the secondary offerings in December 2013 and April 2014, the Companyrepurchased 1,500,000 and 1,750,000 shares, respectively, of its common stock directly from the sellingstockholders in private, non-underwritten transactions at a price per share equal to the price per share paid to theselling stockholders by the underwriters in the respective secondary offerings.
Share Repurchase Program
On August 12, 2014, the Board authorized the repurchase of up to $250,000 of the Company’s common stockbeginning on January 1, 2015 (the “Share Repurchase Program”). On December 16, 2014, the Board approved anamendment to the Share Repurchase Program to change the start date of such program from January 1, 2015 toDecember 17, 2014 and to authorize the repurchase of up to $15,000 of the Company’s common stock during theremainder of calendar year 2014. The other features of the Share Repurchase Program remained unchangedincluding the total amount authorized and available under the program of $250,000. Under the Share RepurchaseProgram, the Company is authorized to repurchase shares through open market purchases, privately-negotiatedtransactions or otherwise in accordance with applicable federal securities laws, including through Rule 10b5-1trading plans and under Rule 10b-18 of the Exchange Act. The Share Repurchase Program has no time limit andmay be suspended or discontinued completely at any time. The number of shares to be purchased and the timingof purchases will be based on the level of the Company’s cash balances, general business and market conditions,and other factors, including legal requirements, debt covenant restrictions and alternative investmentopportunities.
Pursuant to the Share Repurchase Program, during the fourth quarter of 2014, the Company entered into a writtentrading plan under Rule 10b5-1 of the Exchange Act and repurchased a total of 855,970 shares of common stock
F-43

SEAWORLD ENTERTAINMENT, INC. AND SUBSIDIARIESNOTES TO CONSOLIDATED FINANCIAL STATEMENTS
(DOLLARS IN THOUSANDS, EXCEPT PER SHARE AMOUNTS)
at an average price of $17.50 per share and a total cost of approximately $15,000, leaving $235,000 available forfuture repurchases under the Share Repurchase Program.
All of the repurchased shares from the Share Repurchase Program and the shares repurchased directly from theselling stockholders during the December 2013 and April 2014 secondary offerings were recorded as treasurystock at a total cost of $109,871 and $44,163 as of December 31, 2014 and 2013, respectively, and are reflectedas a reduction to stockholders’ equity on the accompanying consolidated balance sheets and consolidatedstatement of changes in stockholders’ equity.
Dividends
In 2013, the Board adopted a policy to pay, subject to legally available funds, a regular quarterly dividend. Thepayment and timing of cash dividends is within the discretion of the Board and depends on many factors,including, but not limited to, the Company’s results of operations, financial condition, level of indebtedness,capital requirements, contractual restrictions, restrictions in its debt agreements and in any preferred stock,business prospects and other factors that the Board may deem relevant.
During the years ended December 31, 2014 and 2013, the Board declared or paid quarterly cash dividends to allcommon stockholders of record as follows:
Record Date Payment Date
Cash Dividendper Common
Share
June 20, 2013 July 1, 2013 $0.20September 20, 2013 October 1, 2013 $0.20December 20, 2013 January 3, 2014 $0.20March 20, 2014 April 1, 2014 $0.20June 20, 2014 July 1, 2014 $0.21September 29, 2014 October 6, 2014 $0.21
On January 5, 2015, the Board declared a cash dividend of $0.21 per share to all common stockholders of recordat the close of business on January 13, 2015, which was paid on January 22, 2015.
As the Company had an accumulated deficit at the time the June 20, 2013, March 20, 2014 and June 20, 2014dividends were declared, these dividends were accounted for as a return of capital and recorded as a reduction toadditional paid-in capital on the accompanying consolidated statements of changes in stockholders’ equity.
Dividends paid to common stockholders were $72,113, $36,175 and $502,977 in the years ended December 31,2014, 2013 and 2012, respectively. For tax purposes, a portion of the 2014 dividends will be treated as a return ofcapital to stockholders. Distributions that qualify as a return of capital are not considered “dividends” for taxpurposes only.
In March 2012, the Company declared a $500,000 cash dividend to its common stockholders, which at that timeconsisted of entities controlled by certain affiliates of Blackstone. This dividend was considered a return ofcapital for both accounting and tax purposes.
Dividends on the Pre-IPO Incentive Plan and Omnibus Plan 2.25x and 2.75x Performance Restricted shares(collectively the “Performance Restricted shares”), were approximately $1,770 for each tranche and willaccumulate and be paid only if and to the extent the Performance Restricted shares vest in accordance with theirterms. The Company has not recorded a payable related to these dividends as the vesting of the PerformanceRestricted shares is not probable.
F-44

SEAWORLD ENTERTAINMENT, INC. AND SUBSIDIARIESNOTES TO CONSOLIDATED FINANCIAL STATEMENTS
(DOLLARS IN THOUSANDS, EXCEPT PER SHARE AMOUNTS)
20. ACQUISITIONS
In November 2012, the Company acquired Knott’s Soak City, a stand-alone Southern California water park, froman affiliate of Cedar Fair L.P, for a total price of $15,000. The Company paid $12,000 at closing and had a notepayable for the remaining $3,000 which was due and paid in the third quarter of 2013. For the year endedDecember 31, 2012, there were no material revenues or expenses associated with the park included in theaccompanying consolidated financial statements because the park was closed for the season. The Companyrebranded the water park as Aquatica San Diego and re-opened in June 2013.
21. SUMMARY QUARTERLY FINANCIAL DATA (UNAUDITED)
The Company has revised its previously issued financial statements contained in this Annual Report on Form 10-Kto correct the effect of immaterial errors for previously issued periods. See Note 11–Long-Term Debt for furtherdetails and a reconciliation of the impact of immaterial prior year corrections on the unaudited summary quarterlyfinancial data.
Unaudited summary quarterly financial data for the years ended December 31, 2014 and 2013 was as follows:
2014
FirstQuarter
SecondQuarter
ThirdQuarter
FourthQuarter (a)
(Unaudited)Total revenues $212,290 $405,151 $495,834 $264,537
Operating (loss) income $ (59,408) $ 80,587 $161,915 $ (22,497)
Net (loss) income $ (49,217) $ 37,406 $ 87,176 $ (25,446)
(Loss) earnings per share:Net (loss) income per share, basic $ (0.56) $ 0.43 $ 1.01 $ (0.29)
Net (loss) income per share, diluted $ (0.56) $ 0.43 $ 1.00 $ (0.29)
2013
FirstQuarter
SecondQuarter (b)
ThirdQuarter
FourthQuarter
(Unaudited)Total revenues $238,610 $411,292 $538,389 $271,959
Operating (loss) income $ (35,873) $ 27,647 $205,594 $ 505
Net (loss) income $ (39,951) $ (15,900) $120,740 $ (12,969)
(Loss) earnings per share:Net (loss) income per share, basic $ (0.48) $ (0.18) $ 1.35 $ (0.14)
Net (loss) income per share, diluted $ (0.48) $ (0.18) $ 1.34 $ (0.14)
(a) During the fourth quarter of 2014, the Company recorded $10,371 in restructuring and other related costsincurred in connection with the restructuring program which the Company implemented in December 2014.Also during the fourth quarter of 2014, the Company recorded $2,574 in separation costs representing costsincurred pursuant to the previously announced separation of the Company’s Chief Executive Officer andPresident on January 15, 2015.
(b) During the second quarter of 2013, the Company recorded $50,072 in fees related to the termination of the2009 Advisory Agreement and $29,858 related to a loss on early extinguishment of debt and write-off ofdiscounts and deferred financing costs.
F-45

SEAWORLD ENTERTAINMENT, INC. AND SUBSIDIARIESNOTES TO CONSOLIDATED FINANCIAL STATEMENTS
(DOLLARS IN THOUSANDS, EXCEPT PER SHARE AMOUNTS)
Based upon historical results, the Company typically generates its highest revenues in the second and thirdquarters of each year and incurs a net loss in the first and fourth quarters, in part because six of its theme parksare only open for a portion of the year.
F-46

Schedule I-Registrant’s Condensed Financial Statements
SEAWORLD ENTERTAINMENT, INC.PARENT COMPANY ONLY
CONDENSED BALANCE SHEETS(In thousands, except share and per share amounts)
December 31,
2014 2013
AssetsCurrent Assets:
Cash $ 5,858 $ 172Due from wholly owned subsidiary — 17,767
Total current assets 5,858 17,939Investment in wholly owned subsidiary 580,018 648,016
Total assets $ 585,876 $665,955
Liabilities and Stockholders’ EquityCurrent Liabilities:
Dividends payable $ 172 $ 17,939Other accrued expenses 5,686 —
Total current liabilities 5,858 17,939
Total liabilities 5,858 17,939
Commitments and contingenciesStockholders’ Equity:
Preferred stock, $0.01 par value—authorized, 100,000,000 shares, no shares issuedor outstanding at December 31, 2014 and 2013 — —
Common stock, $0.01 par value—authorized, 1,000,000,000 shares;90,191,100 shares issued at December 31, 2014 and 89,900,453 shares issued atDecember 31, 2013 902 899
Additional paid-in capital 655,471 689,394Retained earnings 33,516 1,886Treasury stock, at cost (4,105,970 shares at December 31, 2014 and
1,500,000 shares at December 31, 2013) (109,871) (44,163)
Total stockholders’ equity 580,018 648,016
Total liabilities and stockholders’ equity $ 585,876 $665,955
See accompanying notes to condensed financial statements.
F-47

SEAWORLD ENTERTAINMENT, INC.PARENT COMPANY ONLY
CONDENSED STATEMENTS OF COMPREHENSIVE INCOMEFOR THE YEARS ENDED DECEMBER 31, 2014, 2013 AND 2012
(In thousands)
Year Ended December 31,
2014 2013 2012
Equity in net income of subsidiary $49,919 $51,920 $74,221
Net income $49,919 $51,920 $74,221
Other comprehensive income — — —
Comprehensive income $49,919 $51,920 $74,221
See accompanying notes to condensed financial statements.
F-48

SEAWORLD ENTERTAINMENT, INC.PARENT COMPANY ONLY
CONDENSED STATEMENTS OF CASH FLOWSFOR THE YEARS ENDED DECEMBER 31, 2014, 2013 AND 2012
(In thousands)
For the Year Ended December 31,
2014 2013 2012
Cash Flows From Operating Activities:Net income $ 49,919 $ 51,920 $ 74,221Adjustments to reconcile net income to net cash provided by operating
activities:Equity in net income of subsidiary (49,919) (51,920) (74,221)Dividend received from subsidiary-return on capital 36,056 18,072 —
Net cash provided by operating activities 36,056 18,072 —
Cash Flows From Investing Activities:Capital contributed to subsidiary — (249,106) —Restricted payment from subsidiary 65,708 44,163 —Dividend received from subsidiary-return of capital 36,056 18,072 500,000
Net cash provided by (used in) investing activities 101,764 (186,871) 500,000
Cash Flows From Financing Activities:Proceeds from issuance of common stock, net of underwriter
commissions — 253,800 —Purchase of treasury stock (60,058) (44,163) —Dividend paid to common stockholders (72,113) (36,175) (502,977)Offering costs — (4,694) —Payment of tax withholdings on equity-based compensation 37 — —
Net cash (used in) provided by financing activities (132,134) 168,768 (502,977)
Change in Cash and Cash Equivalents 5,686 (31) (2,977)Cash and Cash Equivalents — Beginning of year 172 203 3,180
Cash and Cash Equivalents — End of year $ 5,858 $ 172 $ 203
Supplemental Disclosures of Noncash Financing ActivitiesDividends declared, but unpaid $ 172 $ 17,939 $ 203
Treasury stock purchases settled in January 2015 $ 5,650 $ — $ —
See accompanying notes to condensed financial statements.
F-49

SEAWORLD ENTERTAINMENT, INC.NOTES TO CONDENSED PARENT COMPANY ONLY FINANCIAL STATEMENTS
(DOLLARS IN THOUSANDS, EXCEPT PER SHARE AMOUNTS)
1. DESCRIPTION OF SEAWORLD ENTERTAINMENT, INC.
SeaWorld Entertainment, Inc. (the “Parent”) was incorporated in Delaware on October 2, 2009. At that time, theParent was owned by ten limited partnerships (the “Partnerships” or the “selling stockholders”), ultimatelyowned by affiliates of The Blackstone Group L.P. (“Blackstone”) and certain co-investors. The Parent has nooperations or significant assets or liabilities other than its investment in SeaWorld Parks & Entertainment, Inc.(“SEA”), which owns and operates eleven theme parks within the United States. Accordingly, the Parent isdependent upon distributions from SEA to fund its obligations. However, under the terms of SEA’s various debtagreements, SEA’s ability to pay dividends or lend to the Parent is restricted, except that SEA may pay specifiedamounts to the Parent to fund the payment of the Parent’s tax obligations.
2. BASIS OF PRESENTATION
The accompanying condensed financial statements (the “parent company only financial statements”) include theaccounts of the Parent and its investment in SEA accounted for in accordance with the equity method, and do notpresent the financial statements of the Parent and its subsidiary on a consolidated basis. Certain information andfootnote disclosures normally included in financial statements prepared in accordance with accounting principlesgenerally accepted in the United States of America have been condensed or omitted since this information isincluded with the SeaWorld Entertainment, Inc. consolidated financial statements included elsewhere in thisAnnual Report on Form 10-K (the “consolidated financial statements”). These parent company only financialstatements should be read in conjunction with the consolidated financial statements.
Certain prior year amounts have been revised to correct the effect of immaterial errors on certain debttransactions in 2011, 2012 and 2013 incurred by SEA. See further discussion in the Revision of Previously IssuedFinancial Statements section of Note 11–Long-Term Debt of the accompanying consolidated financialstatements.
3. GUARANTEES
On December 1, 2009, SEA entered into senior secured credit facilities (the “Senior Secured Credit Facilities”)and issued senior notes (the “Senior Notes”). The Senior Secured Credit Facilities were amended effective onFebruary 17, 2011, April 15, 2011, March 30, 2012, April 24, 2013, May 14, 2013 and August 9, 2013. Seefurther discussion in Note 11–Long-Term Debt of the accompanying consolidated financial statements.
Under the terms of the Senior Secured Credit Facilities, the obligations of SEA are fully, unconditionally andirrevocably guaranteed by Parent, any subsidiary of Parent that directly or indirectly owns 100% of the issuedand outstanding equity interest of SEA, and subject to certain exceptions, each of SEA’s existing and futurematerial domestic wholly-owned subsidiaries (collectively, the “Guarantors”).
The obligations under the Senior Notes are guaranteed by the same Guarantors as under the Senior SecuredCredit Facilities. In the event of a default under the Senior Notes, the principal and accrued interest wouldbecome immediately due and payable (subject to, in some cases, grace periods).
4. DIVIDENDS FROM SUBSIDIARIES
In June 2013, SEA’s Board of Directors (the “Board”) adopted a policy to pay a regular quarterly cash dividendto the Parent (defined as a restricted payment in the Senior Secured Credit Facilities). As a result, SEA paid acash dividend to the Parent of $17,766, $18,290 and $18,290 on April 1, July 1 and October 6, 2014 related to
F-50

SEAWORLD ENTERTAINMENT, INC.NOTES TO CONDENSED PARENT COMPANY ONLY FINANCIAL STATEMENTS
(DOLLARS IN THOUSANDS, EXCEPT PER SHARE AMOUNTS)
2014 declarations and SEA paid a cash dividend to the Parent of $18,072, $18,072 and $17,767 on July 1,2013, October 1, 2013 and January 3, 2014, respectively, related to 2013 declarations. As SEA had anaccumulated deficit at the time the April 1, 2014, July 1, 2014 and July 1, 2013 dividends were declared to theParent, these dividends were accounted for as a return of capital by the Parent. The remaining dividends fromSEA have been reflected as a return on capital in the accompanying condensed financial statements.
Also in June 2013, the Parent’s Board adopted a policy to pay a regular quarterly dividend (defined as a restrictedpayment in the Senior Secured Credit Facilities). The payment of cash dividends is within the discretion of theBoard and depends on many factors, including, but not limited to, SEA’s results of operations, financialcondition, level of indebtedness, capital requirements, contractual restrictions, restrictions in its debt agreementsand in any preferred stock, business prospects and other factors that the Board may deem relevant.
During the years ended December 31, 2014 and 2013, the Parent’s Board declared or paid quarterly cashdividends to all common stockholders of record as follows:
Record Date Payment Date
Cash Dividendper Common
Share
June 20, 2013 July 1, 2013 $0.20September 20, 2013 October 1, 2013 $0.20December 20, 2013 January 3, 2014 $0.20March 20, 2014 April 1, 2014 $0.20June 20, 2014 July 1, 2014 $0.21September 29, 2014 October 6, 2014 $0.21
As of December 31, 2014, the Parent had $172 of cash dividends payable included in dividends payable in theaccompanying condensed balance sheet. See Note 19–Stockholders’ Equity of the accompanying consolidatedfinancial statements for further discussion.
On January 5, 2015, SEA’s Board declared a cash dividend of up to $18,112 to the Parent, which was paid onJanuary 22, 2015. Additionally, the Parent’s Board declared a cash dividend of $0.21 per share to all commonstockholders of record at the close of business on January 13, 2015, which was paid on January 22, 2015.
The Parent received dividends in the amount of $500,000 from SEA on March 30, 2012 which have beenreflected as a return of capital in the accompanying condensed financial statements. On that same date, the Parentdeclared dividends (defined as a restricted payment in the Senior Secured Credit Facilities) of $500,000 to thePartnerships. This dividend has also been reflected as a return of capital in the accompanying condensedfinancial statements.
5. STOCKHOLDERS’ EQUITY
Stock Split and Authorized Shares
On April 7, 2013, the Parent’s Board authorized an eight-for-one split of the Parent’s common stock which waseffective on April 8, 2013. The Parent retained the current par value of $0.01 per share for all shares of commonstock after the stock split, and accordingly, stockholders’ equity on the accompanying condensed balance sheetreflects the stock split. The Parent’s historical share information has been retroactively adjusted to give effect tothis stock split.
F-51

SEAWORLD ENTERTAINMENT, INC.NOTES TO CONDENSED PARENT COMPANY ONLY FINANCIAL STATEMENTS
(DOLLARS IN THOUSANDS, EXCEPT PER SHARE AMOUNTS)
Contemporaneously with the stock split, on April 8, 2013, the Parent’s Board approved an increase in the numberof authorized shares of common stock to 1 billion shares. Additionally, upon the consummation of the initialpublic offering, the Parent’s Board authorized 100,000,000 shares of preferred stock at a par value of $0.01 pershare.
Omnibus Incentive Plan
The Parent reserved 15,000,000 shares of common stock for future issuance under the 2013 Omnibus IncentivePlan (“Omnibus Incentive Plan”). The Omnibus Incentive Plan is administered by the compensation committeeof the Parent’s Board, and provides that the Parent may grant equity incentive awards to eligible employees,directors, consultants or advisors of the Parent or its subsidiary, SEA, in the form of stock options, stockappreciation rights, restricted stock, restricted stock units and other stock-based and performance compensationawards. If an award under the Omnibus Incentive Plan terminates, lapses, or is settled without the payment of thefull number of shares subject to the award, the undelivered shares may be granted again under the OmnibusIncentive Plan. See further discussion in Note 18–Equity-Based Compensation of the accompanying consolidatedfinancial statements.
Initial Public Offering and Use of Proceeds
On April 24, 2013, the Parent completed an initial public offering of its common stock in which it offered andsold 10,000,000 shares of common stock and the selling stockholders of the Parent offered and sold 19,900,000shares of common stock including, 3,900,000 shares of common stock pursuant to the exercise in full of theunderwriters’ over-allotment option. The shares offered and sold in the offering were registered under theSecurities Act pursuant to the Parent’s Registration Statement on Form S-1, which was declared effective by theSecurities and Exchange Commission on April 18, 2013. The common stock is listed on the New York StockExchange under the symbol “SEAS”.
The Parent’s shares of common stock were sold at an initial public offering price of $27.00 per share, whichgenerated net proceeds of approximately $245,400 to the Parent after deducting underwriting discounts andcommissions, expenses and transaction costs. Subsequent to the initial public offering, the Parent transferred thenet proceeds to SEA as a capital contribution and increased its investment in SEA. The Parent did not receive anyproceeds from shares sold by the selling stockholders.
Secondary Offerings and Concurrent Share Repurchases
On December 17, 2013, the selling stockholders completed an underwritten secondary offering of 18,000,000shares of common stock. The selling stockholders received all of the net proceeds from the offering and noshares were sold by the Parent.
On April 9, 2014, the selling stockholders completed an underwritten secondary offering of 17,250,000 shares ofcommon stock, including 2,250,000 shares pursuant to the exercise in full of the underwriters’ option to purchaseadditional shares. The selling stockholders received all of the net proceeds from the offering and no shares weresold by the Parent.
Concurrently with the closing of the secondary offering in December 2013 and April 2014, the Parentrepurchased 1,500,000 and 1,750,000 shares, respectively, of its common stock directly from the sellingstockholders in private, non-underwritten transactions at a price per share equal to the price per share paid to theselling stockholders by the underwriters in the respective secondary offerings.
F-52

SEAWORLD ENTERTAINMENT, INC.NOTES TO CONDENSED PARENT COMPANY ONLY FINANCIAL STATEMENTS
(DOLLARS IN THOUSANDS, EXCEPT PER SHARE AMOUNTS)
Share Repurchase Program
On August 12, 2014, the Parent’s Board authorized the repurchase of up to $250,000 of the Company’s commonstock beginning on January 1, 2015 (the “Share Repurchase Program”). On December 16, 2014, the Boardapproved an amendment to the Share Repurchase Program to change the start date of such program fromJanuary 1, 2015 to December 17, 2014 and to authorize the repurchase of up to $15,000 of the Company’scommon stock during the remainder of calendar year 2014. The other features of the Share Repurchase Programremained unchanged including the total amount authorized and available under the program of $250,000. Underthe Share Repurchase Program, the Parent is authorized to repurchase shares through open market purchases,privately-negotiated transactions or otherwise in accordance with applicable federal securities laws, includingthrough Rule 10b5-1 trading plans and under Rule 10b-18 of the Exchange Act. The Share Repurchase Programhas no time limit and may be suspended or discontinued completely at any time. The number of shares to bepurchased and the timing of purchases will be based on the level of the Company’s cash balances, generalbusiness and market conditions, and other factors, including legal requirements, debt covenant restrictions andalternative investment opportunities.
As a result of the Share Repurchase Program, during the fourth quarter of 2014, the Parent entered into a writtentrading plan under Rule 10b5-1 of the Exchange Act and repurchased a total of 855,970 shares of common stockat an average price of $17.50 per share and a total cost of approximately $15,000, leaving $235,000 available forfuture repurchases under the Share Repurchase Program. As of December 31, 2014, $5,650 related to certainshares of common stock repurchased in 2014 is included in other accrued expenses on the accompanying parentcompany only condensed balance sheet and was paid in January 2015.
All of the repurchased shares from the Share Repurchase Program and the shares repurchased directly from theselling stockholders during December 2013 and April 2014 were recorded as treasury stock at a total cost of$109,871 and $44,163 as of December 31, 2014 and 2013, respectively, and are reflected as a reduction tostockholders’ equity on the accompanying condensed balance sheets. SEA transferred $65,708 and $44,163during the years ended December 31, 2014 and 2013, respectively, as restricted payments to the Parent for thepayment of the repurchased shares.
F-53

[THIS PAGE INTENTIONALLY LEFT BLANK]

EXHIBIT 31.1
CERTIFICATION OF PERIODIC REPORT UNDER SECTION 302 OFTHE SARBANES-OXLEY ACT OF 2002
I, David F. D’Alessandro, certify that:
1. I have reviewed this Annual Report on Form 10-K for the year ended December 31, 2014 of SeaWorldEntertainment, Inc.;
2. Based on my knowledge, this report does not contain any untrue statement of a material fact or omit to statea material fact necessary to make the statements made, in light of the circumstances under which suchstatements were made, not misleading with respect to the period covered by this report;
3. Based on my knowledge, the financial statements, and other financial information included in this report,fairly present in all material respects the financial condition, results of operations and cash flows of theregistrant as of, and for, the periods presented in this report;
4. The registrant’s other certifying officer and I are responsible for establishing and maintaining disclosurecontrols and procedures (as defined in Exchange Act Rules 13a-15(e) and 15d-15(e)) and internal controlover financial reporting (as defined in Exchange Act Rules 13a-15(f) and 15d-15(f)) for the registrant andhave:
(a) Designed such disclosure controls and procedures, or caused such disclosure controls and procedures tobe designed under our supervision, to ensure that material information relating to the registrant,including its consolidated subsidiaries, is made known to us by others within those entities, particularlyduring the period in which this report is being prepared;
(b) Designed such internal control over financial reporting, or caused such internal control over financialreporting to be designed under our supervision, to provide reasonable assurance regarding thereliability of financial reporting and the preparation of financial statements for external purposes inaccordance with generally accepted accounting principles;
(c) Evaluated the effectiveness of the registrant’s disclosure controls and procedures and presented in thisreport our conclusions about the effectiveness of the disclosure controls and procedures, as of the endof the period covered by this report based on such evaluation;
(d) Disclosed in this report any change in the registrant’s internal control over financial reporting thatoccurred during the registrant’s most recent fiscal quarter (the registrant’s fourth fiscal quarter in thecase of an annual report) that has materially affected, or is reasonably likely to materially affect, theregistrant’s internal control over financial reporting; and
5. The registrant’s other certifying officer and I have disclosed, based on our most recent evaluation of internalcontrol over financial reporting, to the registrant’s auditors and the Audit Committee of the registrant’sBoard of Directors (or persons performing the equivalent functions):
(a) All significant deficiencies and material weaknesses in the design or operation of internal control overfinancial reporting which are reasonably likely to adversely affect the registrant’s ability to record,process, summarize and report financial information; and
(b) Any fraud, whether or not material, that involves management or other employees who have asignificant role in the registrant’s internal control over financial reporting.
Date: February 27, 2015 Signature: /s/ David F. D’Alessandro
David F. D’AlessandroChairman and Interim Chief Executive Officer(Principal Executive Officer)

EXHIBIT 31.2
CERTIFICATION OF PERIODIC REPORT UNDER SECTION 302 OFTHE SARBANES-OXLEY ACT OF 2002
I, James M. Heaney, certify that:
1. I have reviewed this Annual Report on Form 10-K for the year ended December 31, 2014 of SeaWorldEntertainment, Inc.;
2. Based on my knowledge, this report does not contain any untrue statement of a material fact or omit to statea material fact necessary to make the statements made, in light of the circumstances under which suchstatements were made, not misleading with respect to the period covered by this report;
3. Based on my knowledge, the financial statements, and other financial information included in this report,fairly present in all material respects the financial condition, results of operations and cash flows of theregistrant as of, and for, the periods presented in this report;
4. The registrant’s other certifying officer and I are responsible for establishing and maintaining disclosurecontrols and procedures (as defined in Exchange Act Rules 13a-15(e) and 15d-15(e)) and internal controlover financial reporting (as defined in Exchange Act Rules 13a-15(f) and 15d-15(f)) for the registrant andhave:
(a) Designed such disclosure controls and procedures, or caused such disclosure controls and procedures tobe designed under our supervision, to ensure that material information relating to the registrant,including its consolidated subsidiaries, is made known to us by others within those entities, particularlyduring the period in which this report is being prepared;
(b) Designed such internal control over financial reporting, or caused such internal control over financialreporting to be designed under our supervision, to provide reasonable assurance regarding thereliability of financial reporting and the preparation of financial statements for external purposes inaccordance with generally accepted accounting principles;
(c) Evaluated the effectiveness of the registrant’s disclosure controls and procedures and presented in thisreport our conclusions about the effectiveness of the disclosure controls and procedures, as of the endof the period covered by this report based on such evaluation;
(d) Disclosed in this report any change in the registrant’s internal control over financial reporting thatoccurred during the registrant’s most recent fiscal quarter (the registrant’s fourth fiscal quarter in thecase of an annual report) that has materially affected, or is reasonably likely to materially affect, theregistrant’s internal control over financial reporting; and
5. The registrant’s other certifying officer and I have disclosed, based on our most recent evaluation of internalcontrol over financial reporting, to the registrant’s auditors and the Audit Committee of the registrant’sBoard of Directors (or persons performing the equivalent functions):
(a) All significant deficiencies and material weaknesses in the design or operation of internal control overfinancial reporting which are reasonably likely to adversely affect the registrant’s ability to record,process, summarize and report financial information; and
(b) Any fraud, whether or not material, that involves management or other employees who have asignificant role in the registrant’s internal control over financial reporting.
Date: February 27, 2015 Signature: /s/ James M. Heaney
James M. HeaneyChief Financial Officer(Principal Financial Officer)

EXHIBIT 32.1
CERTIFICATION PURSUANT TO18 U.S.C. SECTION 1350
AS ADOPTED PURSUANT TO SECTION 906OF THE SARBANES-OXLEY ACT OF 2002
In connection with the Annual Report of SeaWorld Entertainment, Inc. (the “Company”) on Form 10-K for theyear ended December 31, 2014 filed with the Securities and Exchange Commission on the date hereof (the“Report”), I, David F. D’Alessandro, Chairman and Interim Chief Executive Officer of the Company, do herebycertify, pursuant to 18 U.S.C. Section 1350, as adopted pursuant to Section 906 of the Sarbanes-Oxley Act of2002, that:
• The Report fully complies with the requirements of Section 13(a) or 15(d) of the Securities ExchangeAct of 1934; and
• The information contained in the Report fairly presents, in all material respects, the financial conditionand results of operations of the Company for the periods presented therein.
Date: February 27, 2015 By: /s/ David F. D’Alessandro
David F. D’AlessandroChairman and Interim Chief Executive Officer(Principal Executive Officer)
EXHIBIT 32.2
CERTIFICATION PURSUANT TO18 U.S.C. SECTION 1350
AS ADOPTED PURSUANT TO SECTION 906OF THE SARBANES-OXLEY ACT OF 2002
In connection with the Annual Report of SeaWorld Entertainment, Inc. (the “Company”) on Form 10-K for theyear ended December 31, 2014 filed with the Securities and Exchange Commission on the date hereof (the“Report”), I, James M. Heaney, Chief Financial Officer of the Company, do hereby certify, pursuant to 18 U.S.C.Section 1350, as adopted pursuant to Section 906 of the Sarbanes-Oxley Act of 2002, that:
• The Report fully complies with the requirements of Section 13(a) or 15(d) of the Securities ExchangeAct of 1934; and
• The information contained in the Report fairly presents, in all material respects, the financial conditionand results of operations of the Company for the periods presented therein.
Date: February 27, 2015 By: /s/ James M. Heaney
James M. HeaneyChief Financial Officer(Principal Financial Officer)

INVESTOR RELATIONS:Anyone seeking information about SeaWorld Entertainment, Inc.
is encouraged to visit us online at www.seaworldinvestors.com. The Company provides a variety of information about the
business on its websites. Prospective and current investors may also contact the investor relations team at:
Phone: 855-797-8625 | Email: [email protected]
INDEPENDENT REGISTERED PUBLIC ACCOUNTING FIRM:
Deloitte & Touche LLP 201 E. Kennedy Blvd., Suite 1200, Tampa, FL 33602
InformationCorporate
TRANSFER AGENT & REGISTRAR:For information or assistance regarding individual stock records or dividends, contact your broker or the Company’s transfer agent, Computershare. Computershare may be reached at: 1-800-851-9677.
STOCK EXCHANGE LISTING:
The Company’s common stock is listed on the New York Stock
Exchange under the ticker symbol “SEAS.”
FORWARD-LOOKING STATEMENTS:
This Annual Report contains certain forward-looking statements that are based largely on the Company’s current
expectations. Forward-looking statements are subject to certain risks and uncertainties that could cause actual performance or results to differ materially from those expressed in the forward-looking statements. For more information about these forward-looking statements and related risks, please refer to the “Special Note Regarding Forward-Looking Statements” beginning on page 1 of the Company’s Annual Report on Form 10-K included herewith.
CORPORATE GOVERNANCE:Information concerning our corporate governance practices, including our Code of Ethics, Code of Conduct, Committee Charters and Corporate Governance Guidelines, is available on ourInvestor Relations website at www.seaworldinvestors.com.
COMPANY EXECUTIVES:
Joel K. ManbyPresident and Chief Executive Officer
James M. HeaneyChief Financial Officer
Daniel B. BrownChief Parks Operations Officer
Scott D. HelmstedterChief Creative Officer
G. Anthony (Tony) TaylorChief Legal and Corporate Affairs Officer, General Counsel and Corporate Secretary
Dave HammerChief Human Resources Officer
Marc G. SwansonChief Accounting Officer
Brad AndrewsChief Zoological Officer
BOARD OF DIRECTORS:
David F. D’Alessandro, Chairman B
Former Chairman, President and Chief Executive Officer,
John Hancock Financial Services
Joel K. ManbyPresident and Chief Executive Officer,
SeaWorld Entertainment, Inc.
Jim Atchison, Vice ChairmanFormer Chief Executive Officer and
President, SeaWorld Entertainment, Inc.
Joseph P. BarattaGlobal Head of Private Equity Group,
The Blackstone Group
William Gray B,C
Co-Founder and Director, Hulls Highway, Inc.
Judith A. McHale A,C
President and Chief Executive Officer, Cane Investments, LLC
Thomas E. Moloney A
Former Senior Executive Vice President and Chief Financial Officer,
John Hancock Financial Services, Inc.
Ellen O. Tauscher B,C
Strategic Advisor, Baker, Donelson, Bearman, Caldwell & Berkowitz, PC
Deborah M. Thomas A
Chief Financial Officer, Hasbro, Inc.
Peter F. WallaceSenior Managing Director of Private
Equity Group, The Blackstone Group
A Member of the Audit CommitteeB Member of the Compensation Committee
C Member of the Nominating and Corporate Governance Committee
®

SEAWORLD ENTERTAINMENT, INC. GLOBAL HEADQUARTERS:9205 SouthPark Center Loop, Suite 400
Orlando, Florida 32819 Phone: 407.226.5011
seaworldentertainment.com
We are proud to print our annual report entirely on Forest Stewardship Council® (FSC®)-certified paper. FSC certification ensures that the paper in our annual report contains fiber from well-managed and responsibly harvested forests that meet strict environmental and socioeconomic standards.
®