to our shareholders · 5 pt pupuk sriwidjaja palembang (pusri) urea plant indonesia epc ... many...
TRANSCRIPT


1
Katsumoto IshibashiPresident and Chief Executive Officer
To Our Shareholders
Our company faced a challenging year in fiscal 2012, amidst a fiercely competitive engineering and construction marketplace. While our net sales increased, our year-over-year earnings decreased mainly due to losses among our group companies.
To achieve continued growth, we must realize three basic elements of the medium-term business plan—NEXT TOYO 2015—that we introduced at the beginning of fiscal 2012: integrating our global operations system; expanding our business into the upstream sector and customer value chain; and developing our global human capital.
In response to our business performance in fiscal 2012, I am positioning “strengthening our group companies” and “pursuing globalization in collaboration among group companies”—two objectives of our business plan—as top priorities. Already, we are taking action in these areas. Additional human resources from Japan are being deployed to group companies to establish structures and systems that will strengthen group collaboration. We are providing thorough engineering and management guidance to group companies to improve their profitability. As well, we are working to expand and reinforce the sales, cost-competitiveness and project execution capabilities of our group companies, nurturing their ability to independently execute Engineering, Procurement and Construction (EPC) projects.
We are leveraging our bases in growth regions around the world to “differentiate TOYO from its competitors,” targeting further growth in the group’s engineering capabilities and services. Among our core businesses, we aim to maintain competitiveness and expand market share for our proprietary urea technology licensing. We will also focus on the fertilizer plant market, for which high demand is forecast. In that segment, we will reinforce our service offering to address our customers’ entire value chains—from planning to operation and maintenance.
Another business we aim to strengthen is the energy business, concentrating specifically on enhancing our ability to meet diverse market needs; boosting our capability to provide alliance services jointly with customers or cooperating companies; and increasing our capacity for taking an investment stake in—or becoming involved with—operations in oil and gas field development projects, such as secondary and tertiary recovery.
In our Floating Production Storage and Offloading (FPSO) business, we plan to increase our competitiveness by entering the Brazilian module fabrication market. We also plan to accelerate the commercialization of newly developed compact Gas to Liquids (Micro-GTL) technology.
Guided by NEXT TOYO 2015, I intend to lead TOYO forward, focusing overall group power on accelerating our reforms. I look forward to the continued support of our shareholders as we pursue our goals and deliver results.
August 2013

01TOYO ENGINEERING CORPORATION Annual Report 2013

Consolidated Five-Year Financial SummaryToyo Engineering Corporation and Consolidated Subsidiaries Years ended March 31
* U.S. dollar amounts are stated at ¥ 94.01 to U.S.$1.00, the exchange rate prevailing on March 31, 2013.
¥173,943
32,983
13,070
14,236
7,131
190,127
65,295
21,947
508
2,237
18,198
132,456
168,179
¥ 37.12
329.54
7.00
14.0%
23.9
27.6
14.4
13.1
7.0
(71)
4,024
2010
¥228,723
24,200
1,593
2,982
1,457
240,694
71,091
26,477
689
2,570
18,198
290,444
410,492
¥ 7.60
363.15
5.00
16.6%
18.8
7.7
27.0
16.7
13.2
(81)
4,548
2013
¥157,881
24,918
5,341
4,941
3,728
222,415
69,265
24,582
1,595
2,524
18,198
269,188
359,120
¥ 19.43
349.42
6.00
10.0%
15.3
11.5
35.2
20.3
7.7
(73)
4,494
2012
¥155,696
26,573
6,815
6,917
3,773
198,387
67,096
15,163
542
2,473
18,198
222,540
224,693
¥ 19.65
340.43
5.00
6.9%
22.8
23.8
18.7
20.0
7.8
(64)
3,956
2011
Net sales
Gross profit
Operating income
Income before income taxes
Net income
Total assets
Total net assets
Long-term loans payable
Purchase of property, plant and equipment
Depreciation and amortization
Capital stock
New orders
Backlog of contracts at end of the year
Per share:
Net income
Total net assets
Cash dividends
Net sales by sector (%):
Chemical fertilizers
Petrochemicals
Refinery
Energy-related
General manufacturing facilities and information technology
Others
(Overseas sales ratio)
Number of employees
01 To Our Shareholders
02 Consolidated Five-Year Financial Summary
04 Major Projects
05 Review of Operations
12 HSSE + Quality
Contents
Financial Section
14 Corporate Governance
15 Business Risk and Other Risks
16 Management’s Discussion and Analysis
18 Consolidated Balance Sheets
20 Consolidated Statements of Income
21 Consolidated Statements of Comprehensive Income
22 Consolidated Statements of Changes in Net Assets
23 Consolidated Statements of Cash Flows
24 Notes to Consolidated Financial Statements
49 Independent Auditor’s Report
50 Corporate Information
53 Stock Information
02 Consolidated Five-Year Financial Summary

New orders
269.1290.4
222.5
132.4119.2
`13`12`11`10`09
Backlog of contracts at end of the year
224.4
168.1
224.6
359.1
410.4
`13`12`11`10`09
Net sales (¥ billion)
(¥ billion)
(¥ billion)
(¥ billion)
(¥ billion)
(¥ billion)
`13`12`11`10`09
157.8
228.7
155.6173.9
326.2
Operating income
5.3
1.5
6.8
13.0
15.1
`13`12`11`10`09
Net income
1.4
3.7 3.7
7.16.5
`13`12`11`10`09
Total assets
222.4240.6
198.3190.1199.4
`13`12`11`10`09
Thousands of U.S. dollars*Millions of yen
¥326,248
34,751
15,167
13,036
6,515
199,412
58,509
19,916
513
2,366
18,198
119,265
224,415
¥ 33.91
294.71
7.00
6.9%
29.2
14.0
35.1
10.6
4.2
(78)
3,769
$2,432,972
257,426
16,954
31,729
15,506
2,560,312
756,212
281,645
7,332
27,338
193,585
3,089,505
4,366,479
$0.08
3.86
0.05
20132009
DEFINITION OF TERMS
Fiscal 2012 means the fiscal year ended March 31,
2013 (April 1, 2012–March 31, 2013).
The word, mark, logo or any sign with a symbol
“TM” means that it is a registered trademark of
Toyo Engineering Corporation in Japan.
CAUTION CONCERNING FORWARD-LOOKING
STATEMENTS
This annual report includes certain “forward-looking
statements.” These statements are based on
management’s current expectations and are subject
to uncertainty and changes in circumstances. Actual
results may differ due to changes in economic,
business, competitive, technological, regulatory,
and other factors.
U.S. dollars*Yen
03TOYO ENGINEERING CORPORATION Annual Report 2013Consolidated Five-Year Financial Summary

1220
11
415
613
16
1
3
8
7
17
9
18
19
10
25
14
New Orders
Name of Client Type Location Scope
1 Indorama Eleme Fertilizer and Chemicals Limited Ammonia and Urea Plant Nigeria EP 2 PT. Panca Amara Utama (PAU) Ammonia and Utility Facilities Indonesia EPC 3 TAIF-NK Oil Refinery Modernization Project Russia EP (Heavy Residue Conversion Complex)
4 Petróleos de Venezuela, S.A. (PDVSA) El Palito Refinery Modernization Project Venezuela EPsCm (Crude Oil Processing Units)
5 PT Pupuk Sriwidjaja Palembang (PUSRI) Urea Plant Indonesia EPC
6 NOLTEX L.L.C. Ethylene-vinyl Alcohol Copolymer Plant U.S.A. EPC
7 South Oil Company (SOC) Onshore Crude Oil Pipeline Network Iraq E
8 BASF India Limited Chemical Production Complex India EPC
9 PETRONAS Gas Berhad (PGB) Gas Processing Plant Rejuvenation Project Malaysia EPC
10 Korea Petrochemical Ind. Co., Ltd. (KPIC) Ethylene Oxide (EO) and Ethylene Glycol (EG) Plant Korea EPC
11 Yacimientos Petroliferos Fiscales Bolivianos (YPFB) Urea / Granules Plant Bolivia LEP
Ongoing
12 Petróleo Brasileiro S.A. (PETROBRAS) Refinery Utility Complex Brazil EPC
13 Egyptian Ethylene and Derivatives Company (ETHYDCO) Ethylene Plant and Butadiene Extraction Unit Egypt EPC
14 PT Pupuk Kalimantan Timur (Kaltim) Ammonia and Urea Plants Indonesia EPC 15 Petroquímica de Venezuela, S.A. (Pequiven) Ammonia and Urea Granulation Plants Venezuela EPC
16 Al-Jubail Fertilizer Company (Albayroni) Energy Optimization Project for Existing Ammonia Plant Saudi Arabia EPC
Completed
17 GULF JP COMPANY LIMITED Small Power Producer Cogeneration Plant Thailand EPC (Three projects completed, four ongoing)
18 Hitachi Chemical Co., Ltd. Functional Resins and Chemical Materials China EPC 19 Maruzen Petrochemical Co., Ltd. Alcohol Ketone Production Equipment Japan Cm Earthquake Recovery Support
20 MODEC Offshore Production Systems FPSO Topsides Units Brazil EPC
EP: Engineering and ProcurementEPC: Engineering, Procurement and ConstructionEPsCm: Engineering, Procurement service and Construction managementE: EngineeringLEP: Licensing, Engineering and ProcurementCm: Construction management
0404 Major Projects

05TOYO ENGINEERING CORPORATION Annual Report 2013Review of Operations
Based on our three business pillars of
plants, energy and infrastructure,
TOYO is upgrading the business
operation system and working to
expand orders.
In fiscal 2012, consolidated net sales increased 44.9% year on
year, to ¥228.7 billion. Consolidated new orders increased 7.9%
year on year, to ¥290.4 billion because of the successful winning
of large-scale orders in the fertilizers, oil refining, and energy
development fields. Including the new orders of some affiliates
accounted for by the equity method, new orders increased
18.8%, to ¥320.0 billion—exceeding the original goal for new
orders of ¥310.0 billion set under the NEXT TOYO 2015 medium-
term business plan (fiscal 2012 to fiscal 2016).
Currently, the global economy is undergoing a historic
structural change. Against the backdrop of the emergence of
advanced financial and information technology, there is an
ongoing integration of the world’s economies. As a result,
companies in all countries are moving production bases
overseas with the goal of producing in and selling to local
markets. In Japan as well, where the domestic market has
been constantly shrinking, many companies are setting up
strategic bases overseas for production. TOYO has taken
steps to respond to these changes in the market environment
and to achieve one of the basic strategies of the NEXT TOYO
2015 plan: “maintenance of a group management system to
balance global integration with local adaptation.” In April 2013,
we implemented a fundamental revision of our organizational
structure into three business units: Plant Project, Energy
Business, and Infrastructure Business. Each unit has the
function of sales and marketing, and project management. We
established this system that allows TOYO to unify domestic and
overseas operations in each of our business fields.
In the following section, we cover the market environment
and TOYO’s activities, new orders for fiscal 2012, and outlooks
for each of these new business units—Plant Project, Energy
Business, and Infrastructure Business Units.

06 Review of Operations
Market Environment and TOYO’s Activities —
The recovery trend in the Japanese economy from the end of 2012 did not
extend to capital investment. Looking overseas, however, there was vigorous
activity in various markets. In the United States, there was robust capital
investment in the energy, gas chemicals, and fertilizer industries based on
the shale gas revolution. Similarly, in such emerging countries as those in
Southeast Asia, there was an active trend of plant construction against the
backdrop of continuing population growth and the progress of urbanization.
Furthermore, in energy resource-rich countries, the high price of oil supported a
trend toward increased capital investment in petrochemical and fertilizer plants.
In response, TOYO continued to develop its sales activities in such
various fields as petrochemicals, oil refining, gas processing, fertilizers, and
pharmaceuticals. We also strove to establish and expand our global operation
system. We aimed to provide a wide range of services covering customers’
entire value chains, from the planning of project implementation to operations
of the plants after completion. Our plant business is the core that has
underpinned TOYO’s growth for more than 50 years, and can be expected to
continue being a strong earnings base in the future.
New Orders in Fiscal 2012 —
In fiscal 2012, the Plant Project Unit received three EPC orders in the fertilizer
market—a urea and an ammonia plant in Indonesia and one of the world’s
largest fertilizer plants to be constructed in Nigeria. In addition, we signed a
contract to supply urea technology licensing and some of the related equipment
for a urea plant being built in Bolivia by the national oil company of Bolivia.
In the petrochemical market, our group companies achieved visible
results. Toyo-Korea independently won an EPC contract to build an Ethylene
Oxide (EO) and Ethylene Glycol (EG) plant in Korea. Toyo-India received an
EPC contract to build a chemical production complex for BASF in India. In
the oil refining and gas processing market, TOYO was awarded contracts in
Plant Project UnitExpanding new orders through global operation system with group companies

07TOYO ENGINEERING CORPORATION Annual Report 2013
various countries and regions. Among many others, TOYO won a contract
for EPsCm services on a large-scale oil refinery modernization project in
Venezuela, a contract for detailed engineering and procurement for the oil
refinery modernization project of a heavy residue conversion complex in
Russia’s Republic of Tatarstan, and an EPC contract for a gas processing plant
rejuvenation project in Malaysia mainly executed by Toyo-Malaysia. In the
pharmaceutical market, one of TOYO’s Enhancing Business Areas, we were
awarded an EPC contract for a highly potent Active Pharmaceutical Ingredient
(API) plant for Shionogi & Co., Ltd., and a contract for validation support
services for Wako Pure Chemical Industries, Ltd.
TOYO also achieved a tangible result in the LNG market. In collaboration
with MODEC, Inc., IHI Corporation, and CB&I Nederland B.V. (CB&I), of the
Netherlands, TOYO won a Front End Engineering Design (FEED) contract for a
Floating LNG (FLNG) project by Malaysia’s national oil company.
Outlook —
One of the positive results achieved by the Plant Project Unit in fiscal 2012
was the greater degree of autonomy shown by each group company. One
direction we are aiming for with our medium-term business plan, NEXT
TOYO 2015, is enhancing the EPC execution capabilities of our group
companies. The above-mentioned Toyo-Korea, Toyo-India and Toyo-
Malaysia projects are evidence that our EPC business is shifting well to our
global bases and that our overseas companies are achieving TOYO quality
in their work. TOYO’s strategy going forward will be to further enhance the
EPC capabilities of our overseas companies and increase the number of
independently won projects.
Another of the noteworthy trends in orders received in fiscal 2012 was
the sharp increase in fertilizer-related projects. Recently, fertilizer plants are
being built around the world along with the growing fertilizer needs of mainly
emerging countries and the diversification of natural gas utilization methods
among natural resource-rich countries. With our proprietary ACES21® urea
synthesis technology and urea granulation technology, TOYO has the unique
advantage of being able to target fertilizer plant projects throughout the
plant life cycle. Leveraging this capability, we will aim to expand orders in
Southeast Asia, India, the Americas, Russia and other CIS countries, and Sub-
Saharan Africa.
In the pharmaceutical field, in March 2013, we formed a business
alliance with Middough Inc., U.S.A., an engineering company with abundant
experience in such biological fields as microorganisms, animal cells, and
vaccines. Based on this new business alliance, TOYO will be targeting
domestic and overseas orders in the promising bio-pharmaceutical field.

Market Environment and TOYO’s Activities —
In the 21st century, possibly one of the greatest issues being faced by
mankind is the development and stable supply of energy. According to
forecasts announced by the United Nations, the world’s current population
of 7.2 billion people will increase to 8.1 billion in 2025, and reach 9.6 billion
in 2050. In addition to energy demand expansion along with the population
growth, per-person energy consumption is expected to rise due to the
economic development and modernization of people’s lifestyles, mainly in
emerging countries. For that reason, energy resource-rich countries are
promoting investments actively in deep-sea oil and gas fields and other
energy development projects.
Based on these future trends, TOYO has increased its efforts to
strengthen its energy development activities. In fiscal 2012, we expanded
general engineering services for oil and gas development projects, won an
order to install topsides units for an FPSO system, entered the final stage for
commercialization of TOYO’s small- to medium-scale Gas to Liquids (Micro-
GTL) technology for oil-associated natural gas, and made efforts towards
an entrance into the LNG business. We also concentrated on forming and
developing strategic partnerships to invest in and be involved with operations
of energy projects.
New Orders in Fiscal 2012 —
In April 2012, TOYO entered into a General Engineering Service Agreement
(GESA) with South Oil Company (SOC) of Iraq for services in upstream oil
development projects. Based on the agreement, TOYO will, on a long-term
basis, provide comprehensive technical services for oil field development
planning and construction and revamping for each oil field and related
facilities of SOC. Since 2002, TOYO has concluded GESA with the oil and
gas companies of many countries. Because of these agreements, TOYO has
worked closely with customers in a wide range of capacities, from feasibility
Energy Business UnitActive shift of business resources to high-value-added business alliances
08 Review of Operations 04

Aaaaaaaaaaaaaaaa
studies to planning and preparation for the bidding process. TOYO’s record
and abundant knowledge of the oil and gas fields are highly evaluated by
SOC. Based on the agreement with SOC, TOYO has already received a
contract to do a study for an oil pipeline. We are also participating in the
Iraqi government’s national oil and gas field development planning as an
engineering partner, and are in the midst of producing a master plan for the
industrial use of associated natural gas from oil production.
In our FPSO operations, in December 2012, MODEC, Inc., and our joint
venture MODEC and TOYO Offshore Production Systems Pte. Ltd. (MTOPS)
won an order to install topsides units for an FPSO system to be developed for
an offshore oil field in the Iracema North area located in the pre-salt layer. This
is the fourth topsides project for FPSO systems awarded to TOYO in Brazil.
Outlook —
Going forward, energy development, particularly oil and gas development,
is expected to expand in countries around the world. At the same time,
competition among contractors to win contracts for those projects is also
predicted to further intensify. Under these circumstances, TOYO plans to
actively shift our business resources in the engineering alliance business,
including high-value-added services centered on GESAs and FEED-to-EPC
rollover projects. We will stay in close collaboration with energy development
companies and other cooperating companies. Another area we will be aiming
to expand business in is the asset management business of existing oil fields
by applying enhanced recovery process and optimized operation of idle
oil and gas fields through the establishment of new facilities or additional
investment.
We will continue to emphasize our FPSO business. PETROBRAS plans to
increase oil and gas production in Brazil from 2.4 million barrels of oil per day
to 5.2 million barrels of oil per day by 2020 and intends to deploy a number of
FPSO units to develop its offshore resources. TOYO established joint venture
TS Participações e Investimentos S.A. (TSPI) in May 2012, and TSPI’s wholly
owned subsidiary Estaleiros do Brasil Ltda. (EBR) as its local bases to seize
business opportunities provided by PETROBRAS’ active national oil and gas
policy. The first result of this strategy appeared in May 2013, when EBR was
awarded an engineering, procurement, construction and installation contract
by PETROBRAS to install an FPSO topsides unit.
09TOYO ENGINEERING CORPORATION Annual Report 2013
10 Review of Operations 04 Annual Report 2012
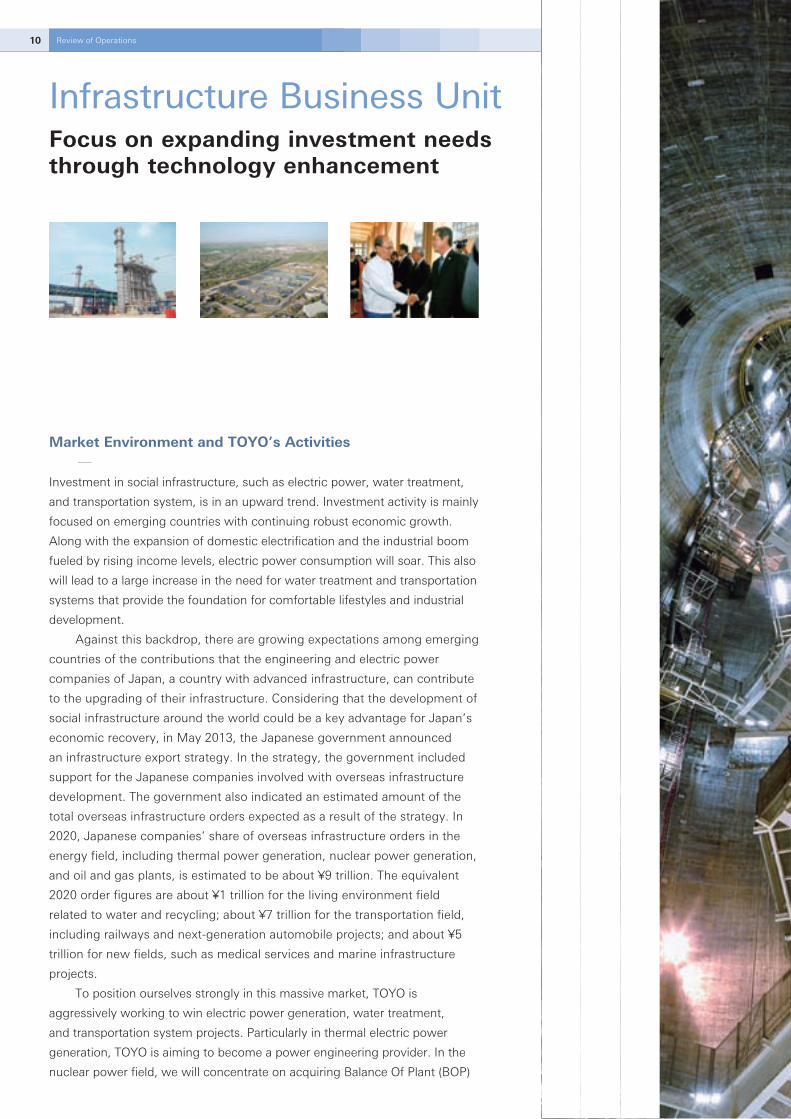
Market Environment and TOYO’s Activities —
Investment in social infrastructure, such as electric power, water treatment,
and transportation system, is in an upward trend. Investment activity is mainly
focused on emerging countries with continuing robust economic growth.
Along with the expansion of domestic electrification and the industrial boom
fueled by rising income levels, electric power consumption will soar. This also
will lead to a large increase in the need for water treatment and transportation
systems that provide the foundation for comfortable lifestyles and industrial
development.
Against this backdrop, there are growing expectations among emerging
countries of the contributions that the engineering and electric power
companies of Japan, a country with advanced infrastructure, can contribute
to the upgrading of their infrastructure. Considering that the development of
social infrastructure around the world could be a key advantage for Japan’s
economic recovery, in May 2013, the Japanese government announced
an infrastructure export strategy. In the strategy, the government included
support for the Japanese companies involved with overseas infrastructure
development. The government also indicated an estimated amount of the
total overseas infrastructure orders expected as a result of the strategy. In
2020, Japanese companies’ share of overseas infrastructure orders in the
energy field, including thermal power generation, nuclear power generation,
and oil and gas plants, is estimated to be about ¥9 trillion. The equivalent
2020 order figures are about ¥1 trillion for the living environment field
related to water and recycling; about ¥7 trillion for the transportation field,
including railways and next-generation automobile projects; and about ¥5
trillion for new fields, such as medical services and marine infrastructure
projects.
To position ourselves strongly in this massive market, TOYO is
aggressively working to win electric power generation, water treatment,
and transportation system projects. Particularly in thermal electric power
generation, TOYO is aiming to become a power engineering provider. In the
nuclear power field, we will concentrate on acquiring Balance Of Plant (BOP)
Infrastructure Business UnitFocus on expanding investment needs through technology enhancement

Aaaaaaaaaaaaaaaa 11TOYO ENGINEERING CORPORATION Annual Report 2013
projects to supply electric power facilities and peripheral machinery and
equipment for the main reactors.
Ongoing Projects —
Jointly with Mitsui & Co., Ltd., TOYO is building seven gas-fired combined
cycle electric power plants with total generation capacity of 790 MW at sites
located in the suburbs of Bangkok for Gulf JP Co., Ltd., a local electric power
development company in Thailand, whose majority owner is Electric Power
Development Co., Ltd., in Japan.
The first electric power plant, GKP1, started commercial operations
in January 2013, with five more on stream by July 2013. The final plant is
scheduled for completion in October 2013. The electric power generated
will be sold to the Electricity Generating Authority of Thailand (EGAT) on a
wholesale basis. Electric power, steam, and chilled water will be also sold
directly to companies in neighboring industrial parks.
In the Republic of Azerbaijan as well, TOYO is building a 400 MW
gas combined cycle power plant in cooperation with a local construction
company. The project is for the Azerenerji Joint Stock Company, a
government-owned power utility company.
Outlook —
Currently, we are working with our group companies and partners to win
orders in various countries and regions. We are targeting gas- and coal-
fired thermal electric power plant projects in Russia, Southeast Asia, and
elsewhere. In Vietnam and Myanmar, our focus is on water treatment and
sewage system projects. In India and Southeast Asia, we are concentrating
on railway projects.
TOYO does not yet have a particularly strong presence in the
infrastructure market. However, that is starting to change as we are steadily
being recognized by customers in the electric power field and by partners
for our work on electric power stations in Thailand and Azerbaijan. Against
the backdrop of global economic integration and development in emerging
countries and regions, the global infrastructure market should continue to
expand steadily. Along with that trend, infrastructure development demands
are expected to jump to a sophisticated level. Accurately responding to the
changes in the business environment, TOYO plans to expand the scale of
overall infrastructure operations and ensure profitability. We will do so based
on our record in thermal and nuclear power generation projects, our project
management capabilities and related specialized and essential technologies,
and the local know-how of our overseas companies.

In 2012, in terms of TOYO’s safety record as defined by ILO, Lost Time Incident Rate (LTIR) was 0.09 and Total Recordable Incident Rate (TRIR) was 0.22. Although our TRIR is slightly improved from 0.24, our LTIR remains the same as in 2011. We are not satisfied with this result, and shall strive to complete all jobs with no accidents and no harm to people.
We are aware that humans make mistakes, therefore it is important to enhance the quality of safety training to facilitate proactive safety actions and to raise sensitivity toward risk and hazards that might lead to accidents. With the recognition that “Safety takes priority over everything else,” we continuously implement safety training programs to foster the safety culture.
TOYO’s group companies have applied unified standards for safety management and moreover, through promoting standardization, TOYO is making its best effort to maintain and improve quality as well as safety.
Loss of valuable human life must absolutely be prevented by all means in the process of TOYO’s business solutions, such as plant construction. Our efforts, time and expenses spent to respect human life must take precedence over all other things.
“Safety First” is not simply a slogan.“Safety” is an integral part of the TOYO brand.
Corporate Safety TrainingIn order to spread the culture of “safety is the first priority” among our employees, we carried out safety training for all corporate members in fiscal 2006. The training was aimed at all employees, not only employees at construction sites. Only employees trained by the Corporate Safety Training Program are allowed to enter our construction sites.
In addition to the above, we carried out safety training for all of our project managers, field managers and construction managers in fiscal 2012 since strong leadership is a prerequisite to ensure site safety.
Safety
Safety Activity at SitesOur main goal is to hand over superior facilities to our clients through engineering, procurement, construction and commissioning work without any accident or injuries. For this purpose, construction site workers, together with clients and partners, participate actively in site safety activities such as tool box meetings, job safety analyses, and mass safety meetings, with an established management system.
Safety & Environmental Report 2013TOYO’s Safety & Environmental Report 2013 is available on our website. It introduces our various activities on safety and the environment during 2012.
12 HSSE + Quality

TOYO’s Energy Saving Urea Synthesis Technology, ACES21® TOYO developed its propriety urea production technology and has been a leader in the urea industry.
TOYO offers its own patented urea synthesis technology, named ACES21®, which maintains the dominant merits of the ACES process with the advantage of energy saving features like reduced steam and electric power consumption.
In general, urea plants are witnessing growth in production capacities. Those plants using ACES21® process with notified capacity of 4,000 tons per day are able to produce 6,000 tons per day of urea, resulting in a reduced number of supporting facilities per ton of urea production.
Quality
Environment
TOYO’s StandardsTOYO holds its own standards, which have been established on cumulative knowledge and experience gained from a number of projects TOYO has accomplished around the world. With TOYO’s Standards consisting of TOYO-Group Standards (TGS) and the Local Standards (LS) of each group company, along with due care of clients’ requirements, TOYO guarantees to always provide high-quality products and services.
Project SQE (Safety, Quality and Environment)Management Department
The Project SQE Management Department, established in April 2010 for improvement of SQE management function in TOYO’s projects, has been training personnel for performing PQM (Project Quality Manager) and HSSEM (Health, Safety, Security and Environment Manager) roles. The department facilitates accumulation and improvement of SQE know-how, which is applicable to all projects and proposals of TOYO’s group companies.
Feedback Knowledge Management System (FKMS)As part of the continual improvement of the Quality Management System, TOYO has been accumulating feedback and knowledge for about 30 years from executed projects in the FKMS. The FKMS accepts and shares the feedback and knowledge from TOYO’s group companies, thereby the feedback and knowledge can be extended and utilized among all TOYO’s group companies immediately for suggestions and preventive actions in all following projects and proposals.
Toyo-JapanLocal
Standards
Toyo-ChinaLocal
Standards
Toyo-KoreaLocal
Standards
Toyo-CanadaLocal
Standards
Toyo-MalaysiaLocal
Standards
Toyo-IndiaLocal
Standards
TOYO-Group Standards
(TGS)
13TOYO ENGINEERING CORPORATION Annual Report 2013HSSE + Quality
3-D model of an ACES21® 4,000 ton per day urea plant

Corporate Governance Structure (As of April 2013)
&
&
Sales Committee
Corporate Planning Division
Legal Unit
Audit/Guidance
Security Trade Control
(STC)Audit/
Guidance
Operation UnitsAudit/Guidance
Chief STC Officer
Internal Control System The Auditing Department of TOYO, which is under the direct control of the President, performs audits concerning the execution of business activities by all divisions and verifies the appropriateness and effectiveness of the internal management structure, including compliance and risk management. In addition, there are specialized units to perform other internal audits, such as the SQE (Safety, Quality and Environment) Management Division. In order to promote the Internal Control System of the group, TOYO is making efforts to ensure proper operations across TOYO’s group companies by establishing corporate procedures to strengthen the corporate administrative functions of each company.
Risk Management System For risk management concerning project profitability and financial matters within TOYO, all business operations are constantly monitored and supervised, and reports are submitted to the Board of Directors, the Executive Committee, and the Board of Corporate Auditors. In addition, matters of particular importance concerning individual bidding and projects undergo a risk analysis overseen by the Project Risk Management Committee, and reports are submitted to the Executive Committee. TOYO has drawn up the Crisis Management Policy to clearly set forth risk management procedures to forestall serious risks (crises) that have the potential to seriously affect the operations of the Company. The Crisis Management Team is constantly prepared for potential crises.
14 Corporate Governance

The following is a list of potential risks associated with the information concerning TOYO’s operating results and financial condition in this annual report that may have a significant bearing on investors’ decisions. This is not intended to be a complete list of these potential risks.
Business riskThe nature of our business activities, which mainly involve conducting projects worldwide, is exposed to the risks listed below. Any interruption or suspension in work due to these risks could have an adverse effect on our operating results and financial condition. We are aware of the possibility that these risks may occur and are taking actions to reduce exposure to these risks by using export credit insurance, maintaining a Risk Management System, Risk Control Structure and taking other steps. ● War, civil commotion, riots, revolutions, coup d’état, terrorism and other unusual events in the
country where the project is carried out or in the neighboring countries. ● Regional risks that occur particularly in an area near a project site, such as a surge of political
unrest and a serious outbreak of an epidemic disease. ● Extraordinary natural phenomenon, such as earthquakes, floods, typhoons and other storms as
well as unusual weather, such as extreme heat or cold. ● Notable changes in a country’s commerce, trade, manufacturing, and financial policies, such as
license approvals, customs clearance, export and export controls, foreign exchange systems, communications, and taxes.
● A major and global contraction in capital investment activities in the Company’s business fields or a sharp decrease in opportunities to win orders due to intensified competition.
Foreign exchange fluctuationFor overseas plant construction contracts denominated in foreign currencies, the appreciation of the yen relative to the applicable foreign currency causes a reduction in the yen equivalent amount received. In addition, the yen’s appreciation makes us less price competitive when competing for new orders in foreign currencies. This could have an adverse effect on our operating results and financial condition. In response, the group uses foreign exchange forward contracts, procures materials and equipment in foreign currencies, utilizes the resources of its overseas companies and takes all otherpossible steps to minimize exposure to foreign exchange risk.
Sudden increases in prices of equipment, materials and constructionIn turnkey lump-sum contracts, the possibility exists of sudden and steep rises in the cost of equipment and materials, transportation, construction, labor and other items associated with a project, or of problems caused by tight demand and supplies of these items, due to rapid change in the international situation. The possibility also exists of cost increase caused by a supplier becoming insolvent or failure of quality control or delivery schedule delay by suppliers/sub-contractors. These events may deteriorate the profitability of a project affected by soaring cost, delivery delay and other problems. Such events may therefore have a detrimental effect on our operating results and financial condition. To reduce our exposure to these risks, we, developing our accountability system to clients and project management system in project execution, utilize our experience to enter into contracts that incorporate measures to offset these risks and gather information on market trends. To avoid an undue reliance on a particular supplier, we work on placing orders with a large number of suppliers and stringently monitor the financial condition of suppliers. We also diversify contract conditions such as cost reimbursable basis to reduce our risks.
15TOYO ENGINEERING CORPORATION Annual Report 2013Business Risk and Other Risks

Annual Report 201216
In fiscal 2012, domestic and overseas business conditions contrasted in TOYO’s core plant market. In Japan, the recovery trend in the economy did not extend to capital investment, which continued to decrease. Overseas, however, there was vigorous capital investment planning activity in North America, targeting the energy, gas chemicals, and fertilizer industries—fields that can make use of shale gas. In India, Russia, Brazil, and Southeast Asia there was an overall trend toward a growing need for plant construction, energy development, and infrastructure development. This trend is in response to expanding demand for energy, materials, food, and water prompted by continuing population growth and the progress of urbanization in these countries and regions. Furthermore, in energy resource-rich countries such as those in the Middle East and other areas, active planning of investments in plants and in the development of deep-sea oil and gas fields continued, supported by the high price of oil. Under these conditions, TOYO initiated its medium-term business plan, NEXT TOYO 2015, in fiscal 2012. Guided by the plan, TOYO aggressively developed its business based on its Product and Business Areas and Markets Strategies. Under the Product and Business Areas and Markets Strategies, TOYO implemented various development activities in its business areas. Core Business Areas include TOYO’s main businesses of refinery and gas processing, petrochemicals, and fertilizers—for which TOYO licenses its proprietary urea technology. In each of these areas, we conducted aggressive marketing activities. We also strove to expand and strengthen our global operations system in the Core Business Areas. In the Enhancing Business Areas, TOYO is aiming to expand business domains. We proactively worked to develop the energy business. Among other business activities, we offered general engineering service agreements for oil and gas development, won an order to install topsides units for an FPSO system, entered the final stage for commercialization of new Micro-GTL technology, and took various steps to enter the LNG field including mid-scale LNG, and FLNG. In addition, in the social infrastructure field, we focused on winning orders for electric power, water treatment, and transportation system projects. Our emphasis in Fostering Business Areas is to carry out business development from a medium- to long-term perspective. Among other actions, we formed strategic partnership agreements aimed at participating in investment and facility operation in energy development projects. Under TOYO’s Business Areas and Markets Strategy, we conducted aggressive marketing strategies aimed at expanding our activities in Frontier Markets. These activities targeted: ● Sub-Saharan Africa, which continues to grow economically against the backdrop of abundant oil and gas resources, ● Russia and other CIS countries, where there is strong potential for capital investment for the
effective utilization of energy resources in refinery and gas processing, chemical, and social infrastructure,
● North America, where the use of unconventional energy resources, such as shale gas and oil, bodes well for greater capital investment in fertilizers, petrochemicals, and energy development, and ● Iraq, where recovery in demand can be expected for many different types of production facilities.
Looking at project execution in fiscal 2012, among others, we made progress with electric power plants in Thailand, a fertilizer plant in Indonesia, FPSO topsides (MV24 project) in Brazil, utility facilities for an oil refinery in Brazil, and a fertilizer plant in Venezuela. Despite our progress on projects, the declining profitability of the fertilizer plant project in Indonesia, executed in collaboration with overseas group companies during fiscal 2012, and the impact of goodwill impairment losses booked by a group company affected TOYO’s profitability performance in fiscal 2012. Combined with the delay of some expected new projects, consolidated profits fell below those of the previous fiscal year.
Management’s Discussion and Analysis16 Management’s Discussion and Analysis

17TOYO ENGINEERING CORPORATION
Performance Outline (Consolidated)
Net sales ¥ 228.7 billion (44.9% up)
Operating income ¥ 1.5 billion (70.2% down)
Net income ¥ 1.4 billion (60.9% down)
New orders ¥ 290.4 billion (7.9% up)
Cash dividends (annual) ¥ 5.00
Fiscal 2012 Business ResultsIn fiscal 2012, consolidated net sales increased 44.9% year on year, to ¥228.7 billion ($2,432 million). However, operating income fell 70.2%, to ¥1.5 billion ($16 million) and ordinary income declined 21.0%, to ¥4.0 billion ($42 million). Net income totaled ¥1.4 billion ($15 million), contracting 60.9% from fiscal 2011. New orders in fiscal 2012 increased 7.9% year on year, to ¥290.4 billion ($3,089 million). TOYO focused on strengthening collaboration on sales activities with its group companies and on expanding business in Frontier Markets, such as Nigeria and Iraq. In addition, we pursued service-type business in the energy development fields. Taking steps to enter the LNG field, we focused on winning FLNG projects in Malaysia. Cash used in operating activities amounted to ¥18.9 billion ($201 million), compared with cash provided by operating activities of ¥5.7 billion in fiscal 2011. This reversal in cash flows resulted from a 39.6% decline in income before income taxes, to ¥2.9 billion; an increase in notes and accounts receivable to ¥17.6 billion; and a decrease in advances received on uncompleted construction contracts. Cash used in investing activities was ¥1.5 billion ($16 million) compared with an outflow of ¥2.4 billion a year earlier. The major expenditures were ¥1.8 billion on purchase of investment securities. Cash used in financing activities totaled ¥532 million ($5 million) compared with cash provided by financing activities of ¥102 million in fiscal 2011. The principal cash outflow was cash dividends paid of ¥1.1 billion. As a result of the above cash flows, cash and cash equivalents at March 31, 2013, amounted to ¥71.6 billion ($762 million), declining ¥18.7 billion year on year. This amount includes a cash deposit totaling ¥8.5 billion received from TOYO’s joint venture partner on an ongoing construction project. TOYO’s dividend policy is to endeavor to distribute profits to shareholders in accordance with operating performance. We also strive to maintain stable dividends from a medium- to long-term perspective while taking into consideration the need for internal reserves that underpin our business base. Our internal reserves are allocated to different reserves for strategic investment in new business fields, for R&D investment, and in preparation for possible business risk-related losses. In fiscal 2012, dividends amounted to ¥5.00 per share.
Fiscal 2013 Performance Forecast Outline (Consolidated)
Net sales ¥ 300.0 billion
Operating income ¥ 10.0 billion
Net income ¥ 5.0 billion
New orders ¥ 330.0 billion
Cash dividends (annual) ¥ 6.00
Fiscal 2013 Performance Forecast (Consolidated)TOYO forecasts that the above-mentioned business conditions in fiscal 2012 will continue in fiscal 2013. Furthermore, with the recent trend toward a weaker yen providing a strong boost, we forecast that TOYO will become more competitive against European, Korean, and other competitors in the bidding. In consideration of the above, TOYO is aiming for new orders totaling ¥330.0 billion. Looking at TOYO’s performance forecast for fiscal 2013, as a result of further progress with the construction of large-scale projects such as fertilizer plants in Indonesia and Nigeria, TOYO expects net sales of ¥300.0 billion, operating income of ¥10.0 billion, ordinary income of ¥10.0 billion, and net income of ¥5.0 billion. Dividends will increase ¥1.00 per share from fiscal 2012, to ¥6.00 per share.
Management’s Discussion and Analysis 17TOYO ENGINEERING CORPORATION Annual Report 2013Management’s Discussion and Analysis

18 Financial Section
Millions of yenThousands of U.S.
dollars (Note 1)
Assets 2013 2012 2013
Current assets:
Cash and deposits (Note 13) ¥ 52,328 ¥ 48,041 $ 556,631
Notes receivable, accounts receivable from completed construction contracts 54,423 35,832 578,913
Short-term investment securities (Note 16) 21,376 44,499 227,387
Costs on uncompleted construction contracts 33,308 26,370 354,304
Deferred tax assets (Note 19) 3,010 1,655 32,019
Accounts receivable—other 22,478 14,472 239,112
Other 5,849 3,503 62,222
Allowance for doubtful accounts (4,258) (3,530) (45,299)
Total current assets 188,517 170,844 2,005,292
Property, plant and equipment:
Buildings and structures (Note 5) 26,525 28,078 282,160
Machinery, vehicles, tools, furniture and fixtures (Note 5) 5,219 4,577 55,517
Land (Note 5) 17,378 17,608 184,862
Lease assets 1,852 1,890 19,708
Construction in progress 75 4 797
Accumulated depreciation and impairment loss (19,864) (19,996) (211,299)
Total property, plant and equipment 31,187 32,164 331,747
Intangible assets:
Goodwill 2,570 3,322 27,345
Other 2,918 3,081 31,046
Total intangible assets 5,489 6,403 58,391
Investments and other assets:
Investment securities (Notes 4, 16) 11,642 9,551 123,846
Long-term loans receivable 4,578 4,575 48,697
Deferred tax assets (Note 19) 1,034 361 11,009
Other (Note 4) 3,137 3,510 33,370
Allowance for doubtful accounts (4,892) (4,995) (52,042)
Total investments and other assets 15,500 13,003 164,881
Total assets ¥240,694 ¥222,415 $2,560,312
See notes to consolidated financial statements.
Consolidated Balance SheetsToyo Engineering Corporation and Consolidated Subsidiaries March 31, 2013 and 2012
19TOYO ENGINEERING CORPORATION Annual Report 2013Financial Section
Millions of yenThousands of U.S.
dollars (Note 1)
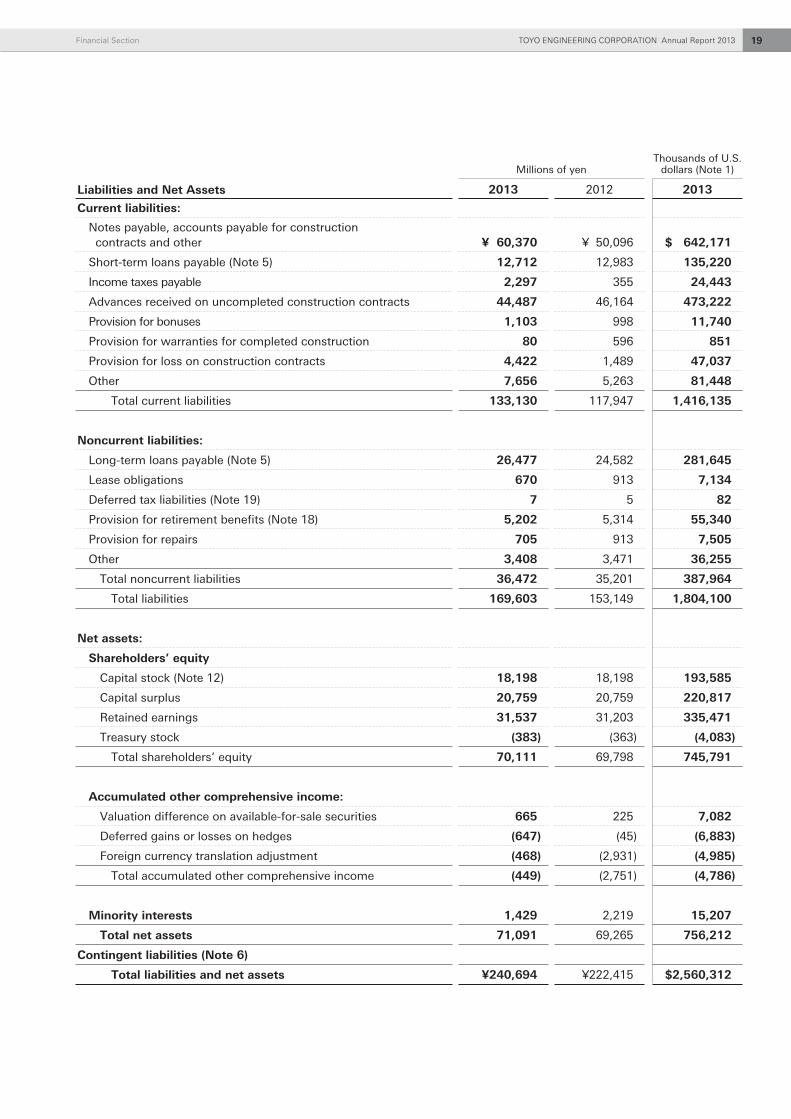
Liabilities and Net Assets 2013 2012 2013
Current liabilities:
Notes payable, accounts payable for construction contracts and other ¥ 60,370 ¥ 50,096 $ 642,171
Short-term loans payable (Note 5) 12,712 12,983 135,220
Income taxes payable 2,297 355 24,443
Advances received on uncompleted construction contracts 44,487 46,164 473,222
Provision for bonuses 1,103 998 11,740
Provision for warranties for completed construction 80 596 851
Provision for loss on construction contracts 4,422 1,489 47,037
Other 7,656 5,263 81,448
Total current liabilities 133,130 117,947 1,416,135
Noncurrent liabilities:
Long-term loans payable (Note 5) 26,477 24,582 281,645
Lease obligations 670 913 7,134
Deferred tax liabilities (Note 19) 7 5 82
Provision for retirement benefits (Note 18) 5,202 5,314 55,340
Provision for repairs 705 913 7,505
Other 3,408 3,471 36,255
Total noncurrent liabilities 36,472 35,201 387,964
Total liabilities 169,603 153,149 1,804,100
Net assets:
Shareholders’ equity
Capital stock (Note 12) 18,198 18,198 193,585
Capital surplus 20,759 20,759 220,817
Retained earnings 31,537 31,203 335,471
Treasury stock (383) (363) (4,083)
Total shareholders’ equity 70,111 69,798 745,791
Accumulated other comprehensive income:
Valuation difference on available-for-sale securities 665 225 7,082
Deferred gains or losses on hedges (647) (45) (6,883)
Foreign currency translation adjustment (468) (2,931) (4,985)
Total accumulated other comprehensive income (449) (2,751) (4,786)
Minority interests 1,429 2,219 15,207
Total net assets 71,091 69,265 756,212
Contingent liabilities (Note 6)
Total liabilities and net assets ¥240,694 ¥222,415 $2,560,312

20 Financial Section
Consolidated Statements of IncomeToyo Engineering Corporation and Consolidated Subsidiaries Years ended March 31, 2013 and 2012
Millions of yenThousands of U.S.
dollars (Note 1)
2013 2012 2013
Net sales ¥228,723 ¥157,881 $2,432,972
Cost of sales (Note 8) 204,523 132,963 2,175,545
Gross profit 24,200 24,918 257,426
Selling, general and administrative expenses (Notes 7, 8) 22,606 19,577 240,471
Operating income 1,593 5,341 16,954
Non-operating income:
Interest income 685 414 7,288
Dividends income 553 160 5,888
Foreign exchange gains 1,297 — 13,796
Equity in earnings of affiliates 690 543 7,345
Miscellaneous income 535 347 5,698
Total non-operating income 3,762 1,466 40,018
Non-operating expenses:
Interest expenses 1,110 1,064 11,814
Foreign exchange losses — 151 —
Miscellaneous expenses 212 490 2,265
Total non-operating expenses 1,323 1,705 14,079
Ordinary income 4,032 5,102 42,893
Extraordinary income:
Gain on sales of property, plant and equipment 607 — 6,457
Total extraordinary income 607 — 6,457
Extraordinary loss:
Impairment loss 79 — 843
Amortization of goodwill 915 — 9,741
Loss on valuation of investments securities 660 — 7,025
Loss on valuation of investments in capital of subsidiaries and affiliates 0 160 9
Total extraordinary loss 1,656 160 17,620
Income before income taxes 2,982 4,941 31,729
Income taxes—current 3,949 1,454 42,007
Income taxes—deferred (1,808) (255) (19,242)
Total income taxes 2,140 1,198 22,765
Income before minority interests 842 3,743 8,964
Minority interests in income (loss) (614) 14 (6,541)
Net income (Note 23) ¥ 1,457 ¥ 3,728 $ 15,506
See notes to consolidated financial statements.

21TOYO ENGINEERING CORPORATION Annual Report 2013Financial Section
Millions of yenThousands of U.S.
dollars (Note 1)
2013 2012 2013
Income before minority interests ¥ 842 ¥ 3,743 $ 8,964
Other comprehensive income:
Valuation difference on available-for-sale securities 439 (245) 4,679
Deferred gains or losses on hedges (601) (26) (6,400)
Foreign currency translation adjustment 2,214 (784) 23,555
Share of other comprehensive income of associates accounted forusing equity method 283 (88) 3,011
Total other comprehensive income 2,335 (1,145) 24,845
Comprehensive income (Note 11) ¥3,178 ¥ 2,597 $33,809
Comprehensive income attributable to:
Owners of the parent 3,759 2,682 39,989
Minority interests ¥ (580) ¥ (85) $ (6,179)
See notes to consolidated financial statements.
Consolidated Statements of Comprehensive IncomeToyo Engineering Corporation and Consolidated Subsidiaries Years ended March 31, 2013 and 2012

22 Financial Section
Consolidated Statements of Changes in Net Assets (Note 12)Toyo Engineering Corporation and Consolidated Subsidiaries Years ended March 31, 2013 and 2012
Millions of yen
Capitalstock
Capitalsurplus
Retainedearnings
Treasurystock
Valuation difference
on available-for-sale
securities
Deferredgains or
losses on hedges
Foreigncurrency
translationadjustment
Minorityinterests
Totalnet
assets
Balance at April 1, 2011 ¥18,198 ¥20,759 ¥28,434 ¥(347) ¥ 471 ¥ (18) ¥(2,157) ¥1,756 ¥67,096
Dividends from surplus (959) (959)
Net income 3,728 3,728
Purchase of treasury stock (16) (16)
Disposal of treasury stock (0) 0 0
Net changes of items other than shareholders’ equity (245) (26) (774) 462 (583)
Balance at March 31, 2012 ¥18,198 ¥20,759 ¥31,203 ¥(363) ¥ 225 ¥ (45) ¥(2,931) ¥2,219 ¥69,265
Balance at April 1, 2012 ¥18,198 ¥20,759 ¥31,203 ¥(363) ¥ 225 ¥ (45) ¥(2,931) ¥2,219 ¥69,265
Dividends from surplus (1,151) (1,151)
Net income 1,457 1,457
Purchase of treasury stock (21) (21)
Disposal of treasury stock (0) 0 0
Change in scopeof consolidation 27 27
Net changes of items other than shareholders’ equity 440 (601) 2,463 (789) 1,512
Balance at March 31, 2013 ¥18,198 ¥20,759 ¥31,537 ¥(383) ¥ 665 ¥(647) ¥ (468) ¥1,429 ¥71,091
Thousands of U.S. dollars (Note 1)
Capitalstock
Capitalsurplus
Retainedearnings
Treasurystock
Valuation difference
on available-for-sale
securities
Deferredgains or
losses on hedges
Foreigncurrency
translationadjustment
Minorityinterests
Totalnet
assets
Balance at April 1, 2012 $193,585 $220,818 $331,918 $(3,866) $2,401 $ (482) $ (31,187) $23,606 $736,792
Dividends from surplus (12,246) (12,246)
Net income 15,506 15,506
Purchase of treasury stock (224) (224)
Disposal of treasury stock (0) 7 6
Change in scopeof consolidation
293
293
Net changes of items other than shareholders’ equity 4,680 (6,400) 26,202 (8,398) 16,083
Balance at March 31, 2013 $193,585 $220,817 $335,471 $(4,083) $7,082 $(6,883) $ (4,985) $15,207 $756,212
See notes to consolidated financial statements.

23TOYO ENGINEERING CORPORATION Annual Report 2013Financial Section
Consolidated Statements of Cash FlowsToyo Engineering Corporation and Consolidated Subsidiaries Years ended March 31, 2013 and 2012
Millions of yenThousands of U.S.
dollars (Note 1)
2013 2012 2013Cash flows from operating activities:
Income before income taxes ¥ 2,982 ¥ 4,941 $ 31,729Depreciation and amortization 2,570 2,524 27,338Amortization of goodwill 1,572 169 16,723Increase (decrease) in allowance for doubtful accounts 625 926 6,658Impairment loss 79 — 843Increase (decrease) in provision for retirement benefits (179) (209) (1,911)Increase (decrease) in provision for loss on construction contracts 2,918 812 31,046Increase (decrease) in provision for loss on disaster — (95) —Interest and dividends income (1,238) (575) (13,177)Interest expenses 1,110 1,064 11,814Foreign exchange losses (gains) 34 (43) 366Loss (gain) on sales of property, plant and equipment (607) (2) (6,458)Equity in (earnings) losses of affiliates (690) (543) (7,345)Loss (gain) on valuation of investment securities 661 174 7,035Decrease (increase) in notes receivable, accounts receivable from completed construction contracts (17,645) (3,848) (187,697)Decrease (increase) in costs on uncompleted construction contracts (6,469) (6,923) (68,819)Decrease (increase) in accounts receivable—other (8,319) (5,784) (88,493)Increase (decrease) in notes and accounts payable—trade 9,492 7,835 100,970Increase (decrease) in advances received on uncompleted construction contracts (2,584) 9,892 (27,494)Other, net (1,098) (2,551) (11,679)
Subtotal (16,785) 7,762 (178,551)Interest and dividends income received 1,456 1,035 15,497Interest expenses paid (1,119) (1,043) (11,908)Income taxes paid (2,537) (2,044) (26,996)
Net cash provided by (used in) operating activities (18,986) 5,710 (201,959)
Cash flows from investing activities:Net decrease (increase) in time deposits 132 940 1,412Purchase of property, plant and equipment (689) (1,595) (7,332)Proceeds from sales of property, plant and equipment 1,185 980 12,614Purchase of intangible assets (1,132) (1,048) (12,050)Purchase of investment securities (1,854) (397) (19,726)Proceeds from sales of investment securities 39 33 419Purchase of investments in subsidiaries — (1,737) —Other, net 730 407 7,772
Net cash provided by (used in) investing activities (1,587) (2,417) (16,890)
Cash flows from financing activities:Net increase (decrease) in short-term loans payable (1,075) 3,557 (11,439)Proceeds from long-term loans payable 6,331 13,200 67,346Repayment of long-term loans payable (4,115) (14,063) (43,781)Redemption of bonds — (1,000) —Repayments of finance lease obligations (466) (565) (4,964)Cash dividends paid (1,151) (959) (12,246)Other, net (54) (66) (583)
Net cash provided by (used in) financing activities (532) 102 (5,668)Effect of exchange rate change on cash and cash equivalents 2,123 (280) 22,583Net increase (decrease) in cash and cash equivalents (18,983) 3,115 (201,933)Cash and cash equivalents at beginning of period 90,452 87,337 962,161Increase (decrease) in cash and cash equivalents resulting from
change in scope of consolidation 206 — 2,195Cash and cash equivalents at end of period (Note 13) ¥ 71,675 ¥ 90,452 $762,423See notes to consolidated financial statements.
24 Financial Section
Notes to Consolidated Financial StatementsToyo Engineering Corporation and Consolidated Subsidiaries
1. BASIS OF PREPARATION
Toyo Engineering Corporation (the “Company”) and its domestic consolidated subsidiaries maintain their accounting records and prepare their financial statements in accordance with accounting principles generally accepted in Japan, and its overseas consolidated subsidiaries maintain their books of account in conformity with those of their respective countries of domicile. The accompanying consolidated financial statements have been compiled from the accounts prepared by the Company in accordance with the provisions set forth in the Financial Instruments and Exchange Law of Japan and with accounting principles generally accepted in Japan, which are different in certain respects as to the application and disclosure requirements of International Financial Reporting Standards. Certain reclassifications have been made to present the accompanying consolidated financial statements in a format which is familiar to readers outside Japan. For the convenience of readers, the accompanying consolidated financial statements and the relevant notes have also been presented in U.S. dollars by translating all Japanese yen amounts at the exchange rate of ¥94.01 to U.S.$1.00 prevailing on March 31, 2013.
2. SUMMARY OF SIGNIFICANT ACCOUNTING POLICIES
(a) Principles of ConsolidationThe accompanying consolidated financial statements include the accounts of the Company and its significant subsidiaries. Investment in significant affiliates is accounted for by the equity method. As of March 31, 2013, the numbers of consolidated subsidiaries and affiliates accounted for by the equity method were 14 and 6, respectively. Toyo Engineering Korea Limited, Toyo Engineering Corporation, China and 4 other subsidiaries are consolidated using their financial statements as of their respective fiscal year end, which falls on December 31, and necessary adjustments are made to their financial statements to reflect any significant transactions from January 1 to March 31. Intercompany accounts and transactions are eliminated in consolidation. The difference between the acquisition cost and the equity in the net assets at the time of acquisition is amortized in principle within twenty years on a straight-line basis.
(b) SecuritiesAll debt and equity securities other than equity securities issued by subsidiaries and affiliates are classified into one of three categories: trading, held-to-maturity, or available-for-sale securities. Trading securities are bought and held principally for the purpose of selling them in the near term. Held-to-maturity securities are those securities which the Company and its consolidated subsidiaries have the ability and intent to hold until maturity. All securities not included in trading or held-to-maturity are classified as available-for-sale securities. Trading securities are recorded at fair value. Held-to-maturity securities are recorded at amortized cost, adjusted for the amortization or accumulation of premiums or discounts. Unrealized gains or losses on trading securities are included in earnings. Short-term investment securities classified as available-for-sale securities are recorded at fair value with changes in unrealized holding gain or loss, net of the applicable income taxes, included directly in net assets. Non-marketable securities classified as available-for-sale securities are recorded at cost. Cost of securities sold is determined by the moving-average method.
(c) Derivative Financial InstrumentsThe Company and certain consolidated subsidiaries enter into various derivative transactions in order to manage certain risk arising from adverse fluctuations in foreign currency exchange rates and interest rates. Derivative financial instruments are carried at fair value with changes in unrealized gain or loss charged or credited to operations, except for those which meet the criteria for deferral hedge accounting under which unrealized gain of loss is deferred as a component of net assets. Deferral hedge accounting is adopted for derivatives which qualify as hedges, under which unrealized gain or loss is deferred. Hedging instruments are derivative transactions such as foreign exchange forward contract and interest rate swap, and hedged items are primarily forecast sales denominated in foreign currencies, and receivables and payables denominated in foreign currencies. Hedge effectiveness is not assessed if the substantial terms and conditions of the hedge instruments and the hedged forecasted transactions are the same. The Company and its consolidated manages its derivative transactions in accordance with its internal “Policies and Procedures for Risk Management.”
(d) Costs on Uncompleted Construction ContractsCosts on uncompleted construction contracts is stated at cost, determined by the identified-cost method.
(e) Depreciation and AmortizationDepreciation of property, plant and equipment is principally computed by the declining-balance method based on the estimated useful lives of the assets.

25TOYO ENGINEERING CORPORATION Annual Report 2013Financial Section
However, buildings and rental properties acquired after April 1, 1998 are depreciated on a straight-line method. The useful lives of property, plant and equipment are as follows: Buildings and structures: 3 to 50 years Machinery, vehicles, tools, furniture and fixtures: 2 to 20 years Amortization of intangible assets of the Company and its consolidated subsidiaries is calculated principally by straight-line. Software is amortized on a straight-line method over 3 to 5 years of the estimated available period.
(f) LeasesDepreciation of assets on finance leases which do not transfer ownership of the leased assets to the lessee are calculated by the straight-line method over the lease period with their residual value zero.
(g) Allowance for Doubtful AccountsThe Company and its consolidated subsidiaries have provided an allowance for doubtful accounts at an estimated amount of probable and reasonably possible bad debts and an estimated amount computed on the actual percentage of credit losses.
(h) Provision for BonusesProvision for bonuses to employees is provided at the expected payment amount for the fiscal year.
(i) Provision for Warranties for Completed ConstructionProvision for warranties for completed construction is provided based on past experience.
(j) Provision for Retirement BenefitsThe provision for retirement benefits at the year-end are stated in accordance with the projected plan assets and the projected benefit obligation. The difference arising from the adoption of the new standard of accounting of ¥3,695 million ($39,313 thousand) is amortized over 15 years by the straight-line method. Actuarial gain or loss is amortized by the straight-line method over 9 years within the average of the estimated remaining service years of the employees in the year following the year of recognition. Prior service cost is amortized as incurred over 13 years within the average of the estimated remaining service years when incurred.
(k) Provision for Loss on Construction ContractsProvision for loss on construction contracts is provided in case the material loss is forecasted for a certain large-scale contract work. The amounts of loss on costs on uncompleted construction contracts of ¥2,909 million ($30,951 thousand) is included in provision for loss on construction contracts and shown as a liability, not as a deduction from the amount of costs on uncompleted construction contracts. The amount of provision for loss on construction contracts included in cost of sales is ¥4,413 million ($46,944 thousand).
(l) Provision for RepairsThe Company and its consolidated subsidiaries have provided provision for repair at estimated amount for preparing the expenditure for major repairs. The Company provides a portion of estimated expenditure equally divided to each fiscal term from decision of repair plan to end of repair work.
(m) Foreign Currency TranslationBoth short-term and long-term receivables and payables in foreign currencies are translated at the rates of exchange in effect at the balance sheet date and differences arising from the translation are included in the consolidated statements of income. The balance sheet accounts of the consolidated foreign subsidiaries are translated at the rates of exchange in effect at the balance sheet date, except for capital stock and capital surplus, which are translated at their historical exchange rates. Revenues, expenses and net income for the year are translated at the rates of exchange in effect at the balance sheet date. Differences arising from translation are presented as “Foreign currency translation adjustment” and “Minority interests” in the accompanying consolidated balance sheets.
(n) Recognition of RevenuesRevenues and costs of construction contracts of which the percentage of completion can be reliably estimated, are recognized by the percentage-of-completion method. The percentage of completion is calculated at the cost incurred as a percentage of the estimated total cost. The completed-contract method continues to be applied for contracts for which the percentage of completion cannot be reliably estimated.

26 Financial Section
(o) Cash and Cash EquivalentsFor the purposes of the consolidated statements of cash flows, the Company and its consolidated subsidiaries consider all highly liquid investments with insignificant risk of changes in value purchased with an original maturity of three months or less to be cash equivalents.
(p) Consumption TaxTransactions subject to consumption tax are recorded at amounts exclusive of consumption taxes.
(q) Consolidated Tax ReturnThe Company files a consolidated tax return with certain domestic subsidiaries.
(r) Capitalization of Interest ExpensesInterest expenses incurred for real estate development projects conducted by certain subsidiaries have been capitalized as a part of the development cost of such projects.
(s) Advances Received on Uncompleted Construction ContractsAdvances received on uncompleted construction contracts from customers are shown as a liability, not as a deduction from the amount of costs on uncompleted construction contracts.
(t) Income TaxesDeferred tax assets and liabilities are determined based on the differences between carrying amounts of existing assets and liabilities in the financial statements and their respective tax bases. Deferred tax assets and liabilities are measured using the enacted tax rates and laws which will be in effect when the differences are expected to be reversed.
(u) Per Share InformationNet income per share is computed based on the weighted average number of shares outstanding during each year. Diluted net income per share is not presented since there was no potential for dilution by the issuance of common stock. Total net assets per share is computed based on outstanding shares at the balance sheet date.
(v) Research and Development CostsResearch and development costs are charged to income when incurred.
(w) Impairment of Fixed AssetsThe Company and its consolidated subsidiaries have grouped their fixed assets into each company for EPC Business, each object for Real Estate and Idle Assets. The recoverable amounts of the asset groups were measured by applying net selling prices which were assessed based on the current market price of land and other salable prices or value in use which was computed by using real-estate appraisal value, etc., for the year ended March 31, 2013.
(Accounting standards issued but not yet effective)“Accounting Standard for Retirement Benefits” (ASBJ Statement No.26) and “Guidance on Accounting Standard for Retirement Benefits” (ASBJ Guidance No.25) were revised on May 17, 2012. However, these accounting standards have not yet been adopted as of March 31, 2013. Under these revised accounting standards, accounting treatment of unrecognized actuarial gain or loss and prior service cost, calculation method of retirement benefit obligations and service cost and disclosures were mainly revised. These revisions were made considering the viewpoint of enhancing financial reporting and international convergence of accounting standards. The Company and its domestic subsidiaries will adopt these accounting standards effective the fiscal year ending March 31, 2014. However, the Company expects to apply the revision of calculation method of retirement benefitobligations and service cost from the fiscal year beginning April 1, 2014. At present, the Company is in the process of evaluating the impact on the consolidated financial statements from the adoption of these revised accounting standards.
3. ACCOUNTING CHANGES
There are no significant accounting changes for the year ending March 31, 2013.
4. INVESTMENTS AND OTHER ASSETS
Among investment securities and other in investment and other assets, the amounts of shares of unconsolidated subsidiaries and affiliates as of March 31, 2013 and 2012 are as follows:

27TOYO ENGINEERING CORPORATION Annual Report 2013Financial Section
Millions of yenThousands ofU.S. dollars
Years ended March 31, 2013 2012 2013Investments and other assets
Investment securities ¥5,549 ¥3,583 $59,032Other 673 951 7,164
5. SHORT-TERM LOANS PAYABLE AND LONG-TERM LOANS PAYABLE
At March 31, 2013 and 2012, short-term loans payable and long-term loans payable consisted of the followings:
Millions of yenThousands ofU.S. dollars
Years ended March 31, 2013 2012 2013Short-term loans payable
Loans payable with collateral
Loans from banks and other financial institutions ¥ — ¥ 2,709 $ —Loans payable without collateral
Loans from banks and other financial institutions 12,712 10,274 135,220Current portion of long-term loans payable 3,630 3,260 38,617
12,712 12,983 135,220Long-term loans payable
Loans payable with collateral
Loans from banks and other financial institutions 488 — 5,195Loans payable without collateral
Loans from banks and other financial institutions 29,619 27,843 315,06730,107 27,843 320,263
Less: Current portion 3,630 3,260 38,61726,477 24,582 281,645
Total ¥39,189 ¥37,566 $416,866
The following assets at March 31, 2013 and 2012 were pledged as collateral principally for long-term loans payable:
Millions of yenThousands ofU.S. dollars
Years ended March 31, 2013 2012 2013Cash and deposits ¥ — ¥2,924 $ —Short-term investment securities — 177 —Buildings, net of accumulated depreciation 1,135 1,049 12,083Land 945 938 10,056
Total ¥2,081 ¥5,090 $22,139
The following schedule shows the maturities of long-term loans payable subsequent to March 31, 2013:
Years ending March 31, Millions of yenThousands ofU.S. dollars
2014 ¥3,630 $38,617
2015 3,328 35,410
2016 4,715 50,156
2017 5,941 63,197
2018 3,110 33,088
2019 and thereafter 9,381 99,792
In order to maintain access to a stable and effective source of operating capital, the company has entered into commitment-line contracts with seven trading banks. The balances of unused commitment-line based on these contracts at the end of the consolidated reporting periods are ¥17,230 million ($183,283 thousand) in 2013 and ¥9,500 million in 2012.
28 Financial Section
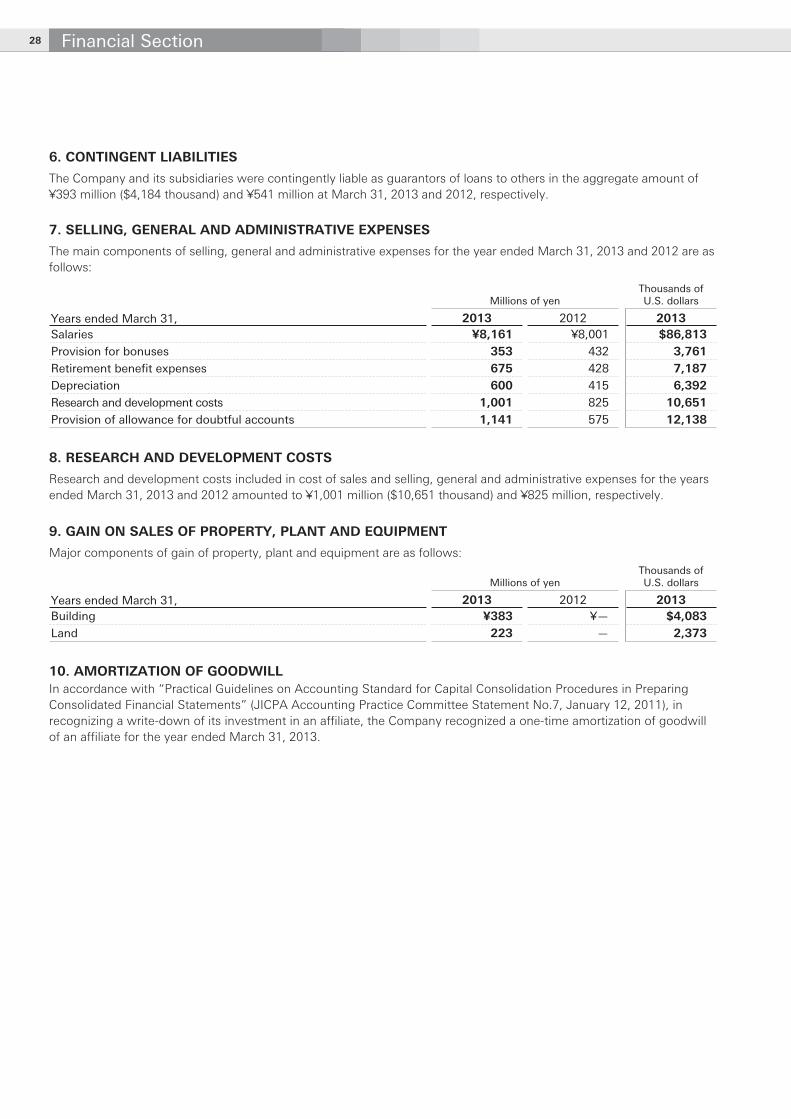
6. CONTINGENT LIABILITIES
The Company and its subsidiaries were contingently liable as guarantors of loans to others in the aggregate amount of ¥393 million ($4,184 thousand) and ¥541 million at March 31, 2013 and 2012, respectively.
7. SELLING, GENERAL AND ADMINISTRATIVE ExPENSES
The main components of selling, general and administrative expenses for the year ended March 31, 2013 and 2012 are as follows:
Millions of yenThousands ofU.S. dollars
Years ended March 31, 2013 2012 2013Salaries ¥8,161 ¥8,001 $86,813Provision for bonuses 353 432 3,761Retirement benefit expenses 675 428 7,187Depreciation 600 415 6,392Research and development costs 1,001 825 10,651Provision of allowance for doubtful accounts 1,141 575 12,138
8. RESEARCH AND DEVELOPMENT COSTS
Research and development costs included in cost of sales and selling, general and administrative expenses for the years ended March 31, 2013 and 2012 amounted to ¥1,001 million ($10,651 thousand) and ¥825 million, respectively.
9. GAIN ON SALES OF PROPERTY, PLANT AND EqUIPMENT
Major components of gain of property, plant and equipment are as follows:
Millions of yenThousands ofU.S. dollars
Years ended March 31, 2013 2012 2013Building ¥383 ¥— $4,083Land 223 — 2,373
10. AMORTIZATION OF GOODWILLIn accordance with “Practical Guidelines on Accounting Standard for Capital Consolidation Procedures in Preparing Consolidated Financial Statements” (JICPA Accounting Practice Committee Statement No.7, January 12, 2011), in recognizing a write-down of its investment in an affiliate, the Company recognized a one-time amortization of goodwill of an affiliate for the year ended March 31, 2013.

29TOYO ENGINEERING CORPORATION Annual Report 2013Financial Section
11. OTHER COMPREHENSIVE INCOME
Millions of yenThousands ofU.S. dollars
Years ended March 31, 2013 2012 2013Valuation difference on available-for-sale securities:
Amount arising during the year ¥ 140 ¥ (438) $ 1,492Reclassification adjustments for gains and losses realized in net income 449 2 4,777The amount of valuation on available-for-sale securities before tax effect 589 (435) 6,269Tax effect (149) 190 (1,589)Valuation difference on available-for-sale securities 439 (245) 4,679
Deferred gains or losses on hedges:
Amount arising during the year (910) (51) (9,686)Reclassification adjustments for gains and losses realized in net income — — —The amount of deferred gains or losses on hedges before tax effect: (910) (51) (9,686)Tax effect 308 25 3,285Deferred gains or losses on hedges (601) (26) (6,400)
Foreign currency translation adjustment:
Amount arising during the year 2,214 (784) 23,555Reclassification adjustments for gains and losses realized in net income — — —The amount of foreign currency translation adjustment before tax effect: 2,214 (784) 23,555Tax effect — — —Foreign currency translation adjustment 2,214 (784) 23,555
Share of other comprehensive income of associates accounted for using equity method
Amount arising during the year 283 (88) 3,011Total other comprehensive income ¥2,335 ¥(1,145) $24,845
12. SUPPLEMENTARY INFORMATION FOR CONSOLIDATED STATEMENTS OF CHANGES IN NET ASSETS
For the year ended March 31, 2013
(a) Type and number of outstanding sharesNumber of shares
Type of sharesBalance at beginning
of yearIncrease in shares
during the yearDecrease in shares
during the yearBalance at end of
year
Issued stock:
Common stock 192,792,539 — — 192,792,539
Total 192,792,539 — — 192,792,539
Treasury stock:
Common stock 910,542 56,986 1,690 965,838
Total 910,542 56,986 1,690 965,838
Notes: 1. Treasury stock increased by 56,986 shares due to the repurchase of shares less than one unit. 2. Treasury stock decreased by 1,690 shares due to the sale of shares less than one unit.
(b) Dividends(b-1) Dividends from surplus
Date ofapproval
Resolution approved by
Type of shares
Amount(Millions of yen)
Amount(Thousands of U.S. dollars)
Amount per share(Yen)
Amount per share
(U.S. Dollars)Shareholders’cut-off date
Effective date
June 27,2012
Annual general
meeting of shareholders
Commonstock 1,151 12,246 6.0 0.06
March 31,2012
June 28,2012

30 Financial Section
(b-2) Dividends with a shareholders’ cut-off date during the current fiscal year but an effective date subsequent to the current fiscal year
Date ofapproval
Resolution approved by
Type of shares Paid from
Amount(Millions of yen)
Amount(Thousands of U.S. dollars)
Amount per share(Yen)
Amount per share
(U.S. Dollars)Shareholders’cut-off date
Effective date
June 26,2013
Annual general
meeting of shareholders
Commonstock
Retainedearnings 959 10,202 5.0 0.05
March 31,2013
June 27,2013
For the year ended March 31, 2012
(a) Type and number of outstanding sharesNumber of shares
Type of sharesBalance at beginning
of yearIncrease in shares
during the yearDecrease in shares
during the yearBalance at end of
year
Issued stock:
Common stock 192,792,539 — — 192,792,539
Total 192,792,539 — — 192,792,539
Treasury stock:
Common stock 858,030 54,462 1,950 910,542
Total 858,030 54,462 1,950 910,542
Notes: 1. Treasury stock increased by 54,462 shares due to the repurchase of shares less than one unit. 2. Treasury stock decreased by 1,950 shares due to the sale of shares less than one unit.
(b) Dividends(b-1) Dividends from surplus
Date ofapproval
Resolutionapproved by
Type of shares
Amount(Millions of yen)
Amount pershare(Yen)
Shareholders’cut-off date
Effective date
June 23,2011
Annualgeneral
meeting ofshareholders
Commonstock 959 5.0
March 31,2011
June 24,2011
(b-2) Dividends with a shareholders’ cut-off date during the current fiscal year but an effective date subsequent to the current fiscal year
Date ofapproval
Resolutionapproved by
Type of shares Paid from
Amount(Millions of yen)
Amount pershare(Yen)
Shareholders’cut-off date
Effective date
June 27,2012
Annualgeneral
meeting ofshareholders
Commonstock
Retainedearnings 1,151 6.0
March 31,2012
June 28,2012
13. CONSOLIDATED STATEMENTS OF CASH FLOWS
A reconciliation between the balance of cash and deposits reflected in the accompanying consolidated balance sheets and that of cash and cash equivalents in the accompanying consolidated statements of cash flows as of March 31, 2013 and 2012 are summarized as follows:
Millions of yenThousands ofU.S. dollars
2013 2012 2013Cash and deposits ¥52,328 ¥48,041 $556,631Time deposits with maturities over three months (1,651) (1,582) (17,572)Short-term investments with maturities within three months
included in securities 20,998 43,994 223,364Cash and cash equivalents ¥71,675 ¥90,452 $762,423

31TOYO ENGINEERING CORPORATION Annual Report 2013Financial Section
14. LEASES
The Company and its consolidated subsidiaries have adopted “Accounting Standard for Lease Transactions.”
(a) Finance LeasesFinance leases are capitalized, and recorded on the balance sheet based on finance lease contracts.
(b) Operating LeasesOperating leases are not capitalized, but future minimum lease payments and receivables are as follows:
(b-1) Operating Leases (as Lessee)Future minimum lease payments subsequent to March 31, 2013 and 2012 for noncancelable operating leases are summarized as follows:
Millions of yenThousands ofU.S. dollars
Years ended March 31, 2013 2012 2013Within one year ¥ 718 ¥182 $ 7,639Over one year 1,207 260 12,847
Total ¥1,925 ¥442 $20,486
(b-2) Operating Leases (as Lessor)Future minimum lease receivables subsequent to March 31, 2013 and 2012 for noncancelable operating leases are summarized as follows:
Millions of yenThousands ofU.S. dollars
Years ended March 31, 2013 2012 2013Within one year ¥ 827 ¥ 894 $ 8,799Over one year 3,159 4,454 33,611
Total ¥3,987 ¥5,348 $42,411
(c) Operating Sub-leasesFuture minimum lease payments for noncancelable operating sub-leases are summarized as follows:
(c-1) Lease Investment Assets and Lease Receivables
Millions of yenThousands ofU.S. dollars
Years ended March 31, 2013 2012 2013Current assets ¥80 ¥216 $858Investment and other assets 48 67 518
(c-2) Lease Obligations
Millions of yenThousands ofU.S. dollars
Years ended March 31, 2013 2012 2013Current liabilities ¥80 ¥216 $858Noncurrent liabilities 48 67 518

32 Financial Section
15. FINANCIAL INSTRUMENTS
For the year ended March 31, 20131. Condition of Financial InstrumentsThe Company and its consolidated subsidiaries hold their temporary cash surplus through low-risk financial assets and raise funds through borrowing from banks and issuing corporate bonds. Derivative financial instruments are utilized for reducing the risk of exchange fluctuations, interest fluctuations, and credit. Therefore, there are no derivatives for speculative purpose. Notes receivable, accounts receivable from completed construction contracts are exposed to credit risks of customers and risks of exchange fluctuations. The Company deals with these risks by organizing careful reviews on awarding contracts, letters of credit, and export credit insurance. The Company minimizes exchange fluctuation risks by organizing their corresponding forward-exchange contracts, in principle. Short-term investment securities and investment securities are exposed to volatility risks of market price. The Company deals with these risks by periodic monitoring, as they mainly consist of short-term held-to-maturity bonds and stocks of our business partner. Notes payable, accounts payable for construction contracts and other are mostly due within one year. Borrowings from banks and corporate bonds are raised mainly for capital investment or working capital. For some long-term loans payable, the Company entered into interest swap agreements to minimize risks of interest rate fluctuations. Regarding derivatives, forward-exchange contracts are used to minimize exchange fluctuation in foreign-currency operations, and interest-swap contracts are used to minimize interest rate fluctuations. The fair value of financial instruments is based on their quoted market prices, if available, or reasonably estimated amounts if there is no market price. Since various assumptions and factors are reflected in estimating the fair value, different assumptions and factors could result in different fair value. In addition, the notional amounts below are not necessarily indicative of the actual market risk involved in derivative transactions.
2. Fair Value of Financial InstrumentsBook value, fair value, and net unrealized gain or loss of financial instruments consist of the following:It does not include items for which it is extremely difficult to determine the fair value.
Millions of yen
At March 31, 2013 Book value Fair valueUnrealizedgain / loss
(1) Cash and deposits ¥ 52,328 ¥ 52,328 ¥ —(2) Notes receivable, accounts receivable from completed construction contracts 54,423
Less: Allowance for doubtful accounts (133) Notes receivable, accounts receivable from completed construction contracts, net 54,289 54,280 (8)
(3) Accounts receivable—other 22,478 Less: Allowance for doubtful accounts (1) Accounts receivable—other, net 22,476 22,476 —
(4) Short-term investment securities and investment securities
Held-to-maturity securities 20,998 20,998 0Available-for-sale securities 4,552 4,552 —Total of assets 154,647 154,638 (8)
(1) Notes payable, accounts payable for construction contracts and other 60,370 60,367 (3)(2) Short-term loans payable 9,081 9,081 —(3) Long-term loans payable (including current portion) 30,107 30,442 334Total of liabilities 99,560 99,890 330Derivatives
not designated as hedging instruments 34 34 —designated as hedging instruments (980) (980) —
Total derivatives ¥ (945) ¥ (945) ¥ —
Notes receivable, accounts receivable from completed construction contracts and accounts receivable—other listed above are offset by the corresponding figures of allowance for doubtful accounts listed above. Net receivables and payables derived as a result of derivative transactions are presented. Values in parentheses show contra-asset account, net liabilities and unrealized loss.
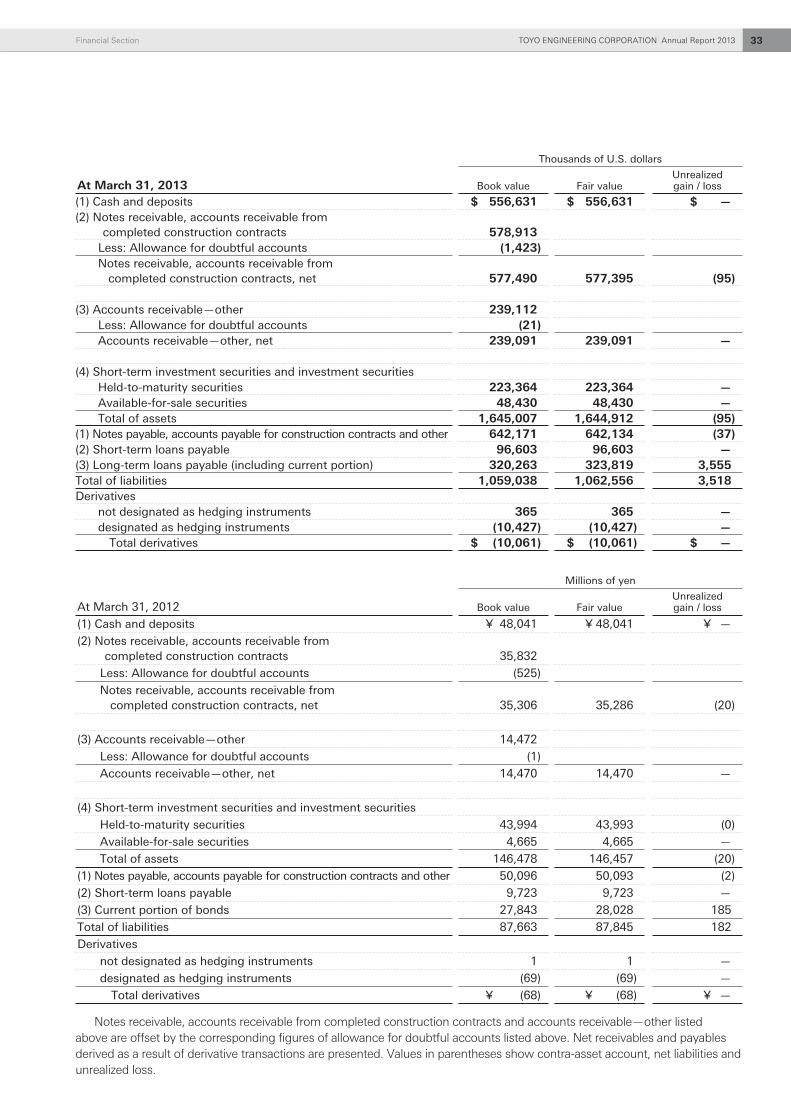
33TOYO ENGINEERING CORPORATION Annual Report 2013Financial Section
Thousands of U.S. dollars
At March 31, 2013 Book value Fair valueUnrealizedgain / loss
(1) Cash and deposits $ 556,631 $ 556,631 $ —(2) Notes receivable, accounts receivable from completed construction contracts 578,913
Less: Allowance for doubtful accounts (1,423) Notes receivable, accounts receivable from completed construction contracts, net 577,490 577,395 (95)
(3) Accounts receivable—other 239,112 Less: Allowance for doubtful accounts (21) Accounts receivable—other, net 239,091 239,091 —
(4) Short-term investment securities and investment securitiesHeld-to-maturity securities 223,364 223,364 —Available-for-sale securities 48,430 48,430 —Total of assets 1,645,007 1,644,912 (95)
(1) Notes payable, accounts payable for construction contracts and other 642,171 642,134 (37)(2) Short-term loans payable 96,603 96,603 —(3) Long-term loans payable (including current portion) 320,263 323,819 3,555Total of liabilities 1,059,038 1,062,556 3,518Derivatives
not designated as hedging instruments 365 365 —designated as hedging instruments (10,427) (10,427) —
Total derivatives $ (10,061) $ (10,061) $ —
Millions of yen
At March 31, 2012 Book value Fair valueUnrealizedgain / loss
(1) Cash and deposits ¥ 48,041 ¥ 48,041 ¥ —
(2) Notes receivable, accounts receivable from completed construction contracts 35,832
Less: Allowance for doubtful accounts (525)
Notes receivable, accounts receivable from completed construction contracts, net 35,306 35,286 (20)
(3) Accounts receivable—other 14,472
Less: Allowance for doubtful accounts (1)
Accounts receivable—other, net 14,470 14,470 —
(4) Short-term investment securities and investment securities
Held-to-maturity securities 43,994 43,993 (0)
Available-for-sale securities 4,665 4,665 —
Total of assets 146,478 146,457 (20)
(1) Notes payable, accounts payable for construction contracts and other 50,096 50,093 (2)
(2) Short-term loans payable 9,723 9,723 —
(3) Current portion of bonds 27,843 28,028 185
Total of liabilities 87,663 87,845 182
Derivatives
not designated as hedging instruments 1 1 —
designated as hedging instruments (69) (69) —
Total derivatives ¥ (68) ¥ (68) ¥ —
Notes receivable, accounts receivable from completed construction contracts and accounts receivable—other listed above are offset by the corresponding figures of allowance for doubtful accounts listed above. Net receivables and payables derived as a result of derivative transactions are presented. Values in parentheses show contra-asset account, net liabilities and unrealized loss.

34 Financial Section
(Note 1) Computational method and related issuesAssets(1) Cash and depositsBook values are used as fair values because they are nearly equal to such book values.(2) (3) Notes receivable, accounts receivable from completed construction contracts and accounts
receivable—otherBook values for items which are settled in a short-term used as fair values of these items because they are nearly equal tosuch book values. Fair values of other items are based on the present value discounted by the proper discount rate coupled with period for settlement and credit risks.(4) Short-term investment securities and investment securitiesFair value of stock items are based on the market prices and bond items are based on the market prices or their price provided by the financial institution.
Liabilities(1) Notes payable, accounts payable for construction contracts and otherBook values for items which are settled in a short-term are used as fair values of these items because they are nearly equal to such book values. Fair values of other items are based on the present value discounted by the proper discount rate coupled with period for settlement and credit risks.(2) Short-term loans payableBook values are used as fair values because they are nearly equal to such book values.(3) Long-term loans payable (including current portion)The present values of the principal and total interest, discounted by the rate assumed to be applied to the new borrowings under the same conditions, are used as the fair values.
Derivative TransactionsSee “17. DERIVATIVE TRANSACTIONS.”
(Note 2) Financial instruments of which it is extremely difficult to determine the fair valueUnlisted securities that amounted to ¥2,468 million ($26,258 thousand) as of March 31, 2013 and ¥2,606 million as of March 31, 2012 are excluded from the above table because they are deemed extremely difficult to determine the fair values; they do not have market prices and it is not possible to conduct alternative methods such as the estimation of their future cash flows.
(Note 3) Redemption schedule for monetary assets with maturity date and short-term investment and investment securities
Millions of yen
At March 31, 2013 Within one yearAfter one year
through five yearsAfter five years
through ten years After ten years
Cash and deposits ¥ 52,328 ¥ — ¥— ¥—Notes receivable, accounts receivable from completed construction contracts 47,665 6,758 — —Accounts receivable—other 22,476 1 — —Held-to-maturity securities 20,998 — — —
Total ¥143,469 ¥6,760 ¥— ¥—
Thousands of U.S. dollars
At March 31, 2013 Within one yearAfter one year
through five yearsAfter five years
through ten years After ten years
Cash and deposits $ 556,631 $ — $— $—Notes receivable, accounts receivable from completed construction contracts 507,023 71,890 — —Accounts receivable—other 239,091 21 — —Held-to-maturity securities 223,364 — — —
Total $1,526,109 $71,911 $— $—

35TOYO ENGINEERING CORPORATION Annual Report 2013Financial Section
Millions of yen
vAt March 31, 2012 Within one yearAfter one year
through five yearsAfter five years
through ten years After ten years
Cash and deposits ¥ 48,041 ¥ — ¥— ¥—Notes receivable, accounts receivable from completed construction contracts 29,075 6,756 — —Accounts receivable—other 14,470 1 — —Held-to-maturity securities 43,994 — — —
Total ¥135,581 ¥6,758 ¥— ¥—
(Note 4) Schedule for repayment of bonds and long-term loans payableSee “5. SHORT-TERM LOANS PAYABLE AND LONG-TERM LOANS PAYABLE.”
16. INVESTMENT SECURITIES
The book value, unrealized gain and loss and the related fair value of held-to-maturity securities at March 31, 2013 are summarized as follows:
Millions of yen
At March 31, 2013BookValue
FairValue
UnrealizedGain
Securities whose fair value exceeds their carrying value:
Government bonds ¥15,998 ¥15,999 ¥ 0Securities whose fair value does not exceed their carrying value:
Government bonds 4,999 4,999 (0)Total ¥20,998 ¥20,998 ¥ 0
Thousands of U.S. dollars
At March 31, 2013BookValue
FairValue
UnrealizedGain
Securities whose fair value exceeds their carrying value:
Government bonds $170,181 $170,185 $ 3Securities whose fair value does not exceed their carrying value:
Government bonds 53,182 53,180 (1)Total $223,364 $223,365 $ 1
The cost, unrealized gain and loss and the related book value of available-for-sale securities with available fair values at March 31, 2013 are summarized as follows:
Millions of yen
At March 31, 2013BookValue
AcquisitionCost
UnrealizedGain
Securities whose carrying value exceeds their acquisition costs:
Equity securities ¥3,844 ¥2,478 ¥1,365Subtotal ¥3,844 ¥2,478 ¥1,365
Securities whose carrying value does not exceed their acquisition costs:
Equity securities ¥ 330 ¥ 397 ¥ (67)Other 378 378 —
Subtotal 708 775 (67)Total ¥4,552 ¥3,254 ¥1,298

36 Financial Section
Thousands of U.S. dollars
At March 31, 2013BookValue
AcquisitionCost
UnrealizedGain
Securities whose carrying value exceeds their acquisition costs:
Equity securities $40,896 $26,366 $14,529Subtotal $40,896 $26,366 $14,529
Securities whose carrying value does not exceed their acquisition costs:
Equity securities $ 3,510 $ 4,223 $ (713)Other 4,023 4,023 —
Subtotal 7,533 8,246 (713)Total $48,430 $34,613 $13,816
Loss on other devaluation of investment securities whose fair values are readily determinable for the years ended March 31, 2013 are ¥448 million (US$4,770 thousand). The book value, unrealized gain and loss and the related fair value of held-to-maturity securities at March 31, 2012 are summarized as follows:
Millions of yen
At March 31, 2012BookValue
FairValue
UnrealizedGain
Securities whose fair value exceeds their carrying value:
Government bonds ¥26,996 ¥26,996 ¥ 0
Securities whose fair value does not exceed their carrying value:
Government bonds 16,997 16,996 (0)
Total ¥43,994 ¥43,993 ¥(0)
The cost, unrealized gain and loss and the related book value of available-for-sale securities with available fair values at March 31, 2012 are summarized as follows:
Millions of yen
At March 31, 2012BookValue
AcquisitionCost
UnrealizedGain
Securities whose carrying value exceeds their acquisition costs:
Equity securities ¥3,644 ¥2,790 ¥853
Other 177 155 21
Subtotal ¥3,821 ¥2,946 ¥875
Securities whose carrying value does not exceed their acquisition costs:
Equity securities ¥ 515 ¥ 534 ¥ (18)
Other 328 328 —
Subtotal 843 862 (18)
Total ¥4,665 ¥3,808 ¥856

37TOYO ENGINEERING CORPORATION Annual Report 2013Financial Section
17. DERIVATIVE TRANSACTIONS
For the year ended March 31, 2013
1. Derivatives not designated as hedging instruments(1) Currency-related
Millions of yen
All notionalamounts
Notionalamounts dueover one year Fair value
Unrealizedgain / loss
Non-market transaction:Foreign exchange forward contracts
SellingUSD ¥ 787 ¥— ¥ 0 ¥ 0EUR 0 — 0 0
BuyingUSD 526 — 34 34EUR 5 — 0 0Total ¥1,319 ¥— ¥34 ¥34
Thousands of U.S. dollars
All notionalamounts
Notionalamounts dueover one year Fair value
Unrealizedgain / loss
Non-market transaction:Foreign exchange forward contracts
SellingUSD $ 8,371 $— $ 1 $ 1EUR 4 — 0 0
BuyingUSD 5,599 — 363 363EUR 56 — 0 0Total $14,033 $— $365 $365

38 Financial Section
2. Derivatives designated as hedging instruments(1) Currency-related
Millions of yen
Main hedgeditems
All notionalamounts
Notionalamounts dueover one year Fair value
Computationalmethod of fair
values
Deferral hedge accounting method:Foreign exchange forward contracts
SellingAccounts receivable and accounts payable
Based on prices offered by the financial institution
USD ¥16,687 ¥ 3,956 ¥(1,576)Buying
USD 1,944 855 57EUR 5,953 3,262 538
Alternative method: Foreign exchange forward contracts
Selling
Accounts receivable and accounts payable
N/A
Based on forward exchange contract prices
USD 33,565 9,550EUR 13 —SEK 717 —CAD 146 —SGD 74 74
Buying USD 7,435 173EUR 5,351 6SEK 428 —THB 74 —BRL 19,301 7,744CHF 280 —SGD 35 —Total ¥92,009 ¥25,623 ¥ (980)

39TOYO ENGINEERING CORPORATION Annual Report 2013Financial Section
Thousands of U.S. dollars
Main hedgeditems
All notionalamounts
Notionalamounts dueover one year Fair value
Computationalmethod of fair
value
Deferral hedge accounting method:Foreign exchange forward contracts
SellingAccounts receivable and accounts payable
Based on prices offered by the financial institution
USD $177,506 $ 42,086 $(16,764)Buying
USD 20,681 9,098 611EUR 63,324 34,702 5,726
Alternative method:Foreign exchange forward contracts
Selling
Accounts receivable and accounts payable
N/A
Based on forward exchange contract prices
USD 357,042 101,591EUR 138 —SEK 7,632 —CAD 1,558 —SGD 792 795
Buying USD 79,092 1,845EUR 56,921 68SEK 4,555 —THB 792 —BRL 205,313 82,374CHF 2,986 —SGD 376 —Total $978,719 $272,563 $(10,427)
(2) Interest-related
Millions of yen
Main hedgeditems
All notionalamounts
Notionalamounts dueover one year Fair value
Computationalmethod of fair
value
Special method for interest rate swaps:
Interest swap contractsfloating-for-fixed rate swap Long-term
loans payable¥11,410 ¥11,150 N/A Based on prices
offered by the financial institution
Total ¥11,410 ¥11,150
Thousands of U.S. dollars
Main hedgeditems
All notionalamounts
Notionalamounts dueover one year Fair value
Computationalmethod of fair
value
Special method for interest rate swaps:
Interest swap contractsfloating-for-fixed rate swap Long-term
loans payable$121,370 $118,604 N/A Based on prices
offered by the financial institution
Total $121,370 $118,604

40 Financial Section
For the year ended March 31, 2012
1. Derivatives not designated as hedging instruments(1) Currency-related
Millions of yen
All notionalamounts
Notionalamounts dueover one year Fair value
Unrealizedgain / loss
Non-market transaction:Foreign exchange forward contracts
BuyingUSD ¥ 0 ¥ — ¥0 ¥0EUR 51 51 1 1THB 0 — 0 0Total ¥51 ¥51 ¥1 ¥1
2. Derivatives designated as hedging instruments(1) Currency-related
Millions of yen
Main hedgeditems
All notionalamounts
Notionalamounts dueover one year Fair value
Computationalmethod of fair
values
Deferral hedge accounting method:Foreign exchange forward contracts
SellingAccounts receivable and accounts payable
Based on prices offered by the financial institution
USD ¥ 5,227 ¥1,708 ¥(82)Buying
USD 1,298 127 12EUR 1 — 0
Alternative method: Foreign exchange forward contracts
Selling
Accounts receivable and accounts payable
N/A
Based on forward exchange contract prices
USD 20,368 4,826SEK 1,412 825
Buying USD 10,816 608EUR 5,031 1,438SEK 1,678 —THB 2,761 —BRL 3,822 —CHF 347 —SGD 636 —Total ¥53,404 ¥9,536 ¥(69)
(2) Interest-related
Millions of yen
Main hedgeditems
All notionalamounts
Notionalamounts dueover one year Fair value
Computationalmethod of fair
value
Special method for interest rate swaps:
Interest swap contractsfloating-for-fixed rate swap Long-term
loans payable¥10,242 ¥9,910 N/A Based on prices
offered by the financial institution
Total ¥10,242 ¥9,910

41TOYO ENGINEERING CORPORATION Annual Report 2013Financial Section
18. RETIREMENT BENEFITS
The Company and certain consolidated subsidiaries have defined benefit pension plans which provide for pension annuity payments or lump-sum payments to eligible employees upon retirement. The Company also has defined contribution pension plan, which was transferred from a portion of defined benefit pension plan in May, 2003.
(1) Provision for retirement benefits for employees at March 31, 2013 and 2012 consisted of the following:
Millions of yenThousands ofU.S. dollars
2013 2012 2013
Projected benefit obligation ¥(15,599) ¥(15,252) $(165,938)
Plan assets 10,858 9,390 115,506
Unreserved projected benefit obligation (4,741) (5,862) (50,431)
Unamortized obligation at transition 501 747 5,333
Unamortized actuarial loss (432) 545 (4,601)
Unrecognized prior service cost (530) (714) (5,640)
Net projected benefit obligation (5,202) (5,283) (55,340)
Prepaid pension cost — 31 —
Provision for retirement benefits for employees ¥ (5,202) ¥ (5,314) $ (55,340)
(2) Net periodic pension cost for the years ended March 31, 2013 and 2012 consisted of the following:
Millions of yenThousands ofU.S. dollars
2013 2012 2013
Components of net periodic benefit cost:
Service cost ¥ 785 ¥ 599 $ 8,355
Interest cost 298 301 3,176
Expected return on plan assets (23) (18) (250)
Amortization of unrecognized retirement benefit obligation at transition 246 246 2,620
Amortization of unrecognized actuarial loss 334 488 3,552
Amortization of prior service cost (187) (187) (1,999)
Other 103 107 1,098
Net periodic pension cost 1,556 1,537 16,553
Total ¥1,556 ¥1,537 $16,553
(3) Basis of calculation of projected benefit obligation for the years ended 2013 and 2012, respectively.
Method of allocation of estimated pension cost Straight-line methodDiscount rate Mainly 2.0%Expected rate of return on plan assets Mainly 0.0%Amortization period for unrecognized actuarial loss Mainly 9 yearsAmortization period for unrecognized obligation at transition 15 yearsAmortization period for unrecognized prior service cost Mainly 13 years

42 Financial Section
19. INCOME TAxES
The statutory tax rates applicable to the Company and its domestic subsidiaries for the year ended March 31, 2013 and 2012 were approximately 37.8% and 40.4%, respectively. Income taxes of the foreign subsidiaries are based generally on the tax rates applicable in their countries of incorporation.
(1) The effective tax rates on income before income taxes in the accompanying consolidated statements of income are not equal to the above-mentioned statutory tax rate for the following reasons:
Year ended March 31, 2013 2012
Statutory tax rate in Japan 37.8% 40.4%
Adjustments:
Permanently nondeductible expenses 7.8 3.1
Permanently nontaxable dividends received (7.0) (3.0)
Per capita levy on corporate inhabitant tax 0.9 0.5
Temporary differences excluded from calculation of deferred tax assets (26.8) (23.9)
Amortization of goodwill 20.0 —
Tax credit (6.7) —
Difference in tax rates for foreign subsidiaries 25.8 1.4
Effective tax rate in the past years 0.8 2.8
Difference in tax base between corporate income tax and enterprise tax 0.6 (1.6)
Operating loss carryforwards for subsidiaries 16.4 2.8
Other 2.1 1.8
Effective tax rate 71.7% 24.3%
(2) Significant components of the deferred income tax assets and liabilities at March 31, 2013 and 2012 are as follows:
Millions of yenThousands ofU.S. dollars
2013 2012 2013Deferred tax assets (gross):
Provision for retirement benefits ¥1,666 ¥1,372 $17,727Provision for loss on construction contracts 846 81 9,006Provision of allowance for doubtful accounts 1,049 265 11,159Provision for bonuses 316 212 3,368Others 1,348 1,031 14,345Total deferred tax assets (gross) 5,227 2,963 55,608
Deferred tax liabilities (gross):
Undistributed earnings of subsidiaries and affiliates 627 562 6,674Valuation difference on available-for-sale securities 418 269 4,456Others 143 121 1,531Total deferred tax liabilities (gross) 1,190 953 12,662
Net deferred tax assets ¥4,037 ¥2,010 $42,946
Note: The Company and its consolidated subsidiaries had temporary differences excluded from calculation of deferred tax assets of ¥8,148 million ($86,675 thousand) and ¥8,689 million at March 31, 2013 and 2012, respectively, which are available to be offset against future taxable income.

43TOYO ENGINEERING CORPORATION Annual Report 2013Financial Section
(3) Net deferred tax assets at March 31, 2013 and 2012 are reflected in the consolidated balance sheets as follows:
Millions of yenThousands ofU.S. dollars
2013 2012 2013Current assets—deferred tax assets ¥3,010 ¥1,655 $32,019Investments and other assets—deferred tax assets 1,034 361 11,009Current liabilities—other — (0) —Noncurrent liabilities—deferred tax liabilities (7) (5) (82)Net deferred tax assets ¥4,037 ¥2,010 $42,946
20. RENTAL PROPERTIESFor the year ended March 31, 2013The Company and some of its consolidated subsidiaries own their commercial facilities and residences (including land) for rent in Chiba prefecture and the other areas. For the year ended March 31, 2013, the Company and some of its consolidated subsidiaries recorded ¥760 million ($8,092 thousand) of rental revenues and ¥607 million ($6,457 thousand) of gain on sales of property, plant and equipment.
Book value, increase (decrease) in value, and fair value of rental properties are listed below.
Millions of yen Thousands of U.S. dollars
Book valueat March 31,
2012
Increase (decrease)
in book value
Book valueat March 31,
2013
Fair valueat March 31,
2013
Book valueat March 31,
2012
Increase (decrease)
in book value
Book valueat March 31,
2013
Fair valueat March 31,
2013
¥16,152 ¥(1,062) ¥15,090 ¥18,430 $171,821 $(11,302) $160,518 $196,042
Notes: 1. Book value is calculated by deducting accumulated depreciation and accumulated impairment loss from its acquisition cost.
2. The major items in “Increase (decrease) in value” consist of ¥534 million ($5,686 thousand) of sales of rental offices and ¥435 million ($4,632 thousand) of depreciation of buildings.
3. Computational method of fair value Mainly based on Real Estate Appraisal Standards.
For the year ended March 31, 2012The Company and some of its consolidated subsidiaries own their commercial facilities, residences and office buildings (including land) for rent in Chiba prefecture and the other areas. For the year ended March 31, 2012, the Company and some of its consolidated subsidiaries recorded ¥792 million of rental revenues.
Book value, increase (decrease) in value, and fair value of rental properties are listed below.
Millions of yen
Book valueat March 31,
2011
Increase (decrease)
in book value
Book valueat March 31,
2012
Fair valueat March 31,
2012
¥17,615 ¥(1,462) ¥16,152 ¥22,430
Notes: 1. Book value is calculated by deducting accumulated depreciation and accumulated impairment loss from its acquisition cost.
2. The major items in “Increase (decrease) in value” consist of ¥946 million of sales of rental offices and ¥489 million of depreciation of buildings.
3. Computational method of fair value Mainly based on Real Estate Appraisal Standards.

44 Financial Section
21. SEGMENT INFORMATION
Effective the fiscal year ended March 31, 2013, the Company has adopted new accounting standards for disclosures about segments of an enterprise and related information. Segment information for the year ended March 31, 2012 has been restated in accordance with such accounting standards for comparative purposes.
(1) Operating SegmentsThe operating segments of the group are components for which discrete financial information is available and whose operating results are regularly reviewed by the Executive Committee to make decisions about resource allocation and to assess performance. The Companies’ reportable operating segments consist of the following three business groups: EPC Business— Research and development, design, engineering, procurement, and construction of a variety of
plants, such as oil, gas, petrochemical, and general chemical. IT Business— Solution business based on other companies’ ERP package products and product business based
on our subsidiary ERP package products, etc. Real Estate— Rent of commercial facilities and residences, and administration.
Millions of yen
Year ended March 31, 2013 EPC Business IT Business Real Estate Total Adjustments Consolidated
I Net sales and segment profits:
Net sales
(1) Net sales to outside customers ¥215,505 ¥10,991 ¥ 2,226 ¥228,723 ¥ — ¥228,723(2) Inter-segment net sales 158 32 231 422 (422) —
Total 215,664 11,023 2,458 229,146 (422) 228,723Segment profits 275 344 975 1,596 (2) 1,593
II Segment assets ¥211,554 ¥ 4,912 ¥18,438 ¥234,906 ¥5,788 ¥240,694III Others
Depreciation ¥ 1,300 ¥ 713 ¥ 465 ¥ 2,479 ¥ (0) ¥ 2,479Amortization of goodwill 1,583 — — 1,583 — 1,583Amount invested in equity method
affiliates 5,190 — — 5,190 — 5,190Increase of fixed assets 1,014 602 4 1,620 (2) 1,618
Thousands of U.S. dollars
Year ended March 31, 2013 EPC Business IT Business Real Estate Total Adjustments Consolidated
I Net sales and segment profits:
Net sales
(1) Net sales to outside customers $2,292,371 $116,914 $ 23,686 $2,432,972 $ — $2,432,972(2) Inter-segment net sales 1,688 342 2,464 4,495 (4,495) —
Total 2,294,059 117,257 26,150 2,437,467 (4,495) 2,432,972Segment profits 2,935 3,667 10,375 16,978 (23) 16,954
II Segment assets $2,250,343 $ 52,255 $196,138 $2,498,737 $61,574 $2,560,312III Others
Depreciation $ 13,837 $ 7,584 $ 4,952 $ 26,373 $ (2) $ 26,370Amortization of goodwill 16,839 — — 16,839 — 16,839Amount invested in equity method
affiliates 55,212 — — 55,212 — 55,212Increase of fixed assets 10,790 6,407 44 17,242 (29) 17,212
Notes: 1. “Adjustments” for Segment profits and Depreciation represent the elimination of inter-segment transactions. 2. “Segment profits” represents operating income from Consolidated Statement of Income. 3. Segment assets adjustments include (¥293) million (($3,126) thousand) of inter-segment eliminations
and ¥6,082 million ($64,701 thousand) of non-allocated corporate assets, which is chiefly the Company’s investment securities attributed to the administrative department.

45TOYO ENGINEERING CORPORATION Annual Report 2013Financial Section
Millions of yen
Year ended March 31, 2012 EPC Business IT Business Real Estate Total Adjustments Consolidated
I Net sales and segment profits:
Net sales
(1) Net sales to outside customers ¥143,017 ¥12,228 ¥ 2,635 ¥157,881 ¥ — ¥157,881
(2) Inter-segment net sales 239 25 230 495 (495) —
Total 143,256 12,253 2,866 158,376 (495) 157,881
Segment profits 4,121 318 897 5,337 3 5,341
II Segment assets ¥191,198 ¥ 6,257 ¥19,468 ¥216,924 ¥5,491 ¥222,415
III Others
Depreciation ¥ 1,203 ¥ 764 ¥ 541 ¥ 2,509 ¥ (0) ¥ 2,508
Amortization of goodwill 179 — — 179 — 179
Amount invested in equity method
affiliates 2,974 — — 2,974 — 2,974
Increase of fixed assets 2,124 500 13 2,637 — 2,637
Notes: 1. “Adjustments” for Segment profits and Depreciation represent the elimination of inter-segment transactions. 2. “Segment profits” represents operating income from Consolidated Statement of Income. 3. Segment assets adjustments include (¥466) million of inter-segment eliminations and ¥5,957 million of
non-allocated corporate assets, which is chiefly the Company’s investment securities attributed to the administrative department.
(2) Information by Geographical Segments Based on the Location of Projects
Millions of yen
Year ended March 31, 2013 Japan Brazil Indonesia Thailand Other Total
Net sales ¥44,414 ¥35,895 ¥34,761 ¥28,554 ¥85,097 ¥228,723
Thousands of U.S. dollars
Year ended March 31, 2013 Japan Brazil Indonesia Thailand Other Total
Net sales $472,448 $381,830 $369,760 $303,739 $905,193 $2,432,972
Millions of yen
Year ended March 31, 2013 Japan Other Total
Property, plant and equipment ¥27,347 ¥3,840 ¥31,187
Thousands of U.S. dollars
Year ended March 31, 2013 Japan Other Total
Property, plant and equipment $290,895 $40,851 $331,747
Millions of yen
Year ended March 31, 2012 Japan Thailand China India Other Total
Net sales ¥42,327 ¥28,011 ¥18,890 ¥15,849 ¥52,804 ¥157,881
Millions of yen
Year ended March 31, 2012 Japan Other Total
Property, plant and equipment ¥28,549 ¥3,615 ¥32,164

46 Financial Section
(3) Impairment loss on fixed assets by reportable segment
Millions of yen
Year ended March 31, 2013 EPC Business IT Business Real Estate Total Adjustments Consolidated
Impairment loss ¥— ¥— ¥79 ¥79 ¥— ¥79
Thousands of U.S. dollars
Year ended March 31, 2013 EPC Business IT Business Real Estate Total Adjustments Consolidated
Impairment loss $— $— $843 $843 $— $843
Amortization and unamortized balance of goodwill by reportable segmentThe following table presents the amortization and balance of goodwill as of and for the years ended March 31, 2013 and 2012 by reportable segments:
Millions of yen
Year ended March 31, 2013 EPC Business IT Business Real Estate Total
Goodwill
Amortization of goodwill ¥1,583 — — ¥1,583Balance at March 31, 2013 2,570 — — 2,570
Negative goodwill
Amortization of negative goodwill 10 — — 10Balance at March 31, 2013 ¥ 128 — — ¥ 128
Thousands of U.S. dollars
Year ended March 31, 2013 EPC Business IT Business Real Estate Total
Goodwill
Amortization of goodwill $16,839 — — $16,839Balance at March 31, 2013 27,345 — — 27,345
Negative goodwill
Amortization of negative goodwill 116 — — 116Balance at March 31, 2013 $ 1,367 — — $ 1,367
Millions of yen
Year ended March 31, 2012 EPC Business IT Business Real Estate Total
Goodwill
Amortization of goodwill ¥ 179 — — ¥ 179
Balance at March 31, 2012 3,322 — — 3,322
Negative goodwill
Amortization of negative goodwill 10 — — 10
Balance at March 31, 2012 ¥ 139 — — ¥ 139

47TOYO ENGINEERING CORPORATION Annual Report 2013Financial Section
22. RELATED PARTY TRANSACTIONSAffiliate
For the year ended March 31, 2013Name: NEDL CONSTRUCOES DE
DUTOS DO NORDESTE LTDA.
Millions of yen Thousands of U.S. dollars
Transactionamount
Title ofaccount
Accountbalance
Transactionamount
Title ofaccount
Accountbalance
Address:
Brazil
Capital and investments:
2,524 thousand BRL
Long-termloans
receivable
Long-termloans
receivable
Business:
Construction— ¥3,707 — $39,441
Equity ownership percentage:
Holding 42% directly — ¥3,707 — $45,146Relation with related party:
Loan for operating fund
Summary of transactions:
Loan for operating fund
For the year ended March 31, 2012
Name: NEDL CONSTRUCOES DE DUTOS DO NORDESTE LTDA.
Millions of yen
Transactionamount
Title ofaccount
Accountbalance
Address:
Brazil
Capital and investments:
2,524 thousand BRL
Business:
Construction
Equity ownership percentage: Long-term
loans
receivable
Holding 42% directly — ¥3,707
Relation with related party:
Loan for operating fund
Summary of transactions:
Loan for operating fund
Notes: 1. Interest rate on loan is determined by considering effective market rates. 2. The Company reserved ¥3,707 million ($39,441 thousand) of allowance for doubtful accounts at March 31,
2013, against the loan above. 3. The Company reserved ¥3,707 million of allowance for doubtful accounts at March 31, 2012, against the loan
above.

48 Financial Section
Other affiliates subsidiary
For the year ended March 31, 2012
Name: MIT-POWER LIMITED
Millions of yen
Transactionamount
Title ofaccount
Accountbalance
Address:
Thailand
Capital and investments:
14,019 thousand THB Advances
received on
uncompleted
construction
contracts
Business:
Construction ¥5,532
Equity ownership percentage:
N/A ¥10,210
Relation with related party:
Contract for engineering and Accounts
construction receivable —
Summary of transactions:
Contract for engineering and
construction
Note: “Contract for engineering and construction” is determined by price negotiation based on market price, which is similar to general transaction. “Transaction amount” does not include consumption tax while “Account balance” includes consumption tax.
Significant affiliateThe significant affiliate was Moeco Thai Oil Development Co.,Ltd., whose condensed financial information is as follows:
Millions of yenThousands ofU.S. dollars
Years ended March 31, 2013 2012 2013Total current assets ¥ 7,868 ¥ 7,463 $ 83,694Total noncurrent assets 5,468 4,916 58,164Total current liabilities 1,318 1,032 14,029Total noncurrent liabilities 1,280 1,004 13,624Total net assets 10,736 10,342 114,205
Net sales 6,089 5,618 64,775Income before income taxes 4,435 3,717 47,178Net income ¥ 2,113 ¥ 1,723 $ 22,484
23. AMOUNTS PER SHARE
Yen U.S. dollars
Years ended March 31, 2013 2012 2013Net income per share ¥ 7.60 ¥ 19.43 $0.08Net assets per share 363.15 349.42 3.86Dividends per share 5.00 6.00 0.05
Net income per share is computed based on the net income available for distribution to shareholders of common stock and the weighted average number of shares of common stock outstanding during each year. Cash dividends per share represent the cash dividends proposed by the Board of Directors as applicable to the respective years. Net assets per share are computed based on the net assets excluding minority interests and the number of common stock outstanding at the year end.

49TOYO ENGINEERING CORPORATION Annual Report 2013Financial Section

Corporate Data
History
Corporate Name: Toyo Engineering Corporation (TOYO)
Founded: May 1, 1961
Number of Employees: 4,548 (Consolidated, As of March 31, 2013)
Corporate Philosophy: Mission: Engineering for Sustainable Growth of the Global Community Vision: Global Leading Engineering Partner Values: Integrity, Creativity, Diversity, Learning, Team
Business Activities: Engineering and Construction for Industrial Facilities
● R&D support, design, engineering, procurement, construction, commissioning, technical assistance for industrial facilities: oil, gas, oil & gas development, petrochemicals, chemicals, water treatment, transportation systems, power generation, nuclear power, advanced production systems, pharmaceutical, fine chemical, distribution systems, biotechnology, environment and others ● IT engineering services and system software supply
1961 ● TOYO was established. Capital: 300 million yen
1962 ● An agreement for engineering service and technical assistance was concluded with
Lummus Co. (U.S.A.).
1963 ● The first overseas contract for a fertilizer plant with The Fertilizer Corporation of India Ltd.
was awarded.
1964 ● The first urea plant contract in the former
Soviet Union was awarded.
1965 ● TOYO was awarded its first ethylene plant contract
(Osaka, Japan).
1969 ● TOYO was awarded the contract for the first
ammonia plant in the former Soviet Union.
1970 ● TOYO was awarded the contract for two ammonia
plants in the former East Germany.
1972 ● International Procurement & Service Corporation (Currently Toyo Engineering Europe, S.r.l.)
established.
1973 ● A contract for a urea plant for China was awarded.
1975 ● Capital: 1,890 million yen
1976 ● Toyo Engineering India Limited established.
1977 ● Construction of the Research Center completed
in Mobara, Chiba Prefecture.
1978 ● Capital: 2,970 million yen
1980 ● Capital: 3,300 million yen ● TOYO was listed on the second section of the Tokyo
Stock Exchange.
1982 ● Capital: 5,040 million yen ● TOYO was listed on the first section of the Tokyo
Stock Exchange.
1985 ● Toyo-Thai Corporation Ltd. established.
1986 ● Toyo U.S.A., Inc. established. ● Toyo Engineering & Construction Sdn. Bhd.
established in Malaysia.
1987 ● Toyo Engineering Korea Limited established.
1989 ● Capital: 12,219 million yen
1990 ● Head Office/Engineering Center (Baytec Building)
started operation in Narashino, Chiba.
1993 ● Capital: 13,017 million yen
1994 ● TOYO received ISO 9001 registration.
1998 ● Toyo do Brasil Consultoria e Construções
Industriais Ltda. established.
1999 ● Toyo Business Engineering Corporation established.
2004 ● TOYO received ISO 14001 registration.
● Toyo Engineering Corporation (China) established.
2006 ● Capital: 18,198 million yen
2007 ● Relocation of Tokyo head office.
2008 ● TOYO invested in Atlatec, S.A. de C.V. in Mexico.
2009 ● TOYO formulated the Group MVV (Mission, Vision,
Values).
2010 ● TOYO acquired Tri Ocean Engineering Limited
in Calgary, Alberta, Canada.
2011 ● The 50th Anniversary ● TOYO invested in PT. Inti Karya Persada
Tehnik (IKPT) in Indonesia.
2012 ● Medium-Term Business Plan (FY2012–FY2015) started. ● Katsumoto Ishibashi was elected as President and CEO. ● TOYO group logo developed.
50 Corporate Information

Board of Directors
Chairman
Yushi Nagata
President & CEO
Katsumoto Ishibashi*1
Executive Vice President
Makoto Fusayama*1
Directors /
Senior Executive Officers
Hideki Shiinoki*1
Keiichi MatsumotoTakaya NaitoKiyoshi NakaoSatoshi KuwaharaMasayuki UchidaMasaaki Yamaguchi*2
Corporate Auditors
Senior Corporate Auditor
Makoto Shimagaki
Corporate Auditors
Hideaki KinoshitaYoshio Kometani*3
Yoshiyuki Shinohara*3
Executive Officers
Senior Executive Officers
Akhilesh KumarTadashi HoriMasaru TakezawaHisashi OsoneShoji Koshikawa
Executive Officers
Kazuharu MurayamaMotoyoshi KamoshimaSeiichi ItakuraYutaka KitaTakayoshi ImanishiHiroshi SatoKoji KojimaMasayuki YoshizawaRyuji OkaItsuya YanagiTomohisa AbeMasahiko KitaHaruo NagamatsuEiichi Ide
Board of Directors, Corporate Auditors and Executive Officers
DC AB
A Yushi Nagata
B Katsumoto Ishibashi
C Makoto Fusayama
D Hideki Shiinoki
*1 : Representative Director
*2 : CFO
*3 : Outside Auditor
(As of June 26, 2013)
51TOYO ENGINEERING CORPORATION Annual Report 2013Corporate Information

Worldwide Network
KUALA LUMPUR
RIO DE JANEIRO
SAO PAULO
HOUSTON
MONTERREY
CARACAS
JAKARTA
SHANGHAI
BANGKOK
MO
SC
OW
MU
MBA
I
TE
HR
AN
DU
BA
I
AL K
HO
BA
R
CA
LGA
RY
MIL
AN
SEOUL
TOKYO, CHIBA
BEIJING
● HEAD OFFICE / ENGINEERING CENTER Chiba, Japan
● TOKYO HEAD OFFICE Tokyo, Japan
————————————————————————————
Overseas Offices
● Beijing, China
● Jakarta, Indonesia
● Dubai, United Arab Emirates
● Tehran, Iran
● Moscow, Russia
————————————————————————————
OVERSEAS GROUP COMPANIES
■ Toyo Engineering Korea Limited Seoul, Korea
■ Toyo Engineering Corporation (China) Shanghai, China
■ PT. Inti Karya Persada Tehnik (IKPT) Jakarta, Indonesia
■ Toyo Engineering & Construction Sdn. Bhd. Kuala Lumpur, Malaysia
■ Toyo Engineering India Limited Mumbai, India
■ Saudi Toyo Engineering Company Al Khobar, Saudi Arabia
■ Toyo Engineering Europe, S.r.I. Milan, Italy
■ Toyo Engineering Canada Ltd. Calgary, Canada
■ Toyo U.S.A., Inc. Houston, U.S.A.
■ Toyo Ingeniería de Venezuela, C.A. Caracas, Venezuela
■ Toyo do Brasil Consultoria e Construções Industriais Ltda. Rio de Janeiro, Brazil
————————————————————————————
OTHER AFFILIATES
■ TS Participações e Investimentos S.A. Sao Paulo, Brazil
■ Toyo-Thai Corporation Public Company Limited Bangkok, Thailand
■ Atlatec, S.A. de C.V. Monterrey, Mexico
————————————————————————————
DOMESTIC GROUP COMPANIES
TEC Air Service Corporation Travel and insurance services
TEC Business Services Corporation Staffing service, contracted business service, translation and interpretation service, facility management service
TEC Project Services Corporation EPC for plants and facilities
Chiba Data Center Corporation Website planning and its production & maintenance, data entry, and commercial printing
TEC Estate, Ltd. Property development and real estate business
Toyo Business Engineering Corporation System consulting and solutions provider
TEC Accounting & Consulting Ltd. Business support and consulting for accounting and accounting systems
52 Corporate Information

————————————————————————— ————————————————————————————————————————————————
Capital Stock ¥18,198 million————————————————————————— ————————————————————————————————————————————————
Stock Exchange Listing Tokyo Stock Exchange————————————————————————— ————————————————————————————————————————————————
Authorized Shares 500,000,000————————————————————————— ————————————————————————————————————————————————
Capital Stock Issued 192,792,539————————————————————————— ————————————————————————————————————————————————
Number of Shareholders 12,998————————————————————————— ————————————————————————————————————————————————
Administrator of Sumitomo Mitsui Trust Bank, LimitedShareholders’ Register 1-4-1 Marunouchi, Chiyoda-ku, Tokyo 100-0005, Japan
(As of March 31, 2013)
Stock Price
200
400
100
300
500
25,000
0
0 50,000
4 5 6 7 8 9 10 11 12 1 2 3 4 5 6 7 8 9 10 11 12 1 2 3 4 5 6 7 8 9 10 11 12 1 2 3
FY2012FY2010 FY2011
Trading Volume (Thousands of Shares)
(Yen)
Mitsui & Co., Ltd.
Japan Trustee Services Bank, Ltd. (Mitsui Chemicals, Inc. Retirement Benefit Trust Account re-entrusted by Chuo Mitsui Asset Trust and Banking Company, Ltd.)
The Master Trust Bank of Japan, Ltd. Trust Account
The Nomura Trust & Banking Co., Ltd. Trust Account
Japan Trustee Services Bank, Ltd. Trust Account
Taisei Corporation
Trust and Custody Services Bank, Ltd. Pension Trust Account
Japan Trustee Services Bank, Ltd. Trust Account 9
Sumitomo Mitsui Banking Corporation
CBHK CBLDN - FUND 135 T&D ASSET MANAGEMENT LIMITED
43,770
25,703
14,489
5,553
5,228
5,000
4,925
4,880
2,350
1,423
Number of shares(thousands)
Percentage of total(%)
22.70
13.33
7.51
2.88
2.71
2.59
2.55
2.53
1.21
0.73
Major Shareholders:
Stock Chart:
Others 0.87
Financial institutions40.13
Domestic companies28.04
Individuals 18.52
Foreign shareholders 12.44
Type of Shareholder
(%)
53TOYO ENGINEERING CORPORATION Annual Report 2013Stock Information
