to:$ $ nadinelevin$ consultant,$redwoodcity2020$...
TRANSCRIPT
1 | P a g e
To: Nadine Levin Consultant, Redwood City 2020 Alonso Barahona Safe Routes to School Coordinator, Redwood City 2020 for Climate Corps Bay Area
From: Esperanza Guevara, Nicholas Biddle, & Peter Abrams Subject: Stanford Safe Routes to School Project
EXECUTIVE SUMMARY The Safe Routes to School Program is part of a district-wide initiative to promote more active lifestyles in Redwood City. Headed by Redwood City 2020 (RWC 2020) under its Community Wellness Goals, the program aims to prevent health problems by encouraging more physical activity (RWC2020 Wellness Goals). One approach RWC 2020 has taken to meet this goal is to encourage students to walk to school. RWC 2020 expects that encouraging students to walk instead of driving will, in addition to helping students achieve healthier lifestyles, benefit both students and community members by alleviating traffic congestion, decreasing vehicle emissions, improving pedestrian safety, and encouraging a stronger sense of community. RWC 2020 is a community partnership between seven different organizations, including Redwood City and Adelante School. In the past, RWC 2020 has worked with other Stanford student groups to develop plans for the following three schools: Fair Oaks, Hawes, and John Gill School. Our group has been helping develop a plan for Adelante Spanish Immersion School, a K-6th grade, two-way Spanish immersion magnet school.
APPROACH & FINDINGS Our team took a number of different approaches for our data collection, including: researching existing Safe Routes to School Programs, engaging with community members through several different meetings, conducting site observations, and analyzing the results from a parent survey.
RECOMMENDATIONS Based on our findings from the methods listed above, we recommend the following two programs:
1. PARK & WALK PROGRAM
The Park and Walk program would require that parents – instead of pulling into the queue of cars at the school’s entrance, park their cars in the adjacent neighborhood and walk in to the school. By using the street parking readily available throughout the neighborhood, parents would avoid concentrating traffic at the school and, by turning their engines off and walking children to the school instead, assure the safety of their children.
2 | P a g e
2. CARPOOL PROGRAM The carpool program is a school-wide effort to organize groups of parents who live near each other to get together and share the responsibility of driving the children to school, instead of driving to school individually. Carpooling is a relatively simple and proven program that can help get cars off the road to alleviate the issue.

3 | P a g e
CONTENTS
Contents .......................................................................................................................................... 3 Executive Summary ....................................................................... Error! Bookmark not defined. Background ..................................................................................................................................... 5 Purpose ............................................................................................................................................ 6 Approach ......................................................................................................................................... 7
Researching Existing Programs ............................................................................................. 7 Community Meetings............................................................................................................. 7 Site Observations ................................................................................................................... 8 Parent Survey ......................................................................................................................... 8
Findings .......................................................................................................................................... 9 Strong Community Involvement ............................................................................................ 9 Current School Commute Patterns ......................................................................................... 9 Existing Physical Infrastructure ........................................................................................... 10
Recommendations ......................................................................................................................... 11 1.Park & Walk Program ....................................................................................................... 11
Rationale & Tool for Park & Walk Program ............................................................ 11 2. Carpool Program .............................................................................................................. 11
Rationale & Tool for Carpool Program ..................................................................... 11 Implementation ............................................................................................................................. 12
Tool ...................................................................................................................................... 12 Raising Awareness ............................................................................................................... 13
Health Benefits .......................................................................................................... 14 Environmental Benefits ............................................................................................. 14 Gas/Money Savings ................................................................................................... 15 Community-Building ................................................................................................. 15 Safety ......................................................................................................................... 16
Appendix ....................................................................................................................................... 17 Appendix A: Emissions Definitions .................................................................................... 17 Appendix B: Parent Survey ................................................................................................. 17 Appendix C: Assumptions and Important Numbers ............................................................ 19 Appendix D: Calculations .................................................................................................... 20
4 | P a g e
Appendix E: ICLEI (International Council for local environmental Initiatives) Emission, savings and Assumed Variable Tables ................................................................................ 21 Appendix F: Comparison and Reduction Bar Graphs for Emissions .................................. 23 Appendix G: Cost and Gas Savings Bar Graphs ................................................................. 23 Appendix H: Benefit reductions and percentages with Baseline current numbers .............. 25 Appendix I: How to Log Into Website for GIS Maps ......................................................... 25 Appendix j: Carpooling tool, carpoolassist.com .................................................................. 26
5 | P a g e
BACKGROUND In 1993, Adelante School began as a program for students in kindergarten and first grade at John Gill School, located in Redwood City. The program continued to expand over the years until moving to its present-day location in 1997. Today, Adelante School has reached a population of 548 students and an average class size of 29. With an admissions policy that accepts kindergarten students based on a lottery system, and upper grade students based on written and oral exams, the former neighborhood school now includes students from throughout the city.
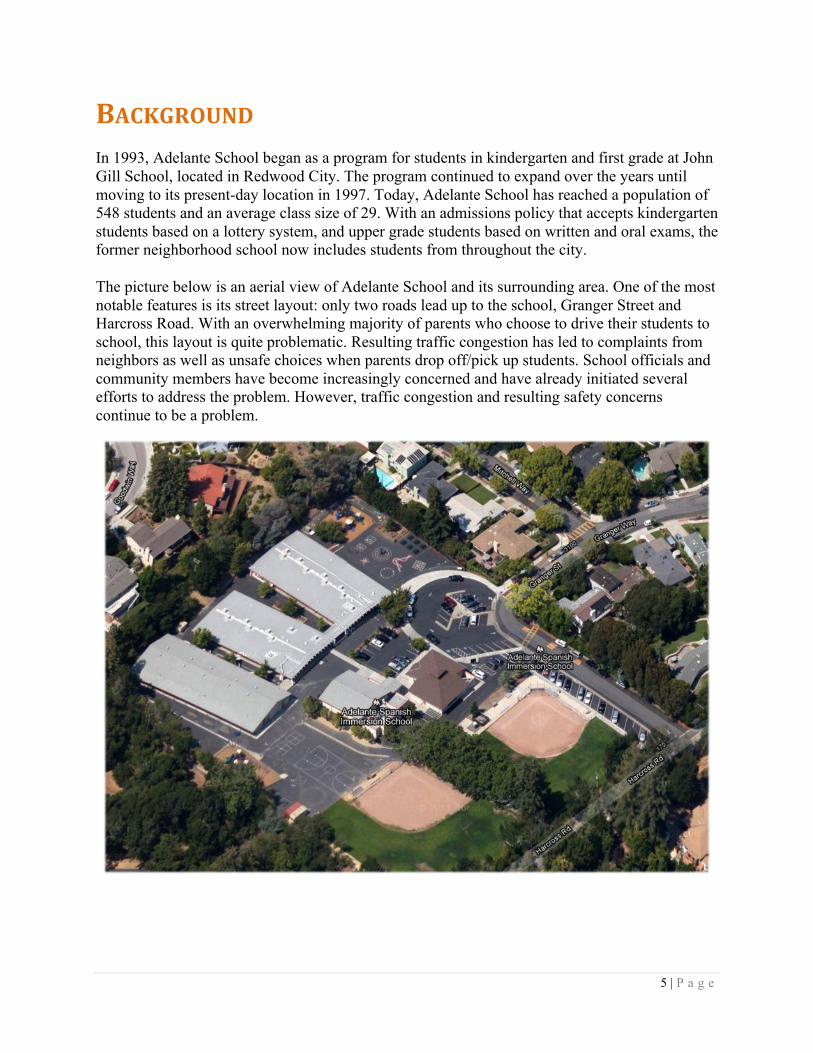
The picture below is an aerial view of Adelante School and its surrounding area. One of the most notable features is its street layout: only two roads lead up to the school, Granger Street and Harcross Road. With an overwhelming majority of parents who choose to drive their students to school, this layout is quite problematic. Resulting traffic congestion has led to complaints from neighbors as well as unsafe choices when parents drop off/pick up students. School officials and community members have become increasingly concerned and have already initiated several efforts to address the problem. However, traffic congestion and resulting safety concerns continue to be a problem.
6 | P a g e
PURPOSE In order to help Redwood City 2020 develop a Safe Routes to School Plan for Adelante School, our goal was to create a set of recommendations that will improve pedestrian safety for both children and parents. We realized early on that creating a feasible and practical set of recommendations to achieve this goal required a strong sense of understanding of the community we would be working with. We therefore established two corollary goals: 1) to solicit input from members of the community throughout our project and 2) to survey both infrastructure and non-infrastructure-related strengths and weaknesses of the school and surrounding area.
7 | P a g e
APPROACH Our team took a number of different approaches in order to collect data. In this section, we will give an overview of each of these approaches.
RESEARCHING EXISTING PROGRAMS The starting point for our project was the National Center for Safe Routes to School website (www.saferoutesinfo.org). The site offered us a consolidated source of information on other Safe Routes to School Programs, and more importantly, several resources on how to plan and implement a Safe Routes to School Plan.
COMMUNITY MEETINGS In Researching Sustainability, Newton and Parfitt argue that researchers should move toward what they call “mutual research relationships,” where traditional research methods become a secondary focus to that of forming a relationship between the researcher and the researched. Newton and Parfitt go on to make the case for Participatory Action Research (PAR), which is defined as a collaborative process of research, reflection, learning and action between the researcher and the researched. Although PAR is time-intensive, the authors argue that there are core principles espoused by it which make it extremely valuable. For example, by focusing on reciprocity and collaboration, PAR can help level the traditionally skewed power dynamic between researchers and the researched. In other words, the approach offers a more ethical basis for conducting research by changing the terms used by researchers from working 'on' or 'in' a community, to working 'with' a community. Our team decided to adopt this approach for our project, both so that we would be better informed when developing our program recommendations and so that we could establish a healthy relationship with the community based on PAR principles. After our initial “Kick-Off Meeting” with our Community Partners from RWC 2020 and with the principal of Adelante School, Linda Montes, our group had several meetings with various community members throughout the course of our project:
8 | P a g e
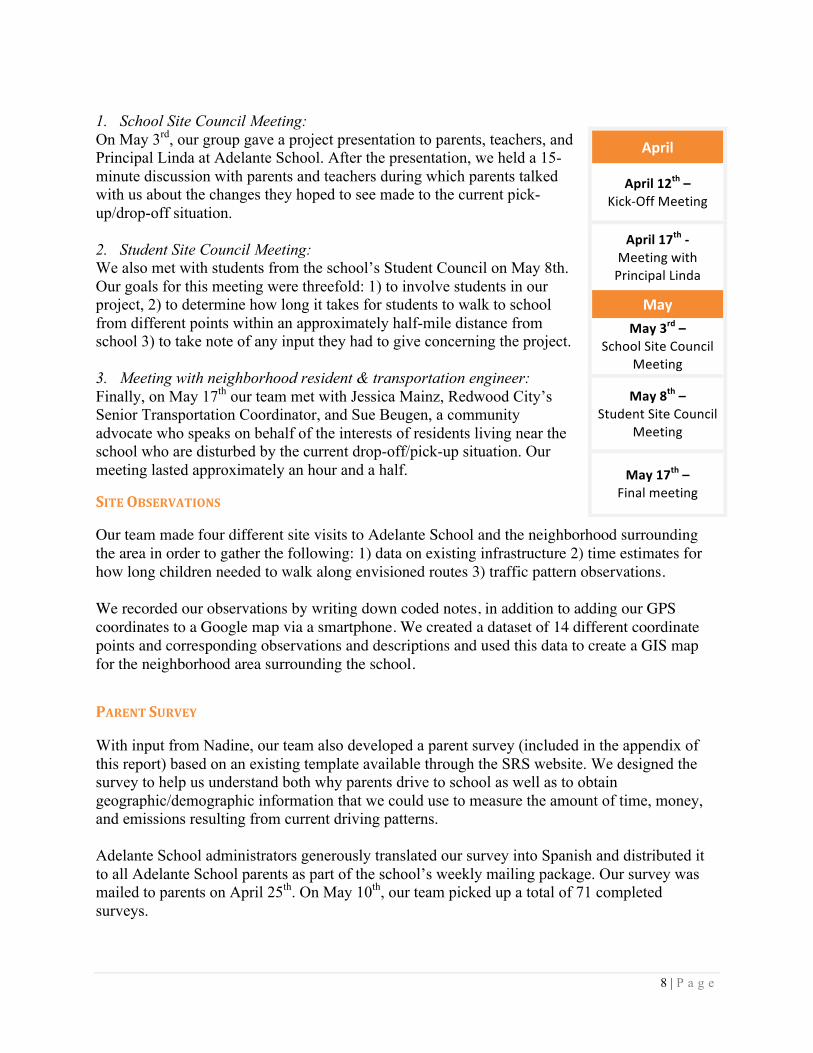
1. School Site Council Meeting: On May 3rd, our group gave a project presentation to parents, teachers, and Principal Linda at Adelante School. After the presentation, we held a 15-minute discussion with parents and teachers during which parents talked with us about the changes they hoped to see made to the current pick-up/drop-off situation.
2. Student Site Council Meeting: We also met with students from the school’s Student Council on May 8th. Our goals for this meeting were threefold: 1) to involve students in our project, 2) to determine how long it takes for students to walk to school from different points within an approximately half-mile distance from school 3) to take note of any input they had to give concerning the project. 3. Meeting with neighborhood resident & transportation engineer: Finally, on May 17th our team met with Jessica Mainz, Redwood City’s Senior Transportation Coordinator, and Sue Beugen, a community advocate who speaks on behalf of the interests of residents living near the school who are disturbed by the current drop-off/pick-up situation. Our meeting lasted approximately an hour and a half.
SITE OBSERVATIONS Our team made four different site visits to Adelante School and the neighborhood surrounding the area in order to gather the following: 1) data on existing infrastructure 2) time estimates for how long children needed to walk along envisioned routes 3) traffic pattern observations. We recorded our observations by writing down coded notes, in addition to adding our GPS coordinates to a Google map via a smartphone. We created a dataset of 14 different coordinate points and corresponding observations and descriptions and used this data to create a GIS map for the neighborhood area surrounding the school.
PARENT SURVEY With input from Nadine, our team also developed a parent survey (included in the appendix of this report) based on an existing template available through the SRS website. We designed the survey to help us understand both why parents drive to school as well as to obtain geographic/demographic information that we could use to measure the amount of time, money, and emissions resulting from current driving patterns. Adelante School administrators generously translated our survey into Spanish and distributed it to all Adelante School parents as part of the school’s weekly mailing package. Our survey was mailed to parents on April 25th. On May 10th, our team picked up a total of 71 completed surveys.
April
April 12th – Kick-‐Off Meeting
April 17th -‐ Meeting with Principal Linda
May May 3rd –
School Site Council Meeting
May 8th – Student Site Council
Meeting
May 17th – Final meeting
9 | P a g e
FINDINGS
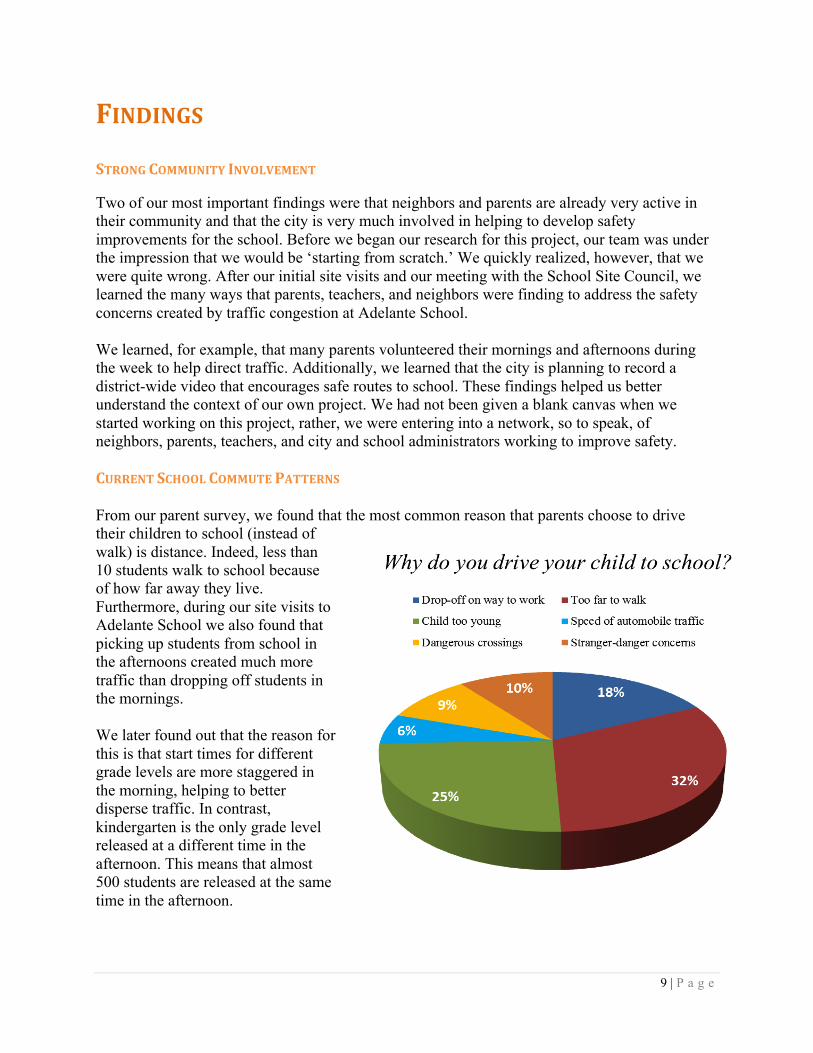
STRONG COMMUNITY INVOLVEMENT Two of our most important findings were that neighbors and parents are already very active in their community and that the city is very much involved in helping to develop safety improvements for the school. Before we began our research for this project, our team was under the impression that we would be ‘starting from scratch.’ We quickly realized, however, that we were quite wrong. After our initial site visits and our meeting with the School Site Council, we learned the many ways that parents, teachers, and neighbors were finding to address the safety concerns created by traffic congestion at Adelante School. We learned, for example, that many parents volunteered their mornings and afternoons during the week to help direct traffic. Additionally, we learned that the city is planning to record a district-wide video that encourages safe routes to school. These findings helped us better understand the context of our own project. We had not been given a blank canvas when we started working on this project, rather, we were entering into a network, so to speak, of neighbors, parents, teachers, and city and school administrators working to improve safety. CURRENT SCHOOL COMMUTE PATTERNS From our parent survey, we found that the most common reason that parents choose to drive their children to school (instead of walk) is distance. Indeed, less than 10 students walk to school because of how far away they live. Furthermore, during our site visits to Adelante School we also found that picking up students from school in the afternoons created much more traffic than dropping off students in the mornings. We later found out that the reason for this is that start times for different grade levels are more staggered in the morning, helping to better disperse traffic. In contrast, kindergarten is the only grade level released at a different time in the afternoon. This means that almost 500 students are released at the same time in the afternoon.
10 | P a g e
EXISTING PHYSICAL INFRASTRUCTURE It became apparent after visiting the school that there were many existing infrastructure and other physical features to take into account. The following is a summary list of our most salient findings:
• Previous surveys found that parents did not believe walking would be a problem, but
that they felt it was unsafe because of moving traffic.
• There is no sidewalk on one of the roads leading to the school.
• Although drivers are not allowed to drive outward from the school up the exiting
street to Harcross Road, parents do not follow this because of frustration with traffic
congestion.
• There is limited public transportation available to the area and the children are often
too young to bike or bus in safely.
11 | P a g e
RECOMMENDATIONS Based on our research and findings, we recommend that Adelante School adopt the following programs:
1. PARK & WALK PROGRAM
The Park and Walk program would require that parents – instead of pulling into the queue of cars at the school’s entrance, park their cars in the adjacent neighborhood and walk in to the school. By using the street parking readily available throughout the neighborhood, parents would avoid concentrating traffic at the school and, by turning their engines off and walking children to the school instead, assure the safety of their children.
RATIONALE & TOOL FOR PARK & WALK PROGRAM Adelante School’s layout was not poorly designed; rather, it was designed to be a neighborhood school, which it no longer is. Today, Adelante is a magnet school, which means children come from all throughout the city. Almost all parents drive and are not within reasonable walking range. Furthermore, there is limited public transportation available in the area and children are often too young to bike or take public transportation to school safely. Additionally, because so many parents currently rely on driving as their primary mode of transportation, it was unreasonable to expect significant changes to this commute behavior. For these reasons, we believe that the park and walk program will meet the needs of the school. By keeping cars from bottlenecking at the entrance and roads leading up to the school, there would be a reduction in traffic and congestion around the school. Our team hopes that this program will bring back elements of the school’s former role as a neighborhood school by having children close to the school and then follow the neighborhood walking structure that was originally intended. The cars effectively become the entrance to the neighborhood home where kids walk to and from.
2. CARPOOL PROGRAM The carpool program is a school-wide effort to organize groups of parents who live near each other to get together and share the responsibility of driving the children to school, instead of driving to school individually. Carpooling is a relatively simple and proven program that can help get cars off the road to alleviate the issue.
RATIONALE & TOOL FOR CARPOOL PROGRAM As we stated earlier, driving is the main mode of transportation to and from school and it is unlikely that this will change in the near future. In addition, the school has doubled in size over the past few years. Taken together, these two factors mean that the number of cars traveling to and from the school each day has increased dramatically. In order to combat this trend, one of
12 | P a g e
the ways we want to reduce congestion is to bring the number of cars driving to school to down to levels it had before the size of the school doubled. During our meetings with community members, we learned that many do not remember traffic congestion being as big of an issue as it has become in the last few years. This suggests that the increase in the number of car going to school may be answer. Also, from a meeting with the principal, we found out that the majority of the parents live in or near the heart of Redwood City in a highly dense area, which means that parents could coordinate to use the carpool program much more easily. The tool we set up to support the school in its effort is a carpool website called carpoolassist.com. The website provides parents with a way to get in contact with one another and alleviates problems with scheduling. They also provide the school with flyers in order to get the word out about the program. More on the specifics of carpoolassist.com can be found in appendix J.
IMPLEMENTATION In this section, we will be discussing the different ways that these programs can benefit parents, the neighborhood, the school, children, and the environment. Our hope is that the following will encourage community members to use these programs. In particular, we hope that these programs will be explained to parents at the initial School Site Council meeting at the beginning of the year.
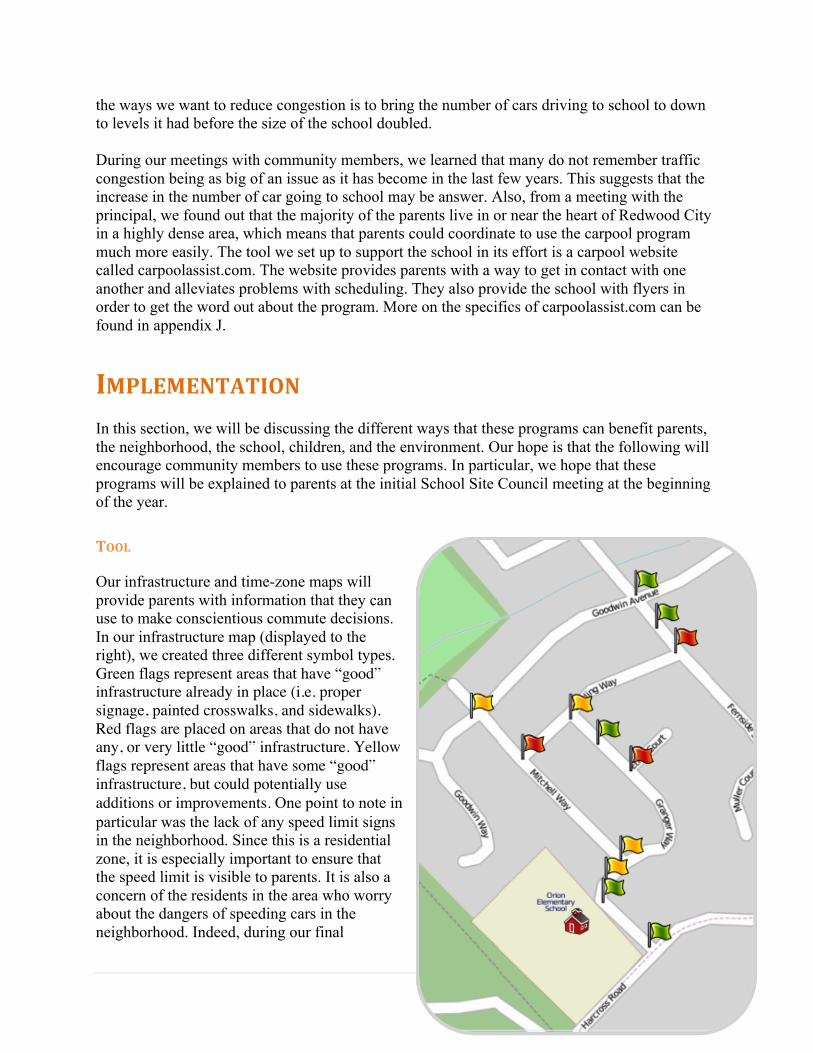
TOOL Our infrastructure and time-zone maps will provide parents with information that they can use to make conscientious commute decisions. In our infrastructure map (displayed to the right), we created three different symbol types. Green flags represent areas that have “good” infrastructure already in place (i.e. proper signage, painted crosswalks, and sidewalks). Red flags are placed on areas that do not have any, or very little “good” infrastructure. Yellow flags represent areas that have some “good” infrastructure, but could potentially use additions or improvements. One point to note in particular was the lack of any speed limit signs in the neighborhood. Since this is a residential zone, it is especially important to ensure that the speed limit is visible to parents. It is also a concern of the residents in the area who worry about the dangers of speeding cars in the neighborhood. Indeed, during our final
13 | P a g e
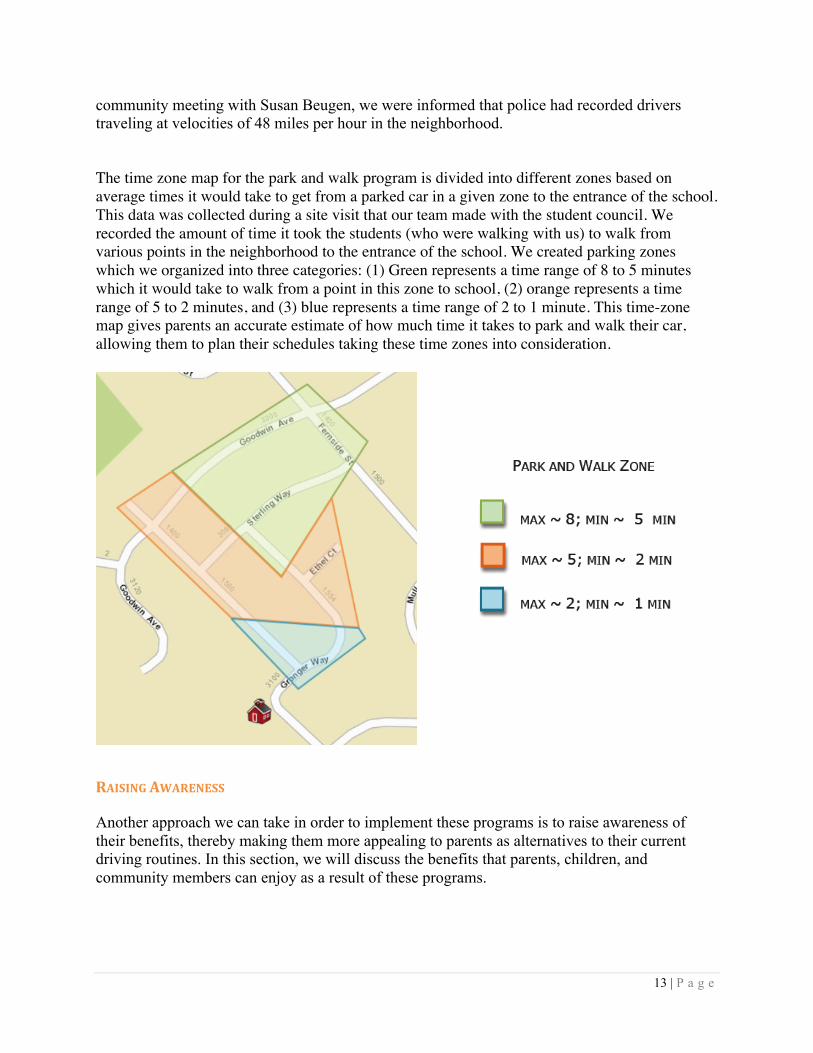
community meeting with Susan Beugen, we were informed that police had recorded drivers traveling at velocities of 48 miles per hour in the neighborhood. The time zone map for the park and walk program is divided into different zones based on average times it would take to get from a parked car in a given zone to the entrance of the school. This data was collected during a site visit that our team made with the student council. We recorded the amount of time it took the students (who were walking with us) to walk from various points in the neighborhood to the entrance of the school. We created parking zones which we organized into three categories: (1) Green represents a time range of 8 to 5 minutes which it would take to walk from a point in this zone to school, (2) orange represents a time range of 5 to 2 minutes, and (3) blue represents a time range of 2 to 1 minute. This time-zone map gives parents an accurate estimate of how much time it takes to park and walk their car, allowing them to plan their schedules taking these time zones into consideration.
RAISING AWARENESS Another approach we can take in order to implement these programs is to raise awareness of their benefits, thereby making them more appealing to parents as alternatives to their current driving routines. In this section, we will discuss the benefits that parents, children, and community members can enjoy as a result of these programs.
14 | P a g e
HEALTH BENEFITS Why would a parent choose to park his or her car 7 minutes away from school when they could, instead, park only 2 minutes away? Most people would, of course, choose the most convenient option. This kind of reasoning is known as the tragedy of the commons – in which each individual pursues his or her own interests without taking into account how these decisions will affect the welfare of the entire group. For example, if every parent were to park as close as possible to the school’s entrance, traffic would become concentrated in this area, creating congestion and delays for all parents. By emphasizing the health benefits of the program, the school can help show people that they will be able to derive an equal or greater amount of benefits from parking farther away from school. Through the Park & Walk Program, parents can incorporate physical activity into both their own lives, and the lives of their children. With obesity and related health issues becoming increasingly prevalent in the United States, it is recommended to incorporate 20 to 30 minutes of physical activity into one’s day to live a healthy lifestyle. By parking farther from the school twice a day, parents can add up to16 minutes of regular physical activity into their daily routes. Finally, both the Park and Walk Program and the Carpool Program reduce the amount of emissions, which can have direct and harmful effect on people in the area, especially children. This exposure increases the risk, especially in children, of developing respiratory problems such as asthma.
ENVIRONMENTAL BENEFITS
From an environmental perspective, the carpool program is also very appealing. By significantly reducing the number of cars on the road, the program can reduce emissions, as shown below (please see Appendix C-E for assumptions and calculations):

15 | P a g e
GAS/MONEY SAVINGS
With reduced car mileage and consequently less idling, there are also reductions in the amount of gas used as well as monetary savings. In fact, assuming the same statistics used in the emissions calculations, the Park and Walk Program can save around $13,500 dollars in gas money as well as 7,753 vehicle miles traveled. Being extremely inefficient for the engine, eliminating idling alone can save $11,212.
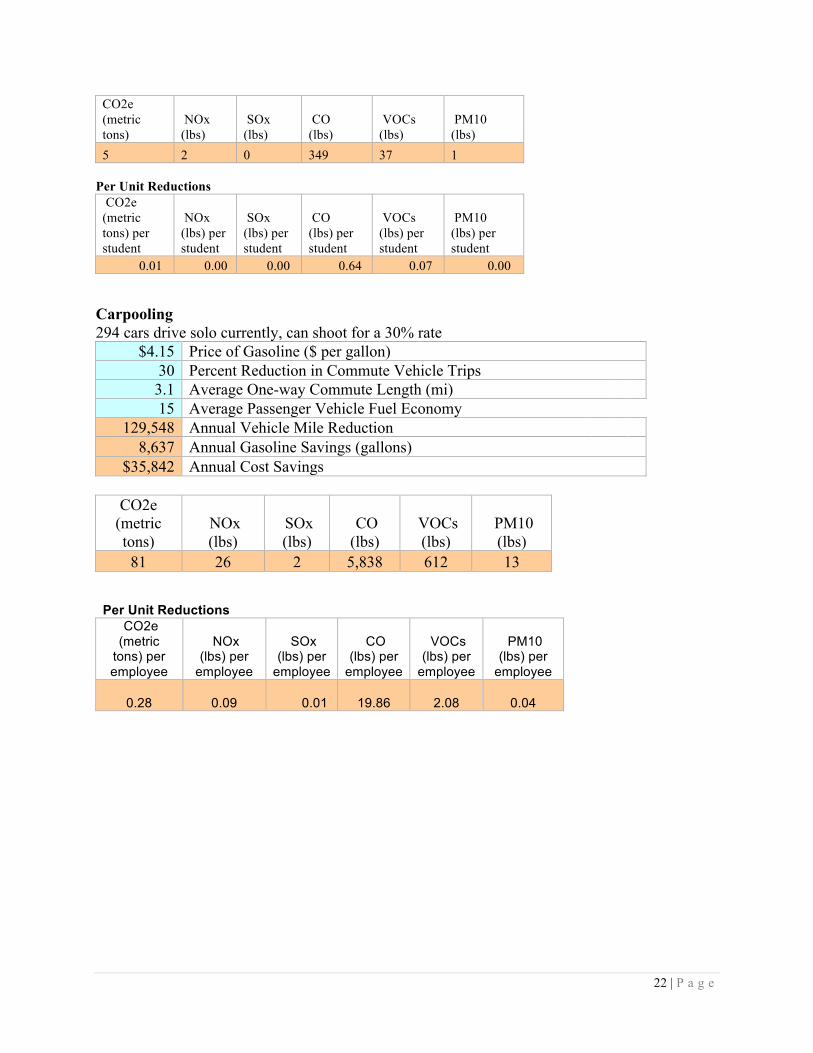
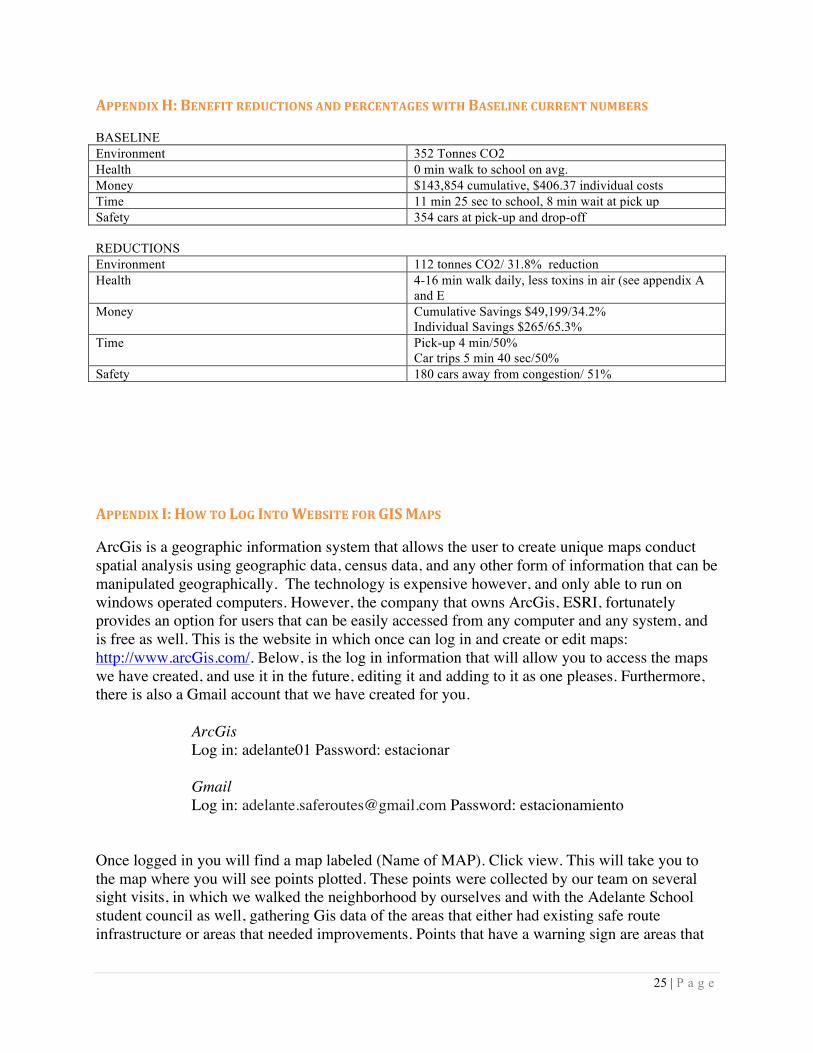
Carpooling, however, is the most effective way to save gas and money. The collective benefits for the community could be drastic by reducing the number of miles driven and therefore the number of gallons of gas consumed. Using the same numbers from the emissions calculations and assuming an average car efficiency of 15 miles per gallon, the annual vehicle-miles reduction is about 129,600 miles, which amounts to 8,637 gallons of gas saved and $35,842 in savings. This is equal to about 24.4 gallons of gas saved per family per year and about $203 saved in gas money at $4.15 gas prices for participating families.
COMMUNITY-‐BUILDING
Another very real benefit of carpooling is time for children and families to build relationships. Often kids in magnet schools miss out on the opportunity to make friends who live right around the corner. The beauty of a carpool program is that it usually involves families who live close to each other who may have had no idea of the others presence. The friendships that can develop through carpools can be valuable and priceless for a child’s development. Also, knowing a family nearby can build a feeling of community identity that can be a great support for families and for the school.

16 | P a g e
SAFETY
Finally, carpooling can benefit the safety of children and the neighborhood as well simply by reducing the number of cars that are at pick-up and drop-off. The sheer number of cars going to and from the school alone is a problem for child safety as there are more chances for accidents and more reasons for parents to be stressed while driving. The car reduction from the congestion around the school will be about 51% 180 fewer cars traveling right up to the school. With fewer cars, less stress, more control, we have an overall improvement in safety.
The safety of the children is the primary reason for implementing a Safe Routes to School Program. If enough people participate in these programs, the safety benefits could be priceless. The stress and aggressive driving behavior that stems from the excessive congestion and long waiting times is possibly the most dangerous thing to the health of children. With the mass confusion that comes from the end of school and the pick-up process, there is “an accident waiting to happen”, as described by parents and faculty of the school. By reducing the car traffic around the school and having more walking traffic, safety increases.
We thank Redwood City 2020 for the opportunity to submit these recommendations for your review. We would also like to thank all community members involved in the process.

17 | P a g e
APPENDIX
APPENDIX A: EMISSIONS DEFINITIONS
Gas Effects Green House Gas (CO2)
Traps heat in the atmosphere and contributes to climate change.
NOx Contributes to ground level ozone, smog, and the formation of acid rain, ground level ozone can irritate eyes, damage the lungs, and aggravate respiratory problems.
SOx Contributes to acid rain, making groundwater toxic, as well as causing respiratory issues such as asthma.
CO Poisonous, attaches to blood cells blocking access to oxygen.
Volatile Organic Compounds
Huge contributor to smog.
Particulate Matter (Class 10)
Linked to lung disorders such as asthma and lung cancer and can interact with the immune system causing differing reactions such as overactive response or immunosuppression.
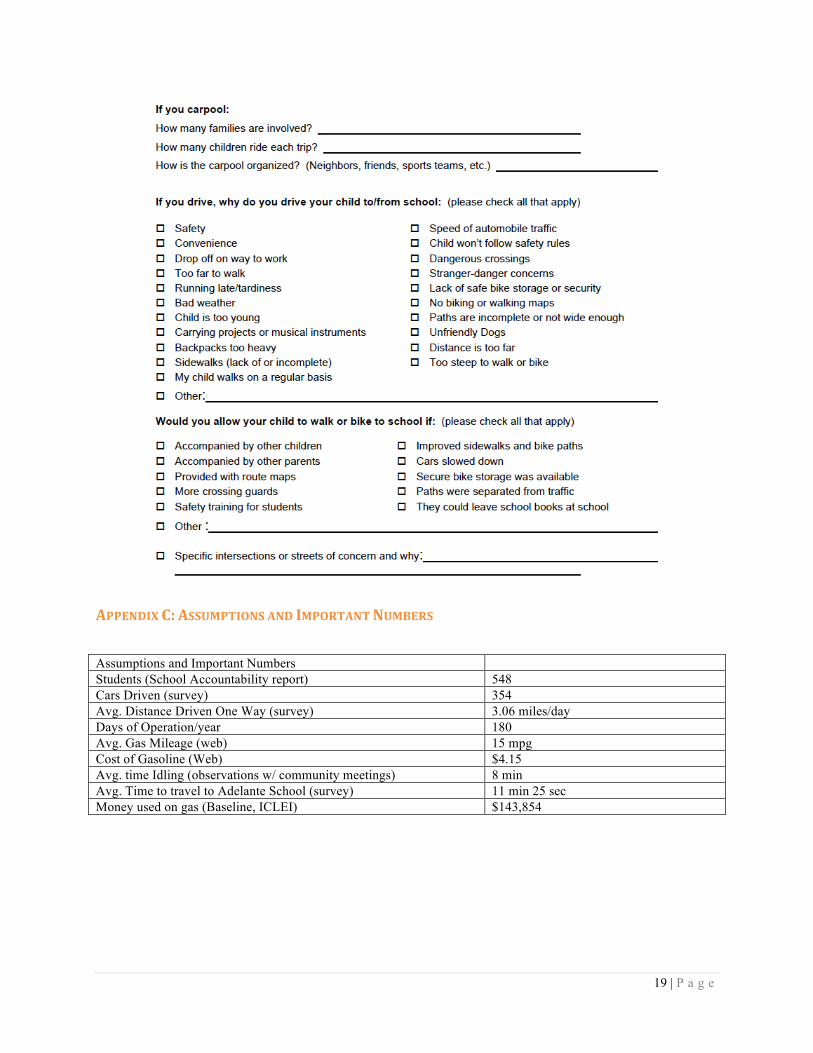
APPENDIX B: PARENT SURVEY

18 | P a g e
19 | P a g e
APPENDIX C: ASSUMPTIONS AND IMPORTANT NUMBERS Assumptions and Important Numbers Students (School Accountability report) 548 Cars Driven (survey) 354 Avg. Distance Driven One Way (survey) 3.06 miles/day Days of Operation/year 180 Avg. Gas Mileage (web) 15 mpg Cost of Gasoline (Web) $4.15 Avg. time Idling (observations w/ community meetings) 8 min Avg. Time to travel to Adelante School (survey) 11 min 25 sec Money used on gas (Baseline, ICLEI) $143,854
20 | P a g e
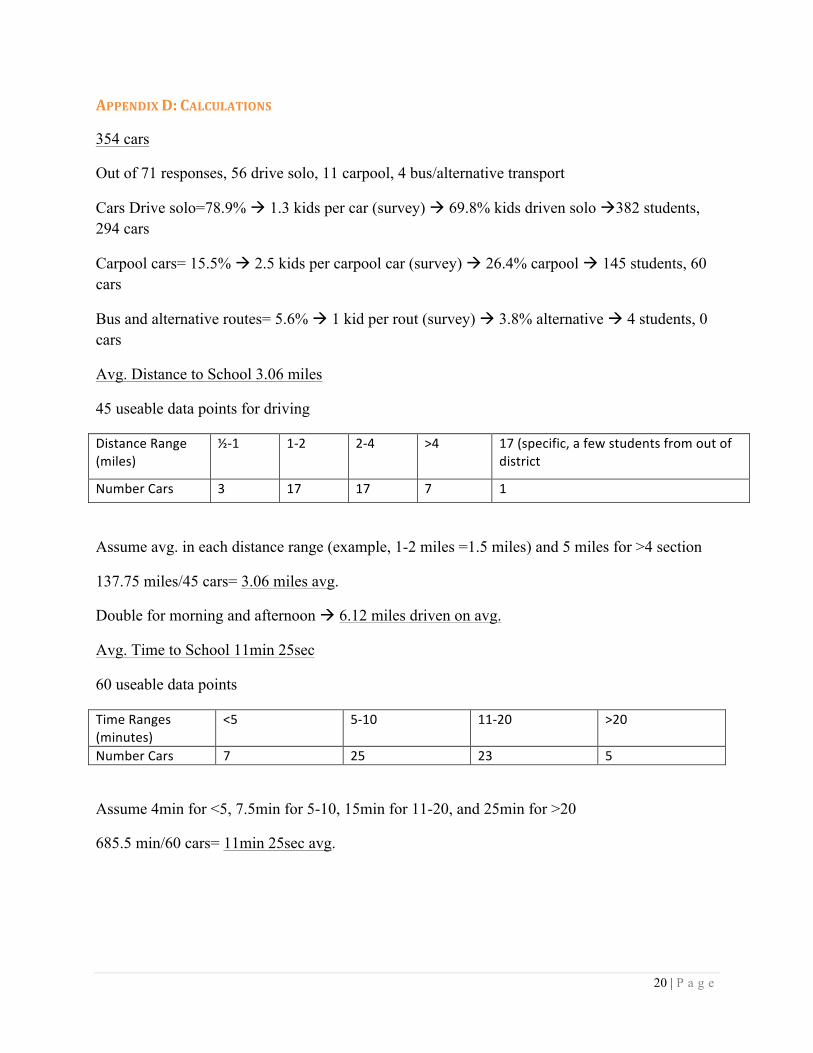
APPENDIX D: CALCULATIONS 354 cars
Out of 71 responses, 56 drive solo, 11 carpool, 4 bus/alternative transport
Cars Drive solo=78.9% 1.3 kids per car (survey) 69.8% kids driven solo 382 students, 294 cars
Carpool cars= 15.5% 2.5 kids per carpool car (survey) 26.4% carpool 145 students, 60 cars
Bus and alternative routes= 5.6% 1 kid per rout (survey) 3.8% alternative 4 students, 0 cars
Avg. Distance to School 3.06 miles
45 useable data points for driving
Distance Range (miles)
½-‐1 1-‐2 2-‐4 >4 17 (specific, a few students from out of district
Number Cars 3 17 17 7 1
Assume avg. in each distance range (example, 1-2 miles =1.5 miles) and 5 miles for >4 section
137.75 miles/45 cars= 3.06 miles avg.
Double for morning and afternoon 6.12 miles driven on avg.
Avg. Time to School 11min 25sec
60 useable data points
Time Ranges (minutes)
<5 5-‐10 11-‐20 >20
Number Cars 7 25 23 5
Assume 4min for <5, 7.5min for 5-10, 15min for 11-20, and 25min for >20
685.5 min/60 cars= 11min 25sec avg.

21 | P a g e
APPENDIX E: ICLEI (INTERNATIONAL COUNCIL FOR LOCAL ENVIRONMENTAL INITIATIVES) EMISSION, SAVINGS AND ASSUMED VARIABLE TABLES Baseline Emissions
CO2e (metric tons)
NOx (lbs)
SOx (lbs)
CO (lbs)
VOCs (lbs)
PM10 (lbs)
352 201 20 23,556 2,498 63
Per Unit Reductions
CO2e (metric tons) per employee
NOx (lbs) per employee
SOx (lbs) per employee
CO (lbs) per employee
VOCs (lbs) per employee
PM10 (lbs) per employee
0.92 0.29 0.02 66.20 6.94 0.14 Idling
$4.15 Cost of Gasoline 8 Daily Minutes Vehicles Idled 0.0053 Gasoline Use per Minute of Idling (gallons) 180 Days of Operation per Year 2,702 Annual Gasoline Savings (gallons) $11,212 Annual Cost Savings
CO2e (metric tons)
NOx (lbs)
SOx (lbs)
CO (lbs)
VOCs (lbs)
PM10 (lbs)
26 97 13 123 40 13
Per Unit Reductions CO2e
(metric tons) per vehicle
NOx (lbs) per vehicle
SOx (lbs) per vehicle
CO (lbs) per vehicle
VOCs (lbs) per vehicle
PM10 (lbs) per vehicle
0.1 0.3 0.0 0.3 0.1 0.0 Park and Walk Assumes a 26.2% participation rate of entire community (ICLEI)
$4.15 Price of Gasoline ($ per gallon) 180 School Days per Year 0.3 Average Miles Driven to Drop off or Pick up Student 15 Average Passenger Vehicle Fuel Economy
7,753 Annual Vehicle Mile Reduction 517 Annual Gasoline Savings (gallons) $2,145 Annual Cost Savings
22 | P a g e
CO2e (metric tons)
NOx (lbs)
SOx (lbs)
CO (lbs)
VOCs (lbs)
PM10 (lbs)
5 2 0 349 37 1 Per Unit Reductions
CO2e (metric tons) per student
NOx (lbs) per student
SOx (lbs) per student
CO (lbs) per student
VOCs (lbs) per student
PM10 (lbs) per student
0.01 0.00 0.00 0.64 0.07 0.00 Carpooling 294 cars drive solo currently, can shoot for a 30% rate
$4.15 Price of Gasoline ($ per gallon) 30 Percent Reduction in Commute Vehicle Trips 3.1 Average One-way Commute Length (mi) 15 Average Passenger Vehicle Fuel Economy
129,548 Annual Vehicle Mile Reduction 8,637 Annual Gasoline Savings (gallons)
$35,842 Annual Cost Savings
CO2e (metric tons)
NOx (lbs)
SOx (lbs)
CO (lbs)
VOCs (lbs)
PM10 (lbs)
81 26 2 5,838 612 13 Per Unit Reductions
CO2e (metric
tons) per employee
NOx (lbs) per
employee
SOx (lbs) per
employee
CO (lbs) per
employee
VOCs (lbs) per
employee
PM10 (lbs) per
employee
0.28
0.09 0.01
19.86
2.08
0.04
23 | P a g e
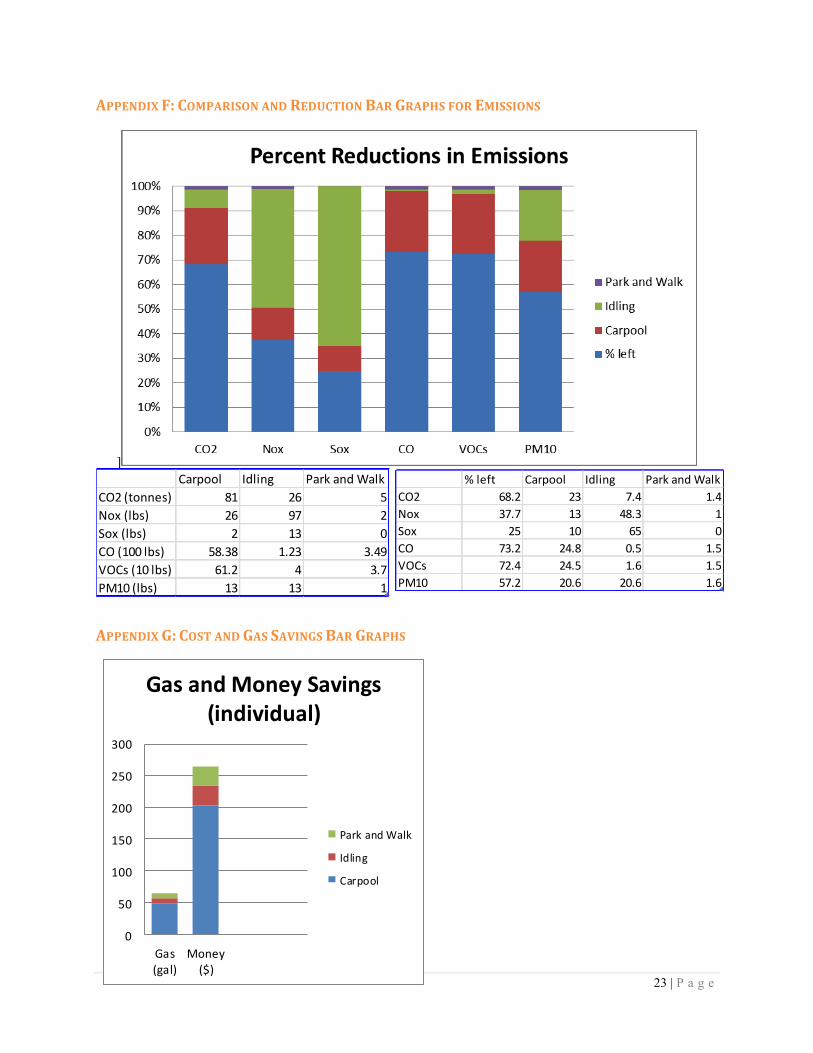
APPENDIX F: COMPARISON AND REDUCTION BAR GRAPHS FOR EMISSIONS
] Carpool Idling Park and WalkCO2 (tonnes) 81 26 5Nox (lbs) 26 97 2Sox (lbs) 2 13 0CO (100 lbs) 58.38 1.23 3.49VOCs (10 lbs) 61.2 4 3.7PM10 (lbs) 13 13 1
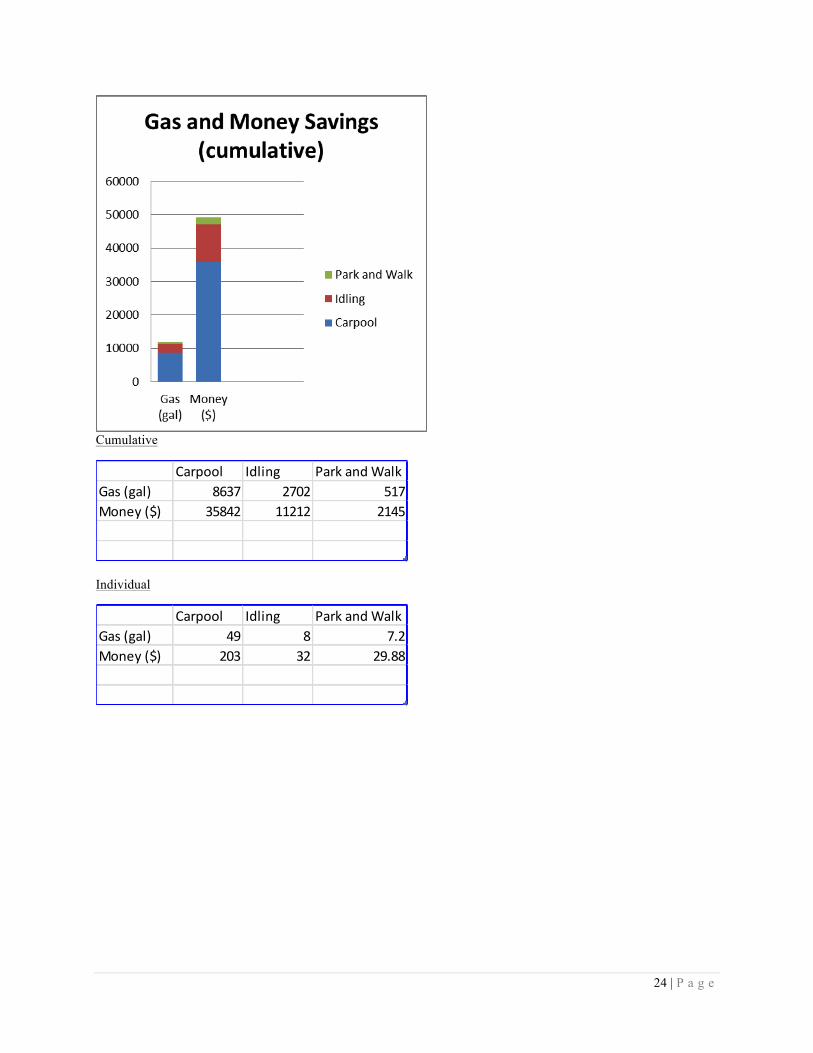
APPENDIX G: COST AND GAS SAVINGS BAR GRAPHS
0
50
100
150
200
250
300
Gas(gal)
Money($)
Gas and Money Savings(individual)
Park and Walk
Idling
Carpool
% left Carpool Idling Park and WalkCO2 68.2 23 7.4 1.4Nox 37.7 13 48.3 1Sox 25 10 65 0CO 73.2 24.8 0.5 1.5VOCs 72.4 24.5 1.6 1.5PM10 57.2 20.6 20.6 1.6
24 | P a g e
Cumulative
Carpool Idling Park and WalkGas (gal) 8637 2702 517Money ($) 35842 11212 2145
Individual
Carpool Idling Park and WalkGas (gal) 49 8 7.2Money ($) 203 32 29.88
25 | P a g e
APPENDIX H: BENEFIT REDUCTIONS AND PERCENTAGES WITH BASELINE CURRENT NUMBERS BASELINE Environment 352 Tonnes CO2 Health 0 min walk to school on avg. Money $143,854 cumulative, $406.37 individual costs Time 11 min 25 sec to school, 8 min wait at pick up Safety 354 cars at pick-up and drop-off REDUCTIONS Environment 112 tonnes CO2/ 31.8% reduction Health 4-16 min walk daily, less toxins in air (see appendix A
and E Money Cumulative Savings $49,199/34.2%
Individual Savings $265/65.3% Time Pick-up 4 min/50%
Car trips 5 min 40 sec/50% Safety 180 cars away from congestion/ 51%
APPENDIX I: HOW TO LOG INTO WEBSITE FOR GIS MAPS ArcGis is a geographic information system that allows the user to create unique maps conduct spatial analysis using geographic data, census data, and any other form of information that can be manipulated geographically. The technology is expensive however, and only able to run on windows operated computers. However, the company that owns ArcGis, ESRI, fortunately provides an option for users that can be easily accessed from any computer and any system, and is free as well. This is the website in which once can log in and create or edit maps: http://www.arcGis.com/. Below, is the log in information that will allow you to access the maps we have created, and use it in the future, editing it and adding to it as one pleases. Furthermore, there is also a Gmail account that we have created for you.
ArcGis Log in: adelante01 Password: estacionar Gmail Log in: [email protected] Password: estacionamiento
Once logged in you will find a map labeled (Name of MAP). Click view. This will take you to the map where you will see points plotted. These points were collected by our team on several sight visits, in which we walked the neighborhood by ourselves and with the Adelante School student council as well, gathering Gis data of the areas that either had existing safe route infrastructure or areas that needed improvements. Points that have a warning sign are areas that
26 | P a g e
need improvements, such as the addition of a cross walk, stop sign, or a 15 mph sign. Points with yellow stars are areas that have existing infrastructure, and purple stars are areas that have some existing infrastructure, but could use either maintenance or the addition of more to make it safer for children to walk from the school to the car. Once logged in, and viewing the map, one can scroll over the points, and click each one. This allows the viewer to see (1) the actual geographic coordinates and (2) the observations our team has made. The user can then edit and use this information as they please.
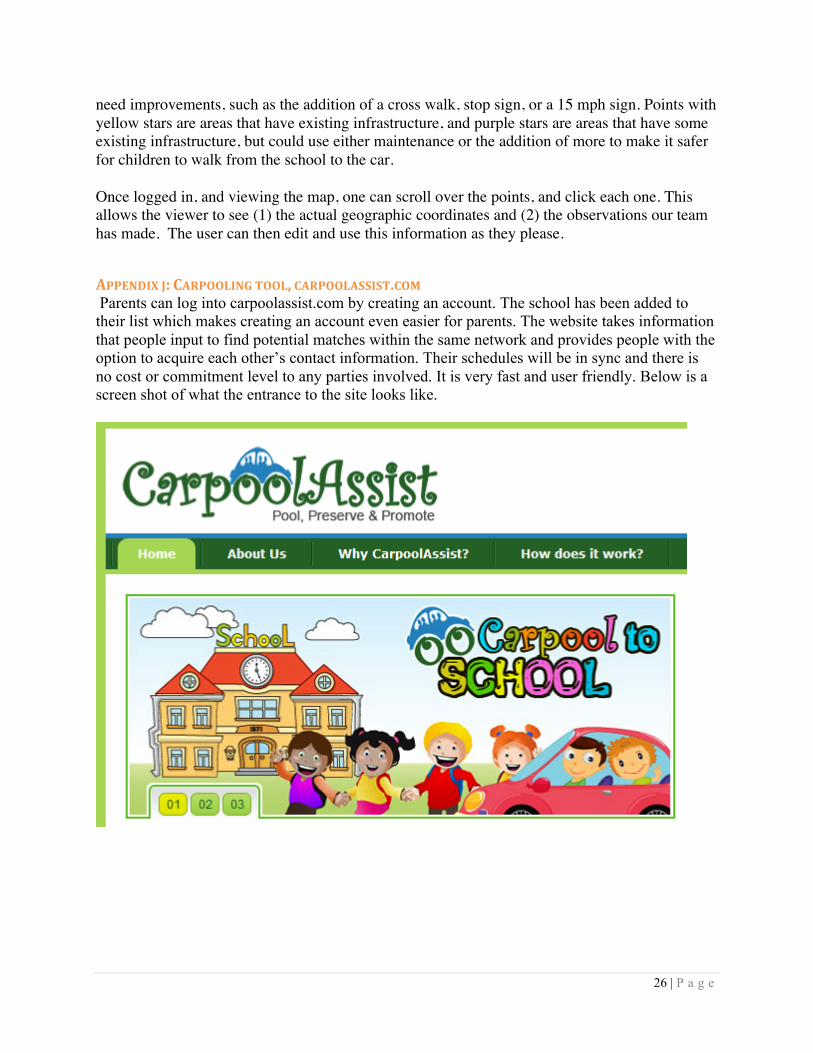
APPENDIX J: CARPOOLING TOOL, CARPOOLASSIST.COM Parents can log into carpoolassist.com by creating an account. The school has been added to their list which makes creating an account even easier for parents. The website takes information that people input to find potential matches within the same network and provides people with the option to acquire each other’s contact information. Their schedules will be in sync and there is no cost or commitment level to any parties involved. It is very fast and user friendly. Below is a screen shot of what the entrance to the site looks like.