to mix or not to mix data collection modes in surveys mix or not to mix... · surveys, their...
TRANSCRIPT
To Mix or Not to Mix Data Collection Modes in Surveys
Edith D. de Leeuw1
Traditionally in social surveys and official statistics data were collected either by aninterviewer visiting a respondent or through a self-administered mail questionnaire. In thesecond half of the twentieth century this picture changed rapidly. Telephone surveys becameincreasingly popular, reaching their peak in the 1990s. Advances in computer technology inthe last thirty years have made computer-assisted survey methods possible, including methodsfor Internet and web surveys. This variety of data collection methods led to methodologicalquestions, such as, which method to choose? which is best? Recently in survey practicemultiple modes of data collection or mixed-modes have become more and more popular. Inthis article I will outline the advantages and disadvantages of mixed-mode survey designs,starting with an overview of common forms of mixed-mode design and discussing reasons forusing more than one mode in a survey. This overview will end with a discussion of practicalissues and an agenda for future research.
Key words: Data quality; dual frame surveys; equivalence of instruments; hybrid surveys;mixed-mode; multiple mode; multi-mode; mode system; coverage; nonresponse; surveycosts; survey error.
1. Introduction
One of the most important challenges to survey researchers is deciding which data
collection method or mix of methods is optimal in the present situation. Times and
methodologies are changing and certainly data collection technology is. The first
documented mail survey dates from 1788 when Sir John Sinclair sent out a questionnaire
to the ministers of all parishes of the Church of Scotland. It took 23 reminders, but he
achieved a 100% response and documented his findings in “The Statistical Account of
Scotland.” (For a historic overview of surveys, see De Heer, De Leeuw, and Van der
Zouwen 1999.) In 2005, a 100% response rate is something dreams are made of, but mail
surveys are still an efficient data collection tool (cf. Dillman 2000).
The first scientific face-to-face survey took place in 1912, when Sir Arthur Bowley
started a study of working-class conditions in five British cities in which samples of
citizens were interviewed using a structured interview schedule. Mail and face-to face
surveys are the oldest recorded data collection modes. Therefore it is not surprising that the
earliest forms of mixed-mode designs combine face-to-face interviews with mail surveys.
q Statistics Sweden
1Department of Methodology and Statistics, Utrecht University/Methodika, Amsterdam, Plantage Doklaan 40,NL-1018 CN Amsterdam, The Netherlands, Email: [email protected]: I thank the extremely helpful members of the discussion lists of AAPOR, SRMS, WAPOR,and NOSMO for sending me references and reports on new challenges and new developments in mixed-modesurvey design. I also thank Joop Hox and Don Dillman for the stimulating discussions on this topic. This articlewas partly written while I was a visiting international fellow at the Department of Sociology of the University ofSurrey.
Journal of Official Statistics, Vol. 21, No. 2, 2005, pp. 233–255
For example, in longitudinal or panel surveys, face-to-face interviews were used in the
recruitment phase to maximize response and to administer base-line questionnaires to
household members. In the next waves, data were then collected with less costly mail
surveys. Almost the same approach is now in vogue for establishing “access” panels and
Internet panels: telephone interviews for recruitment and far less costly web surveys for
follow-up data collection. The technology changed, but the reasons for mixing modes and
the basic approach did not.
Whilst the face-to-face interview was the gold standard in the fifties and sixties of the
twentieth century, the telephone survey quickly became popular during the seventies and
soon became the predominant mode in the U.S.A. (see Nathan 2001). The popularity of
telephone surveys led to a new mixed-mode approach as mixes of face-to-face and
telephone surveys were implemented. For instance, beginning in 1984, the British Labour
Force Survey used telephone interviews in a quarterly panel design. In this mixed-mode
design all first interviews were conducted in person, and the follow-up interviews were
conducted by telephone (Wilson, Blackshaw, and Norris 1988).
The rapid growth of computer technology caused the next important change in data
collection. Computer-assisted equivalents were developed for all major data collection
methods (De Leeuw and Collins 1997; Couper and Nicholls 1998) with a generally
positive effect on data quality and a potential for new applications (for an overview, see
De Leeuw 2002). The greater efficiency and more effective case management of
computer-assisted telephone interviewing (CATI) made this a powerful tool for the
screening of potential respondents and for nonresponse follow-ups (cf. Connett 1998;
Dillman 2000, p. 218). The development of integrated programs stimulated the use of
computer-assisted self-interviewing (CASI) in face-to-face interviews, and CAPI-CASI
mixes became popular especially in interviews on sensitive topics. The procedure is
straightforward: when sensitive questions have to be asked the interviewer hands over the
computer to the respondent for a short period. The respondent can answer in all privacy
and the interviewer remains at a respectful distance, but is available for instructions and
assistance. This is the most common use of CASI and is equivalent to the traditional
procedure where an interviewer might give a paper questionnaire to a respondent to fill in
privately (cf. De Leeuw, 2002). A more recent form of computer-assisted self-
interviewing has come about by means of the establishment of computerized household
panels (Saris 1998), where households are equipped with computers and software and
questionnaires are sent electronically on a regular basis. CATI facilities are still necessary
to recruit panel members and assist respondents with problems.
The latest development is the web or Internet survey. Internet or web surveys are very
cost and time efficient (Dillman 2000; Couper 2000), and this together with the novelty
value have made them very popular in a short time. They have a great potential, but they
also still have limitations (e.g., noncoverage, nonresponse). For a general introduction and
overview concerning web surveys, see Couper (2000). For detailed updates on
methodological issues regarding web surveys, see the WebSM website, a nonprofit
website dedicated to such issues (www.websm.org). The rapidly growing interest in web
surveys, their potential and limitations, gave a new impetus to mixed-mode designs.
Combinations of web and paper mail surveys are now being investigated, especially at
universities and in official statistics (Couper 2000, Dillman 2000). At the same time, mixes
Journal of Official Statistics234

of web and telephone surveys are rapidly gaining popularity, especially in market
research.
It is no wonder that mixed-mode surveys are presently attracting much interest and were
made a main topic at the data collection conferences of the Council of American Survey
Research Organizations (CASRO) in 2003 and 2004. According to Biemer and Lyberg
(2003), mixed-mode surveys are the norm these days, at least in the U.S.A. and parts of
Western Europe. In Japan, for instance, there is almost no case in which a survey is
conducted with mixed-mode (Yutaka Ujiie 2005, personal communication). Methodo-
logical publications on how to secure methodological quality in mixed-mode surveys are
scarce, and most handbooks do not even discuss mixed-mode designs. Exceptions are
Biemer and Lyberg (2003), Czaja and Blair (2005), and Groves, Fowler, Couper,
Lepkowski, Singer, and Tourangeau (2004), who all include a section on mixed-mode
designs in their chapters on data collection. Dillman (2000) devotes a whole chapter to
mixed-mode surveys. Articles in journals and proceedings are mainly concerned with
comparing separate modes, or just describing the use of a mixed-mode design without
discussing the implications. In the next sections I will offer an overview of different forms
of mixed-mode designs, their advantages and their implications for survey quality. In this
overview I will integrate the as yet scarce methodological literature on this topic.
2. Mixed-mode Designs
2.1. Why opt for mixed-mode?
An optimal data collection method is defined as the best method, given the research
question and given certain restrictions (cf. Biemer and Lyberg 2003). The basic research
question defines the population under study and the type of questions that should be asked.
Survey ethics and privacy regulations may restrict the design, as may practical restrictions
like available time and funds. When designing a survey the goal is to optimize data
collection procedures and reduce total survey error within the available time and budget.
In other words, it is a question of finding the best affordable method, and sometimes the
best affordable method is a mixed-mode design.
Survey designers choose a mixed-mode approach because mixing modes gives an
opportunity to compensate for the weaknesses of each individual mode at affordable cost.
The most cost-effective method may not be optimal for a specific study. By combining this
method with a second more expensive method the researcher has the best of both worlds:
less costs and less error than in a unimode approach. In mixed-mode designs there is an
explicit trade-off between cost and errors, focusing on nonsampling errors–that is, frame
or coverage error, nonresponse error and measurement error (cf. Biemer and Lyberg 2003;
Groves 1989).
To reduce coverage bias in the early days of telephone surveys, dual-frame mixed-mode
surveys were employed. Coverage bias occurred because part of the population did not
have a telephone and the no telephone households differed from the telephone households
on socio-demographic variables such as age and social economic status. A dual-frame
mixed-mode design has the advantage of the cost savings of telephone interviewing and
the increased coverage of area probability sampling: the best affordable method from
de Leeuw: To Mix or Not to Mix Data Collection Modes in Surveys 235
a coverage-costs point of view. For an in-depth methodological discussion, see Groves and
Lepkowski (1985). Coverage error is also one of the biggest threats to inference from web
surveys (Couper 2000). Although Internet access is growing and more than half of the U.S.
population have access to the net (Couper 2000; Balden 2004), the picture is diverse
ranging from 74% coverage for Sweden to 1.6% for Africa (www.internetworldstats.com).
Furthermore, those covered differ from those not covered, with the elderly, lower-
educated, lower-income, and minorities less well-represented online. Recent figures for
the Netherlands give a similar socio-demographic picture. To compensate for coverage
error in web surveys, mixed-mode strategies are now employed. For instance, in a survey
on mobile phones and interest in WAP technology, Parackal (2003) anticipated coverage
bias with more innovative and technological advanced individuals in the Internet
population. Parackal therefore used a mixed-mode or hybrid survey approach, in which all
sampled units were contacted by means of a paper letter and given the choice to either use
the Internet or request a paper questionnaire. In market research, telephone and web
hybrids have become increasingly popular (Oosterveld and Willems 2003) as the
development of special multi-mode CATI/CAWI software also indicates. (CAWI or
Computer-assisted Web Interview is strictly speaking a tautology. But it is an “official”
abbreviation used in software development analogous to the use of CAPI and CATI.)
(A critical overview is given by Macer 2003).
Most literature on mixed-mode applications refers to the reduction of nonresponse error.
Response rates have been declining over the years, in official statistics (De Leeuw and de
Heer 2002), as well as in academic research (Hox and De Leeuw 1994) and in market
research (Balden 2004; see also Stoop 2005). To achieve higher response rates, while
keeping the overall costs low, mixed-mode strategies are used, starting with the less costly
method first. A prime example is the American Community Survey, which is a mail survey
with follow-up telephone interviews for nonrespondents, followed by face-to-face
interviews for a subsample of the remaining nonrespondents (see Alexander and Wetrogan
2000). Another example of a large mail survey with an interview follow-up is the National
Mortality Followback Survey of the U.S. National Center of Health Statistics (Poe,
Seeman, McLaughlin, Mehl, and Dietz 1990). Telephone follow-ups appear to be effective
in raising response and may even reduce nonresponse bias in mail surveys (cf. Fowler,
Gallagher, Stringfellow, Zalavsky, Thompson, and Cleary 2002). To reduce selective
nonresponse, Beebe, Davern, McAlpine, Call, and Rockwood (2005) even went a step
further. To include ethnic groups, their mail survey, which was in English only, had an
explicit statement on the cover in several languages, urging respondents interested in
completing a telephone survey to contact the survey center where bilingual interviewers
were available. Incentives, together with mail and telephone follow-ups, were employed to
raise response rates.
One of the most consistent findings in mode comparisons is that self-administered forms
of data collection perform better than interview-modes when sensitive questions are asked
(for an overview, see De Leeuw 1992). Therefore, mixed-mode approaches using a paper
self-administered form to elicit sensitive information in a face-to-face interview have been
standard good practice for a long time (cf. Turner, Lessler, and Gfoerer, 1992).
Methodological studies comparing data quality in computer-assisted forms of data
collection also found that the more private computer-assisted self-administered forms led
Journal of Official Statistics236
to more accurate reporting of socially undesirable attributes (e.g., Tourangeau and Smith
1996; Tourangeau, Rasinski, Jobe, Smith, and Pratt 1997). Therefore the U.S. National
Survey on Drug Use and Health (NSDUH) now uses computer-assisted self-interviewing
(CASI), where respondents answer most questions privately by directly entering the
answers in the computer, and only a few nonthreatening questions are asked by an
interviewer (NSDUH 2005).
2.2. Types of mixed-mode designs
There are many forms of mixed-mode designs and many ways of summarizing them.
Dillman (2000, p. 219) and Dillman and Tarnai (1988) focus on the data collection and its
objectives, and Groves et al. (2004, p. 163) use the same approach. Balden (2004) uses
timing of interacting with respondents (i.e., contact phase, response phase, and follow-up
phase) as organizing principle. These overviews can be integrated and expanded by
including both actual data collection mixtures and mixtures of means of communication.
It is important to realize that survey researchers communicate with sample members at
different points in time and that they may use different modes of communication to do so.
Prime examples are prenotifications, screening procedures and reminders. This goes
beyond the mere data collection itself, and it is better to use the term mixed- or multi-mode
system (cf. Biemer and Lyberg 2003, p. 208). A very good example of a mixed-mode
system is the Nielsen media research methodology (see Bennett and Trussell 2001;
Trussell and Lavrakas 2004). This mixed-mode system uses an RDD-selected sample of
households to which addresses are matched. The mixed-mode system consists of seven
steps: first a prerecruitment postcard is mailed to all homes for which addresses are
available; this is followed by a recruitment phone call; the third contact attempt is again by
mail and is an advance postcard announcing the diary; next the diary survey package is
mailed to all homes for which an address is now available (regardless of the result of the
recruitment call). This diary survey package includes a cover letter, diaries, a cash
incentive, a return envelope, and a brochure. A reminder postcard in Step 5, a reminder
phone call in Step 6, and again a reminder postcard in Step 7 follow the survey package.
Although the actual data collection is unimode (diaries), the data collection system is
multi-mode with mail and telephone advance notifications and reminders.
In Figure 1 I give a systematic representation of different types of mixed-mode systems,
the reasons to employ them and the potential effects on survey quality. This overview is
ordered according to phase.
2.2.1. Precontact and multiple modes
In the precontact phase, mixed-mode systems are used for prenotification and recruitment.
The Nielsen example above is a good illustration. A classical example is the use of paper
advance letters in telephone surveys. This mix is chosen because it is easier to establish
legitimacy and trust through an official letter that has a letterhead, contact information
and a signature, than through a mere voice over the phone. That advance letters
indeed reduce nonresponse in telephone surveys is shown by De Leeuw, Hox, Korendijk,
Lensvelt-Mulders, and Callegaro (2004), who used meta-analysis to review a large
number of prenotification experiments. In establishment surveys the opposite mix – a
de Leeuw: To Mix or Not to Mix Data Collection Modes in Surveys 237
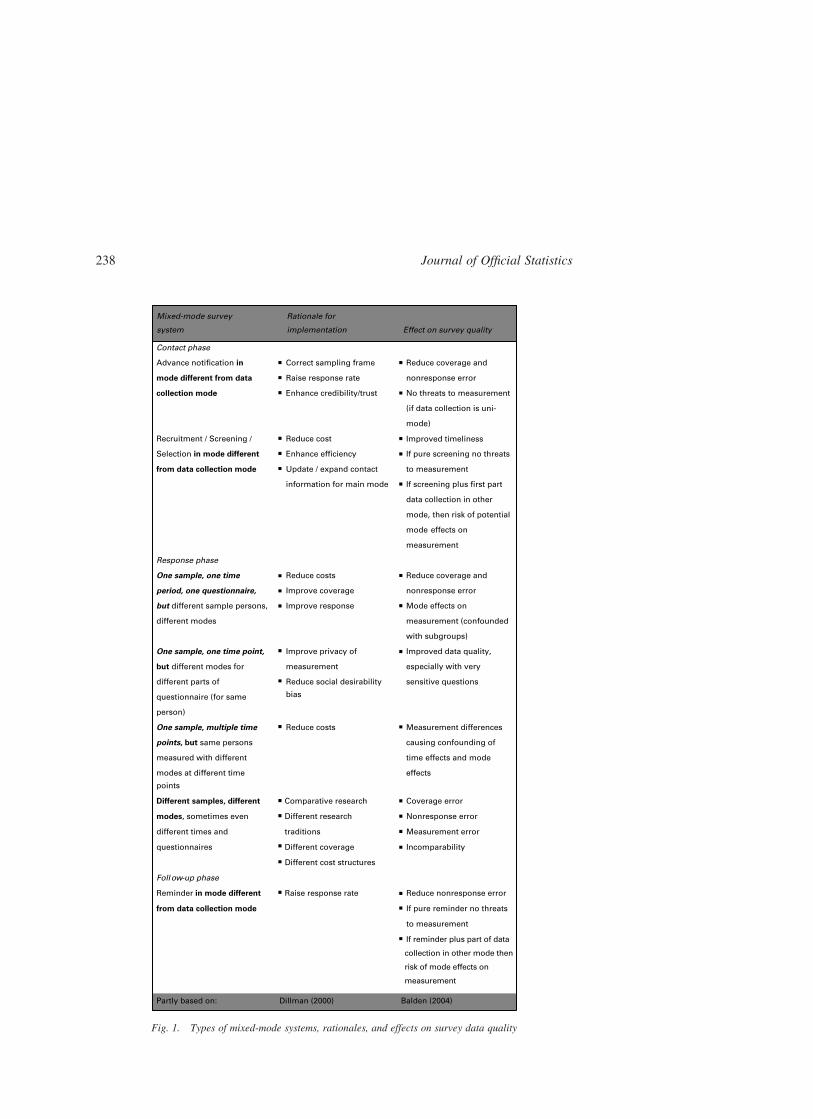
Fig. 1. Types of mixed-mode systems, rationales, and effects on survey data quality
Journal of Official Statistics238
telephone precontact before a mail or web survey – has been found to be effective (cf.
Paxson, Dillman, and Tarnai 1995). Business surveys face different methodological issues
than household surveys, and a telephone conversation is far more efficient than a letter in
getting past gate-keepers and in identifying the targeted most knowledgeable respondent
in the establishment (Dillman 2000, Chapter 10). Another mix is a telephone invitation to
participate in an IVR (Interactive Voice Survey) (see also Dillman 2000; Dillman, Phelps,
Tortora, Swift, Kohrell, and Berck 2005). As the actual data collection in these cases is
unimode, the mixed-mode system has no implication for measurement error at all, but will
reduce nonresponse error: a win–win situation.
A different situation occurs when an advance notification is used to invite sample
members to complete a questionnaire and where it is left to the respondent to choose a
mode. There can be, for instance, a paper mail advance letter with an invitation to
complete a web survey, but also offering the opportunity to ask for a paper questionnaire
(cf. Lozar Manfreda, Vehovar, and Batagelj 2001). This is a form of concurrent multiple
modes: both modes are being implemented at the same time (Balden 2004). A good
example is the American Lung Association survey of asthma awareness among school
nurses. In this survey postcards are sent to a random sample inviting nurses to participate
online via an indicated web site or by telephone via a toll-free 800 number. A procedure
like this is often used to reduce coverage error (see 2.1.), but as the data collection itself
now is multi-mode other errors come into the picture. First of all, self-selection may cause
differences in socio-demographic variables; secondly, the mode itself may cause
measurement differences. The researcher has to decide which scenario is the best:
multiple-mode with reduced coverage error at the price of increased measurement error or
a uni-mode approach with a larger coverage error component. In web surveys, where the
risk of coverage error is still high, researchers usually opt for the multi-mode approach and
take the risk of mode effects on measurements. Since self-selection and mode effects are
completely confounded in such designs, it is difficult to correct for mode effects.
The above reasoning can also be applied to screening and selection. For reasons of time
efficiency and costs, screening and selection is often done over the telephone. If the
telephone conversation is only used for screening and recruitment purposes and
the subsequent data collection is done in only one mode (unimodal) that is different from
the screening mode, then again there is a win–win situation of increased efficiency
without added mode effects in the main measurement phase. Sometimes a screening
procedure is used to get additional address information to facilitate the main study. Again,
if the data collection in the main study is unimodal, like in the Nielsen diary study
mentioned above, there is a win–win situation. But with the increased interest in web
surveys, the subsequent main study is often multi-mode: a web survey for those with
Internet access and a telephone survey for the remainder. Both modes are implemented at
the same time, so a concurrent multiple-mode system is used. Often the screening and/or
recruitment are parts of a longer interview. If a respondent is eligible, an interview takes
place and ends with a request for participation in upcoming surveys. This is quite common
not only in longitudinal studies, but also in recruitment for Internet panels and “access”
panels. In those cases more often than not different modes are used for the subsequent data
collection periods: a form of sequential multi-mode. Here the risk of mode effects on
measurement is great, as it is hard to decide whether a change over time is a real change for
de Leeuw: To Mix or Not to Mix Data Collection Modes in Surveys 239
the person surveyed or if it is caused by a change in mode. Time effects and mode effects
in the results are fully confounded!
2.2.2. Main data collection phase and multiple modes
During the response phase both concurrent and sequential multi-mode systems can be
used. There are several situations in which they can be employed.
One sample, one time period, one questionnaire
The first situation indicated in Figure 1 is where one mode of data collection is used for
some respondents of a sample and another mode for others in the same sample in order to
collect the same data. An example of a concurrent mixed-mode design for this situation is
a paper mail survey with a web option. Another example is the asthma awareness survey
among school nurses, mentioned above, which offers a choice of web or telephone. The
aim is to reduce coverage bias and still complete the survey at reasonable costs. It is also
assumed that giving a sample member a choice may reduce nonresponse, as some persons
may express certain mode preferences (cf. Groves and Kahn 1979; De Leeuw 1992).
However, there is no firm empirical evidence for this. Dillman, Clark, and West (1995) did
not detect any improvement in response rates when respondents were given a choice
between sending in a mail questionnaire and phoning in their answers. A similar
conclusion was reached by Lozar Manfreda et al. (2001), who offered a choice of web or
paper mail to respondents. Balden (2004) also reports that in his experience providing
respondents in market research with choices does not in general improve the overall
response rates; this includes the choice combinations mail/web, mail/IVR, and phone/web.
An exception is a study of the Defense Manpower Data Center (DMDC) in the U.S.A. that
found that a paper mail survey with a web option resulted in a much higher response rate
(60%) than a paper survey only (20%). However, their results were mixed, as a web survey
with a paper mail option resulted in the same response rate (20%) as the paper only survey
(Quigley 2005, personal communication). Still, giving respondents a choice may be a good
strategy, as it may create goodwill and reduce costs. In establishment surveys it is more
common than in household surveys to allow respondents to choose a data collection
method (i.e., paper, fax, Disk by Mail, web, Electronic Data Interchange or EDI; cf.
Nicholls, Mesenbourg, Andrews, and De Leeuw 2000; Rosen and O’Connell 1997).
Far more common and effective are sequential multi-mode systems to reduce survey
nonresponse. Usually an inexpensive mode is used as the main mode for the whole sample
and then a more expensive mode is used for the nonresponse follow-up to improve
response rates (Japec 1995). This approach originates from the empirical work of
Hochstim (1967), who compared three strategies of mixed-mode data collection: one
starting with the expensive face-to-face interview, one starting with the less expensive
telephone survey, and one starting with the modest mail survey. In two independent
studies, Hochstim found that the three mixed-mode strategies were highly comparable
regarding final response rate and completeness of questionnaires, and that substantive
findings were virtually interchangeable. The only important difference was costs per
interview, which varied considerably by strategy. These findings were corroborated by
Siemiatycky (1979), who concluded that strategies beginning with mail and telephone and
Journal of Official Statistics240
followed-up with other methods, provided response rates as high as face-to-face, for half
of the costs. In recent years various studies have used sequential mixed-mode strategies
and showed that switching to a second, and even third, mode is an effective means of
improving response rates, even for newer data collection methods such as IVR and the
Internet (Dillman, Phelps, Tortora, Swift, Kohrell, and Berck 2005). Sequential mixed-
mode surveys will increase response both for the general population (Brambilla and
McKinlay 1987; Fowler et al. 2002; Jackson and Boyle 1991), for different racial and
ethnic groupings (Beebe et al. 2005), for special groups like mothers with medicaid-
eligible children of different ethnic/racial background (Grembowski and Phillips 2005)
and for professionals, such as scientists (Wilkinson and Hines 1991), pediatricians
(McMahon, Iwamoto, Massoudi, Yusuf, Stevenson, David, Chu, and Pickering 2003) and
veterinarians (Wilkins, Hueston, Crawford, Steele, and Gerken 1997). There is also
evidence that a sequential mixed-mode raises the response rates in establishment surveys
(e.g., Jackson 1992; Werking and Clayton 1993).
Sequential mixed- or multi-mode data collection methods are effective in reducing
nonresponse, but a coin has two sides and there is a potential for measurement error as the
modes used may cause measurement differences. Hochstim (1967) in his early study
reported that substantive findings were virtually interchangeable, and this study had much
influence in the acceptance of mixed-mode strategies. Later studies emphasized the
difference between visual communication and aural or auditory communication and its
influence on measurement (cf. Balden 2004; Dillman 2000; Dillman and Christian 2003;
De Leeuw 1992; Schwarz, Strack, Hippler, and Bishop 1991). This will be discussed more
in depth in Section 3 below.
One sample, one time point, but different modes for different parts of the questionnaire
A second form of a mixed-mode is when different modes are used for a subset of questions
in the questionnaire during a single data collection period. Usually a mix of interview and
self-administered forms is used to exploit the strong points of both methods. For instance,
within an interview a self-administered form of data collection such as CASI or Audio-
CASI is used for sensitive questions to reduce social desirability and enhance privacy as
neither the interviewer nor any other person in the vicinity will know the answers given.
This situation is basically positive and is not a case for concern.
One sample, multiple time points
The third form is a longitudinal study or a panel in which the same respondents are
surveyed at different time points, and different modes are used at those different time
points. Here practical considerations and costs are the main reasons to use this multiple
mode approach. One issue might be the availability of a good sampling frame with contact
information. Sometimes addresses are available but telephone numbers or e-mail
addresses are not and have to be collected first; sometimes no frame is available and area
probability sampling is the only option. This means that an initial contact should be made
using a face-to-face method. Together with the greater flexibility of an interviewer to gain
cooperation at the doorstep and the opportunities for optimal screening, a face-to-face
interview is often the preferred choice for the base-line study of a panel. When possible
de Leeuw: To Mix or Not to Mix Data Collection Modes in Surveys 241

a less expensive method is used after the first wave to reduce costs. A combination of face-
to-face interviews for the first wave and telephone surveys for the second is used for labor
force surveys in several countries. Another example of a mixed-mode panel combines an
initial face-to-face interview with mail surveys in subsequent waves. Sometimes modes
can even be switched back and forth. For instance, after an initial face-to-face survey,
telephone and mail surveys are employed with an occasional face-to-face survey
interspaced at crucial points. Also, in longitudinal health surveys and in growth studies of
infants it may be necessary to include simple medical tests at regular times, which need a
face-to-face contact. Internet panels, which are now becoming fashionable, are often
formed after an initial telephone survey. As outlined above in 2.2.1, in sequential mixed-
mode studies time and mode effects are confounded, and it is difficult to decide if a change
over time is real or the result of a change of mode.
Different samples, different modes
The fourth and last variant of multiple mode data collection uses different modes for
different populations or subgroups. Typical fields of study using this approach include
international and regional comparions. The reasons for using this approach can vary.
Different countries may have different survey traditions and/or different practical
constraints. In a densely populated country face-to-face surveys are feasible, but in
sparsely populated areas that may not be the case. Some countries have detailed registers
and address information to ensure successful mail surveys, while in other countries area
probability based samples are the only option. Low literacy levels can preclude mail
surveys, and in poor regions electronic equipment may be difficult to use. Furthermore,
different data collection agencies may have different survey traditions and therefore may
differ in availability of experienced and trained staff needed for specific modes and other
required resources. To enhance comparability other design factors should be kept constant
as far as possible. For example, the International Social Survey Programme (ISSP)
operates on the principle of “keep as much the same as possible” across implementations.
At the start of the ISSP the required mode was self-completion, but as new members joined
in, the self-completion format proved unsuitable for populations with low literacy and
face-to-face interviews were allowed (Skjak and Harkness 2003). Also, in the European
Social Survey great care was taken to ensure equivalent sampling procedures and
questionnaires, and initially it opted for face-to-face interviews, but in the end a mixed-
mode design was used in which some countries used telephone surveys. An example from
the U.S.A. is the Behavioral Risk Factor Surveillance System (BRFSS) of the Centers for
Disease Control and Prevention (CDC) in which 15 states participate in monthly data
collections. A standard core questionnaire was developed by CDC for the states to provide
data that could be compared across states. Data collection varies by state, which results in
a uni-mode approach within one state but a mixed-mode design for the total study.
Mode effects may cause differences between countries; still a uni-mode approach is
often not feasible in international research. One may even argue that keeping modes the
same across countries is enhancing the differences between countries, as a mode that is
optimal for one country may be a very poor choice for another country. For instance,
selective nonresponse caused by large noncontact rates in secluded rural regions, may
enhance small or nonexistent differences between countries. In planning cross-cultural and
Journal of Official Statistics242
international studies there should be careful consideration of the relative risk of mode
effects in a mixed-mode approach as compared to differential effects of other error sources
in a uni-mode approach.
In secondary analysis different countries or cultures are regularly compared on a variety
of variables. Different populations are compared, using data that were collected for other
purposes. Different data collection methods may be used, but other and more serious errors
may play a role too, and pose serious threats to the internal validity of the conclusions. For
instance, the studies that are combined may suffer from differential nonresponse, non-
equivalence of questionnaires, and time differences in data collection. Here the issue is not
mixed-mode, but nonequivalence of design. A problem is that the primary data sources
used in secondary research often do not allow reporting of such differences in sufficient
detail (Hox and Boeije 2005).
2.2.3. Follow-up phase and multiple modes
An efficient tool to increase response rates is reminders (e.g., Heberlein and Baumgartner
1978), and as a consequence they are commonly used. Sometimes reminders employ the
same mode of contact, for instance a postcard in a mail survey, an e-mail in an Internet
survey, or a telephone reminder in a telephone survey. Sometimes a different mode of
contact is used for the follow-up contact. For instance, costs and time constraints may
prohibit in-person follow-ups in a face-to-face survey. A second, different mode for the
follow-up may also lead to additional information about the sampling frame or improved
contact information, (e.g., a telephone reminder to an Internet or mail survey) and
changing modes may improve the attention or novelty value of the reminder.
Persuasion letters (Groves and Couper 1998, p. 292) are another form of a mixed-mode
follow-up contact. Reluctant respondents in face-to-face and telephone surveys are sent a
special persuasion letter, emphasizing the importance of complete measurement for the
survey. Persuasion letters should be tailored to subgroups of refusers if possible, and in
general communicate the legitimacy and importance of the study to the reluctant
respondent.
If the mode change only involves the follow-up reminder, potential measurement errors
due to mode effects are avoided, while the potential benefits of a second mode of
communication can be exploited: a win–win situation, just as when using prenotifications.
However, when the follow-up is also used to collect additional data, a potential mode
effect may occur. If the full questionnaire is administered in another mode to reduce
nonresponse, it is a sequential mixed-mode approach (see 2.2.2.). A special case is when a
shortened questionnaire is used to reduce response burden when collecting data on
nonrespondents. These data may shed some light on selectiveness of nonresponse and can
be used for weighting and adjustment. In this case the researcher should again decide
which source of error is the most important, and whether it is mode effects or nonresponse
that is the worst of two evils.
3. Mode Effects and Data Quality
In evaluating mixed-mode systems it is important to ascertain whether only the contact
strategies should be mixed-mode and the data collection itself unimodal, or if multiple
de Leeuw: To Mix or Not to Mix Data Collection Modes in Surveys 243
modes should be used for the actual data collection. Only in the latter case does the risk of
mode effects on measurement error threaten the internal validity of the survey. Empirical
data are necessary to judge how serious this threat is relative to other sources of error. In
this section an overview will be given of known mode effects and their causes.
3.1. What to expect
In the literature on mode effects several factors are identified that differentiate between
modes and may be the origin of response differences. These factors can be grouped in
three main classes: media-related factors, factors influencing the information transmission,
and interviewer effects (De Leeuw 1992). Media-related factors are concerned with the
social conventions and customs associated with the media utilized in survey methods, such
as familiarity with a medium, use of medium, and locus of control – that is, who has the
most control over the question-answer process. For instance, traditional rules of behavior
dictate that the initiator of a conversation controls the communication. Hence, in an
interview, the interviewer controls the pace and flow of the interview, while in a mail or
Internet survey the respondent is in control and determines when and where the questions
are being answered and at what pace. The Internet is the most dynamic of the media,
allowing for multitasking and quickly skipping from one topic to the next. Users can be
impatient, have more than one screen open, and terminate whenever they want (cf. Alvey
2004). This in turn may lead to more superficial cognitive processing, more top of the head
answers, and more satisficing in responding to survey questions. Media-related factors,
like interviewer effects, are socio-cultural factors, but they do influence cognitive
processing factors as described above.
The way information is transmitted determines the cognitive stimulus people receive
and this differs across modes of data collection. The first mode difference is whether the
information is presented visually or auditive (aurally), or both (Schwarz et al. 1991). When
information is presented only aurally this demands more memory capacity of the
respondent and may lead to recency effects in long lists (i.e., the last response category is
chosen more often than earlier response categories on the list). A second mode difference
influencing the quality of data is the availability of communication channels: verbal
communication (words, text), nonverbal communication (e.g., gestures, expressions, body
posture), and paralinguistic communication (e.g., tone, timing, emphasis). The effective
use of these channels facilitates the communication with the respondent and improves the
total question-answer process. Again, modes differ in availability of communication
channels as they differ in media-related factors and interviewer effects. It is important to
realize that these factors are interrelated: in a face-to-face situation an interviewer can use
more channels of communication than in a telephone situation, as information
transmission and interviewer effects are related. In mail and Internet surveys, visual
appearance, graphical features and layout give additional meaning to the text and may
influence responses (Redline and Dillman 2002; Dillman and Christian 2003), just as
paralinguistic communication (e.g., tone of voice, emphasis) gives additional meaning to
spoken words. Also, the factors’ locus of control and interviewer effects are correlated and
differ across modes, thereby influencing the perceived privacy and confidentiality. Thus,
the more control respondents have of the data collection, of their feelings of privacy and
Journal of Official Statistics244

their willingness to disclose sensitive information increases and social desirability
decreases. On the other hand, greater control on the part of the respondent, reduces the
chances that they can be persuaded to answer and fewer opportunities to motivate them or
give additional information and explanation (De Leeuw 1992; Skjak and Harkness 2003).
3.2. Empirical mode comparisons
The influence of data collection method on data quality has been extensively studied
for face-to-face interviews, telephone surveys, and self-administered mail questionnaires.
De Leeuw (1992) performed a meta-analysis of 67 articles and papers reporting mode
comparisons. The resulting overview showed clear but usually small differences between
methods, suggesting a dichotomy between interviewer survey modes and other modes.
Comparing mail surveys with both telephone and face-to-face interviews, De Leeuw found
that it is indeed somewhat harder to get people to answer questions in mail surveys. Both
the overall nonresponse rates and the item nonresponse rates are higher in self-
administered questionnaires than in interviews. However, when questions are answered,
the resulting data tend to be of better quality. Especially with more sensitive questions,
mail surveys performed better, with, in general, less social desirability bias in responses,
more reporting of sensitive behavior like drinking, and less item nonresponse on income
questions. When face-to-face and telephone surveys were compared, small differences in
data quality were discovered. Face-to-face interviews resulted in data with slightly less
item nonresponse. No differences were found concerning response validity (record
checks) and social desirability bias. In general, similar conclusions can be drawn from
well-conducted face-to-face and telephone interview surveys (De Leeuw 1992; De Leeuw
and Van der Zouwen 1988).
In a carefully designed experiment, De Leeuw (1992) investigated additional aspects of
data quality, such as consistency and reliability of answers, response tendencies, and
responses to open questions. Again, the main differences were between the mail survey on
the one hand and the two interview surveys on the other. The self-administered
questionnaire, where the respondents have most control and can read the questions and
answer at their leisure, resulted in more reliable and consistent responses and less
acquiescence than in interviews. However, the differences are relatively minor. Regarding
responses to open questions, the results were mixed. When short open questions are asked
on well-defined topics, the differences are small. With more complex questions, the
assistance and probing of an interviewer is necessary to get more detailed answers.
A limited number of studies have investigated specific response effects, such as recency
and primacy effects, acquiescence, and extremeness. Although some studies found more
acquiescence and extremeness in telephone interviews than in face-to-face surveys
(Jordan, Marcus, and Reeder 1980; Groves 1979) and in mail surveys (Dillman and Mason
1984; Tarnai and Dillman 1992), the results are not strong and completely consistent (for
an overview, see De Leeuw 1992). Evidence for recency and primacy effects is mixed.
Bishop et al. (1988) found in two cross-cultural studies that question order and response
order effects are less likely to occur in a self-administered survey than in a telephone
survey, but question wording and question form effects were as likely. When questions are
delivered aurally, respondents seem more likely to choose the last response option heard
de Leeuw: To Mix or Not to Mix Data Collection Modes in Surveys 245
i.e., the recency effect. When questions are presented visually respondents tend to choose
the response category presented at the beginning i.e., the primacy effect (Schwarz,
Hippler, Deutsch, and Strack 1985). But in a large number of experiments and using a
variety of question structures, Dillman, Brown, Carlson, Carpenter, Lorenz, Mason,
Saltiel, and Sangster (1995) found inconsistent evidence for primacy effects in mail and
recency effects in telephone surveys. These inconsistent findings could be due to
interaction effects; for instance mail surveys will in general produce less socially desirable
answers, while in telephone surveys recency effects occur and the last option is favored.
When the last response option of a question is also the less socially desirable answer, the
two mechanisms will counteract each other, resulting in no large overall differences
between the methods.
The Internet is a relatively new medium for surveys, and as a result systematic mode
comparisons are still scarce. There is some indication that Internet surveys are more like
mail than like telephone surveys, with more extreme answers in telephone surveys than in
Internet surveys (Dillman, Phelps, Tortora, Swift, Kohrell, and Berck 2005; Oosterveld
and Willems 2003). More extremeness in telephone interviews was earlier found in
comparisons with paper mail surveys and is attributed to visual versus auditive
information transmission (De Leeuw 1992; Schwarz et al. 1991); the same mechanism
may be responsible for differences between telephone and Internet surveys. Comparisons
between web and mail surveys give mixed results. Some studies find more partial response
and more item nonresponse in web surveys (Lozar Manfreda, Vehovar, and Batagelj 2001;
Bates 2001), other studies report less item nonresponse in web surveys than in mail
surveys (McMahon et al. 2003; Beullens 2003). Regarding substantive responses no clear
picture emerges; Oosterveld and Willems (2003) found little or no differences between
CATI and Internet in a well-controlled experiment. Beullens (2003) reported some
differences, but when he controlled for differences in background characteristics due to
self-selection, the differences between mail and web became negligible. However, Link
and Mockdad (2005 a,b) did find differences in alcohol reporting and other health-related
estimates between web and mail surveys, and Backstrom and Nilsen (2004) reported
differences in substantive answers between paper and web questionnaires in a student
evaluation survey. To fully understand if and how Internet differs from other modes,
controlled mode comparisons with Internet are needed in different situations using a
variety of topics to enhance the generalizability of findings. This should preferably be
followed by a systematic overview of mode effects or a meta-analysis.
3.3. In sum
When comparable surveys with equivalent questionnaires were investigated none of the
data collection modes was superior on all criteria. The most pronounced differences were
found with more sensitive topics. The interviewer modes produced more socially desirable
answers and less consistent answers, but also more detailed responses to open questions.
Differences between face-to-face and telephone interviews were small, with the face-to-
face interview doing slightly better than the telephone. It should be noted that the reviewed
comparative studies were carefully designed to be equivalent across modes and that
question formats and sampling procedures were carefully designed to be comparable.
Journal of Official Statistics246
However, in mixed-mode designs this equivalence may not be so carefully guarded,
and the structure of questions may be inadvertently changed during a mode change.
For instance, an unfolding procedure may be used in the telephone mode, while the full
seven-point agree–disagree scale is being offered in amail or Internet version. The resulting
question wording effects will add to the measurement error and amplify mode differences.
When using a mixed-mode approach, questions should be carefully constructed to provide
an equivalent stimulus across modes (Dillman and Christian 2003, see also Section 4).
4. Implications
There are several types of mixed-mode survey systems, as described in Section 2.2. and
summarized in Figure 1. Sequential mixed-mode contacts with a uni-mode data collection
do not pose any problems from a data integrity point of view. When different modes are
only used for precontact, screening, and reminders and not for the data collection itself,
mixing modes has only advantages. The main data collection is being done in one mode
with its known characteristics and data quality implications and the (pre)contacts and
follow-ups can be used to the advantage: a win–win situation. However, when multiple
modes are being used for the data collection itself, either sequential or concurrent, the
situation is more problematic. In mixed-mode data collection questions of data integrity
play a role, such as: can data that are collected with different modes be combined and can
data be compared across surveys or time points? There is only one situation in which a
concurrent multiple mode has well-documented positive effects on data quality. This is the
case in which a second, more private mode is used for a subset of special questions to
ensure more self-disclosure and less social desirability bias. These expected mode
differences between self-administered and interviewer-administered surveys for sensitive
and attitudinal questions are precisely the reason researchers combine these two methods
in one survey. Here the combined effect ensures better data. Examples are a paper
questionnaire within a face-to-face interview, and (Audio-)CASI within CAPI. In all other
cases, be they sequential or concurrent, mixed-mode approaches for data collection can
have negative consequences for data quality.
Depending on the survey situation one has to decide the optimum design, carefully
appraising the different sources of error. Only after careful consideration can one decide if
the expected mode effects are serious enough to avoid mixed-mode designs or if the
advantages of mixing modes outweigh the risks. If one opts for multiple data collection
modes there are certain safeguards one can implement in the data collection procedure.
4.1. Designing for mixed-mode
The first step in mixed-mode design is to recognize from the start that mode effects are an
important design consideration, and that they shoud be reduced as much as possible. To do
so it is important to distinguish two completely different situations:
(1) There is one main data collection method plus additional auxiliary data collection
methods (e.g., a different method for nonresponse follow-up or a longitudinal survey
with only recruitment conducted by face-to-face, but the data collection in all waves
is by telephone), and
de Leeuw: To Mix or Not to Mix Data Collection Modes in Surveys 247
(2) There is a trulymultiple-mode design inwhich the differentmethods are equally important
(e.g., a web/ mail or web/telephone mix in which respondents are given a choice).
In the first case, a main mode should be chosen that can best accommodate the survey
situation. This main mode is used to its maximum potential; the other modes are used as
auxiliary or complementary modes only, are adapted to the main mode and may be
suboptimal and not used to their fullest potential (e.g., number of response categories in a
telephone survey with face-to face follow-up). This is the mixed-mode situation Biemer
and Lyberg (2003, pp. 208-210) describe. Dillman (2000, pp. 232-240) presents a number
of principles for unimode design that are helpful in minimizing mode differences between
main and auxiliary data collection modes. A good example is the study by Pierzchala,
Wright, Wilson, and Guerino (2004), who used a mail, web, and CATI mix in a survey of
college graduates. In the second case, there is not really a main versus an auxiliary mode,
rather all modes are equal. Here one should go beyond the unimode design and use a
generalized or universal mode design. In a unimode design one presents the same
questions in the same layout in both modes, with the risk of not using a mode to its fullest
potential. In a generalized mode design, one aims at presenting the same stimulus in each
mode, instead of the same question, and abandons the one-questionnaire-fits-all paradigm.
For example, a question in a telephone survey will not necessarily offer the same stimulus
to a respondent if it is asked in a web survey, since a visual mode may change the meaning
of the question and may therefore present a different stimulus to the respondent than an
aural mode (for examples of visual presentation and its influence on question meaning, see
Christian and Dillman 2004). Aiming at presenting the same stimulus in different modes is
equivalent to modern theories on questionnaire translation, in which not the literal
translation, but the translation of concepts is the key (cf. Harkness, Van de Vijver, and
Johnson 2003; Harkness 2003). This may lead to situations in which a German
questionnaire is translated into Austrian or Swiss German, and a British questionnaire is
tailored to American or Australian English. Dillman’s (2000) unimode design is a good
starting point, but much fundamental, empirical research is needed to estimate what
constitutes the same stimulus across different modes, and especially how new media and
new graphical tools will influence this.
4.2. Empirically based adjustment
The second step focuses on the collection of additional data on mode effects for use
in statistical adjustment. For instance, if in a longitudinal survey multiple modes are used
(e.g., first face-to-face interviews and then telephone interviews), it is hard to decide
whether a change over time is a real change for the person surveyed or if it is caused by the
change in mode. Time effects and mode effects in the results are fully confounded.
However, if at each time point a random subsample of respondents is investigated with the
initial mode of the previous wave, and the majority with the main mode of the wave (e.g., a
small subsample is interviewed face-to-face, while the intended mode is telephone
interviews) a strict mode comparison is feasible and will provide the researcher with
information about mode effects that can be used for statistical adjustment. In other words,
if a longitudinal study is planned to have follow-ups using telephone interviews (or mailed
Journal of Official Statistics248
questionnaires), but the first recruitment wave is a face-to-face interview, embed a mode
experiment in the first follow-up and use these data for adjustment.
If for practical reasons a random subsample is not possible, for instance in an
international study where some countries use mail/phone and other countries use face-to-
face interviews, limited experiments in each country may give valuable information. In
these experiments one concentrates on those who can be interviewed with both modes,
which of course is not necessarily a random sample of the whole country, but a more or
less selective group (e.g., those with telephone access). In this group persons are assigned
at random to a mode and a mode comparison is being performed. For instance, in a country
that is sparsely populated, a mode comparison is performed in an area where it is still
feasible to do both a face-to-face and a telephone interview. Or for those with Internet
access one might conduct a small embedded mode experiment (e.g., telephone vs web);
even if it is not a random subsample of the whole population it will provide information to
extrapolate and assess the risk of mode effects.
As mode effects are confounded with selection effects, that is answers between the two
modes may differ because of the mode or because of the fact that different subgroups
responded in different modes, it is difficult to adjust for mode effects. In comparative
research the situation is often worse, as one country may use one method and the other
country another. Still a limited experiment can be designed where comparable subsamples
in each of the countries (e.g., the urban population) are approached using the same method,
which allows at least some control of mode effects.
Finally, if experiments are not possible at all, matching is an option. For example, in a
concurrent mixed-mode survey, subjects are matched in both modes on important
variables, such as age and education, to see if the matched groups are much different.
Preferably, the variables on which matching takes place are measured independently of
mode (e.g., register, sampling frame), but even if this is not possible, basic demographic
questions are less mode sensitive than attitudinal questions, as respondents know the
answer before the question is even asked (Balden 2004). Of course, this approach is much
weaker than a fully embedded experiment with subsampling, or a limited experiment on a
special subgroup. Still it may provide some insight into potential mode effects, and some
empirical data are better than none.
5. Further Research/Research Agenda
U Mixed or multiple mode systems are not new, but new modes emerge and with
them new mixes. This means that we have to update our knowledge about the
influence of modes on data quality. We need comparative studies on new modes
and mode effects, and preferably an integration of findings through meta-analysis.
U Multiple mode contact strategies are employed to combat survey nonresponse. Still
we need more research on the optimal mixes, preferably including other indicators
besides response rate, such as bias reduction and costs.
U Hardly any theoretical or empirical knowledge is available on how to design
optimal questionnaires for mixed-mode data collection (e.g., unimode and
generalized mode design). Empirical research is needed to estimate what
de Leeuw: To Mix or Not to Mix Data Collection Modes in Surveys 249
constitutes the same stimulus across different modes, and especially how new
media and new graphical tools will influence this.
U Adjustment or calibration strategies for mode mixes are still in an early phase, and
more research is needed.
U In general, the implications of mixing modes, such as the relative importance and
seriousness of errors, are hardly a topic of discussion. Mixed-mode designs are an
important form of data collection, but the choice of a certain mix is often implicit.
This choice should be made explicit and be part of the methodological section in
each scientific article or report, just as a careful statement about (non)response is
now required in many scientific journals.
6. References
Alexander, C.H., Jr and Wetrogan, S. (2000). Integrating the American Community
Survey and the Intercensal Demographic Estimates Program. Proceedings of the
American Statistical Association at www.amstat.org/sections/srms/proceedings/
papers/2000_046.pdf (accessed April 25, 2005).
Alvey, W. (2004). Highlights from the Session on Web-based Data Collection. Federal
Committee on Statistical Methodology: statistical policy seminar session on web based
data collection, December, Washington: DC. To appear in the FCSM statistical policy
working papers series.
Balden, W. (2004). Multi-mode Data Collection: Benefits and Downsides. Paper presented
at the 2004 Conference of the Great Lakes, Chapter of the Marketing Research
Association, Cancun, Mexico. Power point file at http://glcmra.org/cancun accessed 15
April 2004(full paper upon request from the author).
Bates, N. (2001). Internet versus Mail as a Data Collection Methodology from a High
Coverage Population. Proceedings of the American Statistical Association, Section on
Survey Research Methods. August.
Beebe, T.J., Davern, M.E., McAlpine, D.D., Call, K.T., and Rockwood, T.H. (2005).
Increasing Response Rates in a Survey of Medicaid Enrollees: The Effect of a Prepaid
Monetary Incentive and Mixed-modes (Mail and Telephone). Medical Care, 43,
411–414.
Bennett, M. and Trussell, N. (2001). Return Postage Type as Cooperation Stimulant for a
Mail Mode Portion of a Multi-mode Survey. Paper presented at the 56th Annual
AAPOR Conference, Montreal, Canada.
Beullens, K. (2003). Evaluatie van een mixed-mode survey design [Evaluation of a mixed-
mode survey design]. Leuven: Katholiek Universiteit Leuven. [In Dutch].
Biemer, P.P. and Lyberg, L.E. (2003). Introduction to Survey Quality. New York: John
Wiley.
Bishop, G.F., Hippler, H.-J., Schwarz, N., and Strack, F. (1988). A Comparison
of Response Effects in Self-administered and Telephone Surveys. In R.M. Groves,
P.P. Biemer, L.E. Lyberg, J.T. Massey, W.L. Nicholls, II, and J. Waksberg (eds),
Telephone Survey Methodology, New York: John Wiley.
Journal of Official Statistics250
Brambilla, D.J. and McKinlay, S.M. (1987). A Comparison of Responses to Mailed
Questionnaires and Telephone Interviews in a Mixed-mode Health Survey. American
Journal of Epidemiology, 126, 962–971.
Backstrom, C. and Nilsson, C. (2005). Mixed Mode: Handling Method-Differences
Between Paper and Web Questionnaires. http://gathering.itm.mh.se/~cicbac, accessed
March 2.
Christian, L.M. and Dillman, D.A. (2004). The Influence of Graphical and Symbolic
Language Manipulations of Responses to Self-administered Questionnaires. Public
Opinion Quarterly, 68, 57–80.
Connett, W.E. (1998). Automated Management of Survey Data: An Overview. In M.P.
Couper, R.P. Baker, J. Bethlehem, C.Z.F. Clark, J. Martin, W.L. Nicholls, II, and J.M.
O’Reilly (eds), Computer-assisted Survey Information Collection, New York: John
Wiley.
Couper, M.P. (2000). Web Surveys: A Review of Issues and Approaches. Public Opinion
Quarterly, 64, 464–494.
Couper, M.P. and Nicholls, W.L. II (1998). The History and Development of Computer-
assisted Survey Information Collection Methods. In M.P. Couper, R.P. Baker,
J. Bethlehem, C.Z.F. Clark, J. Martin, W.L. Nicholls, II, and J.M. O’Reilly (eds),
Computer-assisted Survey Information Collection New York: John Wiley.
Czaja, R. and Blair, J. (1996). Designing Surveys: A Guide to Decisions and Procedures.
Thousand Oaks: Sage, Pine Forge Press. See also Czaja, R. and Blair, J. (2005)
Designing Surveys: A Guide to Decisions and Procedures (second edition). Thousand
Oaks: Sage, Pine Forge Press.
Dillman, D.A. (2000). Mail and Internet surveys: The Tailored DesignMethod. New York:
John Wiley.
Dillman, D.A., Brown, T.L., Carlson, J., Carpenter, E.H., Lorenz, F.O., Mason, R.,
Saltiel, J., and Sangster, R. (1995). Effects of Category Order on Answers to Mail and
Telephone Surveys. Rural Sociology, 60, 674–687.
Dillman, D.A., Clark, J.R., and West, K.K. (1995). Influence of an Invitation to Answer by
Telephone on Response to Census Questionnaires. Public Opinion Quarterly, 51,
201–219.
Dillman, D.A. and Christian, L.M. (2003). Survey Mode as a Source of Instability in
Responses Across Surveys. Field Methods, 15(2), 1–22.
Dillman, D.A. and Mason, R.G. (1984). The Influence of Survey Method on Question
Response. Paper presented at the annual meeting of the American Association for
Public opinion Research, Wisconsin.
Dillman, D.A., Phelps, G., Tortora, R., Swift, K., Kohrell, J., and Berck, J. (2005).
Response Rate and Measurement Differences in Mixed-mode Surveys: Using Mail,
Telephone, Interactive Voice Response and the Internet. Draft paper at homepage of
Don Dillman (http://survey.sesrc.wsu.edu/dillman/) accessed April 14.
Dillman, D.A. and Tarnai, J. (1988). Administrative Issues in Mixed-mode Surveys.
In R.M. Groves, P.P. Biemer, L.E. Lyberg, J.T. Massey, W.L. Nicholls, II, and
J. Waksberg (eds), Telephone Survey Methodology, New York: John Wiley.
de Leeuw: To Mix or Not to Mix Data Collection Modes in Surveys 251
Fowler, F.J., Jr, Gallagher, P.M., Stringfellow, V.L., Zalavsky, A.M., Thompson, J.W.,
and Cleary, P.D. (2002). Using Telephone Interviews to Reduce Nonresponse Bias to
Mail Surveys of Health Plan Members. Medical Care, 40, 190–200.
Grembowski, D. and Phillips, D. (2005). Linking Mother and Child Access to Dental Care:
A Multimode Survey. A NIH-funded study (grant # DE 14400). SESRC data report no
05-023. Pullman, WA: Washington State University.
Groves, R.M. (1979). Actors and Questions in Telephone and Personal Interview Surveys.
Public Opinion Quarterly, 43, 190–205.
Groves, R.M. (1989). Survey Errors and Survey Costs. New York: John Wiley.
Groves, R.M. and Couper, M.P. (1998). Nonresponse in Household Interview Surveys.
New York: John Wiley.
Groves, R.M. and Kahn, R.L. (1979). Surveys by Telephone: A National Comparison with
Personal Interviews. New York: Academic Press.
Groves, R.M. and Lepkowski, J.M. (1985). Dual Frame, Mixed-mode Survey Designs.
Journal of Official Statistics, 1, 263–286. (www.jos.nu).
Groves, R.M., Fowler, F.J., Jr., Couper, M.P., Lepkowski, J.M., Singer, E., and
Tourangeau, R. (2004). Survey Methodology. New York: John Wiley.
Harkness, J. (2003). Questionnaire Translation. In J.A. Harkness, F.J.R. van de Vijver, and
P.Ph. Mohler (eds), Cross-cultural Survey Methods, New York: John Wiley.
Harkness, J., Van de Vijver, F.J.R., and Johnson, T.P. (2003). Questionnaire Design in
Comparative Research. In J.A. Harkness, F.J.R. van de Vijver, and P.Ph. Mohler, Cross-
cultural Survey Methods, New York: John Wiley.
de Heer, W., de Leeuw, E.D., and van der Zouwen, J. (1999). Methodological Issues in
Survey Research: A Historical Overview. Bulletin de Methodologie Sociologique, 64,
25–48.
Heberlein, T.A. and Baumgartner, R. (1978). Factors Affecting Response Rates to Mailed
Questionnaires: A Quantitative Analysis of the Published Literature. American
Sociological Review, 43, 447–462.
Hochstim, J.R. (1967). A Critical Comparison of Three Stategies of Collecting Data from
Households. Journal of the American Statistical Association. 62, 976–989.
Hox, J.J. and Boeije, H.R. (2005). Data Collection, Primary versus Secondary.
In K. Kempf-Leonard (ed.). Encyclopedia of Social Measurement. San Diego, CA:
Academic Press.
Hox, J.J. and de Leeuw, E.D. (1994). A Comparison of Nonresponse in Mail, Telephone,
and Face-to-face Surveys: Applying Multilevel Models to Meta-analysis. Quality and
Quantity, 28, 329–344.
Jackson, C.P. (1992). Implementing Multimodal Surveys for Business Establishments.
ICES Proceedings, American Statistical Association, Buffalo.
Jackson, C.P. and Boyle, J.M. (1991). Mail Response Rate Improvement in a Mixed-
mode Survey. Proceedings ASA-SMRS: American Statistical Association at
www.amstat.org/sections/srms/proceedings/ accessed 14 April 2005.
Japec, L. (1995). Issues in Mixed-mode Survey Design. Stockholm: Statistics Sweden,
March.
Jordan, L.A., Marcus, A.C., and Reeder, L.G. (1980). Response Styles in Telephone and
Household Interviewing: A Field Experiment. Public Opinion Quarterly, 44, 210–222.
Journal of Official Statistics252
de Leeuw, E.D. (1992). Data Quality in Mail, Telephone, and Face-to-face Surveys.
Amsterdam: TT-Publicaties.
de Leeuw, E., Hox, J., Korendijk, E., Lensvelt-Mulders, G., and Callegaro, M. (2004). The
Influence of Advance Letters on Response in Telephone Surveys: A Meta-analysis.
Paper presented at the15 International Workshop on Household Survey Nonresponse,
Maastricht, August.
de Leeuw, E.D. (2002). The Effect of Computer-assisted Interviewing on Data Quality:
A Review of the Evidence [CD-Rom]. In J. Blasius, J. Hox, E. de Leeuw, and P. Schmidt
(eds), Social Science Methodology in the New Millennium, Opladen, FRG: Leske þ
Budrich.
de Leeuw, E.D. and de Heer, W. (2002). Trends in Household Survey Nonresponse:
A Longitudinal and International Comparison. In R.M. Groves, D.A. Dillman,
J.L. Eltinge, and R.J.A. Little (eds), Survey Nonresponse, New York: John Wiley.
de Leeuw, E. and Collins, M. (1997). Data Collection Methods and Survey Quality: An
Overview. In L. Lyberg, P. Biemer, M. Collins, E. de Leeuw, C. Dippo, N. Schwarz, and
D. Trewin (eds) Survey Measurement and Process Quality. New York: John Wiley.
de Leeuw, E. and Van der Zouwen, J. (1988). Data Quality in Telephone and Face-to-face
Surveys: A Comparative Meta-analysis. In R. Groves, P. Biemer, L. Lyberg, J. Massey,
W. Nicholss, II,, and J. Waksberg (eds) Telephone Survey Methodology. New York:
John Wiley.
Link, M. and Mokdad, A. (2005a). Effects of Survey Mode on Self-reports of Adult
Alcohol Consumption: Comparison of Web, Mail and Telephone. Journal of Studies on
Alcohol (forthcoming).
Link, M. and Mokdad, A. (2005b). Use of Alternative Modes for Health Surveillance
Studies: Results of a Web/Mail/Telephone Experiment. Journal of Epidemiology
(forthcoming).
Lozar Manfreda, K., Vehovar, V. and Batagelj, Z. (2001). Web versus Mail Questionnaire
for an Institutional Survey. In A. Westlake et al., The Challenge of the Internet.
Association for Survey Computing.
Macer, T. (2003). We Seek Them Here, We Seek Them There. How Technological
Innovation in Mixed-mode Survey Software Is Responding to the Challenges of Finding
Elusive Respondents. In R. Banks et al., Survey and Statistical Computing IV. The
Impact of Technology on the Survey Process. Association for Survey Computing. See
also Tim Macer (2004) CAWI and CATI. Software Reviews. In Quirks Marketing
Review at www.meaning.uk.com.quirks/09.html (accessed April 15, 2005).
McMahon, S.R., Iwamoto, M., Massoudi, M.S., Yusuf, H.R., Stevenson, J.M., David, F.,
Chu, S.Y., and Pickering, L.K. (2003). Comparison of E-mail, Fax, and Postal Surveys
of Pediatricians. Pediatrics, 111, 299–303.
Nathan, G. (2001). Telesurvey Methodologies for Household Surveys–A Review and
Some Thoughts for the Future. Survey Methodology, 27, 7–31.
Nicholls, W.L. II, Mesenbourg, T.L. Jr., Andrews, S.H. and De Leeuw, E. (2000). Use of
New Data Collection Methods in Establishment Surveys. In J. Kovar et al., Proceedings
of the Second International Conference on Establishment Surveys, American Statistical
Association, Buffalo.
de Leeuw: To Mix or Not to Mix Data Collection Modes in Surveys 253
NSDUH-homepage at https://nsduhweb.rti.org/ Section Frequently Asked Questions.
Accessed 28 April 2005.
Oosterveld, P. and Willems, P. (2003). Two Modalities, One Answer? Combining Internet
and CATI Surveys Effectively in Market Research. D.S. Fellows, Technovate,
Amsterdam: ESOMAR.
Parackal, M. (2003). Internet-based and Mail Survey: A Hybrid Probabilistic Survey
Approach. Proceedings of the 2003 Australian Web Conference at http://ausweb.scu.
edu.au/aw03/papers/parackal.html (accessed April 15, 2004).
Paxson, M.C., Dillman, D.A., and Tarnai, J. (1995). Improving Response to Business Mail
Surveys. In B.G. Cox, D.A. Binder, B.N. Chinappa, A. Christianson, M.J. Colledge, and
P.S. Kott (eds), Business Survey Methods, New York: John Wiley.
Pierzchala, M., Wright, D., Wilson, C., and Guerino, P. (2004). Instrument Design for a
Blaise Multi-mode Web, CATI, and Paper Survey. At http://www.blaiseusers.org/
IBUCPDFS/2004/24.pdf (accessed 20 May 2005).
Poe, G.S., Seeman, I., McLaughlin, J.K., Mehl, E.S., and Dietz, M.S. (1990). Certified
versus First-class Mail in a Mixed-mode Survey of Next-of-kin Respondents. Journal of
Official Statistics, 6, 157–164, (www.jos.nu).
Redline, C. and Dillman, D.A. (2002). The Influence of Alternative Visual Designs on
Respondent’s Performance with Branching Instructions in Self-administered Ques-
tionnaires. In Survey Nonresponse, Groves, R., Dillman, D.A., Eltinge, J., and Little, R.
(eds), New York:Wiley.
Rosen, R.J. and O’Connell, D. (1997). Developing an Integrated System for Mixed-mode
Data Collection in a Large Monthly Establishment Survey. Proceedings of the American
Statistical Association at www.amstat.org/sections/srms/proceedings/papers/1997
(accessed April 14, 2005).
Saris, W.E. (1998). Ten Years of Interviewing Without Interviewers: The Telepanel.
In M.P. Couper, R.P. Baker, J. Bethlehem, C.Z.F. Clark, J. Martin, W.L. Nicholls, II,
and J.M. O’Reilly (eds), Computer-assisted Survey Information Collection, New York:
John Wiley.
Schwarz, N., Strack, F., Hippler, H.J., and Bishop, G. (1991). The Impact of
Administrative Mode on Response Effects in Survey Measurement. Applied Cognitive
Psychology, 5, 193–212.
Schwarz, N., Hippler, H.J., Deutsch, B., and Strack, F. (1985). Response Categories:
Effect on Behavioural Reports and Comparative Judgements. Public Opinion Quarterly,
49, 388–395.
Siemiatycki, J. (1979). A Comparison of Mail, Telephone, and Home Interview Strategies
for Household Health Surveys. American Journal of Public Health, 69, 238–245.
Skjak, K.K. and Harkness, J. (2003). Data CollectionMethods. In J.A. Harkness, F.J.R. van
de Vijver, and P.Ph. Mohler (eds), Cross-cultural Survey Methods, New York: John
Wiley.
Stoop, I.A.L. (2005). The Hunt for the Last Respondent. The Hague: Social and Cultural
Planning Office (SCP).
Tarnai, J. and Dillman, D.A. (1992). Questionnaire Context as a Source of Response
Differences in Mail versus Telephone Surveys. In N. Schwarz and S. Sudman (eds),
Context Effects in Social and Psychological Research, New York: Springer Verlag.
Journal of Official Statistics254
Tourangeau, R., Rasinski, K., Jobe, J., Smith, T., and Pratt, W. (1997). Sources of Error in a
Survey of Sexual Behavior. Journal of Official Statistics, 13, 341–365, (www.jos.nu).
Tourangeau, R. and Smith, T. (1996). Asking Sensitive Questions: The Impact of Data
Collection, Question Format, and Question Context. Public Opinion Quarterly, 60,
275–304.
Trussell, N. and Lavrakas, P.J. (2004). The Influence of Incremental Increases in Token
Cash Incentives on Mail Survey Response: Is There an Optimal Amount? Public
Opinion Quarterly, 68, 349–367.
Turner, C., Lessler, J., and Gfoerer, J. (1992). Survey Measurement of Drug Use:
Methodological Studies. Washington, DC: National Institute on Drug Abuse.
Ujiie, Y. Personal Communication, 15 April 2005 (e-mail).
Werking, G. and Clayton, R. (1993). Automated Telephone Collection Techniques for
Improving Timeliness and Data Quality. Washington DC: U.S. Bureau of Labor
Statistics.
Wilkins, J.R., Hueston, W.D., Crawford, J.M., Steele, L.L., and Gerken, D.F. (1997).
Mixed-mode Survey of Female Veterinarians Yields High Response Rate. Occupational
Medicine, 47, 458–462.
Wilkinson, R.K. and Hines, C.J. (1991). Data Collection Methods in the STPDS Surveys:
Improving Response Rates in Mixed-mode Surveys. Available at http://srsstats.sbe.nsf.
gov/research/3-91.pdf (accessed 15 April 2005).
Wilson, P., Blackshaw, N., and Norris, P. (1988). An Evaluation of Telephone
Interviewing on the British Labour Force Survey. Journal of Official Statistics, 4,
385–400, (www.jos.nu).
Quigley, B.M., (2005). Personal Communication, 19 April (e-mail þ short attachment
titled “What Prior Experience does DMDC have with Web-administered Surveys?”
Received May 2005
Revised July 2005
de Leeuw: To Mix or Not to Mix Data Collection Modes in Surveys 255