tmss, investment strategy & mrp policy 2018-2019...tmss, investment strategy & mrp policy...
TRANSCRIPT

TMSS, Investment Strategy & MRP policy 2018-2019
Page 1
Treasury Management Strategy Statement & Investment Strategy
Minimum Revenue Provision Policy
2019-2020
“Allerdale – a great place to live, work and visit”

TMSS, Investment Strategy & MRP policy 2019-2020
Page 2
THIS PAGE IS INTENTIONALLY LEFT BLANK

TMSS, Investment Strategy & MRP policy 2019-2020
Page 3
Contents
1. Introduction ........................................................................................................ 4
1.1 Background .................................................................................................. 4
1.2 Reporting requirements ................................................................................ 4
2. Treasury Management Strategy Statement (TMSS) ........................................ 6
2.1 Current treasury position .............................................................................. 6
2.2 Treasury Indicators: limits on borrowing & investing activity ........................ 7
2.3 Prospects for interest rates .......................................................................... 7
2.4 Borrowing strategy ..................................................................................... 12
2.5 Policy on borrowing in advance of need ..................................................... 13
2.6 Debt rescheduling ...................................................................................... 14
2.7 Policy on the use of derivatives ................................................................. 14
2.8 Training ...................................................................................................... 15
2.9 Treasury management consultants ........................................................... 15
3. Annual Investment Strategy ............................................................................ 16
3.1 Investment policy - objectives ..................................................................... 16
3.2 Creditworthiness policy (credit risk management) ....................................... 16
3.3 Approved investment counterparties .......................................................... 17
3.4 Approved instruments ................................................................................. 18
3.5 Limits on principal sums invested................................................................ 20
3.6 Limits on investment maturities ................................................................... 20
3.7 Reporting arrangements ........................................................................... 21
4. Minimum revenue provision (MRP) policy statement ................................... 21
5. Prudential & treasury Indicators 2019-20 to 2021-22 .................................... 25
5.1 Indicators required by the Prudential Code ................................................ 25
5.2 Indicators required by the Treasury Management Code ............................. 31
6. Appendices ....................................................................................................... 33
A. Interest Rate Forecasts 2019 - 2022 ............................................................ 34
B. Economic Background ................................................................................. 35
C. Short & Long term credit ratings .................................................................. 40

TMSS, Investment Strategy & MRP policy 2019-2020
Page 4
1. Introduction
1.1 Background
1.1.1 For public sector organisations, the Chartered Institute of Public Finance and Accountancy (CIPFA) defines treasury management as “the management of the organisation’s borrowing, investments and cash flows, its banking, money market and capital market transactions; the effective control of the risks associated with those activities; and the pursuit of optimum performance consistent with those risks”.
1.1.2 This definition expects a ‘best value’ approach in which authorities should seek to minimise the cost of borrowing (or maximise the returns from investment), subject to the over-riding management of risks, with risk limitation being more important than return (yield).
1.1.3 The statutory framework for treasury management and capital finance within local authorities is laid out in a series of legislations, statutory guidance and codes of practice, the key elements of which are:
The Local Government Act 2003 - (‘the 2003 Act’)
The Local Authorities (Capital Finance and Accounting)(England) Regulations 2003 (as amended) - (‘the 2003 Regulations’)
Ministry of Housing, Communities & Local Government (MHCLG) Guidance on Local Government Investments - third edition (February 2018)
MHCLG guidance on Minimum Revenue Provision - fourth edition (February 2018)
The Prudential Code for Capital Finance in Local Authorities - 2017 Edition - (‘the Prudential Code’)
The Treasury Management in the Public Services: Code of Practice and Cross-Sectoral Guidance Notes 2017 Edition - (‘the Treasury Management Code’).
1.1.4 Consistent with the definition of treasury management set out in paragraph 1.1.1 above, the Treasury Management and Investment strategies contained in this document are focused on borrowing and investments in financial instruments held for treasury management purposes (i.e. investments made to support effective treasury management activity). Investments in financial and non-financial assets (for example investment property, loans supporting service outcomes and investments in subsidiaries and joint ventures) made for policy reasons, rather than for treasury management purposes, are dealt with in the Council’s Capital Strategy.
1.2 Reporting requirements
1.2.1 Provisions contained in the Local Government Act 2003, statutory guidance and regulations issued by the Ministry of Housing, Communities & Local Government and Codes of Practice issued by CIPFA in relation to treasury

TMSS, Investment Strategy & MRP policy 2019-2020
Page 5
management and capital finance, require local authorities to prepare and approve, before the start of each financial year:
a Treasury Management Strategy Statement (TMSS) and Investment Strategy setting out its proposed treasury management activities for the year and policies for the prudent management of its investments
a statement of its policy on making Minimum Revenue Provision (MRP) indicating how, in the forthcoming financial year, the duty to make prudent MRP will be discharged
a set of prescribed prudential and treasury indicators for the forthcoming and following years - including the Council’s Authorised Borrowing Limit - demonstrating that its capital expenditure plans are affordable and that external borrowing is within prudent and sustainable levels.
1.2.2 The Treasury Management Code also requires authorities to ensure the Full Council receives:
a mid-year report providing:
- an update on the economic environment and interest rate forecasts underlying the adopted strategies
- details of variations (if any) from agreed policies/practices contained in the approved Treasury Management and Investment Strategies
- details of investing and borrowing activities undertaken
- confirmation of compliance with treasury and prudential indicators
after the year-end, an annual report on the performance of the treasury management function, on the risk implications of decisions taken and the transactions executed in the past year, and on any circumstances of non-compliance with the Council’s treasury management policy statement.
1.2.3 This document, prepared in accordance with the statutory framework and codes of practice referred to above, sets out the Council’s:
Treasury Management Strategy Statement (TMSS) and Investment Strategy for 2019-20
Minimum revenue provision (MRP) policy statement for 2019-20
Prudential and treasury indicators for the three year period 2019-20 to 2021-22.
1.2.4 The TMSS and Investment Strategy, MRP policy and the prudential and treasury indicators, must be approved by Full Council prior to the commencement of the financial year to which they relate.
1.2.5 To enable the Audit Committee to fulfil its responsibilities for ensuring effective scrutiny of treasury management strategy and policies, the Council’s Treasury Management Practices (TMPs) require treasury management

TMSS, Investment Strategy & MRP policy 2019-2020
Page 6
reports, including this report, to be submitted to the Audit Committee prior to their consideration by Full Council.
2. Treasury Management Strategy Statement
2.1 Current treasury position
2.1.1 The Council’s treasury portfolio position at 31 December 2018 is summarised in table 1. Table 1 also shows a comparison of the Council’s actual external debt (borrowing) postion with its underlying capital borrowing need (the Capital Financing Requirement - CFR), highlighting any over or under borrowing.
Table 1: Investment and borrowing
At 31 Dec 2018
£000
At 31 Mar 2018
£000
At 31 Dec 2017
£000
At 31 Mar 2017
£000
Investments
Specified Investments:
Term, call & notice accounts 4,168 1,618 1,527 2,419
Money Market Funds 15,350 5,515 11,545 5,655
Non-specified investments:
Equities 11 11 11 11
Total investments 19,529 7,144 13,083 8,085
Borrowing
PWLB 15,193 15,380 13,465 13,607
Other borrowing 85 85 85 85
Other long-term liabilities 0 0 0 0
Total (gross) debt 15,278 15,465 13,550 13,692
Capital Financing Requirement 18,964 18,917 18,245 18,674
(Under)/Over borrowing (3,686) (3,452) (4,695) (4,982)
2.1.2 At 31 December 2018 the Council’s PWLB loan portfolio consisted of fixed rate:
maturity loans totalling £8.0m (31 March 2018: £8m)
annuity loans of £1.633m (31 March 2018: £1.70m)
EIP loans of £5.560m (31 March 2018: £5.68m).
2.1.3 Interest rates applying to individual loans within the Council’s PWLB loan portfolio range from 2.44% to 9.5%. At 31 December 2018 the weighted average rate of interest payable on the Council’s PWLB loan portfolio stood at 5.43%.
2.1.4 At 31 December 2018, the weighted average life of the Council’s PWLB loan portfolio was approximately 25. The weighted average time to maturity of these loans was 29 years.

TMSS, Investment Strategy & MRP policy 2019-2020
Page 7
2.2 Treasury Indicators: limits on borrowing and lending activity
2.2.1 The Local Government Act 2003 requires a local authority to create and keep under review, limits on how much money it can afford to borrow by way of loans and other forms of credit (for example finance leases). The processes authorities must follow in setting these limits (the ‘Authorised Limit for external debt’) are set out in the Prudential Code which authorities must ‘have regard to’. An authority is free to vary its affordable borrowing limit, subject to approval by Full Council, provided there is good reason for doing so. However breach of the Affordable Borrowing Limit is prohibited by the 2003 Act and any borrowing above the affordable borrowing limit is ultra-vires.
2.2.2 In addition to the Authorised Limit, the Prudential and Treasury Management Codes and accompanying sector guidance, include a number of other key treasury management indicators designed to ensure the Council operates its treasury activities within well-defined limits. These include:
setting an operational boundary for external debt based on the expectations of the most likely maximum external debt for the year and reflecting the authority’s plans for capital expenditure, estimated capital financing requirement (CFR) and cash flow requirements for the year for all purposes
ensuring that gross debt does not, except in the short term, exceed the total of the CFR in the preceding year plus the estimates of any additional CFR for current and the following two financial years.
placing upper limits on the total of principal sums invested for over 365 days
placing upper and lower limits on the maturity structure of its borrowing.
2.2.3 Details of the Council’s prudential and treasury indicators are set out in section 5 of this report.
2.3 Prospects for interest rates
2.3.1 The Council has appointed Link Asset Services (formerly operating as Capita Asset Services) as its treasury advisor. Part of their service is to assist the Council to formulate a view on interest rates. Link Asset Services undertook its latest review of interest rate forecasts in November 2018. These latest forecasts take into account the Bank of England quarterly Inflation Report for November 2018 and the decisions and forward guidance issued by the Bank’s Monetary Policy Committee at its meeting on 1 November 2018.

TMSS, Investment Strategy & MRP policy 2019-2020
Page 8
Table 2: Forecast interest rates 2018-2022
Quarter ending
Bank rate
PWLB 5yr rate
PWLB 10yr rate
PWLB 25yr rate
PWLB 50yr rate
% % % % %
Actual [6.2.19] 0.75 1.68 2.04 2.55 2.39
Mar-19 0.75 2.10 2.50 2.90 2.70
Jun-19 1.00 2.20 2.60 3.00 2.80
Sep-19 1.00 2.20 2.60 3.10 2.90
Dec-19 1.00 2.30 2.70 3.10 2.90
Mar-20 1.25 2.30 2.80 3.20 3.00
Jun-20 1.25 2.40 2.90 3.30 3.10
Sep-20 1.25 2.50 2.90 3.30 3.10
Dec-20 1.50 2.50 3.00 3.40 3.20
Mar-21 1.50 2.60 3.00 3.40 3.20
Jun-21 1.75 2.60 3.10 3.50 3.30
Sep-21 1.75 2.70 3.10 3.50 3.30
Dec-21 1.75 2.80 3.20 3.60 3.40
Mar-22 2.00 2.80 3.20 3.60 3.40
1Certainty rates are calculated by subtracting 0.2% from the standard new loan rates. Certainty rates apply to authorities who provided DCLG with required information on their plans for long-term borrowing and associated capital spending.
2.3.2 The forecasts for the Bank Rate include a total of five 25bp increases over the forecast period, starting in quarter 2 (March to June) of 2019. Borrowing rates shown are based on the PWLB Certainty Rate (standard new loan rate minus 20 basis points) which has been accessible to most authorities since 2012. The expectation is for PWLB borrowing rates to increase gradually over the forecast period.
2.3.3 Following the flow of generally positive economic statistics since the end of the quarter ended 30 June, the Monetary Policy Committee (MPC) took the decision on 2 August to make the first increase in the Bank Rate above 0.5% since the financial crash, to 0.75%.
2.3.4 Since the meeting in August growth has been healthy, but slowed significantly during the last quarter of 2018. At their November Quarterly Inflation Report meeting, the MPC left the Bank Rate unchanged, but expressed some concern at the Chancellor’s fiscal stimulus in his Budget, which could increase inflationary pressures. However, it is unlikely that the MPC would increase the Bank Rate in February 2019, ahead of the deadline in March for Brexit. On the major assumption that Parliament and the EU agree a Brexit deal in the first quarter of 2019, then the next increase in the Bank Rate is forecast to be in May 2019, followed by increases in February and November 2020, before ending up at 2.0% in February 2022.
2.3.5 The forecasts set out in the preceding table are predicated on an assumption of an agreement being reached on Brexit between the UK and the EU. On this basis, while GDP growth is likely to be subdued in 2019 due to all the uncertainties around Brexit depressing consumer and business confidence,

TMSS, Investment Strategy & MRP policy 2019-2020
Page 9
an agreement is likely to lead to a boost to the rate of growth in 2020 which could, in turn, increase inflationary pressures in the economy and so cause the Bank of England to resume a series of gentle increases in the Bank Rate. Just how fast, and how far, those increases will occur and rise to, will be data dependent. The forecasts in this report assume a modest recovery in the rate and timing of stronger growth and in the corresponding response by the Bank in raising rates.
2.3.6 In the event of an orderly non-agreement exit, it is likely that the Bank of England would take action to cut the Bank Rate from 0.75% in order to help economic growth deal with the adverse effects of this situation. This is also likely to cause short to medium term gilt yields to fall. If there was a disorderly Brexit, then any cut in Bank Rate would be likely to last for a longer period and also depress short and medium gilt yields correspondingly. It is also possible that the government could act to protect economic growth by implementing fiscal stimulus. However, there would appear to be a majority consensus in the Commons against any form of non-agreement exit so the chance of this occurring has now substantially diminished.
2.3.7 At the present time, the overall balance of risks to economic recovery in the UK is probably neutral. The balance of risks to increases in the Bank Rate and shorter term PWLB rates are also probably evenly balanced and are broadly dependent on how strong GDP growth turns out, how slowly inflation pressures subside, and how quickly the Brexit negotiations move forward positively. However, economic forecasting remains difficult with so many external influences weighing on the UK. The interest rate forecasts set out in table 1 (and also MPC decisions) will therefore be liable to further amendment depending on how economic data and developments in financial markets transpire over the next year. Geopolitical developments, especially in the EU, could also have a major impact.
2.3.8 In line with the base rate forecasts, investment returns are likely to remain low during 2019-20 but to be on a gently rising trend over the next few years. As a consequence there will remain a cost of carry to any new long-term borrowing that causes a temporary increase in cash balances as this position will, most likely, incur a revenue cost reflecting the difference between borrowing costs and investment returns.
2.3.9 During the current financial year (2018-19), borrowing interest rates have been volatile with little consistent trend in rates. While they were on a rising trend during the first half of the year, they have back tracked since then until early January.
2.3.10 Geo-political events, sovereign debt issues and emerging market developments can all contribute to short-term volatility in financial markets. This could occur at any time during the forecast period. However, the overall longer run trend is for gilt yields, and therefore PWLB rates, to rise at a modest pace over the forecast period.
2.3.11 The last 25 years or so has borne witness to a period of falling bond yields as inflation subsided to, and then stabilised at, much lower levels than before.

TMSS, Investment Strategy & MRP policy 2019-2020
Page 10
The action of central banks since the financial crash of 2008, in implementing substantial Quantitative Easing (QE) purchases of government and other debt, added further impetus to this downward trend in bond yields and rising bond prices. Quantitative easing also caused a rise in equity values as investors searched for higher returns and purchased riskier assets.
2.3.12 2016 saw the start of a reversal of this trend with a sharp rise in bond yields after the US Presidential election in November 2016, with yields then rising further as a result of the big increase in the US government deficit aimed at stimulating even stronger economic growth. That policy change also created concerns around a significant rise in inflationary pressures in an economy which was already running at remarkably low levels of unemployment.
2.3.13 The US Federal Reserve has continued on its series of robust responses to combat its perception of rising inflationary pressures by repeatedly increasing the Federal Reserve Rate to reach 2.25% to 2.50% in December 2018. It has also continued its policy of not fully reinvesting proceeds from bonds that it holds as a result of quantitative easing, when they mature. This has resulted in US 10 year bond Treasury yields rising above 3.2% during October 2018. It has also contributed and also seen a sharp fall in equity prices as investors sold out of holding riskier assets.
2.3.14 However, by early January 2019, US 10 year bond yields had fallen back considerably on fears the Federal Reserve was being too aggressive in raising interest rates and was going to cause a recession. Equity prices have been very volatile on alternating good and bad news during this period.
2.3.15 In addition to the above uncertainties, downside risks to current forecasts for UK gilt yields and PWLB (certainty) rates currently include:
significant economic disruption and a major downturn in the rate of growth as a result of Brexit
the pace of Bank of England monetary policy action over the next three years (to raise the Bank Rate) causing weaker UK economic growth and increases in inflation than currently anticipated
a resurgence of the Eurozone sovereign debt crisis, possibly Italy, due to its high level of government debt, low rate of economic growth and vulnerable banking system. In addition, March saw the election of a government which has made a lot of anti-austerity noise and that has already lead to friction with the EU when setting the target for the fiscal deficit in the national budget. The EU rejected the initial proposed Italian budget and demanded cuts in government spending which the Italian government initially refused. However, a fudge was subsequently agreed but only by delaying the planned increases in expenditure to a later year. This has therefore only been kicked down the road to a later time. The rating agencies have started on downgrading Italian debt to one notch above junk level. If Italian debt were to fall below investment grade, many investors would be unable to hold it. Unsurprisingly, investors are becoming increasingly concerned by the words and actions of the Italian government and consequently, Italian bond yields have risen at a time when the

TMSS, Investment Strategy & MRP policy 2019-2020
Page 11
government faces having to refinance large amounts of debt maturing in 2019.
Austria, the Czech Republic and Hungary forming a strongly anti-immigration bloc within the EU while Italy, this year, has also elected a strongly anti-immigration government. Elections to the EU parliament are due in May/June 2019.
Fallout from the German general election of September 2017 which left Angela Merkel’s CDU party in a vulnerable minority position as a result of the rise of the anti-immigration AfD party. Then in October 2018, the results of the Bavarian and Hesse state elections radically undermined the SPD party and showed a sharp fall in support for the CDU. As a result, the SPD is reviewing whether it can continue to support a coalition that is so damaging to its electoral popularity. After the result of the Hesse state election, Angela Merkel announced that she would not stand for re-election as CDU party leader at her party’s convention in December 2018, (a new party leader has now been elected). Although this makes little practical difference, as she is still expected to aim to continue for now as the Chancellor, there are five more state elections coming up in 2019 and EU parliamentary elections in May/June. These could result in a further loss of electoral support for both the CDU and SPD which could also undermine her leadership.
the vulnerability of other minority Eurozone governments including Spain, Portugal, Ireland, the Netherlands and Belgium, all of which have vulnerable minority governments dependent on coalitions which could prove fragile. Sweden is also struggling to form a government due to the anti-immigration party holding the balance of power, and which no other party is willing to form a coalition with. The Belgian coalition collapsed in December 2018 but a minority caretaker government has been appointed until the May EU wide general elections.
weak capitalisation of some European banks. Italian banks are particularly vulnerable; one factor is that they hold a high level of Italian government debt; debt which is falling in value. This is therefore undermining their capital ratios and raises the question of whether they will need to raise fresh capital to bridge the gap.
rising interest rates in the US sparking a sudden flight of investment funds from more risky assets e.g. shares, into bonds yielding a much improved yield. Emerging countries which have borrowed heavily in dollar denominated debt, could be particularly exposed to this risk of an investor flight to safe havens e.g. UK gilts.
concerns around the level of US corporate debt which has swollen massively during the period of low borrowing rates in order to finance mergers and acquisitions. This has resulted in the debt of many large corporations being downgraded to a BBB credit rating, close to junk status. Indeed, 48% of total investment grade corporate debt is now rated at BBB. If such corporations fail to generate profits and cash flow to reduce their debt levels as expected, this could tip their debt into

TMSS, Investment Strategy & MRP policy 2019-2020
Page 12
junk ratings which will increase their cost of financing and further negatively impact profits and cash flow.
geopolitical risks in Asia (especially North Korea), Europe and the Middle East, leading to increased safe haven flows.
2.3.16 The potential for upside risks to current forecasts for UK gilt yields and PWLB rates, especially for longer term PWLB rates include:
agreement by both the UK and EU to a compromise that removed all threats of economic and political disruption as a consequence of Brexit
the pace and strength of increases in the Bank Rate is too slow allowing inflationary pressures to build up too strongly within the UK economy, which then necessitates a later rapid series of increases in the Bank Rate faster than currently expected.
UK inflation, whether domestically generated or imported, returning to sustained significantly higher levels, causing an increase in the inflation premium inherent to gilt yields.
the pace and strength of increases in the Federal Funds Rate and reversal of Quantitative Easing, causing a fundamental reassessment by investors of the relative risks of holding bonds, as opposed to equities, leading to a major flight from bonds to equities and a sharp increase in bond yields in the US, which could then spillover into impacting bond yields around the world.
2.3.17 A more detailed commentary on the economic background underpinning current interest rate forecasts is included in Appendix B.
2.4 Borrowing strategy
2.4.1 The Council is currently maintaining an under-borrowed position (see table 1). This means that the capital borrowing need (the Capital Financing Requirement - CFR) has not been fully funded with loan debt. By utilising cash supporting the Council’s reserves and favourable in-year cash flow, the Council has been able to avoid the need to borrow up to the level of the CFR.
2.4.2 This has allowed the Council to minimise borrowing costs and reduce treasury risk by reducing its external investment balances. This strategy is prudent as investment returns are low and counterparty risk is still an issue that needs to be considered. The Council will continue with this policy during 2019-20 to the extent permitted by its liquidity requirements and the effective management of its interest rate exposures.
2.4.3 Against this background and the risks within the economic forecast, caution will be adopted with the 2019-20 treasury operations. Treasury staff will monitor interest rates in financial markets and adopt a pragmatic approach to changing circumstances:
if it was felt that there was a significant risk of a sharp fall in long and short-term rates (e.g. due to a marked increase of risks around relapse into recession or of risks of deflation), then long-term borrowing will be

TMSS, Investment Strategy & MRP policy 2019-2020
Page 13
postponed, and potential rescheduling from fixed rate funding into short term borrowing will be considered.
if it was felt that there was a significant risk of a much sharper rise in long and short-term rates than that currently forecast, (e.g. due an acceleration in the rate of increase in central rates in the USA and UK, a greater than expected increase in global economic activity or a sudden increase in inflation risks), then the portfolio position will be re-appraised with the likely action being that fixed rate funding will be drawn whilst interest rates are still lower than they will be in the next few years.
2.4.4 Any decisions taken in this regard will be reported to members at the next available opportunity.
2.4.5 The Council manages interest rate exposures through the prudent use of its approved instruments, methods and techniques, primarily to create stability and certainty of costs and revenues, but at the same time retaining a sufficient degree of flexibility to take advantage of unexpected, potentially advantageous changes in the level or structure of interest rates.
2.4.6 Interest rate cash flow risk (the risk that fluctuations in the levels of interest rates create an unexpected or unbudgeted burden on the organisation’s finances) associated with the Council’s long term borrowing, will be managed principally by borrowing at fixed rates.
2.5 Policy on borrowing in advance of need
2.5.1 The Local Government Act 2003 allows local authorities to borrow or invest for ‘‘any purpose relevant to its functions, under any enactment’’, or “for the purpose of the prudent management of its financial affairs”. This allows the temporary investment of funds borrowed for the purposes of expenditure in the near future.
2.5.2 The Council will not borrow more than, or in advance of its needs purely in order to profit from the investment of the extra sums borrowed. Any decision to borrow in advance will be within forward approved Capital Financing Requirement estimates and will be considered carefully to ensure that value for money can be demonstrated and that the Council can ensure the security of such funds.
2.5.3 Risks associated with any borrowing in advance activity will be subject to prior appraisal and subsequent reporting through the mid-year or annual reporting mechanism.

TMSS, Investment Strategy & MRP policy 2019-2020
Page 14
2.6 Debt rescheduling
2.6.1 Debt rescheduling includes the premature repayment of loans and the replacement of existing loans with new loans on different terms (repayment method, loan period, interest rate). The reasons for rescheduling include:
aligning long-term cash flow projections and debt levels in order to redistribute the burden of debt financing costs between years of account
generating savings in risk adjusted interest costs
rebalancing the interest rate structure of the debt portfolio to reduce exposures to interest rate risk
changing the size and/or maturity profile of the debt portfolio to reduce refinancing risk exposures and/or align the debt maturity profile with the underlying need to borrow for capital purposes (the capital financing requirement).
2.6.2 As short-term borrowing rates will be considerably cheaper than longer term fixed interest rates, there may be potential opportunities to generate savings by switching from long-term debt to short-term debt. However, these savings will need to be considered in the light of the current treasury position and the size of the cost of debt repayment (premiums incurred).
2.6.3 Consideration will also be given to identifying if there is any residual potential for making savings by running down investment balances to repay debt prematurely as short-term rates on investments are likely to be lower than rates paid on current debt.
2.6.4 The economic environment and consequent structure of interest rates has limited the rescheduling opportunities during recent years. Whilst this situation is likely to continue during 2019-20, the Council will continue to monitor interest rate structures for opportunities to reschedule debt in order to generate savings and/or rebalance risks within the loan portfolio. All rescheduling will be reported to the Audit Committee and Full Council at the earliest meeting following its action.
2.7 Policy on the use of derivatives
2.7.1 The Council will only use derivatives for the management of risk and for the prudent management of its financial affairs. Transactions involving standalone derivative products such as forward rate agreements, interest rate swaps and options (interest rate caps, floors and collars) require authorisation by the Head of Financial Services and will only be entered into:
after seeking proper advice to ensure the product is fully understood, including how underlying risks are affected and the additional risks that may result from its use (for example credit exposure to derivative counterparties)
after seeking confirmation that the Council has legal power to enter into the transaction

TMSS, Investment Strategy & MRP policy 2019-2020
Page 15
where use of the product can be shown to reduce the overall level of financial risks the Council is exposed to (after taking into consideration additional risks that may result from use of the derivative instrument)
after ensuring treasury staff have received training to ensure competent use of the product.
2.7.2 Financial derivative transactions may be arranged with any organisation that meets the approved investment criteria outlined in section 3 below. The current value of any amount due from a derivative counterparty will count against the counterparty limits set out in paragraph 3.5.1.
2.8 Training
2.8.1 CIPFA’s Treasury Management Code of Practice and Cross-Sectoral Guidance Notes require the responsible officer (the Head of Financial Services) to ensure that:
all staff involved in the treasury management function (including statutory officers) are fully equipped to undertake the duties and responsibilities allocated to them
members tasked with treasury management responsibilities, including those responsible for scrutiny, have access to training relevant to their needs and responsibilities.
2.8.2 In complying with these requirements the Council regularly reviews the training needs of officers and members and will arrange training, as required, to ensure that officers and members have the requisite skills and knowledge.
2.9 Treasury management advisors
2.9.1 The Council currently uses Link Asset Services as its external treasury management advisors. They provide a range of services to the Council including:
technical support on treasury matters and capital finance issues
economic and interest rate analysis
debt services including advice on the timing of borrowing
debt rescheduling advice
generic investment advice on interest rates, timing and investment instruments
credit ratings and creditworthiness information.
2.9.2 The Council recognises that responsibility for treasury management decisions remains with the organisation at all times and will ensure that undue reliance is not placed upon our external service providers. It also recognises that there is value in employing external providers of treasury management services in order to acquire access to specialist skills and resources. The Council will ensure that
TMSS, Investment Strategy & MRP policy 2019-2020
Page 16
the terms of their appointment and the methods by which their value is assessed are properly agreed and documented, and subjected to regular review.
2.9.3 Link Asset Services were re-appointed in 2017 for an initial period of three years (2017-18 to 2019-20) following a competitive tendering exercise. The Council retains the option to extend this contract for a further year.
3. Annual Investment Strategy
3.1 Investment policy - objectives
3.1.1 The Council’s investment policy deals with investments in financial instruments held for treasury management purposes and is set with regard to the requirments of
MHCLG’s Guidance on Local Government Investments (‘MHCLG Investment Guidance’) (third edition), and
CIPFA’s Treasury Management in the Public Services: Code of Practice and Cross-Sectoral Guidance Notes 2017 Edition (‘the Treasury Management Code’).
3.1.2 Accordingly, the Council’s primary policy objectives in relation to its treasury investment activity are to ensure:
first, the security of principal sums invested (i.e. to protect the capital sum invested from loss)
second, that appropriate levels of liquidity are maintained – (i.e. ensuring funds invested are available to meet expenditure when needed).
3.1.3 The Council will aim to achieve the optimum return on its investments (yield) commensurate with the proper levels of security and liquidity. However, yield will only determine investment decisions when deciding between two or more investments satisfying security and liquidity objectives.
3.2 Creditworthiness policy (credit risk management)
3.2.1 Ensuring the security of principal sums invested is achieved through active management of the Council’s credit risk exposures. This includes placing restrictions and limits on:
the counterparties with whom investments may be placed based on the creditworthiness of the counterparty (section 3.3)
the types of investment instruments that may be used (section 3.4)
the amount invested with any single institution or group of institutions on the Council’s list of approved counterparties (section 3.5)
the duration of individual investment instruments depending on the financial standing (creditworthiness) of the counterparty (section 3.6).
TMSS, Investment Strategy & MRP policy 2019-2020
Page 17
3.3 Approved investment counterparties
3.3.1 Counterparties with whom investments may be placed are restricted to financial institutions and other bodies of high credit quality. High credit quality financial institutions and other bodies are defined by the Council as those with a minimum long-term rating across all three of the main credit ratings agencies (Fitch, Moody’s and Standard & Poor’s) of A- or equivalent (AA+ or equivalent for non-UK sovereigns).
3.3.2 The minimum rating criteria applied by the Council uses the lowest common denominator method of selecting counterparties and applying limits. This means the Council’s minimum criteria will apply to the lowest available rating for any institution. For example, if an institution is rated by two agencies, one rating meets the Council’s criteria, the other does not, the institution will fall outside the lending criteria and will be excluded from the list of approved counterparties.
3.3.3 Whilst credit ratings remain a key source of information, they are not the sole determinant of the Council’s assessment of the credit quality of potential counterparties. Before making investment decisions reference will also be made to:
ratings outlooks (indicating the likely direction of an issuer's rating over the medium term)
credit watches and watchlists (indicating that downgrading or upgrading of the credit rating could be imminent)
sovereign ratings and support mechanisms
credit default swap (CDS) spreads (indicating perceived market sentiment regarding the credit risk associated with a particular institution and an early warning of potential creditworthiness problems which may only belatedly lead to actual changes in credit ratings).
3.3.4 This information is fully integrated into the creditworthiness methodology used by the Council’s treasury advisors, Link Asset Services, to produce its colour coded ratings assessment to indicate the relative creditworthiness of potential counterparties. Information provided by this ratings assessment is used by the Council to determine the maximum duration of individual investment instruments (see section 3.6).
3.3.5 Other information sources used to assess the suitability of potential investment counterparties include the financial press, share price and other information pertaining to the banking sector and the economic and political environments in which these institutions operate. Regardless of the credit rating assigned to an institution, if this additional information casts doubt over its financial standing then that institution will be removed immediately from the Council’s counterparty lending list.
3.3.6 Credit ratings and creditworthiness information is supplied to the Council by Link Asset Services and monitored weekly. The Council is also alerted by
TMSS, Investment Strategy & MRP policy 2019-2020
Page 18
email when there is an amendment by any of the agencies to the credit rating of an institution. If as a result of downgrade, a counterparty no longer meets the Council’s minimum credit ratings criteria, it will be removed immediately from the Council’s counterparty (dealing) list. Notification of rating changes, rating watches and rating outlooks is provided to officers almost immediately after they occur and this information is considered before dealing. For instance, a negative rating watch applying to a counterparty, currently at the minimum Council criteria, will result in the counterparty being suspended from use, with all others being reviewed in light of market conditions. Link Asset Services also provide the Council with information relating to movements in credit default swap spreads against the iTraxx benchmark and other market data on a weekly basis. Extreme market movements may result in downgrade of an institution or removal from the Council’s lending list.
UK banks - ring fencing
3.3.7 The largest UK banks, (those with more than £25bn of retail / Small and Medium-sized Enterprise (SME) deposits), are required, by UK law, to separate core retail banking services from their investment and international banking activities by 1 January 2019. This is known as “ring-fencing”. Whilst smaller banks with less than £25bn in deposits are exempt, they can choose to opt up. Several banks are very close to the threshold already and so may come into scope in the future regardless.
3.3.8 Ring-fencing is a regulatory initiative created in response to the global financial crisis. It mandates the separation of retail and SME deposits from investment banking, in order to improve the resilience and resolvability of banks by changing their structure. In general, simpler, activities offered from within a ring-fenced bank (RFB), will be focused on lower risk, day-to-day core transactions, whilst more complex and “riskier” activities are required to be housed in a separate entity, a non-ring-fenced bank (NRFB). This is intended to ensure that an entity’s core activities are not adversely affected by the acts or omissions of other members of its group.
3.3.9 While the structure of the banks included within this process may have changed, the fundamentals of credit assessment have not. The Council will continue to assess the new-formed entities in the same way that it does others and those with sufficiently high ratings, (and any other metrics considered), will be considered for investment purposes.
3.4 Approved instruments
3.4.1 The types of investment instruments that may be used by the Council - subject to the counterparty and maturity limits set out in sections 3.5 and 3.6 - are shown in table 3. Permitted instruments are categorised as either “Specified” or “Non-Specified” investments, as defined in MHCLGs Investment Guidance, to distinguish those (specified) investment instruments offering relatively high security and high liquidity from those with higher credit risk (non-specified investments). All investments will be in sterling.

TMSS, Investment Strategy & MRP policy 2019-2020
Page 19
Table 3: Permitted investment instruments - specified & non-specified
Investment Specified Non-
Specified
Term deposits, call and notice accounts with banks & building societies
Term deposits with UK local authorities
Certificates of deposit with banks & building societies
Gilts issued by the UK Debt Management Office (DMO)
Treasury Bills (T-bills) issued by the UK DMO
Bonds issued by Multilateral Development Banks
Local Authority Bills
Commercial Paper
Corporate Bonds
AAA rated Money Market Funds (with 60-day Weighted Average Maturity (WAM))[CNAV, VNAV, LVNAV]
Other Money Market & Collective Investment Schemes
Debt Management Account Deposit Facility
Equity investments
3.4.2 A specified (treasury management) investment - offering high security and high liquidity - is defined as an investment that is:
(a) denominated in sterling with any payments or repayments payable only in sterling
(b) not a long-term investment (i.e. the authority has a contractual right to repayment within 12 months of acquisition)
(c) not defined as capital expenditure under regulations (e.g. acquisition of share capital)
(d) made with a body or in an investment scheme of high credit quality (as defined by the Council in paragraph 3.3.1) or with the UK Government, a local authority or a parish council or community council.
3.4.3 Non-specified investments refer to any (treasury management) investments not meeting the definition of ‘specified investments’. The Council currently holds a limited quantity of non-specified investments (unquoted equity shares). These account for less than 1% of the Council’s investment portfolio. No additional non-specified (treasury) investments are planned during 2019-20 and all new investments made in 2019-20 will be subject to a maximum maturity of 365 days.
TMSS, Investment Strategy & MRP policy 2019-2020
Page 20
3.4.4 Non-specified investments will only be made with prior approval by the Head of Financial Services and will only be undertaken:
following external credit assessment and due diligence to assess the financial strength and creditworthiness of the counterparty, and
after taking such professional advice as is considered necessary to inform the decision to invest.
3.4.5 In the event that the credit rating of the Council’s banker falls below the minimum credit criteria referred to above, the Council will continue to use the bank for transactional purposes but will seek to minimise balances as far as is possible.
3.5 Limits on principal sums invested
3.5.1 With the exception of funds placed with HM Treasury’s Debt Management Office (DMO), the maximum amount that may be placed with any institution or group of institutions that are part of the same banking group is £4m. For funds placed with the DMO’s Account Deposit Facility the limit is £12m (subject to maximum maturity of 3 weeks for all sums in excess of £4m).
3.6 Limits on investment maturities
3.6.1 To ensure that access to cash to meet forecast liquidity is not impaired, decisions regarding the maturity of investments instruments must be taken having regard to cash flow requirements. The maturity of investment instruments is also subject to the maximum maturity periods set out below (table 4). These are established to ensure that access to cash is not unduly restricted and to reduce the risk of being locked into an investment whilst the creditworthiness of the counterparty is deteriorating.
3.6.2 The maximum period for which funds may prudently be committed by the Council is determined using the Creditworthiness service provided by Link Asset Services. This combines credit ratings information provided by the three main credit rating agencies - Fitch, Moody’s and Standard & Poor’s - with ratings outlooks and credit watches in a weighted scoring system. This is combined with an overlay of credit default swap (CDS) spreads to produce a colour rating to indicate the relative creditworthiness of the counterparty. These colour codes are used to determine the maximum duration for investments made with individual counterparties.
3.6.3 In the current economic climate, it is considered appropriate to keep investment terms short to cover cash flow needs, but also to seek out value available in periods of up to 12 months with high credit quality institutions using Link’s creditworthiness approach. Using this approach, the Council will use the following duration bands - shown in table 4 - subject to a maximum maturity of 365 days (from the date of acquisition).

TMSS, Investment Strategy & MRP policy 2019-2020
Page 21
Table 4: Upper limits on investment maturities
Colour rating Maximum duration (term to maturity)
Yellow 5 years- restricted to 12 months (see paragraph 3.6.3)
Purple 2 years - restricted to 12 months (see paragraph 3.6.3)
Orange 12 months
Red 6 months
Green 100 days
No colour 0 months (counterparty not to be used)
3.7 Reporting arrangements
3.7.1 The Treasury Management and Prudential Codes require the Council to report regularly on its treasury management activities, including its performance against all forward-looking prudential and treasury management indicators set out in section 5 below. In meeting the recommended reporting requirements of the Treasury Management Code (outlined in section 1.2 above), the Head of Financial Services will, in addition to this report, submit to the Audit Committee and Full Council:
a mid-year review of the Council’s treasury management activities covering the six months to 30 September 2019, and
an annual treasury report after the year-end.
The annual report will be submitted as soon as reasonably practicable after the end of the financial year, but in any case no later than 30 September 2020.
3.7.2 A summary of treasury management activities will also be included in the quarterly finance reports submitted to the Council’s Executive.
4. Minimum revenue provision (MRP) policy statement
4.1 Regulation 27 of the Local Authorities (Capital Finance and Accounting) (England) Regulations 2003 (‘the 2003 Regulations’) requires local authorities to ‘charge to a revenue account a minimum revenue provision (MRP) for that year’. The minimum revenue provision is an annual amount required to be set aside from the General Fund to meet the capital cost of expenditure funded by borrowing or credit arrangements, that is, capital expenditure that has not been financed from grants, revenue contributions or capital receipts.
4.2 Regulation 27 also allows authorities to charge to a revenue account any amount, in addition to the MRP, in respect of the financing of capital expenditure incurred in the current financial year or any financial year before the current year (voluntary revenue provision - VRP).
4.3 The calculation of MRP is covered in regulation 28 of the 2003 Regulations. From 31 March 2008, Regulation 28, as amended by Regulation 4(1) of the
TMSS, Investment Strategy & MRP policy 2019-2020
Page 22
Local Authorities (Capital Finance and Accounting) (England) (Amendment) Regulations 2008 (‘the 2008 Regulations’), requires each authority to:
'determine for the current financial year an amount of minimum revenue provision which it considers to be prudent.’
4.4 The 2003 Regulations (as amended) are accompanied by statutory guidance on minimum revenue provision, issued by the Ministry of Housing, Communities & Local Government (MHCLG) under section 21(1A) of the Local Government Act 2003 (‘the 2003 Act’). The latest version of this guidance (version four) was issued by MHCLG in February 2018. It replaced the previous version issued in 2012.
4.5 In meeting the requirement to ‘make prudent provision’, the 2003 Act requires local authorities to ‘have regard to’ this guidance. This means that an authority must consider what the statutory guidance says. It does not mean that a local authority is obligated to follow the guidance. However, if an authority does decide to depart from the guidance, it must be able to show good reasons for doing so.
4.6 The current version of regulation 28 was implemented by the 2008 regulations. It came into force on 31 March 2008 and along with the first edition of MHCLG’s statutory guidance on MRP, is effective for 2007/08 and later years. The current version of regulation 28 provides flexibility in how they calculate MRP. Before this change regulation 28 set out detailed formula - based on an authority’s capital financing requirement - which authorities were required to follow when calculating MRP.
4.7 Neither the 2003 Regulations nor the statutory guidance formally define the term “prudent provision”. The statutory guidance does however establish the broad aim of making prudent provision, which is to ensure that revenue is put aside to cover the underlying need to borrow for capital purposes (the capital financing requirement) over a period that is:
commensurate with the period over which the capital expenditure provides benefits, or
for historic borrowing originally supported by grant income rolled into Revenue Support Grant (RSG), over the period implicit in the determination of that original grant funding.
4.8 The MHCLG guidance outlines four possible ‘options’ as methods of calculating a prudent amount of MRP. However, approaches other than the four listed in the guidance are not ruled out, provided they are consistent with the statutory duty to make a prudent provision. This provides authorities with wide discretion in determining MRP. The statutory guidance also includes specific recommendations on the calculation of MRP in respect of finance leases, on-balance PFI contracts and investment properties.
4.9 The four options for calculating MRP outlined in the MHCLG guidance, and restrictions on their use, are summarised in table 5.

TMSS, Investment Strategy & MRP policy 2019-2020
Page 23
Table 5: Options for prudent provision of MRP
Option Method of calculation Applicability and limits on use
‘Option 1
Regulatory method’
Apply the statutory formula set out in the 2003 Regulations (as amended) before it was revoked by the 2008 Regulations
May only be used in relation to:
Supported capital expenditure for RSG purposes incurred before 1 April 2008.
Supported capital expenditure for RSG purposes incurred on or after 1 April 2008.
‘Option 2
CFR method’
Multiply the (non-housing) Capital Financing Requirement at the end of the preceding financial year by 4%.
May only be used in relation to:
Supported capital expenditure incurred before 1 April 2008.
Supported capital expenditure for RSG purposes incurred on or after 1 April 2008.
‘Option 3 Asset life method’
Amortise expenditure financed by borrowing or credit arrangement over the estimated useful life of the relevant assets using either the equal instalment or annuity method.
Must be used for capital expenditure incurred on or after 1 April 2008 that does not form part of the Authority’s supported capital expenditure.
This includes all expenditure capitalised under regulations or direction on or after 1 April 2008 falling outside the scope of ‘Option 1’.
May be used in relation to any capital expenditure whether or not supported and whenever incurred.
‘Option 4 Depreciation
method’
Charge MRP to revenue based on proper accounting practices for depreciation as they apply to the relevant assets. This includes any amount for impairment chargeable to the Income & Expenditure Account.
Must be used for capital expenditure incurred on or after 1 April 2008 that does not form part of the Authority’s supported capital expenditure.
May be used in relation to any capital expenditure whether or not supported and whenever incurred.
Option 4 may not be used for calculating MRP to be charged in respect of investment properties.
4.10 Where capital expenditure on an asset is financed wholly or partly by borrowing or credit arrangements, authorities applying ‘Option 3’ should calculate MRP by reference to the estimated useful life of the asset. Two main variants of this option exist: (i) the equal instalment method and (ii) the annuity method.
4.11 Both variations allow authorities to make additional voluntary revenue provision (VRP) or to finance expenditure through other methods of repayment during the repayment period (for example through the application of capital receipts). In such cases appropriate adjustments should be made to the calculation of MRP. Where an authority uses Options 3 or 4, the CFR for the purposes of Options 1 and 2 is reduced by the amount of the relevant expenditure and cumulative provision for MRP made under Options 3 and 4.

TMSS, Investment Strategy & MRP policy 2019-2020
Page 24
Policy adopted for 2019-20
4.12 Having regard to the statutory guidance on minimum revenue provision issued by MHCLG and the ‘options’ for calculating MRP set out in that guidance, the Council will calculate MRP:
for all capital expenditure funded from borrowing incurred before 1 April 2008 and for all supported capital expenditure funded from borrowing incurred on or after 1 April 2008, based on 4% of the non-housing Capital Financing Requirement at the end of the preceding financial year (Option 2- CFR method)
for unsupported capital funded from borrowing expenditure incurred on or after 1 April 2008 by applying Option 3 - Asset life method - using either the equal instalments or annuity method
for credit arrangements, such as on balance sheet leasing arrangements (finance leases), by charging an amount (MRP) equal to the element of the rent/charge that goes to write down the balance sheet liability.
4.13 In applying ‘Option 3’:
MRP should normally begin in the financial year following the one in which the expenditure was incurred. However, in accordance with the statutory guidance, commencement of MRP may be deferred until the financial year following the one in which the asset becomes operational
the estimated useful lives of assets used to calculate MRP should not exceed a maximum of 50 years except as otherwise permitted by the guidance
if no life can reasonably be attributed to an asset, such as freehold land, the estimated useful life should be taken to be a maximum of 50 years
for expenditure capitalised by virtue of a capitalisation direction or regulation 25(1) of the 2003 regulations, the ‘asset’ life should equate to the value specified in the statutory guidance.

TMSS, Investment Strategy & MRP policy 2019-2020
Page 25
5. Prudential and treasury indicators 2018-19 to 2020-21
5.1 Indicators required by the Prudential Code
5.1.1 The Prudential Code requires local authorities to self-regulate the affordability, prudence and sustainability of their capital expenditure and borrowing plans, by setting estimates and limits, and by publishing actuals for a range of prudential indicators. It also requires them to ensure their treasury management practices are carried out in accordance with good professional practice.
5.1.2 The prudential and treasury indicators required by the Prudential Code, the Treasury Management Code and accompanying sector guidance issued by CIPFA, are designed to support and record local decision making. They are not designed to be comparative performance indicators and should not be used for this purpose. The prudential and treasury indicators for the forthcoming and following years must be set before the beginning of the forthcoming year. They may be revised at any time, following due process, and must be reviewed, and revised if appropriate, for the current year when the prudential indicators are set for the following year.
5.1.3 From 2020-21 the Code of Practice on Local Authority Accounting will include the requirements of IFRS 16 Leases. This change to the Accounting Code will have implications for the prudential and treasury indicators set out in this section, including external debt (other long-term liabilities) Authorised Limit for External Debt and Operational Boundary. Pending publication of the 2020-21 Accounting Code and completion of a detailed impact assessment, the prudential and treasury indicators for 2020-21 and 2021-22 included in this section exclude the anticipated impact of adopting IFRS 16.
Estimates of capital expenditure
5.1.4 The estimate of capital expenditure indicator summarises the Council’s capital expenditure plans for the forthcoming year and the following two financial years. Estimates of capital expenditure include both those agreed previously and those forming part of the current (2019-20) budget cycle.
5.1.5 Capital expenditure is defined as in section 16 of the Local Government Act 2003 and includes all expenditure capitalised in accordance with proper practices together with any items capitalised in accordance with regulation 25 of the Local Authorities (Capital Finance and Accounting) (England) Regulations 2003 (as amended), or by virtue of a capitalisation direction issued under section 16(2) of the 2003 Act. Estimates of capital expenditure include any capital expenditure that it is estimated might (depending on option appraisals) or will be dealt with as other long-term liabilities.
TMSS, Investment Strategy & MRP policy 2019-2020
Page 26
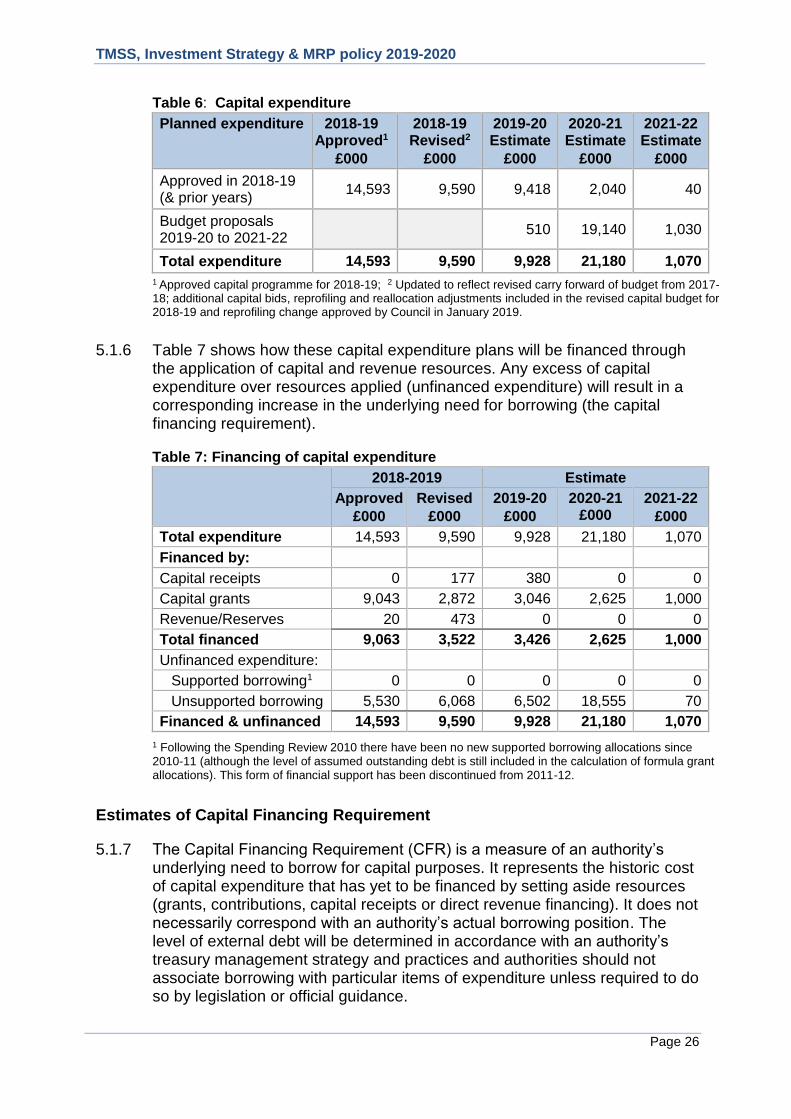
Table 6: Capital expenditure
Planned expenditure 2018-19 Approved1
£000
2018-19 Revised2
£000
2019-20 Estimate
£000
2020-21 Estimate
£000
2021-22 Estimate
£000
Approved in 2018-19 (& prior years)
14,593 9,590 9,418 2,040 40
Budget proposals 2019-20 to 2021-22
510 19,140 1,030
Total expenditure 14,593 9,590 9,928 21,180 1,070
1 Approved capital programme for 2018-19; 2 Updated to reflect revised carry forward of budget from 2017-18; additional capital bids, reprofiling and reallocation adjustments included in the revised capital budget for 2018-19 and reprofiling change approved by Council in January 2019.
5.1.6 Table 7 shows how these capital expenditure plans will be financed through the application of capital and revenue resources. Any excess of capital expenditure over resources applied (unfinanced expenditure) will result in a corresponding increase in the underlying need for borrowing (the capital financing requirement).
Table 7: Financing of capital expenditure
2018-2019 Estimate
Approved
£000
Revised
£000
2019-20
£000
2020-21 £000
2021-22
£000
Total expenditure 14,593 9,590 9,928 21,180 1,070
Financed by:
Capital receipts 0 177 380 0 0
Capital grants 9,043 2,872 3,046 2,625 1,000
Revenue/Reserves 20 473 0 0 0
Total financed 9,063 3,522 3,426 2,625 1,000
Unfinanced expenditure:
Supported borrowing1 0 0 0 0 0
Unsupported borrowing 5,530 6,068 6,502 18,555 70
Financed & unfinanced 14,593 9,590 9,928 21,180 1,070
1 Following the Spending Review 2010 there have been no new supported borrowing allocations since 2010-11 (although the level of assumed outstanding debt is still included in the calculation of formula grant allocations). This form of financial support has been discontinued from 2011-12.
Estimates of Capital Financing Requirement
5.1.7 The Capital Financing Requirement (CFR) is a measure of an authority’s underlying need to borrow for capital purposes. It represents the historic cost of capital expenditure that has yet to be financed by setting aside resources (grants, contributions, capital receipts or direct revenue financing). It does not necessarily correspond with an authority’s actual borrowing position. The level of external debt will be determined in accordance with an authority’s treasury management strategy and practices and authorities should not associate borrowing with particular items of expenditure unless required to do so by legislation or official guidance.

TMSS, Investment Strategy & MRP policy 2019-2020
Page 27
5.1.8 Capital expenditure that is not financed up-front through the application of capital grants, contributions, capital receipts or a direct charge to revenue, will increase the Capital Financing Requirement. Charging the minimum revenue provision or a voluntary revenue provision against the general fund will reduce the CFR. The CFR includes items of capital expenditure included in the Council’s balance sheet associated with other long term liabilities, such as assets held on finance leases, but excluding the underlying liability.
5.1.9 Table 8 sets out estimates of the Council’s capital financing requirement at the end of 2019-20 and the following two financial years.
Table 8: Capital financing requirement
2018-19 Estimate
Approved
£000
Revised
£000
2019-20
£000
2020-21
£000
2021-22
£000
CFR at 1 April 20,643 18,917 24,314 29,586 46,852
CFR at 31 March 25,460 24,314 29,586 46,852 44,852
Movement in CFR 4,817 5,397 5,272 17,266 (2,000)
Represented by:
Unfinanced expenditure 5,530 6,068 6,502 18,555 70
Less MRP/VRP (713) (671) (1,230) (1,289) (2,070)
Movement in CFR 4,817 5,397 5,272 17,266 (2,000)
Gross debt and the capital financing requirement (CFR)
5.1.10 A fundamental provision of the Prudential Code and a key indicator of prudence is that over the medium term, debt will only be for a capital
purpose. To ensure this is the case, the Prudential Code requires that gross external debt should not, except in the short term, exceed the total of capital financing requirement in the preceding year plus the estimates of any additional capital financing requirement for the current and next two financial years.
5.1.11 This requirement allows some flexibility for limited early borrowing for future years but ensures that borrowing is not undertaken for revenue purposes. If in any of these years there is a reduction in the CFR, this reduction is ignored in estimating the cumulative increase in the CFR used for comparison with gross external debt. Gross debt refers to the sum of borrowing and other long-term liabilities (credit arrangements).
TMSS, Investment Strategy & MRP policy 2019-2020
Page 28
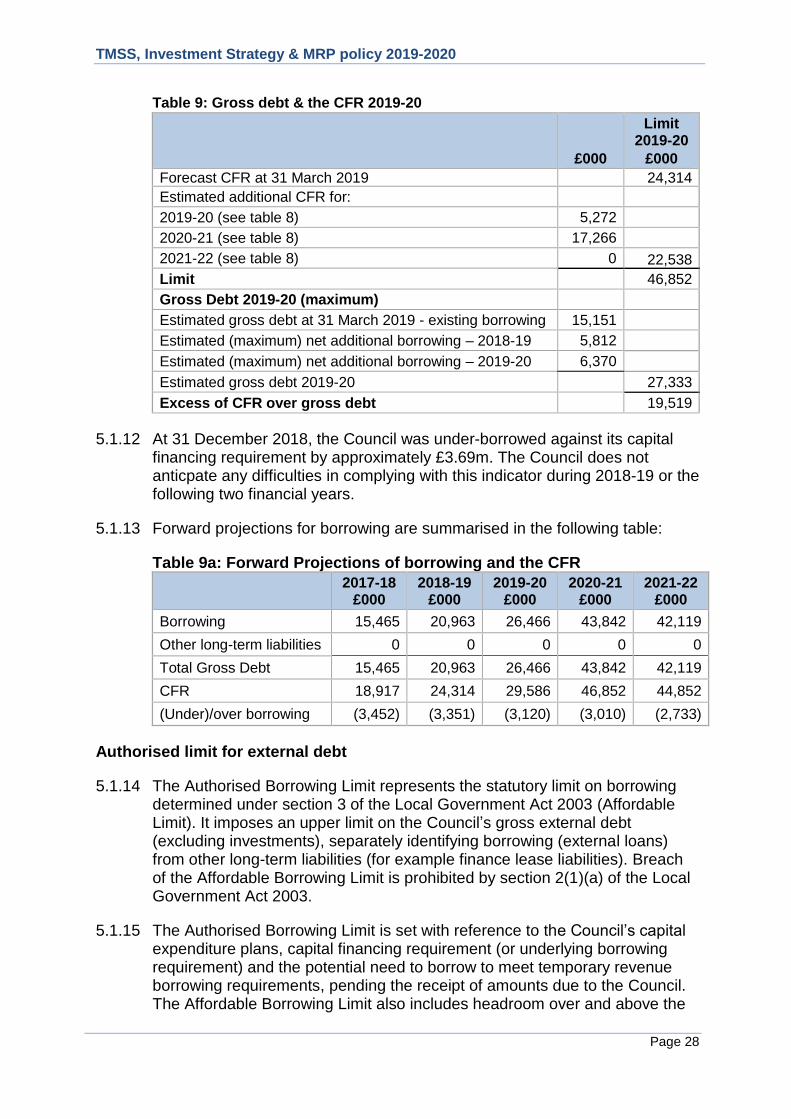
Table 9: Gross debt & the CFR 2019-20
£000
Limit 2019-20
£000
Forecast CFR at 31 March 2019 24,314
Estimated additional CFR for:
2019-20 (see table 8) 5,272
2020-21 (see table 8) 17,266
2021-22 (see table 8) 0 22,538
Limit 46,852
Gross Debt 2019-20 (maximum)
Estimated gross debt at 31 March 2019 - existing borrowing 15,151
Estimated (maximum) net additional borrowing – 2018-19 5,812
Estimated (maximum) net additional borrowing – 2019-20 6,370
Estimated gross debt 2019-20 27,333
Excess of CFR over gross debt 19,519
5.1.12 At 31 December 2018, the Council was under-borrowed against its capital financing requirement by approximately £3.69m. The Council does not anticpate any difficulties in complying with this indicator during 2018-19 or the following two financial years.
5.1.13 Forward projections for borrowing are summarised in the following table:
Table 9a: Forward Projections of borrowing and the CFR
2017-18 £000
2018-19 £000
2019-20
£000 2020-21
£000 2021-22
£000
Borrowing 15,465 20,963 26,466 43,842 42,119
Other long-term liabilities 0 0 0 0 0
Total Gross Debt 15,465 20,963 26,466 43,842 42,119
CFR 18,917 24,314 29,586 46,852 44,852
(Under)/over borrowing (3,452) (3,351) (3,120) (3,010) (2,733)
Authorised limit for external debt
5.1.14 The Authorised Borrowing Limit represents the statutory limit on borrowing determined under section 3 of the Local Government Act 2003 (Affordable Limit). It imposes an upper limit on the Council’s gross external debt (excluding investments), separately identifying borrowing (external loans) from other long-term liabilities (for example finance lease liabilities). Breach of the Affordable Borrowing Limit is prohibited by section 2(1)(a) of the Local Government Act 2003.
5.1.15 The Authorised Borrowing Limit is set with reference to the Council’s capital expenditure plans, capital financing requirement (or underlying borrowing requirement) and the potential need to borrow to meet temporary revenue borrowing requirements, pending the receipt of amounts due to the Council. The Affordable Borrowing Limit also includes headroom over and above the

TMSS, Investment Strategy & MRP policy 2019-2020
Page 29
Operational Boundary (see below) to accommodate any unusual or unforeseen cash movements. The indicator separately identifies limits for borrowing and other long-term liabilities.
Table 10: Authorised Limit for External Debt
2018-19 Limit
£000
2019-20a
Limit
£000
2020-21a Limit
£000
2021-22a Limit
£000
Borrowing 28,000 33,000 50,000 48,000
Other long-term liabilities 0 0 0 0
Total 28,000 33,000 50,000 48,000
a: From 2020-21 the Code of Practice on Local Authority Accounting will include adoption of IFRS 16 Leases. Pending publication of the 2020-21 Accounting Code, the impact of this change on the other long-term liabilities component of the Authorised Limit for External Debt is not reflected in the reported limits
Operational boundary for external debt
5.1.16 The Operational Boundary represents the limit beyond which (gross) external debt is not expected to exceed. It is based on expectations of the maximum external debt of a local authority according to probable events (that is the most likely (prudent), but not worst case scenario) and is consistent with the maximum level of external debt projected by these estimates. The Operational Boundary links directly to the Council’s plans for capital expenditure, estimates of the capital financing requirement and cash flow requirements for the year for all purposes but without the additional headroom included within the Authorised Limit. The indicator separately identifies limits for borrowing and other long-term liabilities.
Table 11: Operational boundary for external debt
2018-19 Limit
£000
2019-20a
Limit
£000
2020-21a Limit
£000
2021-22a Limit
£000
Borrowing 26,000 31,000 48,000 46,000
Other long-term liabilities 0 0 0 0
Total 26,000 31,000 48,000 46,000
a: From 2020-21 the Code of Practice on Local Authority Accounting will include adoption of IFRS 16 Leases. Pending publication of the 2020-21 Accounting Code, the impact of this change on the other long-term liabilities component of the Operational Boundary for External Debt is not reflected in the reported limits
5.1.17 Provided that the total Authorised Limit and total Operational Boundary for a year is unchanged, the Head of Financial Services has delegated authority to make changes to the separately identifiable limits for borrowing and other long-term liabilities. Any movement between these separate totals will be reported to the next meetings of the Audit Committee and Full Council.
TMSS, Investment Strategy & MRP policy 2019-2020
Page 30
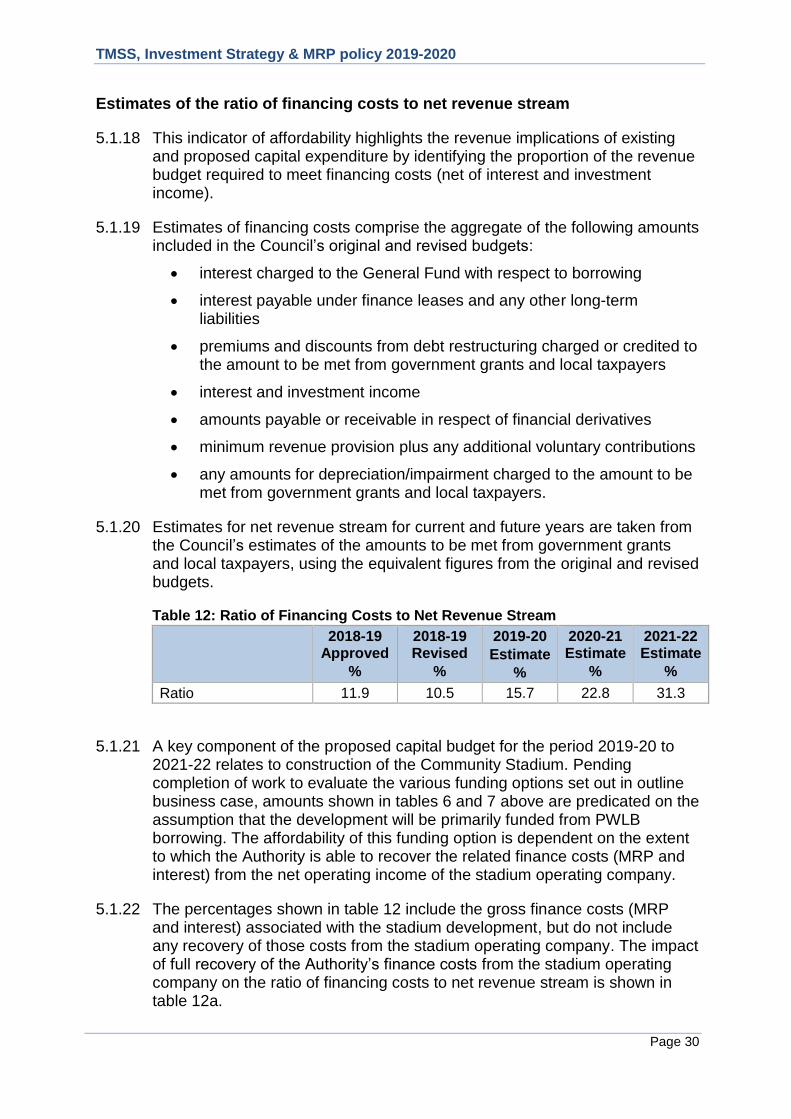
Estimates of the ratio of financing costs to net revenue stream
5.1.18 This indicator of affordability highlights the revenue implications of existing and proposed capital expenditure by identifying the proportion of the revenue budget required to meet financing costs (net of interest and investment income).
5.1.19 Estimates of financing costs comprise the aggregate of the following amounts included in the Council’s original and revised budgets:
interest charged to the General Fund with respect to borrowing
interest payable under finance leases and any other long-term liabilities
premiums and discounts from debt restructuring charged or credited to the amount to be met from government grants and local taxpayers
interest and investment income
amounts payable or receivable in respect of financial derivatives
minimum revenue provision plus any additional voluntary contributions
any amounts for depreciation/impairment charged to the amount to be met from government grants and local taxpayers.
5.1.20 Estimates for net revenue stream for current and future years are taken from the Council’s estimates of the amounts to be met from government grants and local taxpayers, using the equivalent figures from the original and revised budgets.
Table 12: Ratio of Financing Costs to Net Revenue Stream
2018-19 Approved
%
2018-19 Revised
%
2019-20
Estimate
%
2020-21 Estimate
%
2021-22 Estimate
%
Ratio 11.9 10.5 15.7 22.8 31.3
5.1.21 A key component of the proposed capital budget for the period 2019-20 to 2021-22 relates to construction of the Community Stadium. Pending completion of work to evaluate the various funding options set out in outline business case, amounts shown in tables 6 and 7 above are predicated on the assumption that the development will be primarily funded from PWLB borrowing. The affordability of this funding option is dependent on the extent to which the Authority is able to recover the related finance costs (MRP and interest) from the net operating income of the stadium operating company.
5.1.22 The percentages shown in table 12 include the gross finance costs (MRP and interest) associated with the stadium development, but do not include any recovery of those costs from the stadium operating company. The impact of full recovery of the Authority’s finance costs from the stadium operating company on the ratio of financing costs to net revenue stream is shown in table 12a.

TMSS, Investment Strategy & MRP policy 2019-2020
Page 31
Table 12a: Ratio of Financing Costs to Net Revenue Stream after recovery
2018-19 Approved
%
2018-19 Revised
%
2019-20
Estimate
%
2020-21 Estimate
%
2021-22 Estimate
%
Ratio inc. recharge of stadium finance costs
11.9 10.5 15.1 18.5 18.1
5.2 Indicators required by the Treasury Management Code
5.2.1 In addition to the indicators required by the Prudential Code there are also a number of treasury indicators required by the Treasury Management Code and accompanying sector guidance. These are:
upper and lower limits to the maturity structure of its borrowing
upper limits on the total of principal sums invested over 365 days.
5.2.2 These treasury management indicators specify ranges (rather than targets) designed to limit the Council’s exposure to liquidity and refinancing risks.
Upper and lower limits to the maturity structure of borrowing
5.2.3 This indicator highlights potential exposures to refinancing risk arising from concentrations of debt falling due for refinancing, and is designed to facilitate reductions in the Council’s exposure to refinancing at times of volatile or high interest rates.
5.2.4 It is calculated as the amount of projected borrowing maturing in each period as a percentage of total projected borrowing. The maturity of borrowing is determined by reference to the earliest date on which the lender can require payment.
Table 13: Lower/upper limits on % borrowing maturing in each period
31.3.18 Actual
31.3.19 forecast
2018-19 2019-20
Lower limit
Upper limit
Lower limit
Upper limit
% % % % % %
Under 12 months 2.57 4.54 0 20 0 20
12 months to 2 years 2.07 4.17 0 20 0 20
2 years to 5 years 6.50 12.76 0 20 0 20
5 years to 10 years 12.13 18.51 0 30 0 30
10 years to 20 years 19.31 16.37 0 40 0 40
20 years to 30 years 5.69 4.44 0 40 0 40
30 years to 40 years 51.73 38.85 0 80 0 80
40 years to 45 years 0 0.18 0 80 0 80
45 years to 50 years 0 0.18 0 80 0 80

TMSS, Investment Strategy & MRP policy 2019-2020
Page 32
Upper limits on total principal invested for periods of more than 365 days
5.2.5 A local authority that invests, or plans to invest, for periods of more than 365 days is required to set an upper limit for each forward financial year period for the maturing of such investments. The purpose of these limits for principal sums invested for periods longer than 365 days is for the local authority to contain its exposure to the possibility of loss that might arise as a result of its having to seek early repayment or redemption of principal sums invested.
Table 14: Upper limit on total principal invested for periods of more than 365 days
2018-19 Approved
£000
2019-20 Limit
£000
2020-21
Limit
£000
2021-22 Limit
£000
Principal sums invested > 365 days 20 20 20 20
5.2.6 For its cash flow generated balances, the Council will seek to utilise its call and notice accounts, money market funds and short-dated deposits (overnight to 6 months). The Council will not invest for periods of more than 365 days during 2019-20.

TMSS, Investment Strategy & MRP policy 2018-2019
Page 33
6. Appendices
A. Interest Rate Forecasts 2019 - 2022
B. Economic Background
C. Credit Ratings
TMSS, Investment Strategy & MRP policy 2018-2019
Page 34
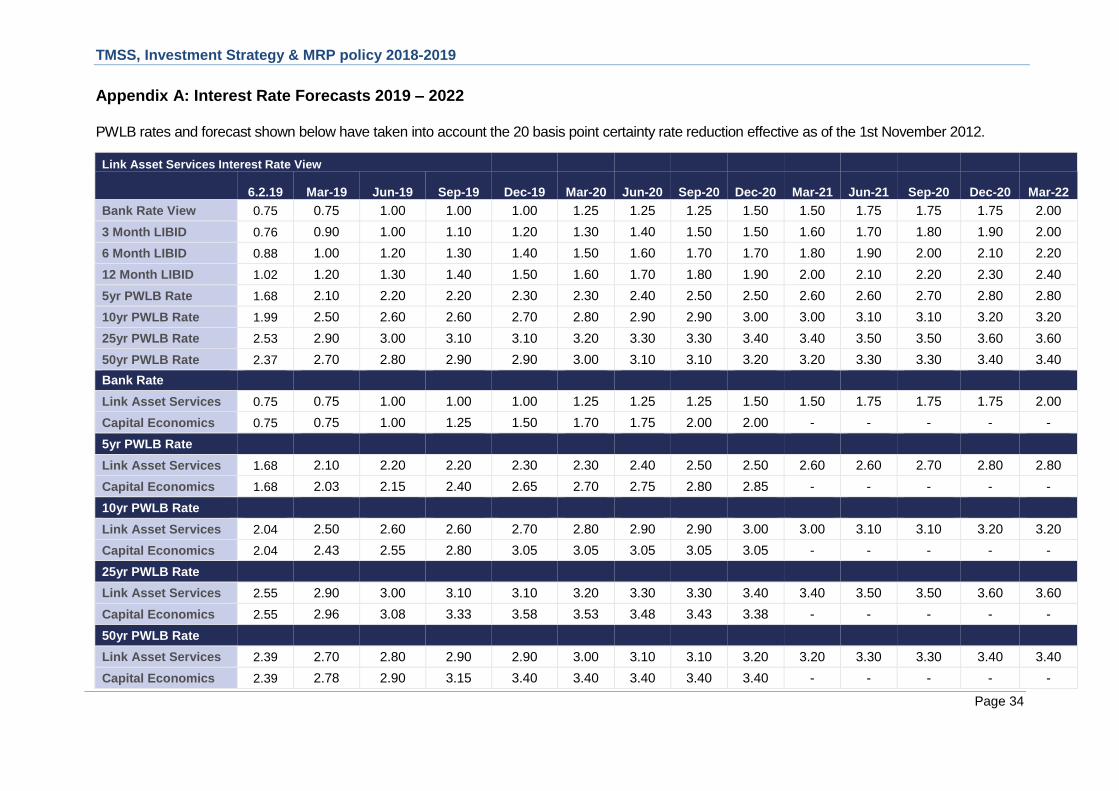
Appendix A: Interest Rate Forecasts 2019 – 2022
PWLB rates and forecast shown below have taken into account the 20 basis point certainty rate reduction effective as of the 1st November 2012.
Link Asset Services Interest Rate View
6.2.19 Mar-19 Jun-19 Sep-19 Dec-19 Mar-20 Jun-20 Sep-20 Dec-20 Mar-21 Jun-21 Sep-20 Dec-20 Mar-22
Bank Rate View 0.75 0.75 1.00 1.00 1.00 1.25 1.25 1.25 1.50 1.50 1.75 1.75 1.75 2.00
3 Month LIBID 0.76 0.90 1.00 1.10 1.20 1.30 1.40 1.50 1.50 1.60 1.70 1.80 1.90 2.00
6 Month LIBID 0.88 1.00 1.20 1.30 1.40 1.50 1.60 1.70 1.70 1.80 1.90 2.00 2.10 2.20
12 Month LIBID 1.02 1.20 1.30 1.40 1.50 1.60 1.70 1.80 1.90 2.00 2.10 2.20 2.30 2.40
5yr PWLB Rate 1.68 2.10 2.20 2.20 2.30 2.30 2.40 2.50 2.50 2.60 2.60 2.70 2.80 2.80
10yr PWLB Rate 1.99 2.50 2.60 2.60 2.70 2.80 2.90 2.90 3.00 3.00 3.10 3.10 3.20 3.20
25yr PWLB Rate 2.53 2.90 3.00 3.10 3.10 3.20 3.30 3.30 3.40 3.40 3.50 3.50 3.60 3.60
50yr PWLB Rate 2.37 2.70 2.80 2.90 2.90 3.00 3.10 3.10 3.20 3.20 3.30 3.30 3.40 3.40
Bank Rate
Link Asset Services 0.75 0.75 1.00 1.00 1.00 1.25 1.25 1.25 1.50 1.50 1.75 1.75 1.75 2.00
Capital Economics 0.75 0.75 1.00 1.25 1.50 1.70 1.75 2.00 2.00 - - - - -
5yr PWLB Rate
Link Asset Services 1.68 2.10 2.20 2.20 2.30 2.30 2.40 2.50 2.50 2.60 2.60 2.70 2.80 2.80
Capital Economics 1.68 2.03 2.15 2.40 2.65 2.70 2.75 2.80 2.85 - - - - -
10yr PWLB Rate
Link Asset Services 2.04 2.50 2.60 2.60 2.70 2.80 2.90 2.90 3.00 3.00 3.10 3.10 3.20 3.20
Capital Economics 2.04 2.43 2.55 2.80 3.05 3.05 3.05 3.05 3.05 - - - - -
25yr PWLB Rate
Link Asset Services 2.55 2.90 3.00 3.10 3.10 3.20 3.30 3.30 3.40 3.40 3.50 3.50 3.60 3.60
Capital Economics 2.55 2.96 3.08 3.33 3.58 3.53 3.48 3.43 3.38 - - - - -
50yr PWLB Rate
Link Asset Services 2.39 2.70 2.80 2.90 2.90 3.00 3.10 3.10 3.20 3.20 3.30 3.30 3.40 3.40
Capital Economics 2.39 2.78 2.90 3.15 3.40 3.40 3.40 3.40 3.40 - - - - -

TMSS, Investment Strategy & MRP policy 2018-2019
Page 35
Appendix B: Economic Background
UK Economy
B.1 The flow of positive economic statistics since the end of the first quarter of 2018 has shown that pessimism was overdone about the poor growth in quarter 1 when adverse weather caused a temporary downward blip. Quarter 1 at 0.1% growth in GDP was followed by a return to 0.4% in quarter 2 and by a strong performance in quarter 3 of +0.6%. However, growth in quarter 4 is expected to weaken significantly.
B.2 At their November Quarterly Inflation Report meeting, the Bank of England Monetary Policy Committee (MPC) repeated their well-worn phrase that future Bank Rate increases would be gradual and would rise to a much lower equilibrium rate, (where monetary policy is neither expansionary of contractionary), than before the crash; indeed they gave a figure for this of around 2.5% in ten years’ time but declined to give a medium term forecast.
B.3 However, with so much uncertainty around Brexit, they warned that the next move could be up or down, even if there was a disorderly Brexit. Whilst it might be expected that the Bank Rate would be cut if there was a significant fall in GDP growth as a result of a disorderly Brexit, so as to provide a stimulus to growth, they warned they could instead raise the Bank Rate in the same scenario if there was a boost to inflation from a devaluation of sterling, increases in import prices and more expensive goods produced in the UK replacing cheaper goods previously imported, and so on. In addition, the Chancellor could potentially provide fiscal stimulus to support economic growth, if needed though this would be at the cost of increasing the budget deficit above currently projected levels.
B.4 Overall, the MPC was more hawkish than expected, indicating the likelihood of a faster pace of increases than previously expected. Key messages from the Bank’s November Inflation report and MPC of meeting on 1 November include:
MPC vote of 9-0 for no change in the Bank Rate and quantitative easing
GDP growth for 2018 cut to 1.3% from 1.4% with annual growth for the next three years expected to be around 1.7% (2019 previously 1.8%)
The economy will be operating at a small amount of excess demand in 2020, (previously 2021). This is likely to generate an increase in domestic inflationary pressures, (as opposed to imported due to a one-off fall in the value of sterling).
Unemployment rate to stay at 3.9% over the next three years; (equilibrium rate forecast 4.25%)
Build-up of wage inflation pressures as a result of high levels of employment and ongoing concerns over weak productivity increases; MPC forecast wage inflation of 3.25% 2019, 3.5% 2020, 3.75% 2021
CPI inflation up from 2.0% to 2.1% 2 years ahead, i.e. above their 2% target
the economy is heading into overheating and the fiscal position has changed direction to now be a slight tailwind, i.e. the MPC will be wanting

TMSS, Investment Strategy & MRP policy 2019-2020
Page 36
to take action to counter building inflationary pressures as soon as Brexit uncertainty clears.
B.5 It is unlikely that the MPC would increase the Bank Rate in February 2019 ahead of the deadline in March for Brexit. Getting parliamentary approval for a Brexit agreement on both sides of the Channel will take well into spring 2019. However, in view of the hawkish stance of the MPC at their November meeting, the next increase in the Bank Rate is now forecast to be in May 2019 (on the assumption that a Brexit deal is agreed by both the UK and the EU). The following increases are then forecast to be in February and November 2020. Further increases in quarter 2, 2021 and quarter 1, 2022 will see the bank rate increase to 2.0% by February 2022.
B.6 The Consumer Price Index (CPI) measure of inflation has been falling from a peak of 3.1% in November 2017 to 2.1% in December 2018. In the November Bank of England quarterly inflation report, inflation was forecast to still be marginally above the Bank’s 2% inflation target two years ahead, (at about 2.1%) given a scenario of minimal increases in the Bank Rate.
B.7 The labour market has remained resilient with the number and proportion of people in work remaining close to record levels. This is despite some predictions that unemployment would rise following the Brexit vote. The employment rate (the proportion of people aged from 16 to 64 years who were in work) for the period July to September 2018 was 75.5%, little changed compared with the period April to June 2018 but higher than for a year earlier (75.0%). Whilst employment growth has softened in recent months amid dwindling levels of spare capacity in the labour market, various measured of hiring intentions and surveys of employment growth suggest that firms’ demand for workers will remain robust in the short-term.
B.8 The unemployment rate (the number of unemployed people as a proportion of all employed and unemployed people) for the period July to September was 4.1% on the International Labour Organisation’s measure of unemployment. This was marginally above a 43 year low of 4% for April to June 2018 but lower than for a year earlier (4.3%). A combination of job vacancies hitting an all-time high, coupled with negligible growth in total employment numbers, indicates that employers are now having major difficulties filling job vacancies with suitable staff, putting upward pressure on wage growth.
B.9 Reflecting the tightening in the labour market, headline annual wage growth, (three-month average excluding bonuses) in the three months to October picked up to 3.3%, (3 month average regular pay, excluding bonuses). This meant that in real terms, (i.e. wage rates less CPI inflation) earnings are currently growing by about 1.2%, the highest level since 2009. Given the UK economy is very much services sector driven, this increase in household spending power is likely to feed through into providing some support to the overall rate of economic growth in the coming months. This tends to confirm that the MPC was right to start on a cautious increase in the Bank Rate in August, as it views wage inflation in excess of 3% as increasing inflationary pressures within the UK economy.

TMSS, Investment Strategy & MRP policy 2019-2020
Page 37
B.10 In the political arena, the Brexit deal put forward by the Conservative minority government was defeated on 15 January and it remains unclear at the time of writing, how this situation will move forward. The view held by the Council’s treasury advisors is that the government will endure, despite various setbacks, along the route to reaching an orderly Brexit, though the risks are increasing that it may not be possible to get full agreement by the UK and EU before 29 March 2019, in which case this withdrawal date is likely to be pushed back to a new date. If however, the UK faces a general election in the next 12 months, this could result in a potential loosening of monetary policy and therefore medium to longer dated gilt yields could rise on the expectation of a weak pound and concerns around inflation picking up.
U.S.
B.11 In the US, a massive easing of fiscal policy is fuelling a (temporary) boost in consumption which has generated an upturn in the rate of strong growth. Growth rose from 2.2% (annualised rate) in quarter 1, to 4.2% in quarter 2 and 3.5% (3.0%y/y) in quarter 3. It has however also contributed to an upturn in inflationary pressures. In particular, wage rates were increasing at 3.1% y/y in October and heading higher due to unemployment falling to a 49 year low of 3.7% in November .
B.12 A strong growth in employment numbers saw a reduction in the unemployment rate to a 49 year low of 3.7% in November 2018 before rising to 3.9% in December. This has fed through to an upturn in wage inflation which hit 3.2% in November. However, CPI inflation overall fell to 2.2% in November and looks to be on a falling trend to drop below the Fed’s target of 2% during 2019.
B.13 The Federal Reserve (the Fed.) has continued on its series of increases in interest rates with another 0.25% increase in December to between 2.25% and 2.50%, this being the fifth increase in 2018 and the ninth in this cycle. However, they did also reduce their forecast for further increases from three to two. This latest increase compounded investor fears that the Fed is over doing the pace and level of increases in rates and that it is going to cause a US recession as a result. There is also much evidence in previous monetary policy cycles, of the Fed’s series of increases doing exactly that. As a consequence, stock markets around the world have been falling under the weight of fears around the Fed’s actions, the trade war between the US and China and expectation that world growth will slow.
B.14 The tariff war between the US and China has been generating a lot of heat during 2018. Although it is not expected that the current level of actual action would have much in the way of a significant effect on US or world growth, there is a risk of escalation if an agreement is not reached soon between the US and China. The results of the mid-term elections are not expected to have a material effect on the economy.

TMSS, Investment Strategy & MRP policy 2019-2020
Page 38
Eurozone
B.15 Growth was unchanged at 0.4% in quarters 1 and 2 of 2018 but fell back to 0.2% in quarter 3, though this was probably a temporary dip. Growth has therefore undershot early forecasts for a stronger economic performance in 2018. In particular, data from Germany has been mixed and it could be negatively impacted by US tariffs on a significant part of its manufacturing exports e.g. cars. For that reason, although growth is still expected to be in the region of 2% for 2018, the horizon is less clear than it seemed just a short while ago.
B.16 Having halved its quantitative easing purchases of debt in October 2018 to €15bn per month, the European Central Bank (ECB) ended all further purchases in December 2018. The ECB is forecasting inflation to be a little below its 2% top limit through the next three years, so it may find it difficult to warrant a start on raising rates by the end of 2019 if the growth rate of the EU economy is on a weakening trend.
Asia
B.17 Chinese economic growth has been weakening over successive years, despite repeated rounds of central bank stimulus; medium term risks are increasing. Major progress still needs to be made to eliminate excess industrial capacity and the stock of unsold property and address the level of non-performing loans in the banking and credit systems. Progress has been made in reducing the rate of credit creation, particularly from the shadow banking sector, which is feeding through into lower economic growth. However, concerns remain over whether official economic statistics are inflating the published rate of growth.
B.18 Japan is struggling to stimulate consistent significant growth and to get inflation up to its target of 2%, despite huge monetary and fiscal stimulus. It is also making little progress on fundamental reform of the economy. It is likely that loose monetary policy will endure for some years yet to try to stimulate growth and modest inflation.
Emerging countries.
B.19 Argentina and Turkey are currently experiencing major headwinds and are facing challenges in external financing requirements well in excess of their reserves of foreign exchange. However, these countries are small in terms of the overall world economy (around 1% each), so the fallout from the expected recessions in these countries will be minimal.
Global Outlook
B.20 Global growth has been doing reasonably well, aided by strong growth in the US. However, US growth is likely to fall back in 2019 and, together with weakening economic activity in China and the Eurozone, overall world growth is likely to weaken.
B.21 Inflation has been weak during 2018 but, at long last, unemployment falling to remarkably low levels in the US and UK has led to an acceleration of wage inflation.

TMSS, Investment Strategy & MRP policy 2019-2020
Page 39
The US Federal Reserve has therefore increased rates nine times and the Bank of England twice. However, the ECB is unlikely to start raising rates until late in 2019 at the earliest.
Central bank monetary policy measures
B.21 Following the financial crash of 2008, when liquidity suddenly dried up in financial markets, central bank sought to counter the recessionary impact of this through a combination of lowering central interest rates and flooding financial markets with liquidity, particularly through unconventional means such as Quantitative Easing (QE) where central banks bought large amounts of central government debt and smaller sums of other debt. Looking back, these measures were successful in countering the prospects of a sharp global recession.
B.22 The key issue now is that the period of stimulating economic recovery and warding off the threat of deflation is coming towards its close. A new period of reversing those measures i.e. by raising central rates and (for the US) reducing central banks’ holdings of government and other debt is already well advanced in the US, and has, more recently, started in the UK.
B.23. These measures are now required in order to stop the trend of a reduction in spare capacity in the economy, and of unemployment falling to such low levels that the re-emergence of inflation is viewed as a major risk. It is, therefore, crucial that central banks get their timing right and do not cause shocks to market expectations that could destabilise financial markets. In particular, a key risk is that because QE-driven purchases of bonds drove up the price of government debt, and therefore caused a sharp drop in income yields, this then also encouraged investors into a search for yield and into investing in riskier assets such as equities.
B.24 This resulted in bond and equity market prices rising to historically high valuation levels simultaneously. This meant that both asset categories were exposed to the risk of a sharp downward correction and we have indeed, seen a sharp fall in equity values in the last quarter of 2018. This, therefore, makes both asset categories vulnerable to a sharp correction. It is important, therefore, that central banks only gradually unwind their holdings of bonds in order to prevent destabilising the financial markets. It is also likely that the timeframe for central banks unwinding their holdings of QE debt purchases will be over several years. They need to balance their timing to avoid damaging economic growth by taking too rapid and/or too strong action, or, alternatively, letting inflation run away by taking action that was too slow and/or too weak. The potential for central banks to get this timing and strength of action wrong are now key risks. At the time of writing (January 2019), financial markets are very concerned that the Federal Reserve is being too aggressive with its policy for raising interest rates and is likely to cause a recession in the US economy.
B.25 The global economy also needs to adjust to a sharp change in liquidity creation over the last five years, where the US has moved from boosting liquidity by QE purchases, to reducing its holdings of debt, (currently about $50bn per month). In addition, the European Central Bank ended its QE purchases in December 2018.

TMSS, Investment Strategy & MRP policy 2019-2020
Page 40
Appendix C: Credit Ratings
International long-term credit ratings
Fitch Moody’s Standard
& Poor’s
Definition Permitted
counter-
party
Investment Grade
AAA Aaa AAA Highest quality/Best quality/Extremely strong Yes
AA Aa AA Very high quality/High quality/Very strong Yes
A A A High quality/Upper medium grade/Strong Yes*
BBB Baa BBB Good quality/Medium grade/Adequate No
Non-investment/speculative grade
BB Ba BB Speculative/Lower medium grade/Speculative – Less vulnerable
No
B B B Highly speculative/Low grade/More vulnerable No
CCC Caa CCC Poor quality/Currently vulnerable No
CC Ca CC High default risk/Highly speculative/Currently highly vulnerable
No
C C C High default risk/Extremely poor/Imminent default
No
D D In default No
*except non UK sovereigns
Note: Fitch Ratings and Standard and Poor’s ratings from 'AA' to 'CCC' may be modified by the addition of a plus (+) or minus (-) sign to show relative standing within the major rating categories. Moody’s append numerical modifiers 1, 2, and 3 to each generic rating classification from Aa through Caa to denote relative status.