tmap-7 simulation of d thermal release data from be …pfc2012.pppl.gov/presentations/5-pmi lab...
TRANSCRIPT

PISCES
June 20-‐22 (2012) PFC Annual Mee3ng -‐ Princeton NJ
TMAP-7 SIMULATION OF D2 THERMAL RELEASE DATA FROM BE CO-
DEPOSITED LAYERS
M. J. BALDWIN, T. SCHWARZ-SELINGER*, J. YU, R. P. DOERNER
PISCES Laboratory, UCSD *IPP- Garching, Germany
[Special thanks to Glen Longhurst, U. of Utah]

PISCES
Introduc3on • ITER will have 700 sq. m of Be first wall and start-‐up
limiters. • Nuclear licensing requires low T in vessel inventory,
700 g (mobilizable). • T accumula3on in ITER will be driven by co-‐deposi3on. • PISCES experiments contribute to the
understanding of the nature of T inventory buildup & strategies for reduc3on.
• Inventory control op3ons: 1) Bulk PFC bake-‐out, 513 K (main wall), 623 K
(divertor). HOW LONG TO BAKE? 2) Transient thermal loads, rapid (< 10 ms) surface
hea3ng to high T during controlled plasma termina3on. HOW MUCH IS RELEASED?
3) Remote probes (inefficient, last resort). 4) Component replacement (when all else fails).
• Efficacy of 1) & 2) examined through experiment and modeling. REQUIRES IDENTICAL SAMPLES.
W
Be

PISCES
Utilizes 3, 100 W Be sputter guns, operated at 6 mTorr in 80% Ar, 20 % D2
GA magnetron spu^er coater produces batches of ‘iden3cal’ co-‐deposits
Bake-out Exp. Tdep < 323 K
Transient Exp. Tdep ~ 500 K
Be deposition rate 2.5 x1015 cm-2s-1
Be-D co-deposited layers 1 µm thick
A 50 J, 10 msec YAG laser is used to ‘flash’ codeposits simulating the radiation pulse during a controlled plasma shutdown in ITER

PISCES
7/5/12
Experiments
Two types of experiment:
1) BAKE OUT -‐ Iden3cal co-‐deposited Be–D layers were held at ITER relevant bake temperatures of 513 and 623 K for varied lengths of 3me up to 25 h. Remaining D inv. measured.
2) TRANSIENT – Iden3cal Be–D layers were flash desorbed for 10 ms by focused YAG laser (< 50 J) at 1064 nm. Remaining D inv. Measured by TDS.
• Special holder designed to give good TC contact to balls
• D inventory is measured using TDS.
• pD2 -‐ 3me profile is calibrated against D2 leak.
• pD2 -‐ 3me integral a measure
of retained D in co-‐deposit.
TMP pump
IR heaters
TC
Be-‐D co-‐deposit
D2 (cal.)
RGA Quartz tube

PISCES
Enclosure 1 -‐ TDS chamber (300 K)
Enclosure 2 – TMP (300 K)
Ball & flash targets modeled as 1D layers. 3 linked diff. & therm. segments, T history BeO (a few nm), Be (1 µm), W (1 mm).
TMAP Input – (Literature values for Be: Federici et al., FED 28 (1995)) for BeO, Be, W: Longhurst, TMAP7 V&V Manual, INEEL/EXT-‐04-‐02352 (2004)
thermal conduc3vity, heat capacity, D solubility, D diffusivity, D-‐D2 recombina3on, trap conc. & energy
Modeling (TMAP 7) TMAP Output – D2 surf. Flux (comparable w/ TDS exp. data)
Be layer thickness & trap concentration input come from experimental measurements.

PISCES
• TDS data (symbols) from a Be–D co-‐deposit sphere. Two trap states (α and β) with a ‘tail’ (γ) reminiscent of 2nd order release.
• TMAP output (i, ii, iv) -‐ single layer Be(1 µm) model. Etraps: 0.80 eV & 0.98 eV.
• (i) Sieverts law release. • (ii) kr specified [Federici et al., FED 28 (1995) • 136 & Longhurst et al. JNM 258–263 (1998) 640 ]. • (iii) Incl. 10 nm BeO surface layer.
~ Result does not agree with experiment. • (iv) simula3on (ii), following 10 ms thermal
transient to 1123 K. ~ Minimal desorpKon from low T trap only.
• TMAP single layer model (ii) gives best result.
Base modeling co-‐deposit D2 release.
Measured D/Be agrees with integrated TMAP model release

PISCES
Base modeling co-‐deposit D2 release.
• Good agreement between TMAP single Be layer model (ii) and TDS data acquired with different hea3ng rates in the range 0.1 – 1.0 K.

PISCES
Using TMAP to model Bake-‐Out Exp. TMAP models bake-‐out, but kr must be adjusted as in Longhurst et al. JNM 258–263 (1998) 640, by the factor, [1+exp(cD/A)], where cD is the D conc. in the near surface, and A is a constant. Sharp fall (F) and rise (R) are beRer modeled as a result.
• TDS data (symbols) for 1 & 5 h fixed temp bake at 513 K.
• Lines – TMAP
• tb varied up to 25 h
• Data collected for 513 K and
623 K bakes.
ini3al D release
513 K bake release
D les aser 1 & 5 h

PISCES
D Inv. les aser bake: Exp & TMAP.
• Experiment (symbols) & TMAP (solid line) shows remaining D in 1 µm thick co-‐deposit falling significantly in ~1 day at ITER bake-‐out temperatures of 513 K & 623 K.
• TMAP output (dashed lines) are other layer thicknesses, 0.2, 5 and 10 µm.
• Thick layers require longer bake-‐out in TMAP simula3ons as a consequence of high trap concentra3on (analogous to reduc3on in diffusivity).
• Bakes longer than ~1 day are increasingly ineffec3ve.
PISCES
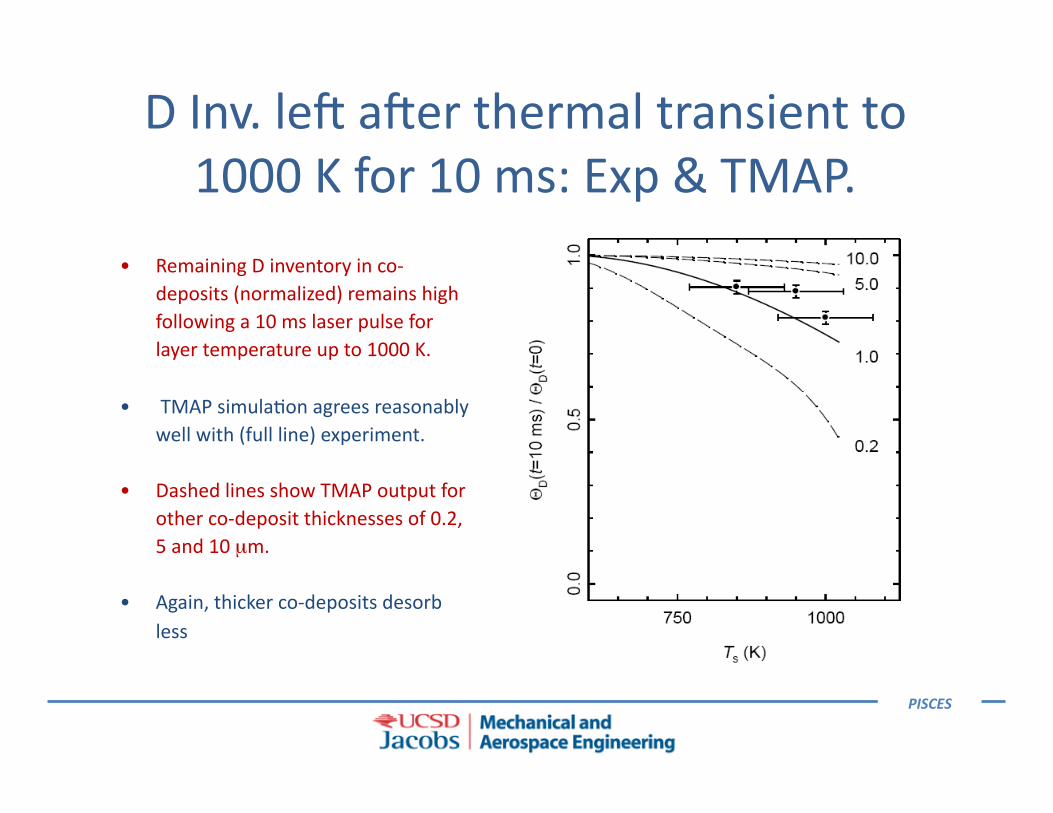
• Remaining D inventory in co-‐deposits (normalized) remains high following a 10 ms laser pulse for layer temperature up to 1000 K.
• TMAP simula3on agrees reasonably well with (full line) experiment.
• Dashed lines show TMAP output for other co-‐deposit thicknesses of 0.2, 5 and 10 µm.
• Again, thicker co-‐deposits desorb less
D Inv. les aser thermal transient to 1000 K for 10 ms: Exp & TMAP.

PISCES
• The efficacy of 1) bake-‐out at 513 & 623 K, and 2) thermal transient (10 ms) loading to up to 1000 K, is explored for reducing D inventory in 1 µm thick Be–D codeposited layers.
• A single layer TMAP model u3lizing traps with ac3va3on energies, 0.80 & 0.98 eV yields good agreement with measured codeposit release behavior.
• TMAP modeling results agree well with release behavior over a span of eight orders of magnitude in hea3ng rate, providing some confidence in the ability to extrapolate the modeling to other codeposit thicknesses.
• TMAP modeling suggests that thick built-‐up co-‐deposits will hinder ITER inventory control, and that bakes are more effec3ve in reducing inventory than higher temperature transient thermal loads.
• Thickness predic3on will be confirmed by addi3onal experiments.
Summary