tm snap-micro i - educational stem toys | snap circuits ...€¦ · snap-micro i instruction manual...
TRANSCRIPT

SNAP-MICRO I
Instruction manual
Elenco® Electronics Inc.
TM
Rev C

1
Index to Pages 2. About This Manual 3. SECTION 1: ELECTRONIC COMPONENTS 4-6 Connectors, Resistors, Switches, Diodes, Motors, Speakers, Transistors, and U8 the Integrated Circuit Module 7 What is a Micro-Controller? 8 SECTION 2: PROGRAMMING & SNAP CIRCUIT
® BASICS
8-10 Installing Software and Programming Cable 11-14 Building the Micro-Controller Circuit 15-19 PROJECT 1: Flow Chart Programming and Snap Circuit Basics
20-23 Testing A Flowchart Program 24 PROJECT 2: Adding Amplifier and Loudness Control 26 PROJECT 3: Comments and Program Length
30 PROJECT 4: Other Sounds 32 PROJECT 5: The Tune Wizard 35 PROJECT 6: Robotic Sounds
37 PROJECT 7: Switches and Digital Inputs 39 PROJECT 8: Counting and Displaying Events 42 PROJECT 9: Using Serial Terminal
44 PROJECT 10: Using Serout, Serin, and Terminal Window 47 PROJECT 11: Checking for Errors 48 PROJECT 12: The DC Motor/Generator
50 SECTION 3: PROGRAMMING FOR SNAP CIRCUITS®
50 PROJECT 13: The Flying Saucer 52 PROJECT 14: Analogue Sensors and Analog to Digital Conversion (adc)
56 PROJECT 15: Auto Calibrating Digital Voltmeter 59 PROJECT 16: Battery Tester 61 PROJECT 17: The Photo Resistor
63 PROJECT 18: Introduction to Data Loggers 66 PROJECT 19: Green Power Meter or An Energy Cost Data Logger 70 PROJECT 20: Audio Amplifier and Microphone
72 SECTION 4: AUDACITY®*
& SOUND CIRCUITS 72 PROJECT 21: Audacity
®
74 PROJECT 22: Investigating Sound of Clapping
77 PROJECT 23: The Clap-Data Program 80 PROJECT 24: Analyzing Clap Data 82 PROJECT 25: The Clap it ON, Clap it OFF Circuit
* Audacity is a registered trademark of Dominic M Mazzoni, South Pasadena, CA

2
About this manual
The Snap Circuit Micro-Controller manual is designed to quickly move the user into the world of micro-controllers without any heavy mathematics or science background. All that is required is a computer with a Windows XP
® / 2000
® / 98 / 95 operating system and the Elenco
® SCM400 starter kit.
The manual is divided into four separate sections: Section 1 - Getting Started (Electronic Components) Section 2 – Flow chart programming and Snap Circuit
® basics
Section 3 - Programming for Snap Circuits®.
Section 4 – Audacity® and Sound Circuits.
The first section provides general information for getting started with Snap Circuits
® and the program
editor. No prior understanding of micro-controllers is required. Most electronic components will be explained using comparisons to easy to understand water pipe systems. In Section 2, a series of easy to follow tutorials introduce the main features of both Flow Chart programming and the Snap Circuit
®
system. In Section 3, the programming is extended to control some clever and practical Snap Circuits®.
In Section 4 an audio recording and editing program is introduced and used to gather data. This data is then used to control a light with the sound of a clap. The software used for programming the micro-controller is called the ‘Programming Editor’, and will be downloaded in Section 2. The programs that are used in this manual are in the Elenco
® extracted files folder.
For more specific information on flow chart programming, syntax and examples of each BASIC Command please see sections 1 & 2 ‘Getting Started & BASIC Commands’ located in the help file of the programming editor. For more advanced micro-controller circuits that do not use Snap Circuits
®, and
example programs, please see ‘Interfacing Circuits’ in the help file of the programming editor. If you have a question about any command please post a question on the forum at www.picaxe.co.uk For more information on Snap Circuits
® or electronic components please run the water pipe analogies
included in the Elenco® extracted files folder or visit the websites at www.elenco.com,
www.snapcircuits.com or www.emailschool.com.

3
Single Spacer (4)
2 Space connector (9)
3 Space Connector (4)
4 Space Connector (3)
5 Space Connector (1)
6 Space Connector (1)
7 Space Connector (1)
Resistor 1000
Ohms or 1k Ohms
(2)
Resistor 10,000
Ohms or 10k Ohms (2)
Resistor 100 Ohms (1)
LED Color Green (1) LED Color Red (1)
Slide Switch (1)
Jumper Wires (2) Black & Red
4.5 Volt Battery (1)
8 Pin Socket U21 with micro installed (1)
USB Programming
Cable (1)
SECTION 1: ELECTRONIC COMPONENTS
8 Ohm speaker (1)
Variable Resistor (1)
NPN Transistor (2)
Resistor 100,000 Ohms or 100k
Ohms (1)
DC Motor (1)
Fan Blade (1)
Pushbutton Switch (1)
microphone (1) Light Dependent Resistor (1)
Base Grid Clear (1)
B
C
D
E
F
2 3 4 5 6
A
G
1 7 8 9 10
Computer Interface Cable (1)
100uF Capacitor (1)

4
ELECTRONIC COMPONENTS
First, consider voltage to be pressure on electrons to make them move in a wire. This is similar to water pressure in a pipe to make the water move. For voltage we will use the symbol ‘V’ (volts). Next consider the movement of electrons in a wire to be similar to the water moving in a water pipe. This movement of electrons (or water) is called current and is represented by the symbol ‘I’ and measured in
units called amperes or amps. Finally, let the friction of the wire (or water pipe) that tries to stop the current from flowing be called
resistance. For resistance we will use the letter ‘R’ or the Greek symbol (Ohm).
The ‘# Space Connector’ is really a wire or water pipe with close to zero resistance to current flow. The # represents the number of bumps on the grid will be shorted. For example, a ‘3 Space Connector’ covers 2 spaces and shorts (allows current to flow easily between) 3 bumps.
The Resistor limits the flow of current. The more resistance, the less current will flow at the same pressure applied. For example, if a 10,000 Ohm or 10k resistor is placed across a 4.5 volt
battery less current will flow through it than if a 1k was placed across the same battery. To help understand this principal, consider the following; A water pipe filled with rocks would offer some resistance to the flow of water. A water pipe filled with sand would offer a greater resistance to the water flow. Water pipes filled only with water provide almost zero resistance to the flow of water. Most of the current will take the path of least resistance as shown here.

5
The Variable Resistor ‘RV’ is really a resistor with a wiper arm that can slide from one side of the resistor to the other side. As the wiper moves toward either end, the resistance between the wiper and that end is reduced.
The Switch ‘S1’ is equivalent to a zero Ohm resistor when it is ON, and an infinite Ohm resistor when it is OFF. The LED (Light Emitting Diode) ‘D1’ is similar to a check valve in series with a light. Most diodes act similar to water pipe check valves and must be installed in the correct direction for current to flow. Consider the water pipe check valve shown on the right. When the piston pushes water into the pipe the check valve opens and water flows as shown. When the piston tries to suck water from the pipe the check valve closes and no current flows through the check valve. Light is produced whenever current flows through the LED check valve. The stronger the current in the LED, the brighter the light. If the LED is installed with the + symbol connected to the negative voltage or ground the current cannot flow and the LED will be off. The DC Motor converts a DC voltage to a rotation. The direction of the rotation depends on the polarity of the voltage.
+

6
Build the circuit shown below. Snap Circuit® Boards are built one level at a time. The base grid is
considered to be level 0. Parts placed directly on the base grid are said to be on level 1 and will have a small black 1 next to the part. Parts placed on level 1 parts are said to be on level 2 and will have a small black 2 next to the part. This process is continued until all parts are installed.
1. Turn Switch S1 to ON and the LED should glow red. Turn S1 to OFF.
2. Turn D1 around so the + is on the switch side and repeat step 1. In this case the LED should be dark and never glow. Turn Switch S1 to OFF and replace LED ‘D1’ in the original position.
3. Replace the 1k resistor ‘R2’ with a
100 resistor ‘R1’. The LED ‘D1’ should be brighter when Switch ‘S1’ is turned ON. Lower resistance produces more current, and more current makes LED’s glow brighter.
4. Use this circuit to test LED’s, resistors, and switches S1 and S2.
The SPEAKER ‘SP’ is actually an 8 speaker that can be used to produce audible tones. The NPN Transistor ‘Q2’ is a device that amplifies current. For example, a small current from base to emitter will produce a much larger current from collector to emitter. The NPN connections are labeled collector, base, and emitter as shown here.
B
C
D
E
F
2 3 4 5 6
A
G
1 7 8 9 10
1
1
2
2
BASE
EMITTER
Similar device in water pipe system
COLLECTOR

7
The U21 Snap Circuit® module is designed to accept any 8 pin integrated
circuit. If not already installed, remove the 8 pin integrated circuit (micro-controller chip) from its package and carefully install it as shown here
Make sure the dot on the integrated circuit and the red dot on the socket are in the same corner. The red numbers printed on this picture correspond to the integrated circuit leads on the part. The blue numbers are printed on the socket platform and are the pin numbers used by the programming editor. In all situations we will use the blue numbers in this picture to reference the output or input pin.
WHAT IS A MICRO-CONTROLLER? A micro-controller is a ‘computer-on-a-chip’. It’s an integrated circuit that contains memory, logic, processing, and input/output circuitry. Micro-controllers are programmed with specific instructions to control many different devices. Once programmed the micro-controller is built into a product to make the product more intelligent and easier to use. For example, a microwave oven uses a single micro-controller to process information from the keypad, display user information on a display, and control the turntable motor, light, bell and cooking time. One micro-controller can often replace a number of separate parts, or even complete electronic circuits.
Applications that use micro-controllers include household appliances, alarm systems, medical equipment, vehicle subsystems, musical instruments, and electronic instrumentation. Some modern cars contain many micro-controllers used for engine management and remote locking.

8
INSTALLING SOFTWARE AND PROGRAMMING CABLE
1. Install the Programming Editor software by running file CDStarter.exe in the Elenco® extracted files
folder, pick that option from the menu, and follow the instructions.
2. Insert the USB programming cable into a USB port on your computer. The cable will configure itself automatically. If you have problems with configuration then contact Elenco
®.
3. Start the Programming Editor software by clicking on the Program Editor Icon.
SECTION 2: PROGRAMMING & SNAP CIRCUIT BASICS

9
When the program opens click the “view” menu and then the Options menu to display the Options panel (this may also automatically appear on startup). On the ‘Mode’ tab select the 08M2 microcontroller.
If this box is checked the “Options” menu will open every time the program is started.

10
On the ‘Serial Port’ page also select the appropriate serial COM port (the port where you connected the USB programming cable).
If you do not know your COM port number, click ‘Setup’ and find it under Ports or USB devices. The above windows may appear different depending on the contents of the file folders and the version of windows being used. The “Options” window should remain as shown but with different COM numbers depending on the port or plug used. If cables are move to different ports the option window may have to be changed to match the port being used. Note that the USB programming cable includes USB-to-serial interface. Click “OK” to return to editor program.

11
BUILDING THE MICRO CONTROLLER CIRCUIT
1. Snap Circuit® Boards are built one level at a time. The 70 post base grid is considered level 0.
2. Parts placed directly on the base grid are said to be on level 1 and will have a small black 1 next to the part.
3. Parts placed on level 1 parts are said to be on level 2 and will have a small black 2 next to the part. 4. The above process continues until all levels are completed. 5. Build level 1 for the Micro Controller Circuit shown here:
B
C
D
E
F
2 3 4 5 6
A
G
1 7 8 9 10
1
1
1
1
1

12
6. Add level two to the grid.
B
C
D
E
F
2 3 4 5 6
A
G
1 7 8 9 10
1
1
1
1
2
2
2
2
2
1
2
13
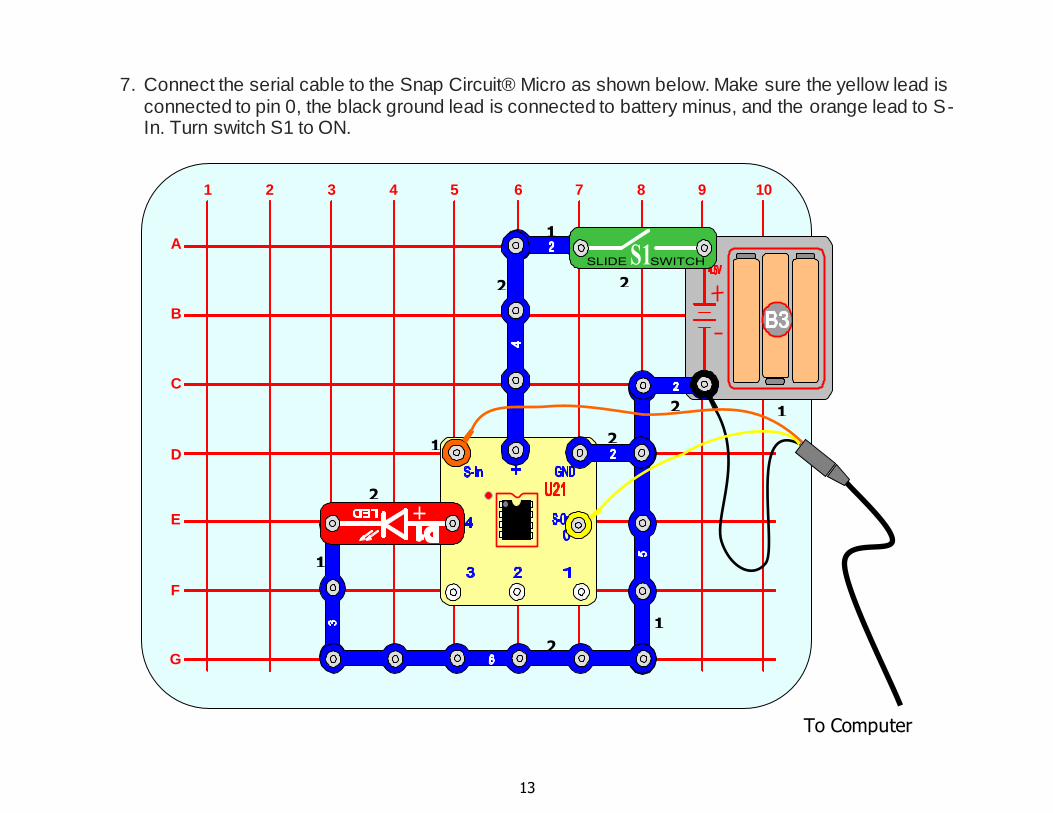
7. Connect the serial cable to the Snap Circuit® Micro as shown below. Make sure the yellow lead is connected to pin 0, the black ground lead is connected to battery minus, and the orange lead to S-In. Turn switch S1 to ON.
B
C
D
E
F
2 3 4 5 6
A
G
1 7 8 9 10
1
1
1
1
2
2
2
2
2
1
2
To Computer

14
8. Using the program editor software, type in the following program:
9. Click the Program button to download the program to the hardware. After the download the output LED should flash on and off every second. Congratulations! You have just programmed a micro-controller integrated circuit to make an LED blink. Do not remove parts from the grid they will be used in the next section. You may remove the Programming Cable now. Take note that turning the S1 switch ON and OFF does not lose the programming. Turn the switch off to save battery power.
You can check your program by clicking the Syntax Check button (ABC with a check mark on it). If Syntax is correct proceed to step 9.
15
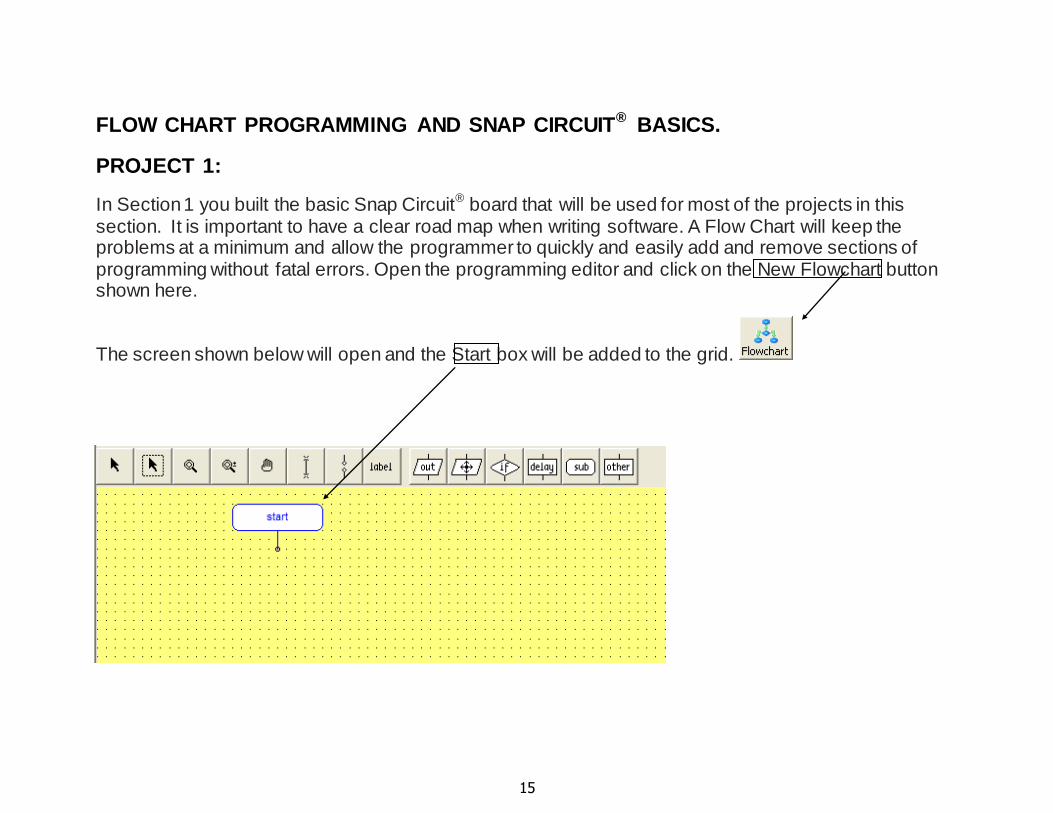
FLOW CHART PROGRAMMING AND SNAP CIRCUIT® BASICS.
PROJECT 1:
In Section 1 you built the basic Snap Circuit® board that will be used for most of the projects in this
section. It is important to have a clear road map when writing software. A Flow Chart will keep the problems at a minimum and allow the programmer to quickly and easily add and remove sections of programming without fatal errors. Open the programming editor and click on the New Flowchart button shown here.
The screen shown below will open and the Start box will be added to the grid.

16
Our first flowchart project will be to play the melody to Happy Birthday with and without flashing lights.
Next, click the right mouse button to activate the select arrow . Select the play box and drag it to the start as shown on next page.
First click the ‘out’ button. The menu bar will change to this
Click on the ‘Play’ Button and add this box to the chart by dragging down and clicking left mouse button.

17
The Play command has the following functions (Syntax) ` Function:
Play an internal tune on output pin 2.
PLAY tune, LED The tune constant (0 - 3) specifies which tune to play as follows; 0 - Happy Birthday 1 - Jingle Bells 2 - Silent Night 3 - Rudolph the Red Nosed Reindeer LED is a constant (0 -3) that specifies outputs that flash as the tune is being played as follows; 0 - No outputs 1 - Output 0 flashes on and off 2 - Output 4 flashes on and off 3 - Output 0 and 4 flash alternately
The tune and LED constants can be changed in the edit box at the bottom of the program editor screen when the play box is active. After the tune plays, there should be a
few seconds of delay and then the tune should play again. Return to the previous menu by clicking the curved arrow button . Now click the delay button and use the previous technique to add the wait box.

18
WAIT Function:
Pause for some time in whole seconds. Syntax:
WAIT seconds - Seconds is a constant (1-65), which specifies how many seconds to pause. Information:
This is a ‘pseudo’ command that is equivalent to ‘pause’ times 1000, This command cannot be used with variables and is a fixed delay installed during programming. To change the delay due to an input or other information, use the Pause command. Use the edit box at the bottom left corner of the program editor window to change the time to 5 seconds. Next, the loop needs to be closed. Note: The “Wait” box must be selected. Click the return button to get back to the main menu and select the Draw Lines tool.
Use the ‘Draw Lines’ tool to make the flowchart on your program editor the same as the one shown on the next page.

19
TESTING A FLOWCHART PROGRAM
Before running a simulation for the first time the program editor should be adjusted as follows: First click View in the headings and then select Options. When the window below opens, select the Editor tab.
Set the following: Text Mode to ‘Color Syntax’ Compiler to ‘Enhanced’ Color Syntax Mode Options as shown here. Exit the options screen by clicking the OK button on the bottom.

20
Every flowchart program should be tested and saved before it is converted to a down-loadable basic program. Make sure your audio is turn on and at a level you can hear, then click on the Simulate button.
Flowchart Simulation The program will start running and the current block running will be highlighted in red. The output pin will turn green while the song is playing. The RST button will reset the program to start when clicked. The other features of the Flowchart simulator will be explained later as they are used. End the simulation by clicking anywhere on the grid. After the Flowchart program has been tested it should be saved in a folder on your computer where all your Snap Circuit
® programs should be
stored. In these examples the folder C:\SC MICRO PROJECTS was created for this purpose. Open the drop down menu under ‘File’ in the program editor and click on ‘save as’ to save the flowchart program in your Snap Circuit
®
folder as shown on next page.

21
After filling in the proper information the window should appear as shown on the left. Click on the ‘Save’ button. The flowchart program will be stored and the save window will close.
On the program editor screen, under the PICAXE
®
heading click on the ‘Convert Flowchart to Basic …’ command. The following screen will appear. Open the simulator again by clicking on the Simulator button. The song should play.
These Label numbers will be identical but may be
different from the ones shown here.

22
Program Flow Control and Breakpoints Three new buttons appear on the main simulation panel. They are shortcut buttons for the Simulation
menu functions. } single step through the simulation
| | pause the simulation at the current line > start [ ] stop the simulation
Breakpoints can be placed or removed from the program by clicking on the line number in the margin. Alternately the Toggle breakpoint under the Simulate heading may be used to insert/remove a breakpoint at the current cursor position. Breakpoints are indicated by a red bar in the margin.
The >> button displays the variables panel.
Other Simulation Options will be discussed and demonstrated in future
projects as they are used. To end the simulation click the yellow simulate button in the menu line at the top of the screen. Rework your Snap Circuit board to the circuit shown on the next page.
23
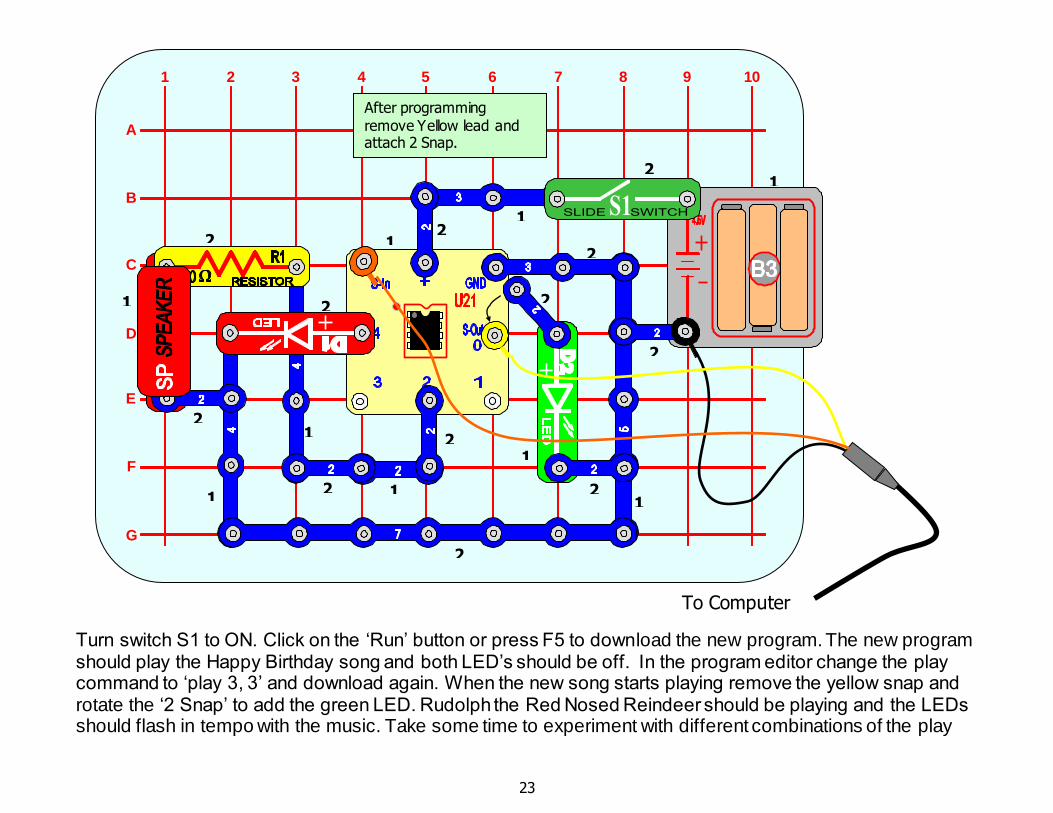
Turn switch S1 to ON. Click on the ‘Run’ button or press F5 to download the new program. The new program should play the Happy Birthday song and both LED’s should be off. In the program editor change the play command to ‘play 3, 3’ and download again. When the new song starts playing remove the yellow snap and rotate the ‘2 Snap’ to add the green LED. Rudolph the Red Nosed Reindeer should be playing and the LEDs should flash in tempo with the music. Take some time to experiment with different combinations of the play command.
To Computer
B
C
D
E
F
2 3 4 5 6
A
G
1 7 8 9 10
After programming remove Yellow lead and attach 2 Snap.
1
2
1 1 1
1
1
1
1
1 2
2
2
2
2
2
2
2
2
2
2

24
PROJECT 2: ADDING AMPLIFIER & LOUDNESS CONTROL
Modify the Snap Circuit® from the previous project to look like the circuit below. The variable resistor RV
will be used to increase and decrease the audio level. The NPN transistor ‘Q2’ is used to amplify the power to the speaker ‘SP’. LED ‘D2’ is still disconnected during programming but will flash if the Yellow programming wire is removed and the ‘2 Snap’ is connected to S-Out or pin 0.
Assuming the micro-controller is still programmed to play and flash the lights, connect the ‘2 snap’, switch ‘S1’ to “ON” and test the circuit. Use the loudness control to adjust audio level for desired loudness.
B
C
D
E
F
2 3 4 5 6
A
G
1 7 8 9 10
After programming remove Yellow lead and attach 2 Snap.
1 2
1
1
1
1
1
1 1
1
2
2
2 2
2 2
2
2
2
2
2
2
3
2
1
3
To Computer
2
1

25
The advantage of a micro-controller is that the circuit need not change to produce different audio ef fects. By modification of the program, all four songs can play, one after the other. Consider the flowchart program shown below.
In the flow chart shown on the left each song is played one after the other with a 5 second delay between each song. Open the program editor and draw this flowchart. Use the simulate button to test that the program plays the songs and pauses for 5 seconds between each song. If the Flowchart passes the simulate test save it in your project folder.
Under the PICAXE
® heading click on the ‘Convert Flowchart to Basic….’ command. The following
screen should appear;

26
Project 3: The Value of Comments and Checking Program Length Sometimes it can be hard to remember the purpose for each step of the program. Comments (an explanation after the apostrophe (‘) symbol) can make each line of a program much easier to understand and remember. These comments are ignored by the computer when it downloads a program to the micro-controller. A label (e.g. main: in the program above) can be any word (apart from keywords such as ‘switch’), but the label must begin with a letter. A label must also end with a colon (:). The colon ‘tells’ the program editor that the word is a label. The previous program uses the wait command. The commands wait and pause both create time delays. However wait is used with whole seconds, pause can be used for shorter time delays (measured in milliseconds or 1000th of a second). Wait must be followed by a number between 1 and 65. Pause must be followed by a number between 1 and 65535. It is also a good programming technique to use tabs (or spaces) at the start of lines without labels so that all the commands are neatly aligned. The term ‘white-space’ is used by programmers to define tabs, spaces and blank lines, and the correct use of white-space can make the program listing much easier to read and understand. Note these changes made to the previous program and shown here.

27
Checking Program Length.
As programs become complex it is possible the micro-controller will run out of memory to store the program. Check the previous program length by clicking the ‘Syntax Check’ button.
If there are no programming errors the Success window will open and show the amount of memory used
by the program.
To play all 4 songs and flash both lights, this program used 32 bytes out of 256 or 12.5% of the total memory. Remove the ‘2 Snap’ on U8 (S-Out or Pin 0) and connect the red programming wire. Download this program. Then reconnect the ‘2 Snap’ and run the program.
The fact that four ‘Play’ commands are followed by four ‘Wait’ commands indicates this program could use variables and a ‘for … next’ loop. The ‘for … next’ loop does not have a standard flowchart box but can still be programmed using the flowchart system as shown on the next page.

28
Open the flowchart window and click on the ‘other’ button to open this screen.
Use the ‘…’ button to create an empty box. Edit the box in the BASIC window to contain the command “for b0 = 0 to 3”.
Next add the ‘Play’ and ‘Wait’ commands and then use the ‘…’ button to create the ‘Next’ box. Finish the flowchart as shown here.
Convert flowchart to a basic program using the PICAXE
® menu. The basic program
should look similar to the one shown here.

29
Edit the basic program to use the variable b0.
Start the simulation by clicking on the simulate button or pressing <CRTL> and F5 Keys at the same time.
Open the variables panel by clicking on the >> button.
As the program runs the variable b0 will change in value from 0 to 3. This value is used to change the song to be played.
Check the program length by clicking on the ‘syntax check’ button and the success window should open. This program uses only 18 bytes out of 256 or 7% of the total memory. By using a loop we have saved over 5% of the memory. Good programming will use the minimum amount of memory and accomplish the same task as longer programs.

30
Project 4: Other Sounds The ‘sound’ command
Syntax:
SOUND pin,(note,duration,note,duration...) - Pin is a variable/constant (0-4), which specifies the i/o pin to use. - Note(s) are variables/constants (0-255) which specify type and frequency. Note 0 is silent for the duration. Notes 1-127 are ascending tones. Notes 128-255 are ascending white noises. - Duration(s) are variables/constants (0-255) which specify duration of the note (multiples of approx 10ms). Function: Play sound ‘beep’ (1-127) or noises (128-255). Information: Frequency and duration must be used in ‘pairs’ within the command.
Draw the flow chart shown above. Use the ‘other’ button and the ‘…’ box to create the ‘inc b0’ box. The ‘Sound’ command is under the ‘out’ menu. Be sure to edit the sound command to “sound 2,(b0,1)”. Use the IF button and the var box to create the “b0>127” box. Save the flowchart for your reference and convert it to a basic program. The converted program should be similar to the one shown on the left. This program is 20 bytes long and looks a
little confusing. Try editing the program to appear as shown on the next page.
N Y

31
This program is 2 bytes less and much easier to read with less jumping and only one label. Of course the comments will help later when you edit this for different applications.
It is a good practice to build up a library of small sub routines and then use them in different applications when they are needed. The more information stored in the library the easier it will be to import and use these routines later. If you run a simulation of this program it will take a long time for the b0 variable to
reach 127. Open the variable panel, pause the program, and double click on the b0 to change it to 115. Restart the program and watch the b0 variable loop between 110 and 127. In simulation the sound command does not play the frequency. Instead a ‘Beep’ is produced to let you know a sound command was executed. After down loading the real sounds will be heard. Save program to your library then download it to play special effect sound. Close file.
1.Pause & Start Button 2.Double Click b0 3.Edit to 115

32
Project 5: The Tune Wizard
The Tune Wizard allows musical tunes to be created for the micro-controller. Tunes can be entered manually or imported from another source. These tunes or ring tones are also available on the Internet, and used on some cell phones. The tunes created by this micro-controller can only play one note at a time (monophonic). The micro-controller cannot play multiple note (polyphonic) ring tones found also on the Internet. There are many tunes for free on websites like: www.ringtonerfest.com www.free-ringtones.eu.com www.tones4free.com
To start the Tune Wizard click the PICAXE® menu, then open
Wizards, and click on Ring Tone Tunes.
Start by opening a tune that already is on your computer. Click on the File menu and select ‘Open’. Find the Program Editor directory and open the Christmas_1 folder as shown here. Open this folder (you may have to unzip first time) and find the tune “Santa clause is coming to town” and select it. The wizard should load all the notes.

33
After the song is loaded into the wizard, click on the Copy button to open the copy window. Answer yes to paste the tune directly into your program or a new program if one is not open. The following information will now appear in your program. 'Santa clause is coming to town tune 0, 4, ($60,$64,$65,$27,$E7,$67,$69,$6B,$00,$C0,$64,$65,$27,$27,$27,$69,$67,$25,$E5,$24,$27,$20,$24,$22,$E5,$2B,$A0, $60,$64,$65,$27,$E7,$67,$69,$6B,$00,$C0,$64,$65,$27,$27,$27,$69,$67,$25,$E5,$24,$27,$20,$24,$22,$E5,$2B,$80)
The above tune will all be on one line in the program. Close the PICAXE
®
Tune Wizard window and run a syntax check that will show the tune added 85 bytes to the program! OUCH! That is a great deal of memory for just one tune. Play the tune by clicking the simulate button.
Notice how the first line in the tune above is identical to the line beneath it except for the last note. Redundancy in programming is a waste of memory. Change the tune section of your program by typing in or deleting the information on your screen to match the following; 'Santa clause is coming to town reworked Main: inc b0
tune 0, 4,($60,$64,$65,$27,$E7,$67,$69,$6B,$00,$C0,$64,$65,$27,$27,$27,$69,$67,$25,$E5,$24,$27,$20,$24,$22,$E5,$2B) if b0 < 2 then tune 0, 4, ($A0)
goto main else tune 0, 4,($80) end if
A syntax check will show this section is 65 bytes, or a savings of 20 bytes of memory. The tune will play correctly after down load but may have a few pauses when played by the simulator.

34
The easiest way to import a ring tone from the Internet is to find the tune on a web page. Highlight the RTTTL version of the ring tone in the web browser, and then click Edit>Copy. Move back to the Tune Wizard and then click Edit>Paste Ring tone. To import a ring tone from a saved text file, click File>Import Ring tone. Once the tune has been generated, select whether you want outputs 0 and 4 to flash as the tune plays (from the options within the ‘Outputs’ section). The tune can then be tested on the computer by clicking the ‘Play’ menu. The tune played will differ slightly due to the different ways that the simulator generates and playback sounds. Once your tune is complete, click the ’Copy’ button to copy the tune command to the Windows clipboard. The tune can then be pasted into your main program. Tune Wizard menu items: File
New Start a new tune Open Open a previously saved tune Save As Save the current tune Import Ring tone Open a ring tone from a text file Export Ring tone Save tune as a ring tone text file Export Wave Save tune as a Windows .wav sound file Close Close the Wizard
Edit Insert Line Insert a line in the tune Delete Line Delete the current line Copy BASIC Copy the tune command to Windows clipboard Copy Ring tone Copy tune as a ring tone to Windows clipboard Paste BASIC Paste tune command into Wizard Paste Ring Tone Paste ring tone into Wizard
Play Play the current tune on the computer’s speaker Help Start this help file.

35
Project 6: Robotic Sounds
This project explains the use of the random command and labels. Open your flowchart grid and construct the following flowchart.
The random box can be found under the ‘other’ menu. Use the ‘label’ button to add notes to help explain each section of the flowchart. A good practice is to create a word document with both flowchart and basic program side by side. These labels help tie the two charts together. When you test your flowchart with simulate, blocks should turn red as the program loops. A beep should be heard when the sound block turns red. If no errors occur, save the flowchart to your library. Use the PICAXE
®
drop down menu to convert this chart to a basic program. The result should be similar to the one shown here.

36
The next picture shows the same basic program after changes and editing to make it more readable.
MAKING WORD DOCUMENT FOR YOUR LIBRARY: Using the screen capture feature in windows (Print Screen Key) and the picture editor in “Word”, a document similar to the box below can be created and stored in your library for future use.
RANDOM TONES USED FOR ROBOTIC SPEECH.

37
Project 7: SWITCHES AND DIGITAL INPUTS
Digital Inputs A digital input can only be ‘on’ or ‘off’. Some examples of a digital inputs found in Snap Circuits
® are:
• Push Button Switch Always ‘OFF’ when released • Slide Switch Stays ‘ON or ‘OFF’ after switching. Most switches use a metal contact that snaps into place. This action may cause the switch to bounce and produce “switch noise” when it is closed. The program below should change the state of the LED each time the Push Button switch is pressed. In this program output pin 4 toggles (changes state) every time the push switch on input pin 3 is pressed. Using the Program Editor construct the flowchart shown here. Then use the PICAXE
® menu to convert it
to a program similar to the program on the right. When the program on the right was edited for clarity, the ‘pause 100’ was added as a note. This should be made a command by removing the apostrophe in front of the “pause” if the switch is very noisy when pressed or released.
Save program, then build circuit on next page.

38
Load the program into the micro-controller. As shown in the flowchart, the first two lines make up a continuous loop. If the input is off (=0) the program just loops around between program lines numbered 7 and 8 on the left side of the program. If the switch is on (=1) the program jumps to the label called ‘BX’. The state of output pin 4 is toggled and then the program drops into a second continuous loop that waits for the button to be released. After the button is released the program jumps back to the beginning and waits for the next push. Take note that only a label command follows the “then” in the “if” statement. No other words apart from a label are allowed in this position. Keep circuit for next project.
B
C
D
E
F
2 3 4 5 6
A
G
1 7 8 9 10
1
1
1
1
2
2
2
2
2
To Computer
1
2
2 2
2
2
3
1
1
1
1
2

39
PROJECT 8: COUNTING AND DISPLAYING EVENTS Modify the previous circuit to look like the one shown below.
Create the flowchart and program shown on the next page.
B
C
D
E
F
2 3 4 5 6
A
G
1 7 8 9 10
1
1
1
1
2
2
2
2
2
To Computer
1
2
2 2
2
2
3
1
1
1
1
2
2

40
debug Syntax: DEBUG {var}
- Var is an optional variable value (e.g. b1).
Function: Display variable information on computer in Debug Window
The debug command uploads the current variable values for all the variables via the download cable to the computer screen. This enables the computer screen to display all the variable values in the micro-
controller for debugging purposes.
Note that the debug command uploads a large amount of data and so significantly slows down any program loop.
1. Make the flowchart shown on left. 2. Use PICAXE drop down menu to convert to basic
3. Edit program for clarity.
4. Go to next page for notes on running the program.

41
When you download the program the DEBUG window shown here should appear on your computer screen. The debug window opens automatically after a run, but can also be opened manually at any time using the PICAXE
®>Debug drop down menu. After
releasing the push button the red LED will come on while this window is being upgraded. The variable b1 is increased each time the switch is pressed and the red LED is off. Switch pressed 13 times If the switch is pressed and released quickly while the red LED is still on, the event will be missed. If it is only pressed and not released, then the event will be captured. Notice that the b1 variable value is shown in decimal (13), hexadecimal ($0D), and binary (%00001101). For now the decimal output will be all we need. Since the green LED is only ON during odd values of b1, the light should have been lit during values 1,3,5,7,9,11, and 13. The light has been turned on 7 times, off 6 times, and is presently on. Although we are using a light, the event could have been a switch to open a door, turn on a motor, start an oven, or any other event that would need monitoring. The Debug window is not very user friendly but there is another command ‘sertxd’ that can improve monitoring.
The same circuit will be used in the next project.

42
PROJECT 9 - Using Serial Terminal with Sertxd
The sertxd command sends a user defined serial string to the computer (at baud rate 4800). This can be displayed by the included Serial Terminal function under the PICAXE
®>Terminal drop down menu. The
Serial Terminal can also be automatically opened every time a download takes place by checking the “Open After Download” box in the View>Options>Editor drop down menu. No flow chart is needed in this project since we are only changing the ‘debug’ command to the ‘sertxd’ command. Open project 8 basic program in the editor and change it to the following.
All text must be placed in quotation marks and should appear in red (default color, but may be changed in program editor options.) 10 = line feed (LF) 13 = carriage return (CR) Variables need the # sign in front of them and will be displayed in purple.
To open the Terminal window use the PICAXE® drop down terminal or press F8 function key. The
terminal window shown on the next page will open.

43
Each time used, go to Options and set up as shown here; Make sure the Baud Rate is set to 4800. Each time the S2 pushbutton is pressed the micro-controller records the event and then transmits the message shown on the Serial Terminal. Notice how much faster this message transmits compared to the debug information. Try and press the pushbutton fast enough to miss an event. To make the transmission even faster, shorten the data to something like “S1= ”, #b1, “ times”, 13, 10. The first line was sent when micro-controller was first turned on after the terminal window was running. The second line in the program was transmitted when the switch was first pressed. Data can also be stored and not transmitted until required or asked for by main computer. The next project will use the terminal to send information to the micro-controller, process the information, and produce an output or result of the input.

44
PROJECT 10 - Using Serout, Serin, & Terminal Window
Build the circuit shown here.
B
C
D
E
F
2 3 4 5 6
A
G
1 7 8 9 10
1
1
1
1
2
2
2
2
To Computer
1
2
2
2
2
2
3
1
1
1
1
2 2
2
1
2
2
1 2
3
2

45
Open the program editor and make the following flowchart and program – Download the program and then turn off the micro-controller and move the serial input cable as shown on next page. Open the terminal window (F8). Turn the micro-controller on and the first song should
play. The LED will flash in time with the music. Adjust the loudness control for best level. Enter the song number 0-3 and click the Send button. The message “Press Pushbutton to hear Song” will appear in the Terminal Window. Press the pushbutton on the snap circuit board and the song you picked should play.

46
Final circuit for talking to terminal window. Orange wire moved.
Before doing project 11, try experimenting with the terminal window and dif ferent messages. Always check the amount of memory being used before a download. Turn power off, and move the orange lead back to the U21 (S-in) before downloading. After a download always turn power off before replacing the orange lead.
To Computer
B
C
D
E
F
2 3 4 5 6
A
G
1 7 8 9 10
1
1
1
1
2
2
2
2
1
2
2
2
2
2
3
1
1
1
1
2 2
2
1
2
2
1 2
3
2

47
PROJECT 11 – Checking for Errors
In the previous project a number greater than 3 would still play a song. Add this loop to the previous flowchart; If a number greater than 3 is entered the message “Too Big” will be displayed.
Use simulate to check flowchart, then convert to a basic program. Edit the basic program’s play command to (play b2, 2), and then check for program size and syntax errors. If syntax check is successful, download the program. What happens when a letter is entered? Since the terminal window will not accept letters, it is not necessary to send an error message.

48
PROJECT 12 – THE DC MOTOR/GENERATOR Brushes
Because DC motors use brushes and act as generators they may produce voltages that interfere with the micro-controller program. The DC motor provided with your Snap Circuits
® parts was picked to
reduce this problem. The following circuit will test the program while motor is running with and without a load. The following symbol is used to represent the DC Motor. Pay attention to the “+” sign since it will determine the direction of rotation when power is applied. Build the circuit shown on the next page and open the program editor to make the flow chart that follows. Convert flow chart to the basic program shown. Use only fresh alkaline batteries in this project.
A simple DC electric motor. When the coil is powered, a magnetic field is generated around the armature. The left side of the armature is pushed away from the left magnet and drawn toward the right, causing rotation.
The armature continues to rotate.
When the armature becomes horizontally aligned, the commutator reverses the direction of current through the coil, reversing the magnetic field. The process then repeats.
The information show n here was reproduced from the w eb site; http://en.w ikipedia.org/wiki/Brushed_DC_Electric_Motor#Simple_Tw o_Pole_DC_Motor

49
Motor Test Circuit
Download and run program with load (Fan) and without load. Time should be 10 seconds on each run. In some cases program may stop before 10 seconds due to noise or current from motor.
B
C
D
E
F
2 3 4 5 6
A
G
1 7 8 9 10
1
1
1 1
2
2
2
To Computer 1
2
2
2
2
1
1
2
2
+ sign here!
1
Fan blade used as load for motor

50
PROJECT 13 – THE FLYING SAUCER
Build the following Snap Circuit® … note the “+” on the motor.
B
C
D
E
F
2 3 4 5 6
A
G
1 7 8 9 10
After programming move orange snap.
1
1
1 1
2
2
2
To Computer 1
2
2
2
2
1
1
2
1
2
2
1
2
2
2
3
2
+ sign here!
2
2
1
1 1
2
After programming move orange snap to pin 1.
SECTION 3: PROGRAMMING FOR SNAP CIRCUITS®

51

52
PROJECT 14 – Analogue Sensors & Analogue to Digital Conversion (adc)
Analogue Sensors: An analogue sensor measures continuous signals such as light, sound level, position, or voltage. Common examples of analogue sensors are: • Variable Resistor (RV) • The “Photo Resistor” (RP) or “Light Dependant Resistor” (LDR) • Microphone (X1)
The variable resistor provides a varying voltage dependent on the center arm position. A voltage signal from 0 to 4.5 volts can be placed on pin 1 by adjusting the slider. The micro-controller converts this analog input into a digital number that can be represented by a decimal number in the
range 0 to 255 (8 bits) or 0 to 1023 (10 bits).
The photo resistor or light dependent resistor provides a varying voltage dependent on the amount of light. A voltage signal that changes with the intensity of light can be placed on a microchip input by using the photo resistor. The micro-controller converts this analog input into a number that represents the amount of light on the resistor.
The microphone provides a varying voltage dependent on the amount of sound present. A voltage signal that changes with the intensity of sound can be placed on a microchip input by using the microphone. The micro-controller converts this analog input into a number that
represents the amount of sound present.

53
readadc Syntax:
READADC channel,variable - channel is a variable or a constant that sets the input pin (1,2,or 4) - variable is the name of the variable that holds the converted data. Function:
Read the ADC channel (8 bit resolution) contents into variable. Information: The readadc command is used to read the analogue value from the micro-controller input pins 1, 2, or 4. The readadc command converts this value to an 8-bit variable. An 8-bit resolution analogue input will provide 256 different analogue readings (0 to 255) over the full voltage range (e.g. 0 to 4.5V). Note that not all inputs have internal ADC capability. Use the readadc10 command to read the full 10-bit value.
Convert to Basic, Program: main:
readadc 1, b0 w1=b0*4 high 4 pause w1 low 4 pause w1 goto main Enter the flow chart shown here into the program editor then build the circuit shown on the next page.

54
Download program and adjust RV for LED blinking rate.
B
C
D
E
F
2 3 4 5 6
A
G
1 7 8 9 10
To Computer
1
1
1
2
2
2
1
2
2
2
1
1
1
2
1
1
2
2
2
1

55
Edit the previous program to use 10-bit accuracy as shown here. readadc10 Syntax: READADC10 channel,wordvariable - channel is a variable or a constant specifying the input pin (1, 2, or 4) - wordvariable is the name of the wordvariable that holds the converted data. Function:
Read the ADC channel (10 bit resolution, 0 to 1023) contents into a wordvariable. Information: The readadc10 command is used to read the analogue value into the micro-controller with 10-bit accuracy. Since the result is a 10-bit number, a wordvariable must be used. Note that only input pins 1, 2, or 4 have internal ADC functionality. Download this new program and note the difference in program length and functionality. In some cases the 8 bit resolution is adequate to do the job, but when a finer resolution is required, use the readadc10 function.
8 Bit Conversion Program 18 bytes Delay between LED flashing increments by 4, for example;
0,4,8,12,16, ……..,1012,1016,1020
10 Bit Conversion Program 13 bytes Delay between LED flashing increments by 1, for example;
0,1,2,3,4,5,6, …… 1021,1022,1023

56
PROJECT 15 – Auto Calibrating Digital Voltmeter
The Snap Circuit
® shown above uses the base-emitter junction of transistor Q2 as a reference and
calibrates the internal A to D for correct voltage readings. This self-calibration technique eliminates the error that would occur as batteries discharge. It also eliminates A to D differences from circuit to circuit. After building this circuit, use the flow chart and download the program shown on the next page. Open the terminal window by pressing F8 or using the drop down under the PICAXE
® menu. Adjust the RV
slider for different voltages and press the S2 pushbutton to get a reading. When the slider is all the way up, the voltage will equal the battery voltage.
B
C
D
E
F
2 3 4 5 6
A
G
1 7 8 9 10
To Computer
1
1
1
2
2
2
1
2
2
2
1
1
1
2 2
2
2 1
1
2
2
1
3 2
1

57
Voltmeter Flowchart; In the Auto-Calibrate section the base-emitter voltage on Q2 is read on pin 2 of the micro-controller. Variable w6 is then adjusted for the correct reading. This is only calculated once each time the program is started. The RV voltages are then read on pin 1 of the micro-controller and calculated using variable w6. The digital number is formatted to read as a decimal and sent to the terminal display. The process will repeat after the pushbutton is pressed and released.
Since the “if” box in the flow chart does not support word variables, b11 was used with a note to make it “w2” after converting to basic. The number “74” in the “if” box should be changed to the number written on the back of Q2 in your kit. After converting and editing, the basic program should read as shown on next page.
Auto-Calibrate Section

58
Voltmeter Program;
Make sure baud rate is at 2400 when using terminal window. The variable w5 stores the reading between 0000 and 1023 that represents the reference voltage. If the battery voltage equals 4.5 volts and the reference voltage equals .74 volts the w5 variable should read (.74/4.5)x1023 or 168 (decimals not allowed). The highest number the micro-controller can use mathematically is 65,335. If the highest number for w5 is 1023, multiplying by 60 will not exceed this limit (1023x60=61,380). These larger numbers allow for two decimals in the final reading. The program then calculates the voltage at pin 2 using the number 80 for w6 as follows … w2=(w5 x 60) / w6 or VR = (168 x 60) / 80 or 126. Since the reference voltage is 74 (or .74 volts), the variable w6 is increased by 1 and the calculation is repeated. When the 74 number is calculated the variable w6 has been found and the micro-controller uses the 1 pin to measure voltages. By comparing the input voltages to a known reference many undesired variables can be eliminated.

59
PROJECT 16 – Battery Tester (Batteries under 4 volts)
The Snap Circuit
® shown above uses the voltmeter program to check batteries up to 4 volts. An error
message is added for voltages over 4 volts. Hold the battery to be tested in the position shown here, then press the S2 pushbutton to get a reading. Make sure the bottom of the red snap on the wire touches the + terminal of the battery, and the other side of the battery is pressed onto the ground snap. The battery will be loaded at 10 milliamps per volt during the test.
B
C
D
E
F
2 3 4 5 6
A
G
1 7 8 9 10
Over Voltage Check
To Computer
1
1
1
2
2
2
1
2
2
2
1
1
1
2 2
2
2 1
1
2
2
1
3
2
1
1 2
60
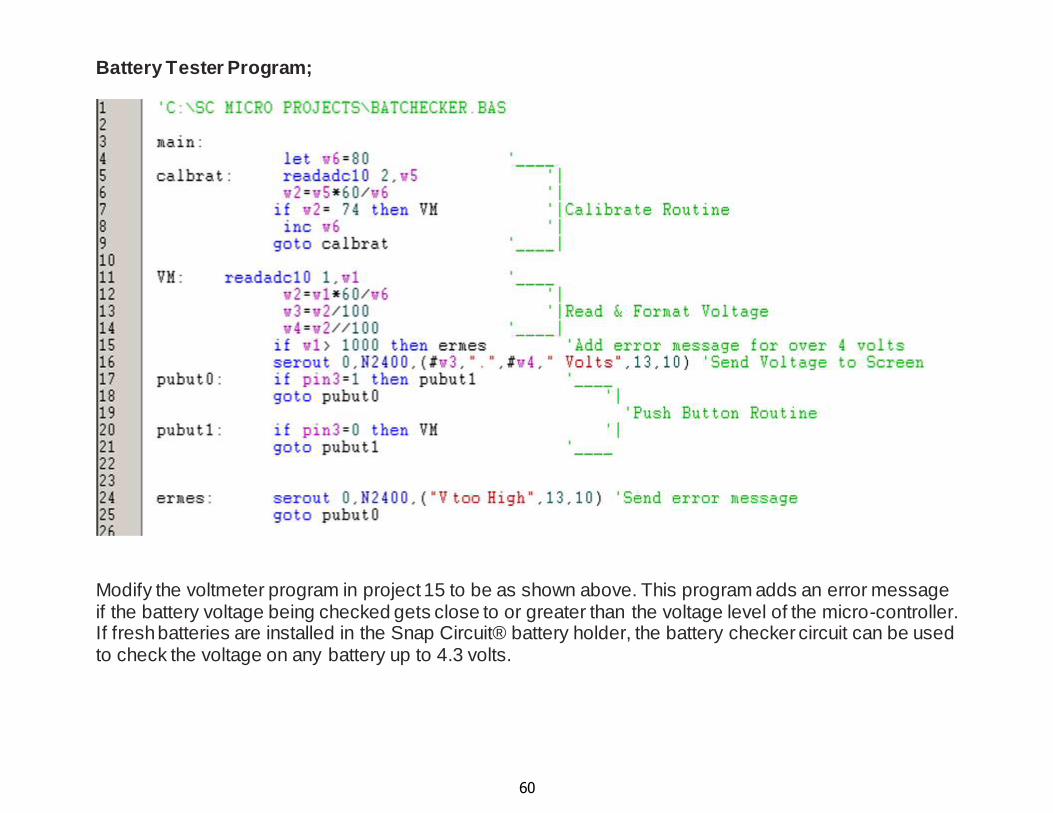
Battery Tester Program;
Modify the voltmeter program in project 15 to be as shown above. This program adds an error message if the battery voltage being checked gets close to or greater than the voltage level of the micro-controller. If fresh batteries are installed in the Snap Circuit® battery holder, the battery checker circuit can be used to check the voltage on any battery up to 4.3 volts.

61
Project 17, The Photo Resistor (RP) or Light Dependent Resistor
RP is an example of an analogue sensor that drops from a very high resistance to a low resistance as light is increased. It is connected between the micro-controller input pin 2 and ground. A 100k resistor from B+ to pin 2 allows the voltage on pin 2 to rise when it is dark and fall when there is light on RP. Build the snap circuit shown here. Next page shows program and flowchart.
B
C
D
E
F
2 3 4 5 6
A
G
1 7 8 9 10
To Computer
1
1
2
2
2
1
2
2
2
1
1
1
2
1 1
2
2

62
Draw the flowchart at the left and use the PICAXE® drop down
menu to convert the flowchart to the basic program shown below. Download the program into the micro-controller, clear the message window, and press f8 button to open the terminal window.
By placing the Snap Circuit
® in normal room light
you should get readings similar to the ones shown here. Normal room light. Hand over the RP sensor. Aim sensor at a light source. Normal room light.
63
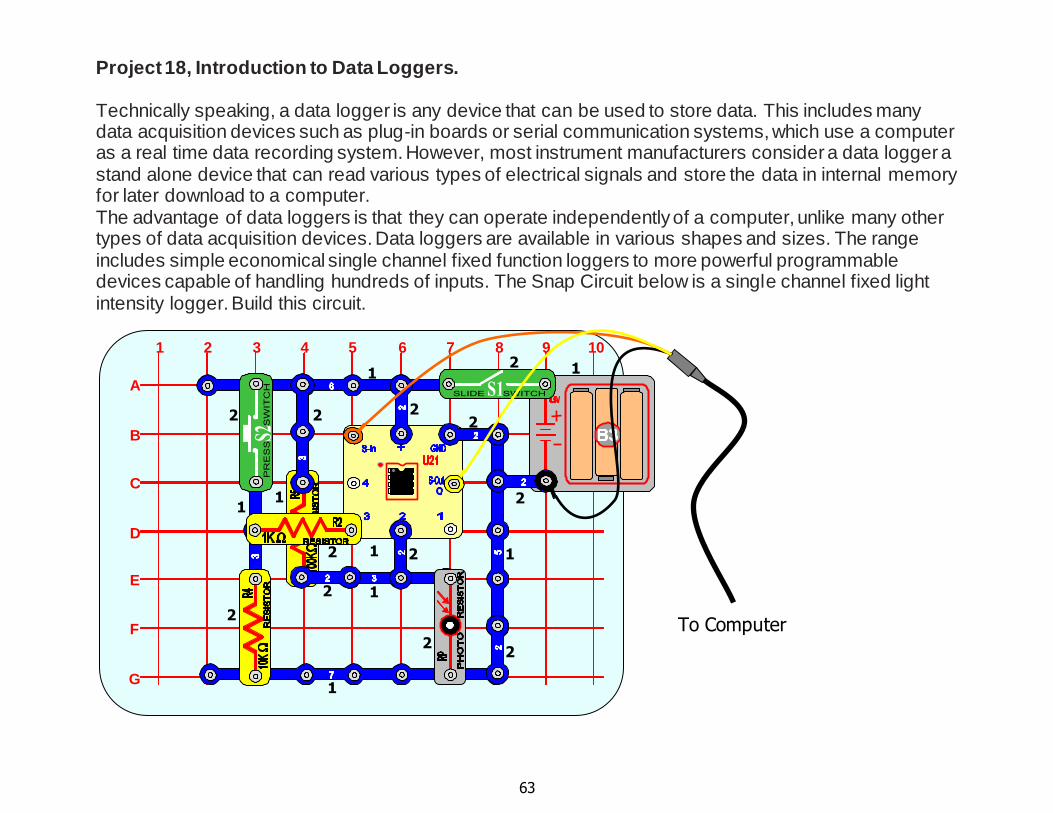
Project 18, Introduction to Data Loggers. Technically speaking, a data logger is any device that can be used to store data. This includes many data acquisition devices such as plug-in boards or serial communication systems, which use a computer as a real time data recording system. However, most instrument manufacturers consider a data logger a stand alone device that can read various types of electrical signals and store the data in internal memory for later download to a computer. The advantage of data loggers is that they can operate independently of a computer, unlike many other types of data acquisition devices. Data loggers are available in various shapes and sizes. The range includes simple economical single channel fixed function loggers to more powerful programmable devices capable of handling hundreds of inputs. The Snap Circuit below is a single channel fixed light intensity logger. Build this circuit.
B
C
D
E
F
2 3 4 5 6
A
G
1 7 8 9 10
To Computer
1
1
2
2
2
1
2
2
2
1
1
1
2
1 1
2
2
2
2
1
2

64
Create the following flowchart:
In the above flowchart the data is stored in registers 80 to 127 with the “poke” command and retreived by using a subroutine called ddump with the “peek” command. The “gosub” command only stops the time keeping process to retreive the data and send it to the terminal. Time keeping is then resumed where it left off by the return command at the end of the ddump subroutine. Use the PICAXE
® drop down
menu and convert the flow chart to a program similar to the one shown on the next page. Be sure to add your own notes and change labels to make your program easy to understand when you revisit this program at a later date.

65
Download the above program into the Snap Circuit Project 18 Light Intensity Logger. Press the F8 key to open the terminal window on your display. Press and hold the S2 switch until data starts dumping into the terminal window then release switch. The window should display data similar to the picture on the left. There will only be one reading since the light sensor data logger was just turned on. The rest of the data should be zero. It will take approximately one hour before the second reading is taken. Placing this circuit near a window for a couple of days will record the light levels for that area. To make the readings faster, change the program as shown in the red boxes above and repeat the process.
Make these equal to 2 and the wait = 1 for a
reading approximately every 5 seconds.

66
Project 19, Green Power Meter or An Energy Cost Data Logger. A data logger can be used to store data on how much electricity is being used by a device. For example, the light sensor is placed by a lamp in a room. When the lamp is turned on the micro-controller records the time. When the light is turned off, the time elapsed is calculated and stored. The time on is then used to calculate the kilowatt hours of energy used and the cost based on the current price of electricity. Total cost per day is then stored for displaying when requested. PICAXE
® timing is pretty approximate & can
vary by ±1%. Consider the flow chart below.
This section gathers and stores data. This section calculates and displays cost.
Since the flow chart editor will not allow a decimal, write the word “decimal” instead and convert it to a decimal point after transforming the flow chart to a basic program. The ‘¢’ symbol can be entered by holding down the <alt> key and entering 0162 on the number pad. Open the program editor and enter the flowchart as shown above. Be sure to save it before converting to basic. After converting to basic your program should be similar to the one shown on the next page.

67
Program in Basic for Green Power Meter. The program will take 24 hours before it records the first day’s cost. To speed up program for testing purposes, change the second pause from 59940 to 1. After testing replace original value.
setint Syntax:
SETINT OFF SETINT input,mask - input is a variable/constant (0-255) which specifies input condition.
- mask is variable/constant (0-255) which specifies the mask
Function:
Interrupt on a certain inputs condition. Information:
The setint command causes a polled interrupt on a certain input pin / flags
condition.
A polled interrupt is a quicker way of reacting to a particular input combination.
It is the only type of interrupt available in the PICAXE system. The inputs port is checked between execution of each command line in the program, between each
note of a tune command, and continuously during any pause command. If the
particular inputs condition is true, a ‘gosub’ to the interrupt sub-procedure is
executed immediately. When the sub-procedure has been carried out, program
execution continues from the main program. The interrupt inputs condition is any pattern of ‘0’s and ‘1’s on the input port,
masked by the byte ‘mask’. Therefore any bits masked by a ‘0’ in byte mask will be
ignored.
e.g.
to interrupt on input 3, high only in binary format setint %00001000,%00001000 (In decimal = 8,8)
high only Input 3 Input 2 Input 1 Input 0
to interrupt on input 1 low only setint %00000000,%00000010 (In decimal = 0,2)
to interrupt on input 0 high, input 1 high and input 2 low setint % 0 0 0 0 0 0 1 1 , % 0 0 0 0 0 1 1 1 (In decimal = 3,7)
128 64 32 16 8 4 2 1 or 2+1=3 4+2+1=7
add position values that are ones to convert from binary to decimal.
Change the word “decimal” to a “.” before downloading.
Lamp Wattage
Cost per kilowatt hour to nearest
penny.

68
Build the Green Power Meter Circuit shown here. Flashes once each minute when it records lamp as on. No Flash if lamp off. To shield the photo resistor RP from daylight and other light sources you should take a tube from a roll of paper towels and cover one end with a piece of paper as shown here. Punch a pencil size hole in the paper and cut the other end of the tube so it fits over the photo resistor RP in the circuit above. Aim the hole in the tube at the lamp being measured so only light from that lamp hits the photo resistor.
To Computer
B
C
D
E
F
2 3 4 5 6
A
G
1 7 8 9 10
1
1
2
2
1
2
2
2
1
1
1
2
1
1 2 2
2
2
2
2
1
2
2
1
2

69
To test the Green Power Meter (GPM) change the second pause in the program from 59940 to 1 and download into the Snap Circuit® on the previous page. After removing successful download window, quickly open the terminal by pressing <F8> key. Restart the GPM and your terminal window should display the ‘Wattage = 100’ message. The red LED should be flashing very fast if enough light is present to trigger the record part of the program. Place your hand over the photo resistor and the flashing should stop. Press the S2 pushbutton to see recorded data. It will take between 5 to 10 seconds to emulate one day of recording. 14 Days recorded, cost = $1.84. 24 Days Recorded – memory full In this example the lamp would have cost the user $3.23 for 24 days of use.
Be sure to change the wattage setting to the value of the lamp you will test and the price per kilowatt hour to the nearest penny rate on your electric bill. Replace original pause settings and download the program. Remove computer leads and install 10K resistor. Place it under the light to be tested. Make sure the LED flashes once every minute the lamp is on, and does not flash when lamp is off. Wait 24 days to get a good reading on the cost of normal use of the lamp. Although the GPM can only measure up to 255 watts directly, any device tied to a light source can be calculated. For example, a 1200 watt heater with a light would cost 12 times the number calculated above or 12 x $3.23 = $38.77 for 24 days.

70
PROJECT 20, Audio Amplifier and the Microphone (X1)
Build the Snap Circuit shown below. For those familiar with electronic circuits and
schematics a drawing of this circuit is also included.
Schematic Drawing Make sure the computer speakers are turned on and the volume or loudness control is not at zero. Also make sure the microphone input is on by checking the controls as shown on the next page.
R2 1K
R4 10K
R5 100K
C4 100uf
X1 Microphone
Q2 NPN
B3
4.5V
S1 Sw itch TO MICROPHONE INPUT ON COMPUTER
B
C
D
E
F
2 3 4 5 6
A
G
1 7 8 9 10
2
1
2
1
2
2
1
2
TO COMPUTER Microphone Input
1
3
1
2
2
3
MICROPHONE CABLE
1
1
2
2

71
Go to control panel and double click the “Sounds and Audio Devices” icon. In the panel that opens, click the “Advanced” bar under the device volume section to open the window below. Click on the “options” menu and check the “Advanced” section to open these. Click on “options” again, and then “properties” to open this window. Make sure the Microphone & Volume Control boxes are checked. Click OK. For best sensitivity, click on the advanced button under the microphone column and make sure the “Microphone Boost” box is checked in the window that opens. Not all versions of windows will have these “Advanced” buttons. Turn S1 switch to on and you should be able to hear amplified sounds from the microphone. Test by blowing on the microphone. If feedback occurs, reduce the speaker volume or the microphone input setting. Keep this circuit for the next project.

72
Project 21, Audacity
®
Run the installer program “audacity®-win-1.2.6.exe” from the Elenco
® files you downloaded, or by
running file CDStarter.exe and selecting it from the menu that comes up. Follow the instructions to install the program. After installation run the program and a window similar to the one below should open; Stop Button Use the “Help” menu to learn the power of Audacity
®.
When ready, use the Snap Circuit®
from project 20 to record the words “yes” & “no” or the numbers 0 through 9.
Click the record button and speak clearly toward the microphone at a distance of 12 inches.
To stop recording, click the stop button.
A recorded “yes” & “no” is shown on the next page.
SECTION 4: AUDACITY® & SOUND CIRCUITS

73
An Audacity® recording of the words “yes” and “no”.
In speech recognition programs, computers analyze the digital data from words and use the common points to determine the word being spoken. The next project will use the sound of clapping to control an LED.

74
Project 22, Investigating Sound of Clapping. Use previous setup to record the sound of two claps. Try recording two claps with different delays between claps. The picture below shows different clap groups highlighted by different colors.
Peaks reach both +1 and –1 levels, then decay to a level less than .1 within .2 seconds.
.4 seconds .2 seconds .6 seconds .8 seconds 1.1 seconds

75
A single clap from the previous page is shown here. < ±.1 .2 seconds or 200 milliseconds Amplitude window for less than 10% of a positive or a negative peak. Expanding the area inside the yellow box will show the first few milliseconds of clap. This area could be used to trigger an interrupt and start the process to analyze the sound. This area is expanded by;
1. Highlight area using this button. 2. Eliminate rest of curve using this button. 3. Expand using this button.

76
Expanded start of a clap. Data points highlighted by clicking “pencil” button. If –1 = 0, +1 = 255, and 0.0 = 127 then the dots below the –0.3 red line and the dots above the 0.3 red line show digital data points for loud sharp sounds that are less than 88 or greater than 166. This data can be used to detect the start of a clap sound. After .2 seconds or 200 milliseconds all the data should be between the two center purple lines as shown by the dots at the beginning of the curve. This data can be used to detect the end of a clap sound. Use the Audacity
® program and the circuit from project 20 to verify these facts.
77
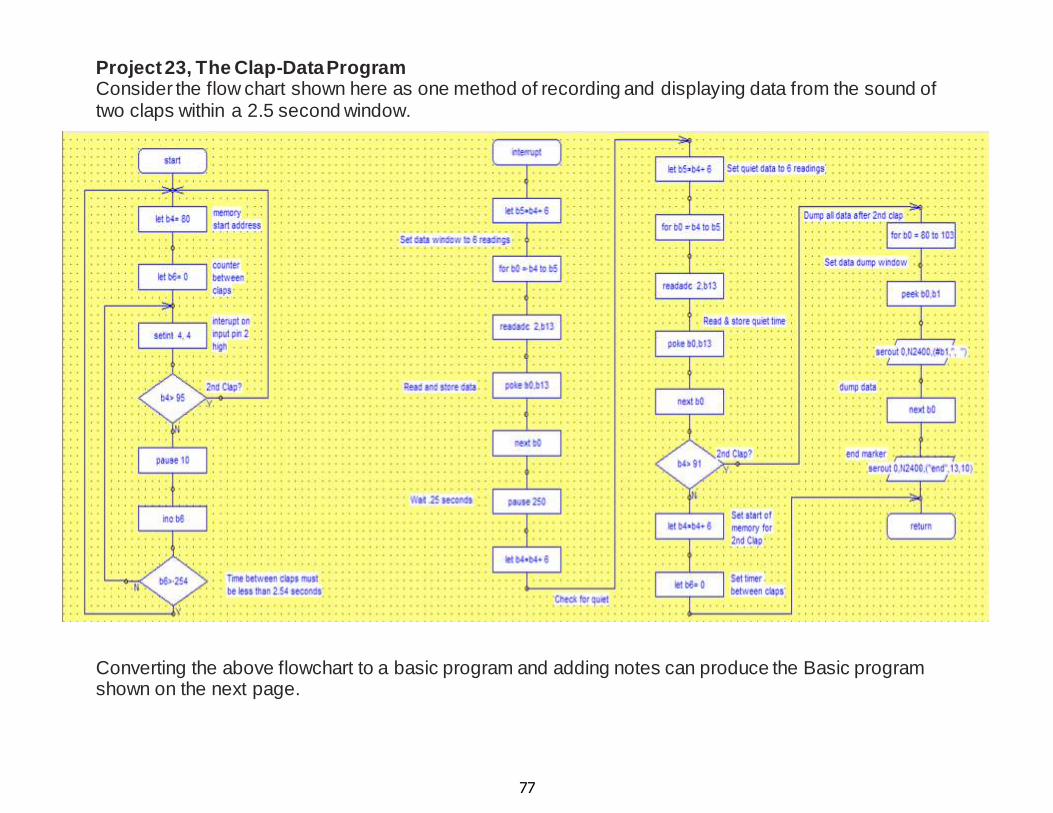
Project 23, The Clap-Data Program Consider the flow chart shown here as one method of recording and displaying data from the sound of two claps within a 2.5 second window. Converting the above flowchart to a basic program and adding notes can produce the Basic program shown on the next page.

78
Build the Snap Circuit
® shown next and download the above program into the micro-processor.

79
Clap data taking circuit. After downloading the program, clear the download window and open the Terminal window under the PICAXE
® menu in the program editor. Every two claps should produce a stream of data that is followed
by the word “end”. Data will vary from circuit to circuit, but certain characteristics will remain the same. It is these characteristics that will be used to control our final output.
To Computer
B
C
D
E
F
2 3 4 5 6
A
G
1 7 8 9 10
1
1
2
3
2
1
2
2
2
1
1
1
2
1
1
2
2
2
1
2
1
3
2
2

80
Project 24, Analyzing Clap Data Data shown in terminal window after four pairs of claps should be similar to this;
Pair 1: 54, 152, 104, 117, 80, 111 ………… 6, 118, 119, 88, 105, 89 Pair 2: 254, 127, 7, 111, 71, 105 ……… 29, 151, 106, 113, 102, 117 Pair 3: 168, 228, 116, 82, 96, 62 ……… 6, 8, 60, 115, 110, 93 Pair 4: 146, 84, 117, 104, 123, 94 ……… 124, 102, 105, 99, 141, 92
Start of first clap 54 152 104 117 80 111
End of first clap 103 101 103 102 101
102
Start of 2nd clap 6 118 119 88 105 89
End of 2nd clap 103 102 103 102 103 102
The average of the 48 data readings for the end of each clap = 103 Using a 10% window above and below 103 results in a
center window of 93 to 113
A 30% window above and below the average of 103 results in clap start windows of 0 to 73 and 133 to 255. The data that fits in these windows is shown in red above for first pair and in red below for other pairs.

81
Three data groups for the start of a clap only have one data point in the start windows. There is no data outside of the center window for the end of each clap. Repeat this process for your Snap Circuit
® and
microprocessor. Calculate your center window for 10% above and below the average end point readings. In the following flow chart the end point window was closed to ± 5% or 98 to 108. Calculate your start point windows for at least one data point per clap. You may have to open the windows to insure at least one data point. In the following flow chart the start windows were set at approximately ± 18% to improve data readings. The numbers used were 0 to 85 and 121 to 255. This change results in start data as shown here. Pair 1: 54, 152, 104, 117, 80, 111 ………… 6, 118, 119, 88, 105, 89 Pair 2: 254, 127, 7, 111, 71, 105 ……… 29, 151, 106, 113, 102, 117 Pair 3: 168, 228, 116, 82, 96, 62 ……… 6, 8, 60, 115, 110, 93 Pair 4: 146, 84, 117, 104, 123, 94 ……… 124, 102, 105, 99, 141, 92 There is still one data group with only one number outside the window, but the probability of capturing a good clap sound has been improved greatly. In the following flow chart the clap data is no longer stored, but instead is measured byte by byte as it is read. This allows more bytes to be analyzed in a shorter time period and even better probability of a capture. The beginning of the next flow chart waits 10 seconds then looks for a quiet period and records the required window data. The 10-second delay is necessary in order to allow all the circuit transients to settle and come to their operating levels. A green light indicates this process is running. When the light goes out the circuit is reading to use.

82
Project 25, The Clap it ON, Clap it OFF Circuit Construct the following flowchart. Settle and Get Quiet Set window variables Look for Clap Check Sound & Toggle Light The first block above lets the circuit settle and then looks for 10 readings in a row that are very close to be used as quiet time. The second block calculates the quiet point and sets the limits for start and end of the clap sound. The third block is the main program that listens for a clap and starts the count between claps. The last block checks the sound for outside of start window, waits for 200 milliseconds, then checks for quiet time. This block also checks for second clap and turns the light ON or OFF.

83
After converting the flowchart to a Basic program it should look similar to the following without the notes.

84
Before downloading, change the Snap Circuit® to match the picture below. Download into the following
circuit and test by clapping. Clap at least five times with one second between claps but not more than 2 seconds between claps. After the light comes on it should only take two loud claps to make it toggle.
B
C
D
E
F
2 3 4 5 6
A
G
1 7 8 9 10
To Computer
1
1
2
3
2
1
2
2
2
1
1
1
2
1
1
2
2
2
1
2
1
3
2
2
2
2
2
1
3

85
Elenco® Electronics Inc.
150 Carpenter Ave Wheeling, IL 60090
(847) 541-3800 www.elenco.com
Copyright © 2013 by Elenco® Electronics Inc. All rights reserved. No part of this book shall be reproduced without written permission. PD031810