tm poweredge expandable raid … poweredge expandable raid controller 6 on the dell powervault...
TRANSCRIPT
DELL POWEREDGE EXPANDABLE RAID CONTROLLER 6 on the DELL POWERVAULT MD1000 & MD1120
PERFORMANCE
ANALYSIS REPORT Dan Hambrick Storage Performance Analysis Lab Office of the Chief Technology Officer dell.com/storage April 2009 THIS WHITE PAPER IS FOR INFORMATIONAL PURPOSES ONLY, AND MAY CON-TAIN TYPOGRAPHICAL ERRORS AND TECHNICAL INACCURACIES. THE CONTENT IS PROVIDED AS IS, WITHOUT EXPRESS OR IMPLIED WARRANTIES OF ANY KIND.
TM
TM
TM
CONTENTS
INTRODUCTION 3
ABOUT PERC 6 RAID CONTROLLERS 3
TEST ENVIRONMENT 4
RAID LEVEL ANALYSIS 7
TEST RESULTS 9
POWERVAULT MD1000 TEST RESULTS 10
POWERVAULT MD1120 TEST RESULTS 14
CONCLUSION 18
APPENDIX
APPENDIX A: HARDWARE CONFIGURATION 18
APPENDIX B: COMPLETE RESULTS
20
APPENDIX C: REFERENCES 24
FOR FURTHER INFORMATION AND DISCUSSION http://www.delltechcenter.com/page/Storage This paper was updated for PERC 6 Firmware A09 in April 2009.
PERC 6 PERFORMANCE ANALYSIS
INTRODUCTION
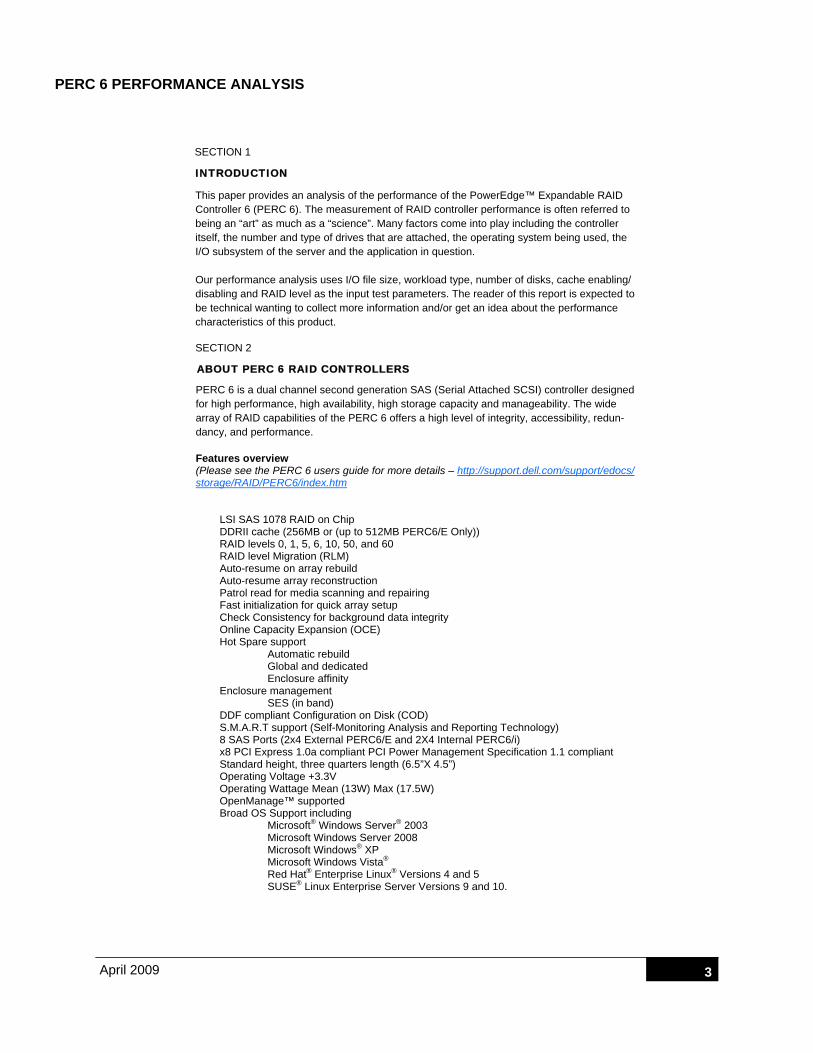
This paper provides an analysis of the performance of the PowerEdge™ Expandable RAID Controller 6 (PERC 6). The measurement of RAID controller performance is often referred to being an “art” as much as a “science”. Many factors come into play including the controller itself, the number and type of drives that are attached, the operating system being used, the I/O subsystem of the server and the application in question. Our performance analysis uses I/O file size, workload type, number of disks, cache enabling/disabling and RAID level as the input test parameters. The reader of this report is expected to be technical wanting to collect more information and/or get an idea about the performance characteristics of this product.
SECTION 1
ABOUT PERC 6 RAID CONTROLLERS
PERC 6 is a dual channel second generation SAS (Serial Attached SCSI) controller designed for high performance, high availability, high storage capacity and manageability. The wide array of RAID capabilities of the PERC 6 offers a high level of integrity, accessibility, redun-dancy, and performance. Features overview (Please see the PERC 6 users guide for more details – http://support.dell.com/support/edocs/storage/RAID/PERC6/index.htm
LSI SAS 1078 RAID on Chip DDRII cache (256MB or (up to 512MB PERC6/E Only)) RAID levels 0, 1, 5, 6, 10, 50, and 60 RAID level Migration (RLM) Auto-resume on array rebuild Auto-resume array reconstruction Patrol read for media scanning and repairing Fast initialization for quick array setup Check Consistency for background data integrity Online Capacity Expansion (OCE) Hot Spare support
Automatic rebuild Global and dedicated Enclosure affinity
Enclosure management SES (in band)
DDF compliant Configuration on Disk (COD) S.M.A.R.T support (Self-Monitoring Analysis and Reporting Technology) 8 SAS Ports (2x4 External PERC6/E and 2X4 Internal PERC6/i) x8 PCI Express 1.0a compliant PCI Power Management Specification 1.1 compliant Standard height, three quarters length (6.5”X 4.5”) Operating Voltage +3.3V Operating Wattage Mean (13W) Max (17.5W) OpenManage™ supported Broad OS Support including
Microsoft® Windows Server® 2003 Microsoft Windows Server 2008 Microsoft Windows® XP Microsoft Windows Vista® Red Hat® Enterprise Linux® Versions 4 and 5 SUSE® Linux Enterprise Server Versions 9 and 10.
SECTION 2
3 April 2009

PERC 6 PERFORMANCE ANALYSIS
Using 3Gb/s SAS technology, PowerEdge™ Expandable RAID Controller 6 was observed in testing to be able to transfer up to 1484 MB/s (the theoretical upper limit by RAID On Chip (ROC) is better than 1.5 GB/s) using sequential reads and employing both of the external channels. Streaming video and data backup applications are capable of running extremely fast with up to 1MB stripe configurations. This is compared to the previous generation PERC5 with a maximum available 128KB stripe size. The PERC 6 supports all key RAID levels including RAID 6 and 60. RAID 6 tolerates two si-multaneous failures, and thus the ability to manage unrecoverable media errors during re-builds. This is useful especially when many high capacity, lower cost SATA disks are utilized. The battery backed cache offers a large addressable memory space that can increase throughput in several applications and preserves cache contents using a 7WH Lithium Ion rechargeable battery.
TEST ENVIRONMENT
In the tests, Dell Labs used the IOMETER benchmark tool to stress the disk sub-system. With IOMETER we generated 12 different types of workloads to represent different application pat-terns commonly used by Dell customers. Different application platforms pass data and com-mands to the RAID controller in different block sizes. These blocks are called I/O files. To simulate different platforms we used the payload sizes listed below to represent a variety of applications using IO sizes ranging from small to large. The payload sizes were split for graph-ing to optimize scale of the graph between small patterns with large IOps scores, and large patterns with high MBps but a low IOps scores.
SECTION 3
4 April 2009
TEST PATTERN PAYLOAD SIZE PERCENT READ/WRITE PERCENT RANDOM(R)/SEQUENTIAL(S)
Web File Server 4K 95/5 75/25(R)
Web File Server 8K 95/5 75/25(R)
Web File Server 64K 95/5 75/25(R)
DSS 1M 100/0 100/0(R)
Media Streaming 64K 98/2 0/100(S)
SQL Server Log 64K 0/100 0/100(S)
OS Paging 64K 90/10 0/100(S)
Web Server Log 8K 0/100 0/100(S)
DB-OLTP 8K 70/30 100/0(R)
Exchange Email 4K 67/33 100/0(R)
OS Drive 8K 70/30 100/0(R)
Video on Demand 512K 100/0 100/0(R)
PERC 6 PERFORMANCE ANALYSIS
The PERC 6 adjustable task rates can improve reliability, data protection, and increase pre-ventative monitoring of the storage attached. The I/O rate is usually traded off to add clock cycles for these functions. For all tests, the following rates were set to 0.
Rebuild Rate. Adjustable in percent from 0 to 100 to control the rate at which a rebuild will be performed on a disk drive when one is necessary. The higher the number, the faster the re-build will occur (and the system I/O rate may be slower as a result).
Patrol Rate. Adjustable in percent from 0 to 100 to control the rate at which patrol reads will be performed. Patrol read is a preventive procedure that monitors physical disks to find and re-solve any potential problem that might cause disk failure. The higher the number, the faster the patrol read will occur (and the system I/O rate may be slower as a result).
Background Initialization (BGI) Rate. Adjustable in percent from 0 to 100 to control the rate at which virtual disks are initialized "in the background." Background initialization makes the virtual disk immediately available for use, even while the initialization is occurring. The higher the number, the faster the initialization will occur (and the system I/O rate may be slower as a result).
Check Consistency Rate. Adjustable in percent from 0 to 100 to control the rate at which a consistency check is done. A consistency check scans the consistency data on a fault tolerant virtual disk to determine if the data has become corrupted. The higher the number, the faster the consistency check is done (and the system I/O rate may be slower as a result).
Reconstruction Rate. Adjustable in percent from 0 to 100 to control the rate at which recon-struction of a virtual disk occurs. The higher the number, the faster the reconstruction will occur (and the system I/O rate may be slower as a result).
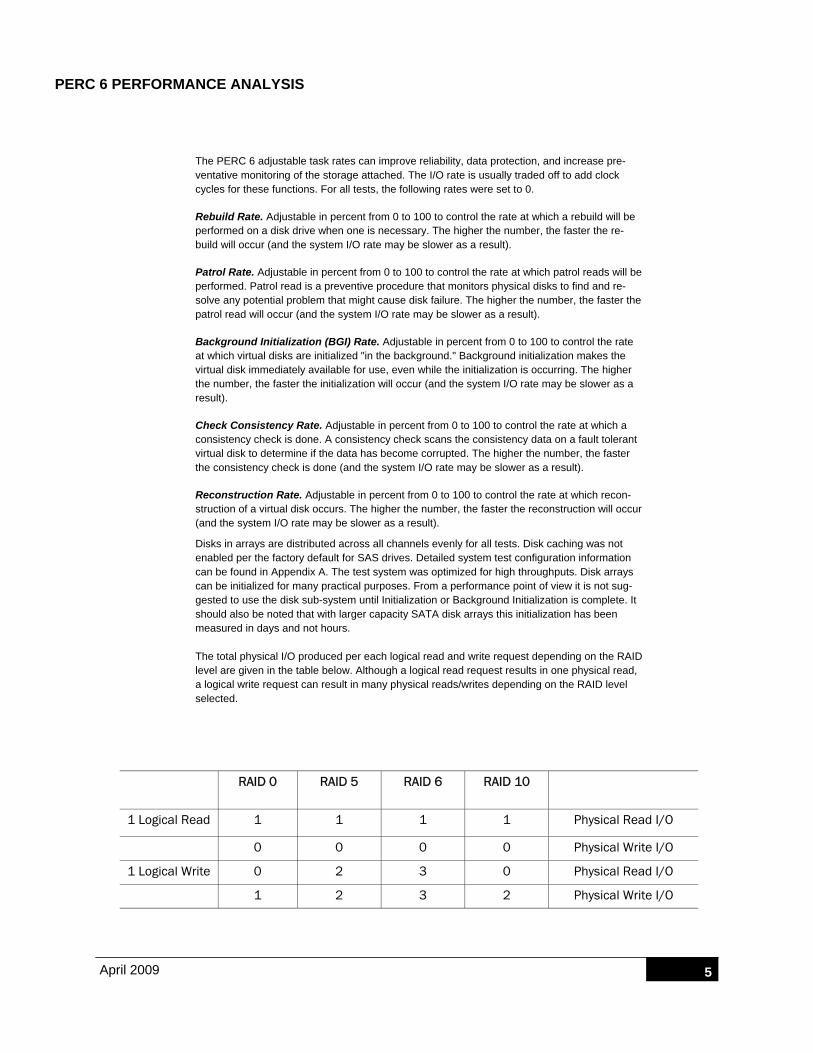
Disks in arrays are distributed across all channels evenly for all tests. Disk caching was not enabled per the factory default for SAS drives. Detailed system test configuration information can be found in Appendix A. The test system was optimized for high throughputs. Disk arrays can be initialized for many practical purposes. From a performance point of view it is not sug-gested to use the disk sub-system until Initialization or Background Initialization is complete. It should also be noted that with larger capacity SATA disk arrays this initialization has been measured in days and not hours. The total physical I/O produced per each logical read and write request depending on the RAID level are given in the table below. Although a logical read request results in one physical read, a logical write request can result in many physical reads/writes depending on the RAID level selected.
5 April 2009
RAID 0 RAID 5 RAID 6 RAID 10
1 Logical Read 1 1 1 1 Physical Read I/O
0 0 0 0 Physical Write I/O
1 Logical Write 0 2 3 0 Physical Read I/O
1 2 3 2 Physical Write I/O
PERC 6 PERFORMANCE ANALYSIS
6 April 2009
RAID LEVEL CAPACITY LOSS DATA RELIABILITY
RAID 0 No loss Array fails if one disk fails
RAID 1 Half Single disk can fail
RAID 5 One disk worth of data Single disk can fail
RAID 6 Two disks worth of data Two disks can fail consecutively
RAID 10 Half One disk from each spanned array
RAID 50 One disk per span One disk from each spanned array
RAID 60 Two disks per span Two disks from each spanned array
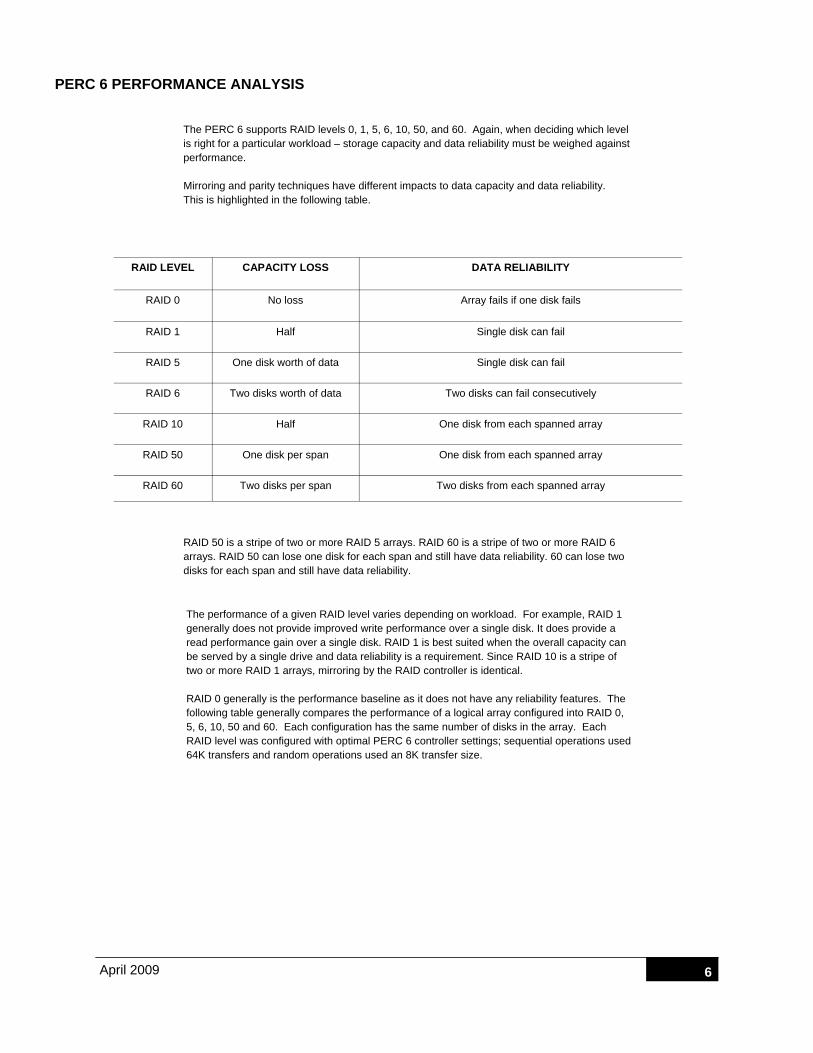
The PERC 6 supports RAID levels 0, 1, 5, 6, 10, 50, and 60. Again, when deciding which level is right for a particular workload – storage capacity and data reliability must be weighed against performance. Mirroring and parity techniques have different impacts to data capacity and data reliability. This is highlighted in the following table.
RAID 50 is a stripe of two or more RAID 5 arrays. RAID 60 is a stripe of two or more RAID 6 arrays. RAID 50 can lose one disk for each span and still have data reliability. 60 can lose two disks for each span and still have data reliability.
The performance of a given RAID level varies depending on workload. For example, RAID 1 generally does not provide improved write performance over a single disk. It does provide a read performance gain over a single disk. RAID 1 is best suited when the overall capacity can be served by a single drive and data reliability is a requirement. Since RAID 10 is a stripe of two or more RAID 1 arrays, mirroring by the RAID controller is identical. RAID 0 generally is the performance baseline as it does not have any reliability features. The following table generally compares the performance of a logical array configured into RAID 0, 5, 6, 10, 50 and 60. Each configuration has the same number of disks in the array. Each RAID level was configured with optimal PERC 6 controller settings; sequential operations used 64K transfers and random operations used an 8K transfer size.

PERC 6 PERFORMANCE ANALYSIS
RAID LEVEL ANALYSIS
RAID 0 Analysis RAID 0 offers no fault tolerance. As it only stripes the data across the disk array, we will see higher throughput rates with RAID 0 among other RAID levels. The group reliability decreases as more disks are added to RAID 0. RAID 0 should only be considered where performance is critical and data loss is acceptable. When the workload is write intensive and mostly random the PERC 6 write back cache buys increased performance. While the block size with RAID 0 can be as small as a byte, each drive seeks independently when reading or writing data on the drive. The percentage the drives act independently depends on the access pattern from the file system. For reads and writes that are larger than the stripe size, such as copying files or video playback, the disks will be seek-ing to the same position on each disk, the seek time of the array will be the same as that of a single drive. For reads and writes that are smaller than the stripe size, such as database ac-cess, the drives will be able to seek independently. If the sectors accessed are spread evenly between the two drives, the apparent seek time of the array will be half that of a single drive (assuming the disks in the array have identical access time characteristics). The throughput of the array will be the aggregate transfer capacity of all the disks, limited only by the throughput of the PERC 6. When the workload is mostly sequential reads or writes it is generally better to turn off the read-ahead and adaptive read ahead features of the PERC 6. In a sequential environment, even though the I/O size is the same, the stripe is used more efficiently; this is due to a natural result between track to track VS. random seek times. RAID 5 Analysis RAID 5 offers fault tolerance with generating and using block level parity information. For this reason, the overall performance and disk space usage is not as good as RAID 0. It is popular choice due to its low cost for redundancy. At RAID levels 5, 6, 50 and 60, if a disk should fail in the array, the parity blocks from the sur-viving disks are combined mathematically with the data blocks from the surviving disks to re-construct the data on the failed drive "on the fly". This is sometimes called Interim Data Recovery Mode or Array Rebuilding. The computer knows that a disk drive has failed, but this is only so that the operating system can notify the administrator that a drive needs replacement; applications running on the computer are un-aware of the failure. Reading and writing to the drive array continues seamlessly, though with some performance degradation. In RAID 5 one logical read ends with one physical read. One logical write ends with two physi-cal reads and two physical writes. Parity read and the recalculation process takes place in writes. Write back cache enabled becomes a benefit as the parity calculation is performed much faster with cache.
SECTION 4
7 April 2009
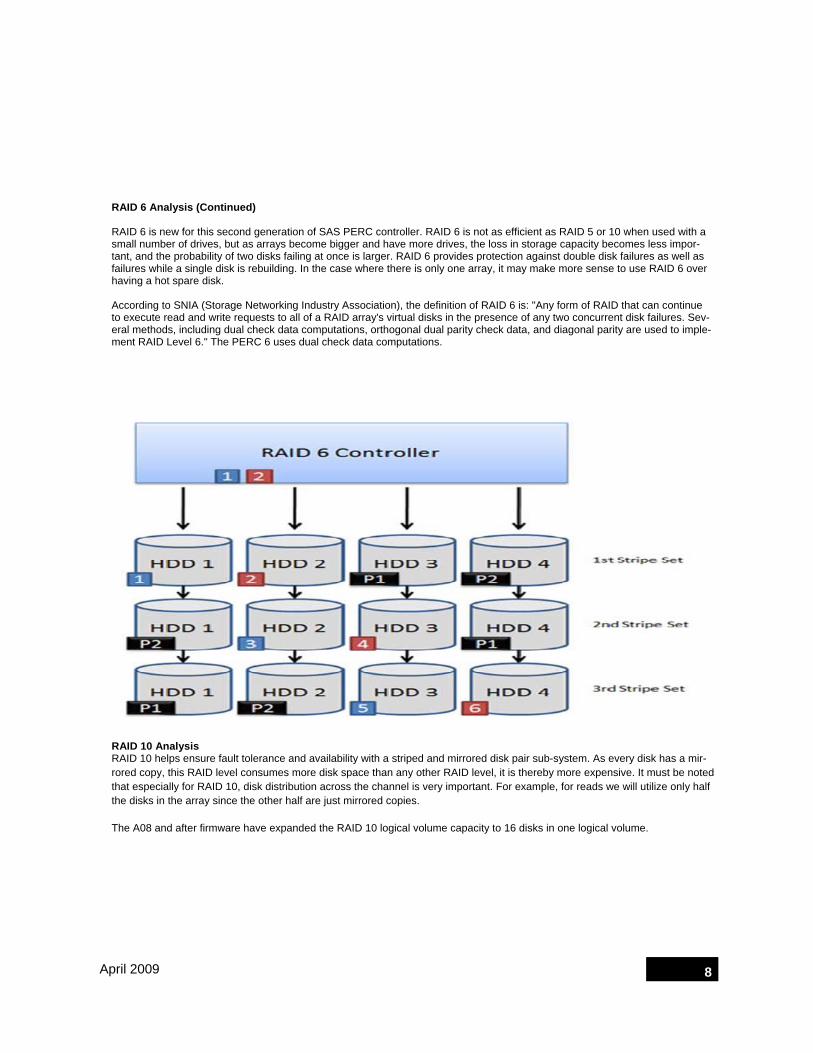
RAID 6 Analysis (Continued) RAID 6 is new for this second generation of SAS PERC controller. RAID 6 is not as efficient as RAID 5 or 10 when used with a small number of drives, but as arrays become bigger and have more drives, the loss in storage capacity becomes less impor-tant, and the probability of two disks failing at once is larger. RAID 6 provides protection against double disk failures as well as failures while a single disk is rebuilding. In the case where there is only one array, it may make more sense to use RAID 6 over having a hot spare disk. According to SNIA (Storage Networking Industry Association), the definition of RAID 6 is: "Any form of RAID that can continue to execute read and write requests to all of a RAID array's virtual disks in the presence of any two concurrent disk failures. Sev-eral methods, including dual check data computations, orthogonal dual parity check data, and diagonal parity are used to imple-ment RAID Level 6." The PERC 6 uses dual check data computations.
RAID 10 Analysis RAID 10 helps ensure fault tolerance and availability with a striped and mirrored disk pair sub-system. As every disk has a mir-rored copy, this RAID level consumes more disk space than any other RAID level, it is thereby more expensive. It must be noted that especially for RAID 10, disk distribution across the channel is very important. For example, for reads we will utilize only half the disks in the array since the other half are just mirrored copies.
The A08 and after firmware have expanded the RAID 10 logical volume capacity to 16 disks in one logical volume.
8 April 2009
PERC 6 PERFORMANCE ANALYSIS
9 April 2009
RAID level Sequential Reads (MB/s)
Sequential Writes (MB/s)
Random Reads (IOPS)
Random Writes (IOPS)
RAID 0 Best Best Best Best
RAID 5 Best Better Best Good
RAID 6 Better Better Better Good
RAID 10 Better Better Best Better
RAID 50 Best Better Best Good
RAID 60 Better Better Better Good
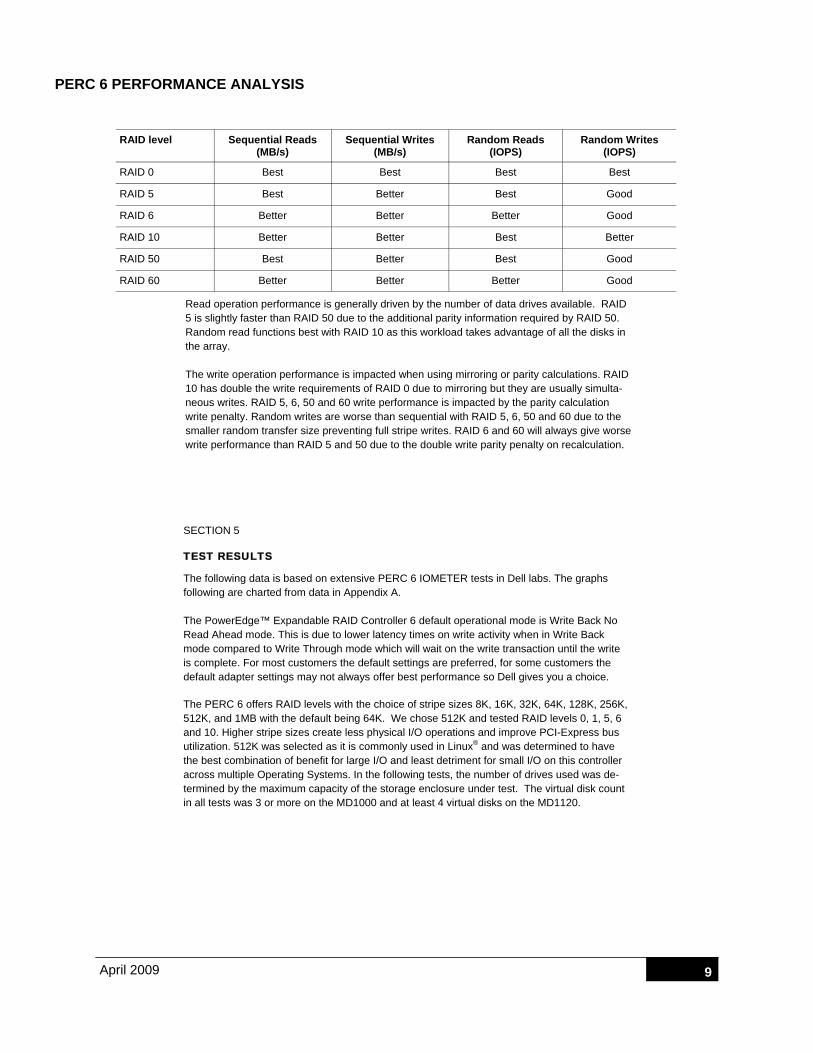
Read operation performance is generally driven by the number of data drives available. RAID 5 is slightly faster than RAID 50 due to the additional parity information required by RAID 50. Random read functions best with RAID 10 as this workload takes advantage of all the disks in the array. The write operation performance is impacted when using mirroring or parity calculations. RAID 10 has double the write requirements of RAID 0 due to mirroring but they are usually simulta-neous writes. RAID 5, 6, 50 and 60 write performance is impacted by the parity calculation write penalty. Random writes are worse than sequential with RAID 5, 6, 50 and 60 due to the smaller random transfer size preventing full stripe writes. RAID 6 and 60 will always give worse write performance than RAID 5 and 50 due to the double write parity penalty on recalculation.
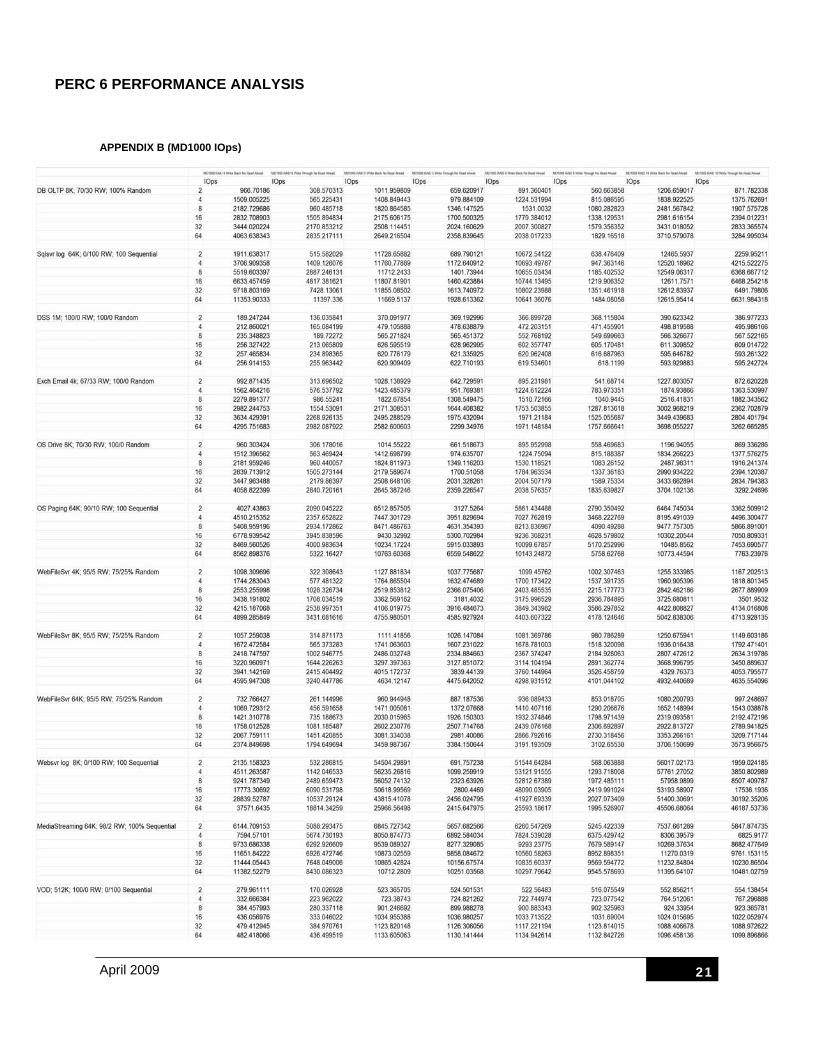
TEST RESULTS
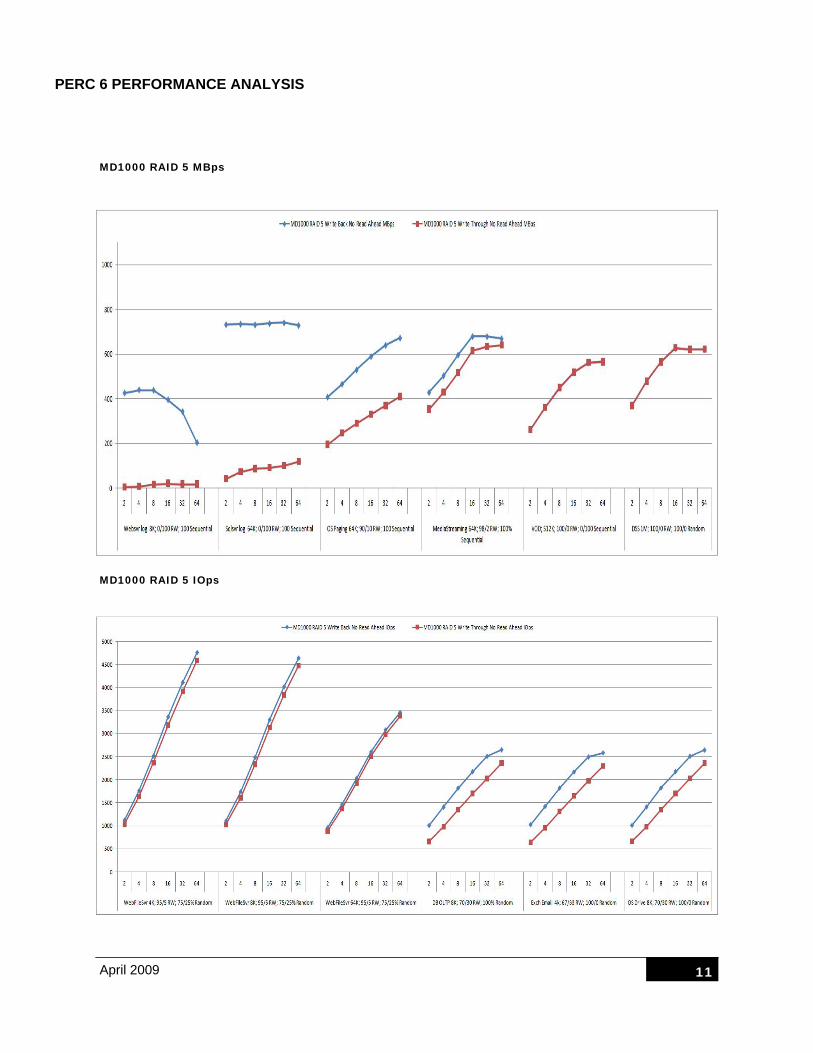
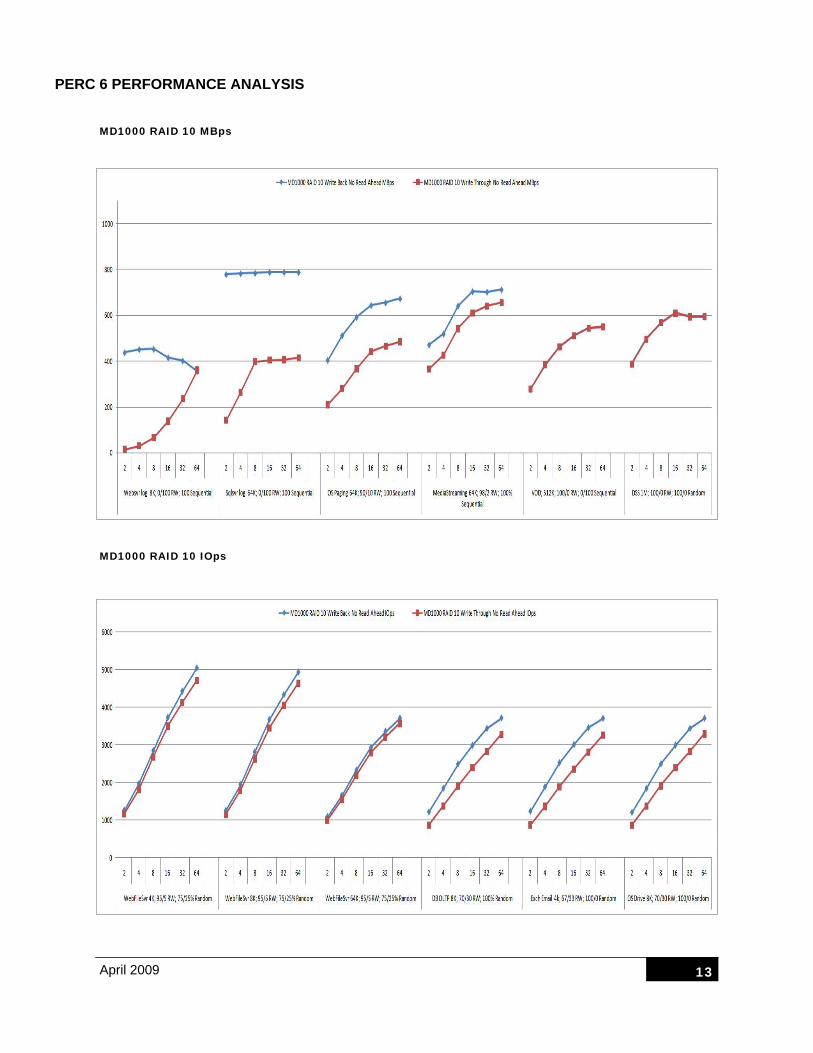
The following data is based on extensive PERC 6 IOMETER tests in Dell labs. The graphs following are charted from data in Appendix A. The PowerEdge™ Expandable RAID Controller 6 default operational mode is Write Back No Read Ahead mode. This is due to lower latency times on write activity when in Write Back mode compared to Write Through mode which will wait on the write transaction until the write is complete. For most customers the default settings are preferred, for some customers the default adapter settings may not always offer best performance so Dell gives you a choice.
The PERC 6 offers RAID levels with the choice of stripe sizes 8K, 16K, 32K, 64K, 128K, 256K, 512K, and 1MB with the default being 64K. We chose 512K and tested RAID levels 0, 1, 5, 6 and 10. Higher stripe sizes create less physical I/O operations and improve PCI-Express bus utilization. 512K was selected as it is commonly used in Linux® and was determined to have the best combination of benefit for large I/O and least detriment for small I/O on this controller across multiple Operating Systems. In the following tests, the number of drives used was de-termined by the maximum capacity of the storage enclosure under test. The virtual disk count in all tests was 3 or more on the MD1000 and at least 4 virtual disks on the MD1120.
SECTION 5
PERC 6 PERFORMANCE ANALYSIS
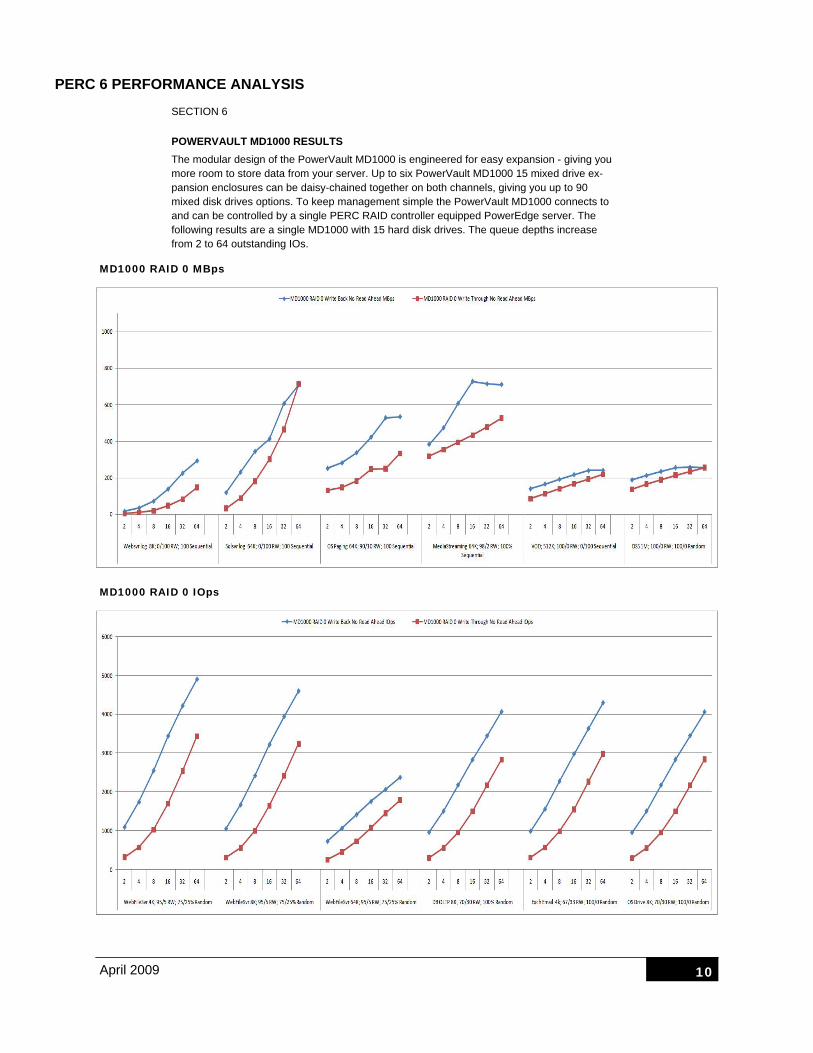
POWERVAULT MD1000 RESULTS The modular design of the PowerVault MD1000 is engineered for easy expansion - giving you more room to store data from your server. Up to six PowerVault MD1000 15 mixed drive ex-pansion enclosures can be daisy-chained together on both channels, giving you up to 90 mixed disk drives options. To keep management simple the PowerVault MD1000 connects to and can be controlled by a single PERC RAID controller equipped PowerEdge server. The following results are a single MD1000 with 15 hard disk drives. The queue depths increase from 2 to 64 outstanding IOs.
SECTION 6
10 April 2009
MD1000 RAID 0 IOps
MD1000 RAID 0 MBps
PERC 6 PERFORMANCE ANALYSIS
11 April 2009
MD1000 RAID 5 MBps
MD1000 RAID 5 IOps

PERC 6 PERFORMANCE ANALYSIS
12 April 2009
MD1000 RAID 6 IOps
MD1000 RAID 6 MBps
PERC 6 PERFORMANCE ANALYSIS
13 April 2009
MD1000 RAID 10 MBps
MD1000 RAID 10 IOps

PERC 6 PERFORMANCE ANALYSIS
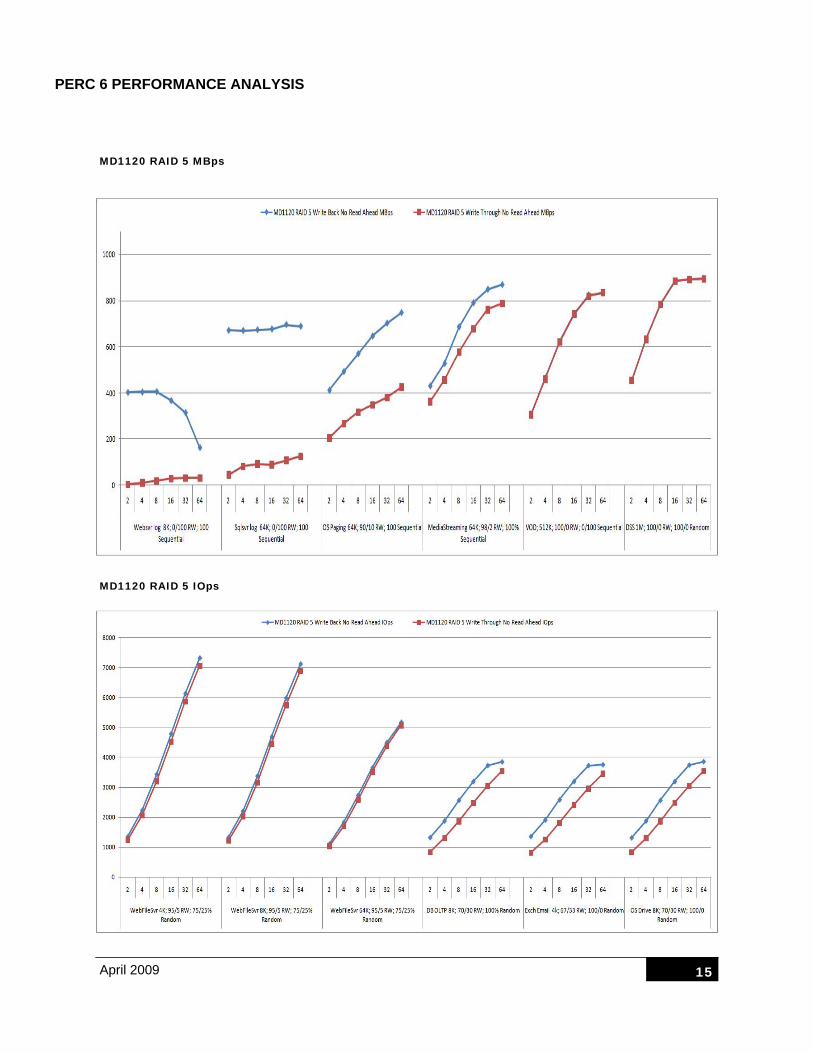
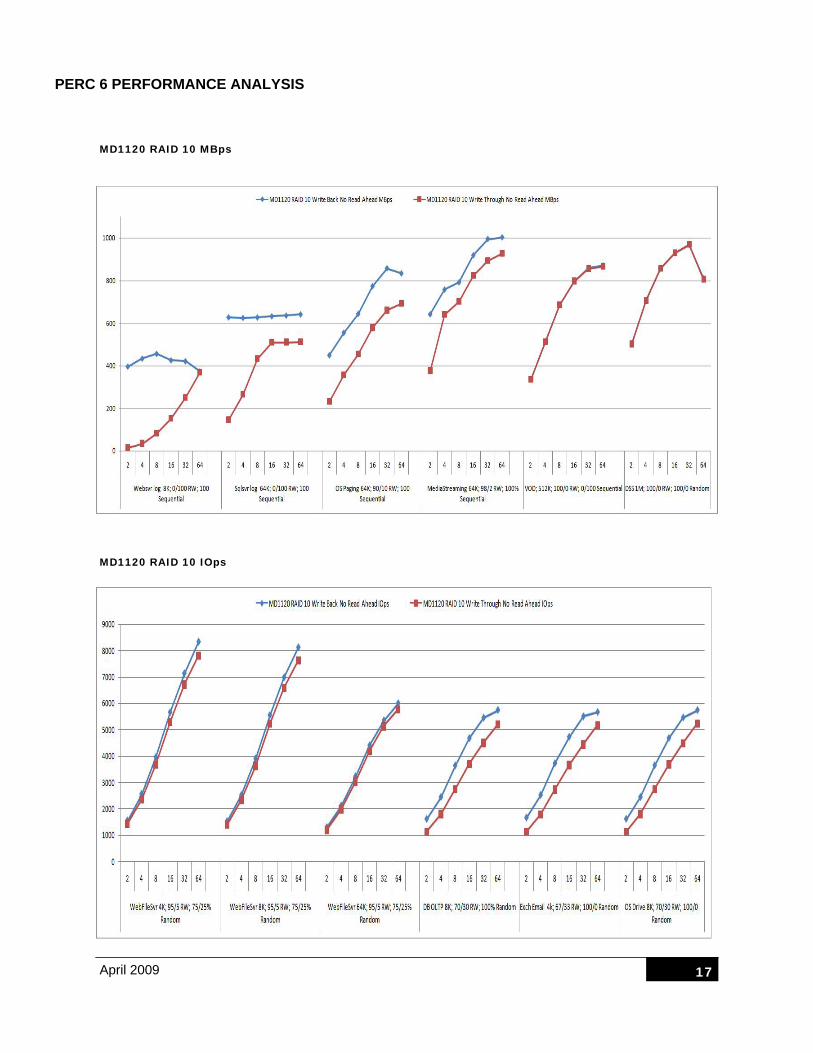
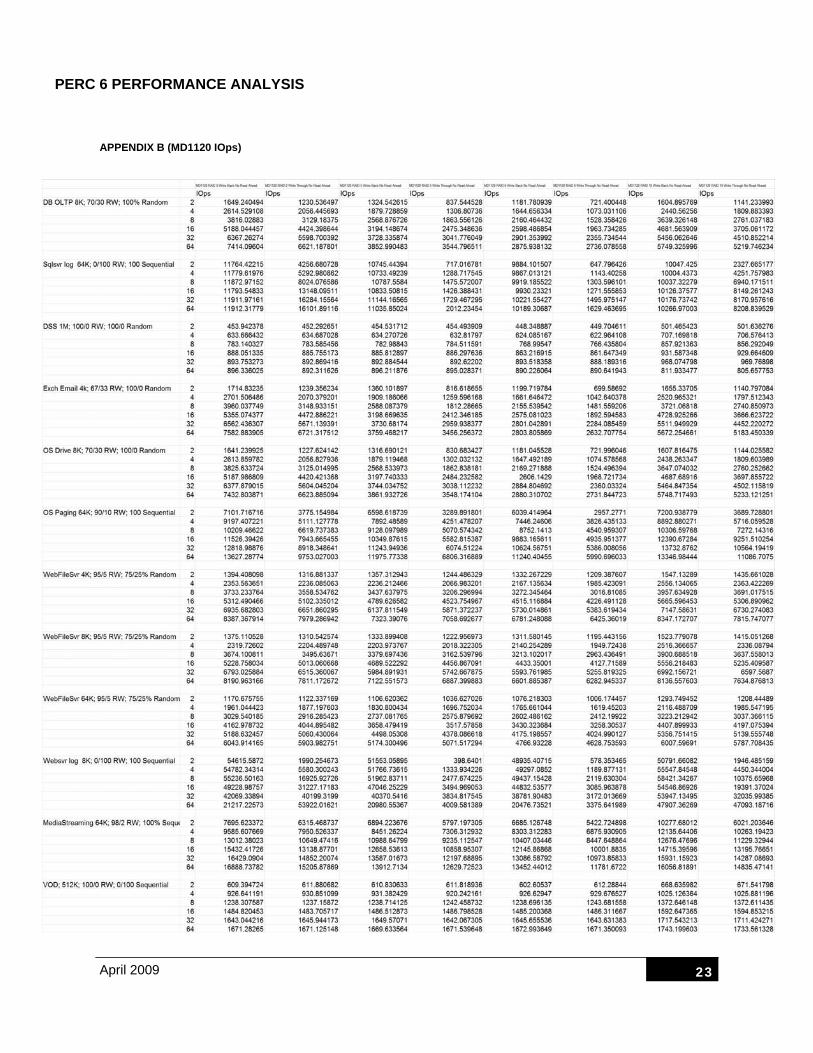
POWERVAULT MD1120 RESULTS
The MD1120 is Dell’s newest storage enclosure. Up to six PowerVault MD1120 24 drive enclo-sures can be daisy-chained together on both channels giving you up to 144 disk drives. To keep management simple the PowerVault MD1120 connects to and can be controlled by a single PERC RAID controller equipped PowerEdge server. The following results are a single MD1120 with 24 SAS 2.5” Seagate Savvio 15K.1 drives. The queue depths increase from 2 to 64 outstanding IOs.
SECTION 7
14 April 2009
MD1120 RAID 0 MBps
MD1120 RAID 0 IOps
PERC 6 PERFORMANCE ANALYSIS
15 April 2009
MD1120 RAID 5 MBps
MD1120 RAID 5 IOps

PERC 6 PERFORMANCE ANALYSIS
16 April 2009
MD1120 RAID 6 MBps
MD1120 RAID 6 IOps
PERC 6 PERFORMANCE ANALYSIS
17 April 2009
MD1120 RAID 10 MBps
MD1120 RAID 10 IOps
PERC 6 PERFORMANCE ANALYSIS
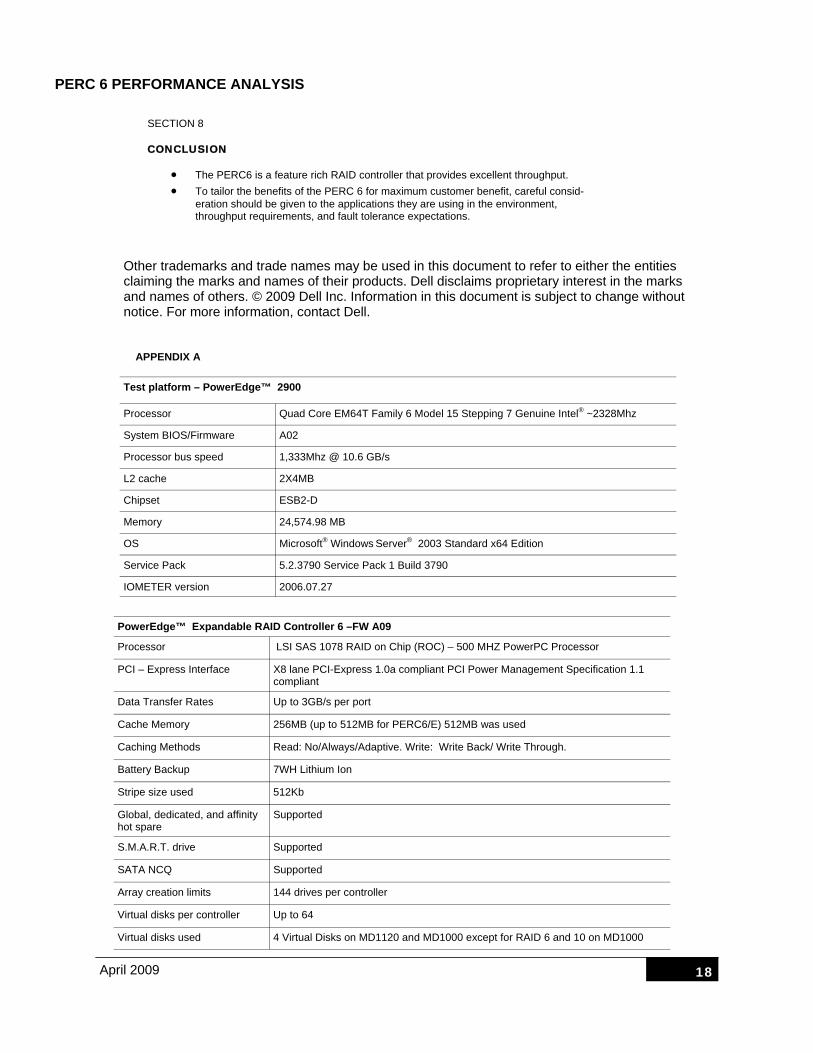
CONCLUSION
SECTION 8
18 April 2009
• The PERC6 is a feature rich RAID controller that provides excellent throughput. • To tailor the benefits of the PERC 6 for maximum customer benefit, careful consid-
eration should be given to the applications they are using in the environment, throughput requirements, and fault tolerance expectations.
Processor Quad Core EM64T Family 6 Model 15 Stepping 7 Genuine Intel® ~2328Mhz
System BIOS/Firmware A02
Processor bus speed 1,333Mhz @ 10.6 GB/s
L2 cache 2X4MB
Chipset ESB2-D
Memory 24,574.98 MB
OS Microsoft® Windows Server® 2003 Standard x64 Edition
Service Pack 5.2.3790 Service Pack 1 Build 3790
IOMETER version 2006.07.27
Test platform – PowerEdge™ 2900
APPENDIX A
PowerEdge™ Expandable RAID Controller 6 –FW A09
Processor LSI SAS 1078 RAID on Chip (ROC) – 500 MHZ PowerPC Processor
PCI – Express Interface X8 lane PCI-Express 1.0a compliant PCI Power Management Specification 1.1 compliant
Data Transfer Rates Up to 3GB/s per port
Cache Memory 256MB (up to 512MB for PERC6/E) 512MB was used
Caching Methods Read: No/Always/Adaptive. Write: Write Back/ Write Through.
Battery Backup 7WH Lithium Ion
Stripe size used 512Kb
Global, dedicated, and affinity hot spare
Supported
S.M.A.R.T. drive Supported
Array creation limits 144 drives per controller
Virtual disks used 4 Virtual Disks on MD1120 and MD1000 except for RAID 6 and 10 on MD1000
SATA NCQ Supported
Virtual disks per controller Up to 64
Other trademarks and trade names may be used in this document to refer to either the entities claiming the marks and names of their products. Dell disclaims proprietary interest in the marks and names of others. © 2009 Dell Inc. Information in this document is subject to change without notice. For more information, contact Dell.

PERC 6 PERFORMANCE ANALYSIS
19 April 2009
PowerVault MD 1000
System BIOS / Firmware A03
Hard drives Seagate Cheetah 15K.1 RPM 73GB 3.5” SAS drives
Model ST373455SS
Hard Disk Firmware S513 (Seagate)
PowerVault MD 1120
System BIOS / Firmware A01
Hard drives Seagate Savvio 15K.1 RPM 73GB 2.5” SAS drives
Model ST973451SS
Hard Disk Firmware SM04 (Seagate)
APPENDIX A Continued & B (MD1000 MBps)
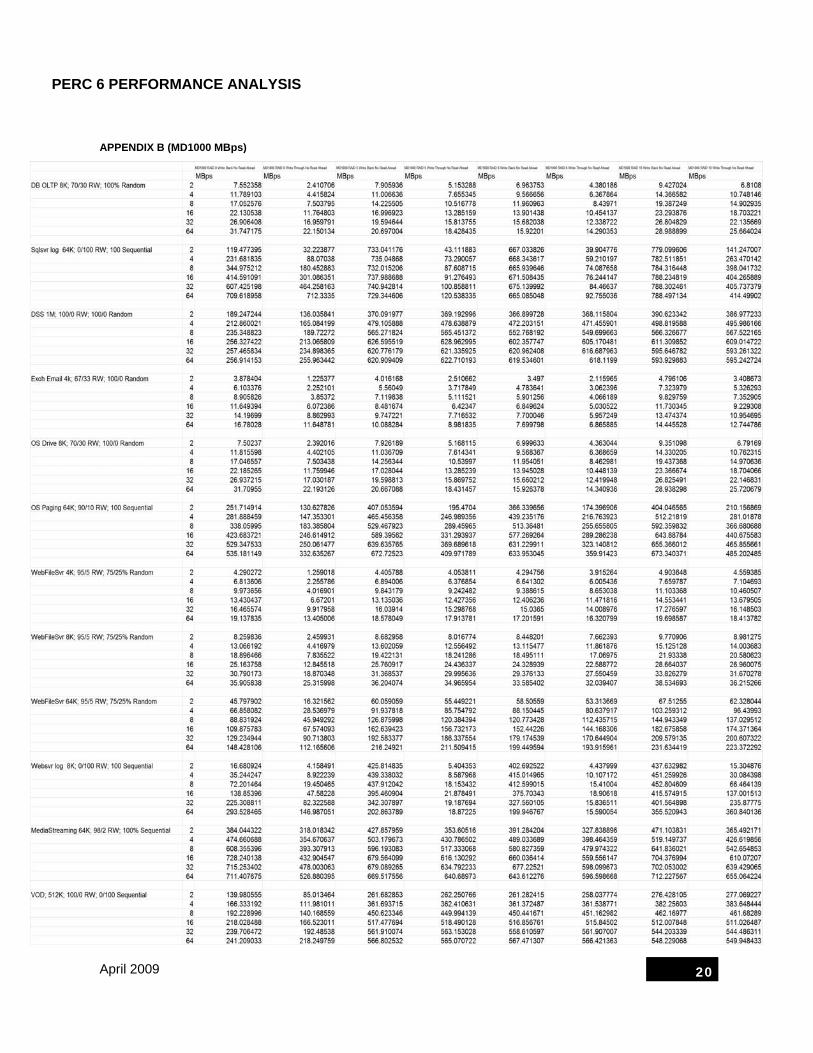
APPENDIX B (MD1000 MBps)
April 2009 20
PERC 6 PERFORMANCE ANALYSIS
PERC 6 PERFORMANCE ANALYSIS
21 April 2009
APPENDIX B (MD1000 IOps)

PERC 6 PERFORMANCE ANALYSIS
22 April 2009
APPENDIX B (MD1120 MBps)
PERC 6 PERFORMANCE ANALYSIS
23 April 2009
APPENDIX B (MD1120 IOps)
PERC 6 PERFORMANCE ANALYSIS
24 April 2009
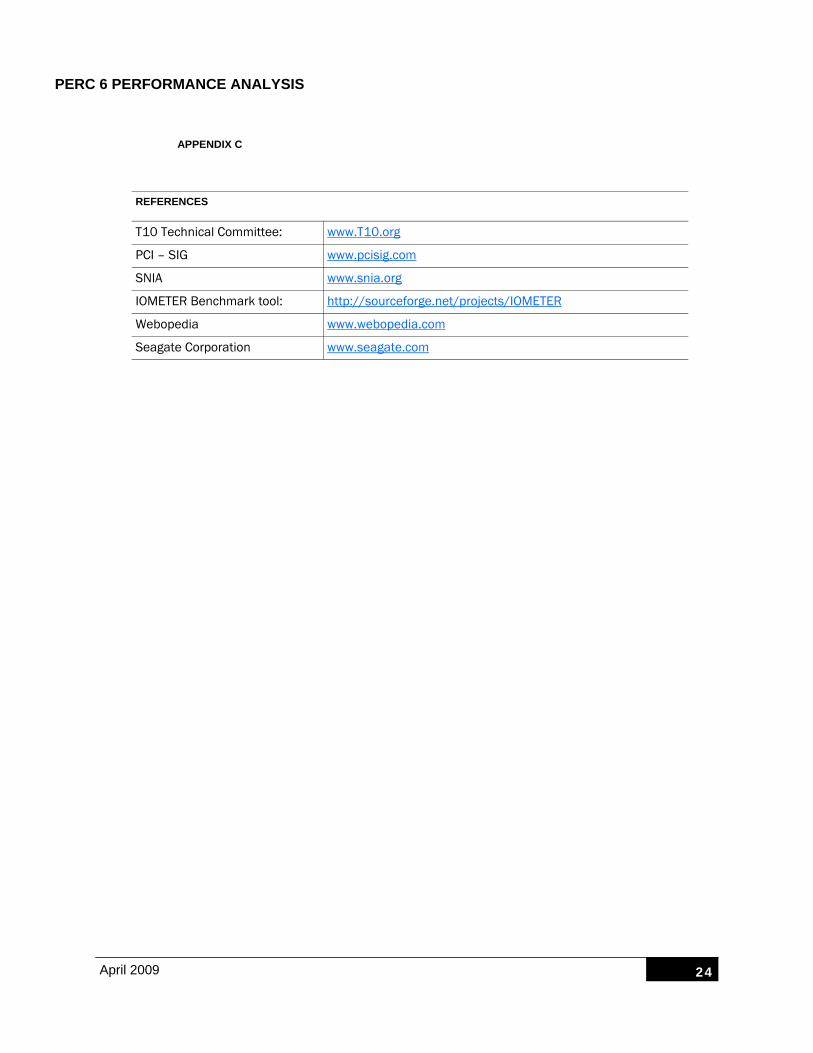
REFERENCES
T10 Technical Committee: www.T10.org
PCI – SIG www.pcisig.com
SNIA www.snia.org
IOMETER Benchmark tool: http://sourceforge.net/projects/IOMETER
Webopedia www.webopedia.com
Seagate Corporation www.seagate.com
APPENDIX C