title: the influence of head impact threshold for...
TRANSCRIPT

1
Title: The influence of head impact threshold for reporting data in contact and collision sports: System review and original data analysis.
Running title: Reporting impact data in sport. Authors: King, D., PhD1,2 Hume, P., PhD1 Gissane, C., PhD,3 Brughelli, M., PhD,1 Clark, T MSc4
1. Sports Performance Research Institute New Zealand School of Sport and Recreation Faculty of Health and Environmental Sciences Auckland University of Technology, New Zealand 2. Department of Paramedicine
School of Clinical Sciences Faculty of Health and Environmental Sciences Auckland University of Technology, New Zealand 3. School of Sport Health and Applied Science St Mary’s University, Twickenham, Middlesex, United Kingdom 4. Australian College of Physical Education
Faculty of Human Performance Sydney Olympic Park NSW Australia
Correspondence to: Doug King Emergency Department Hutt Valley District Health Board Private Bag 31-907 Lower Hutt New Zealand Email: [email protected] Keywords: concussion, acceleration, linear, rotational
Submitted to: Sports Medicine
Abstract: 273 words Manuscript: 5,616 words References: 128 Tables: 2 Figures: 2

2
Title: The influence of head impact threshold for reporting data in contact and collision sports: System review and original data analysis.
Running title: Reporting head impact data in sport.
3
Abstract
Background: Head impacts and resulting head accelerations cause concussive injuries. There is no standard for
reporting head impact data in sports to enable comparison between studies.
Objective: To outline methods for reporting head impact acceleration data in sport and the effect of the
acceleration thresholds on the number of impacts reported.
Methods: A systematic review of accelerometer systems utilised to report head impact data in sport. Calculation
of the effect of using different thresholds on a set of impact data from 38 amateur senior rugby players in New
Zealand (NZ) over a competition season.
Results: Of 52 studies identified, 42% reported impacts using >10g threshold. Studies reported descriptive
statistics as mean ±standard deviation, median, 25th to 75th interquartile range, and 95th percentile. Application of
the varied impact thresholds to the NZ data set resulted in 20,687 impacts >10g; 11,459 (45% less) impacts
>15g; and 4,024 (81% less) impacts >30g.
Discussion: Linear and angular raw data were most frequently reported. Metrics combining raw data may be
more useful, however validity of the metrics has not been adequately addressed for sport. Differing data
collection methods and descriptive statistics for reporting head impacts in sports limits inter-study comparisons.
Consensus on data analysis methods for sports impact assessment is needed, including thresholds. Based on
the available data, the 10g threshold is the most commonly reported impact threshold and should be reported as
the median with 25th and 75th interquartile ranges as the data is non-normal distributed. Validation studies are
required to determine the best threshold and metrics for impact acceleration data collection in sport.
Conclusion: Until in-field validation studies are completed, it is recommended that head impact data should be
reported as median and interquartile ranges using the 10g impact threshold.

4
1. Introduction
1.1 Head impacts cause injury – evidence
Known as the ‘silent injury’,[1] and often reported by the media and sporting circles as a ‘knock to the head’,[2]
sport-related concussions (hereafter called ‘concussion’) are a subset of mild traumatic brain injuries
(mTBIs)[3] and have become an increasingly serious concern for all sporting activities worldwide.[4-6]
Research into concussions[7] has increased over the years leading to greater insight into the causes and
the effects of these injuries. Research[8-27] has sought to better determine the head linear and rotational
accelerations involved in concussion injuries through the use of telemetry. By adapting radio-telemetry
that was utilised for astronauts,[28] the telemetry system has been in use since 1961 for the recording of
impacts for football players and concussions[29] that have occurred.
1.2 A cumulative head impact threshold may be related to concussion
The immediate and long term effects of multiple and repeated blows to the head that athletes receive in contact
sporting environments are a growing concern in clinical practice.[30, 31] Concern has grown about the effects of
subconcussive impacts to the head and how these impacts may adversely affect cerebral functions.[30-32]
Subconcussive events are impacts that occur where there is an apparent brain insult with insufficient force to
result in the hallmark signs and symptoms of a concussion.[31, 33, 34] Although subconcussive events do not result
in observable signs and apparent behavioural alterations,[35, 36] they can cause damage to the central nervous
system and have the potential to transfer a high degree of linear and rotational acceleration forces to the brain.[37]
Proposed decades previously,[38, 39] exposure to repetitive subconcussive blows to the head may result in similar,
if not greater damage than a single concussive event[33] and may have cumulative effects.[40]
Participants can be exposed to a high number of impacts per season.[32] It has been suggested[41, 42] that brain
injuries come from concussive events and also from the accumulation of subconcussive impacts that result in
pathophysiological changes in the brain. As subconcussive impacts do not result in observable concussion
related signs and symptoms, these are often not medically diagnosed. The accumulation of subconcussive blows
can result in neuropsychological changes.[30, 31, 42-46] However, similar to the literature focused on concussion and
mild traumatic brain injury (mTBI), the literature on subconcussive head trauma is limited.[47] What is not known is
the number of head impacts and their intensity that might lead to concussion (i.e. a concussion cumulative
threshold). The injury threshold is likely to be different for each person given the multifactorial nature of injuries,
as per other thresholds for injuries to tendons, ligaments, muscle and bone. If a threshold could be determined,
then players could be monitored to reduce their potential risk for concussion injury – akin to cricket monitoring
players loading to the body during bowling events via the number of overs in an attempt to reduce the risk of
back stress fractures.[48]
1.3 Impacts can be measured with a number of technologies
5
Head impact dynamics have been analysed through the use of video analysis,[8] in game measurements,[20-25, 27,
49-52] numerical methods[9-12] and reconstructions using anthropometric test devices[13-19] in helmeted sports such
as American football[20-23] and ice hockey[24, 25] and in un-helmeted sports such as soccer[26] and rugby union.[27]
The on-field assessment of head impacts has been captured with a head impact telemetry system (HITS)
(Simbex, LLC, Lebanon, NH) using helmet mounted accelerometers enabling determination of the head linear
and rotational accelerations in American football,[21, 23, 49, 53-55] ice hockey[24, 25] and in a headband in youth
soccer.[26] The data collected through the HITS has enabled analytical risk functions,[16, 51, 56, 57] concussion risk
curves,[51] and risk weighted exposure metrics[58] to be developed further assisting in the identification of sports
participants at risk of concussive injuries. More recently, instrumented mouthguards known as XGuard
(X2biosystems, Inc., Seattle, WA, USA) have documented head impacts in rugby union.[27]
1.4 Thresholds have differed for reporting impact data in contact and collision sports
Although there is an increasing amount of published literature reporting impact accelerations to the head in the
sporting environment, there is less attention focussed on identifying what is a subconcussive impact and where
this occurs. Studies[55, 59, 60] have been conducted reporting the impacts absorbed by the head during activities
undertaken daily. Although impacts to the head and body under 10g have been reported[55], these activities such
as walking, jumping, running and sitting are considered to be non-contact events.[21, 61] However, impacts greater
than 10g occurring from contact events that do not result in acute signs or symptoms of concussion, are
identified as subconcussive impacts.[43]
1.5 To enable comparison of studies, a consistent threshold for reporting is needed
Head impact data are essential to understand the biomechanics of head injury to develop potential injury
prevention strategies. There is currently no standard for reporting head impact data to enable comparison
between studies. Currently the use of accelerometers may not necessarily provide the meaningful inter-study
comparisons that are sought due to data collection, processing and methodologies not being standardized.[62]
Studies utilising different impact thresholds have proposed varying conclusions based on the methodological and
reporting approaches undertaken.
1.6 Aim of the study
The rationale for this study is based on questions around the magnitude of a single impact that may result in
concussion, the number of impacts needed to result in signs and symptoms of concussion, and individual player
differences that might affect injury tolerance levels for concussion. Given head impacts are likely to cause
concussive injury, and the number of head impacts may be related to a potential concussion threshold (i.e. a
cumulative threshold), the number of head impacts should be monitored in players. However, given impacts can

6
be measured with a number of technologies (e.g. instrumented behind the ear patches, mouthguards, head
gear), and thresholds have differed for reporting impact data in contact and collision sports, a threshold for
reporting impact data in sport is needed to enable comparison of studies.
Therefore the aims of this study were to: a) outline the methods for reporting head impact data in sport; and b) to
identify the effects of the acceleration threshold on the impacts reported.
2. Methods
To outline methods for reporting head impact data, a systematic review of the literature was conducted. The
guideline for reporting observational studies (MOOSE: Meta-analysis Of Observational Studies in
Epidemiology)[63] was followed for the empirical literature evidence included in this study. The MOOSE checklist
contains specifications and guidelines for the conduct and review of the studies. To evaluate the effects of
acceleration thresholds on the number of impacts reported, variable thresholds were applied to head impact data
obtained from 38 senior amateur rugby union players during 19 matches in New Zealand.[27]
2.1 Literature review to identify thresholds for reporting head impact data in contact and collision
sport
2.1.1 Search strategy for identification of publications
A total of 53,183 studies available online from Jan 1990 to June 2015 identified through the SCOPUS
(n=10,080), SportDiscus (n= 1,185), OVID (n= 9,724), Science Direct (n= 27,798) and Health Sciences (n=
4,376) databases were screened for eligibility (see Fig. 1). The keywords utilized for the search of relevant
research studies included combinations of ‘head impact telemetry system*’, ‘HITS’, ‘concussion’, ‘impact*’,
‘traumatic brain injury’, ‘chronic traumatic encephalopathy’, ‘angular’, ‘linear’, ‘rotational’, ‘acceleration’,
‘biomechanics’, ‘head acceleration’ and ‘risk’. An example of the Health Sciences search strategy is provided in
the Electronic Supplementary Material (ESM) S1. Searches were limited to ‘English language’ and ‘humans’ only.
The references of all relevant articles were searched for further articles. All publications identified were initially
screened by publication title and abstract to identify eligibility. In cases of discrepancies of eligibility another
author assessed the publication to screen for eligibility.
To establish some control over heterogeneity of the studies,[63] inclusion criteria were established. Any published
study or book that did not meet the inclusion criteria was excluded from the study. Publications were included if
they reported head impact biomechanics and met the following inclusion criteria:
(i) The study was published in a peer reviewed journal or book; and
(ii) The study reported the biomechanics of impacts to the head in a sporting environment; and
(iii) The study addressed one or more of the keywords relating to this study.

7
Reviewed studies were excluded from this review if it was identified that the publication:
(i) Was unavailable in English; or
(ii) Did not provide additional information specifically addressing areas relating to this study;
(iii) Was a case study; or
(iv) Reviewed head impact studies.
2.1.2 Assessment of publication quality
The 52 studies[10, 12, 16, 20-27, 32, 37, 42, 49, 51-54, 57, 58, 61, 64-92] meeting the inclusion criteria (see Table 1) were
assessed for quality by two of the authors on the basis of the MOOSE[63] published checklist. Heterogeneity of
the studies included in the literature review was expected as there might be differences in the study design,
population and outcomes.[63] As a result of the MOOSE[63] checklist, the studies included had a median score of
4.8/6.0 with a range of 4.0-5.0.
2.2 Application of head impact thresholds identified from the literature to the rugby head impact
data set
The data set, used for the application of the head impact thresholds identified from the literature review, was
from 38 amateur rugby union players who wore instrumented mouthguards over a season of matches.[27] The
raw data set was filtered by linear acceleration thresholds at increments of 1g to establish the percentage of
impacts removed at each threshold from 10.0g to 30.0g. This percentage was then used to calculate the possible
number of impacts removed for the impact thresholds used in the different studies reviewed.
All data estimations were calculated on an Excel spreadsheet. The data were analysed using SPSS v22.0.0
(SPSS Inc.) and, as the data were non-normally distributed (Shapiro-Wilk test p<0.001), data were analysed
using a Friedman repeated measures ANOVA on ranks. Post hoc analysis with Wilcoxon signed-rank tests was
conducted with a Bonferroni correction applied. Statistical significance was set at p<0.05. The estimated number
of impacts were calculated by dividing the number of reported impacts by the estimated percentage of impacts
removed at the different thresholds. The estimated total number of reported impacts were subtracted from the
reported number of impacts to identify the possible number of impacts removed from the data set e.g. Number of
impacts reported = 161,732;[75, 76] Impact threshold = 14.4g; Based on New Zealand rugby union dataset for
20,687 impacts recorded at 10.0g when reassessed at 14.4g there were 12,091 impacts. A total of 8,569 impacts
were removed or 42% of the data set (see Fig 2). Therefore 161,732 (number of impacts reported) ÷ 42%
(percentage of impacts removed at 14.4g) gave a possible total number of impacts at the 10g threshold of
385,076. The possible total number of impacts removed from the dataset was 223,344 (i.e. 385,076 – 161,732
impacts).
8
3. Findings
3.1 Literature review
A total of 52 publications were identified that reported head impacts and met the inclusion criteria. Studies
reported impacts to the head via technology in American football,[21, 22, 26, 37, 49, 51, 52, 54, 58, 61, 64, 65, 67, 69, 73, 75, 76, 79, 80, 85]
ice hockey,[24, 25, 71, 72, 84, 92] soccer,[26] rugby union[27] and mixed martial arts and boxing.[64]
3.1.1 Impact threshold
Studies utilised different data impact acceleration thresholds (see Table 1): 42% of studies[21, 22, 24, 26, 27, 49, 52, 54, 61,
64-74] used 10g; 18% of studies[20, 23, 42, 51, 53, 58, 75-78] used 14.4g;10% of studies[37, 79-83] used 15g; 4% of studies[25, 84]
used 20g; 2% of studies[85] used 30g; 4% of studies[32, 86] reported impact data within 10g to 60g and greater than
90g. Four studies[10, 12, 16, 87] (8%) were reconstruction studies from video analysis but were included as they
reported impact biomechanics. Six studies[57, 88-92] (12%) did not report the impact threshold but did report head
impact biomechanics. One study[64] (2%) used a 7g and 10g threshold with different sporting activities.
3.2 Acceleration raw data and metrics
Apart from raw resultant linear accelerations[32, 49, 52, 61, 65, 68, 85, 86, 91] (reported in 91% of studies) and rotational
acceleration data[10, 51] (reported in 76% of studies),[12, 16, 20-24, 26, 27, 37, 54, 57, 58, 66, 69-83, 87-90] several head impact
derived variables were reported such as the Gadd Severity Index (GSI),[93] the Head Impact Criterion (HIC),[94]
Head Impact Telemetry Severity Profile (HITSP)[90] and the Risk Weighted Cumulative Exposure (RWE)[58]
metrics.
Three (4%) of the studies[26, 49, 75] reported the Gadd Severity Index (GSI). In 1966, Gadd[93] proposed the GSI
head injury severity index based on the Wayne State Tolerance Curve (WSTC). Developed from animal and
cadaver impact data, the GSI simplified the WSTC by taking into consideration the shape of the linear
acceleration time history, providing a weighting factor of 2.5 enabling the whole body acceleration data to be
plotted on log-log coordinates along a straight line. The critical value of the GSI is 1,000. If the GSI is less than
1,000 then the head impact is considered probabilistically safe. The GSI is used to quantify severe skull fractures
and brain injury risk but is not recommended for use to quantify a risk of concussion.[95] A concern of the GSI is
that it can give unrealistically high values for impacts that have a much longer pulse duration.[96] The
mathematical expression for the GSI is:
𝐺𝑆𝐼 = ∫ 𝑎(𝑡)2.5𝑑𝑡
𝑇
0

9
where a is the ‘effective’ acceleration (thought to have been the average linear acceleration) of the head
measured in terms of g, the acceleration of gravity, and t is the time in milliseconds from the start of the
impact.[97]
In 1971 a modification of the Gadd Severity Index, the Head Injury Criterion (HIC), was proposed[94] to focus the
severity index on that part of the impact that was likely to be relevant to the risk of injury to the brain. This was
done by averaging the integration of the resultant acceleration/time curve over whatever time interval yielded the
maximum value of HIC. Because this varies from one impact to another, the expression for the modified index
simply refers to times t1 and t2. The HIC is computed based on the following expression:
𝐻𝐼𝐶 = [1
𝑡2 − 𝑡1
∫ 𝑎(𝑡)𝑑𝑡
𝑡2
𝑡1
]5/2
(𝑡2 − 𝑡1)
where t2 and t1 are any two arbitrary time points during the acceleration pulse. Acceleration is measured in
multiples of the acceleration of gravity [g] and time is measured in seconds. The resultant acceleration is used for
the calculation. The US National Highway Traffic Safety Administration (NHTSA) requires t2 and t1 not to be more
than 36 ms apart (thus called HIC36) and the maximum HIC36 not to exceed 1,000. In 1998[98] the NHTSA
introduced the HIC15 where t2 and t1 was not to be more than 15 ms apart and the maximum HIC15 was not to
exceed 700. In a numerical study[99] it was estimated that a mild Traumatic Brain Injury (mTBI) tolerance for the
HIC15, where there is a 25%, 50% and 75% likelihood of an mTBI occurring, had HIC15 values of 136, 235 and
333 respectively. Only two studies[24, 76] (4%) reported HIC36 with ten studies (18%) reporting the HIC15.[10, 12, 16, 24,
26, 49, 68, 75, 76, 90]
In 2008,[90] the principal component score (PCS), a weighted sum of linear acceleration, rotational acceleration,
HIC and GSI, with objectively defined weights, was published. Now more commonly termed the Head Impact
Telemetry Severity Profile (HITSP), the HITSP is a weighted composite score including linear and rotational
accelerations, impact duration, as well as impact location. The resulting formula is:
𝐻𝐼𝑇𝑆𝑃 = 10𝑥([0.4718 𝑥 𝑠𝐺𝑆𝐼 + 0.4742 𝑥 𝑠𝐻𝐼𝐶 + 0.4336 𝑥 𝑠𝐿𝐼𝑁 + 0.2164 𝑥 𝑠𝑅𝑂𝑇] + 2)
where sX = (X-mean[X])/(SD[X]), LIN = linear acceleration, ROT = rotational acceleration, HIC = head injury
criterion, and GSI = Gadd Severity Index. The offset by 2 and scaling by 10 generates HITSP values greater than
0 and in the numerical range of the other classic measures studied. A HITSP score of 63 or greater is reported to
be an indication there is a 75% risk of a concussive injury occurring.[90] More than a quarter (30%) of the
studies[21, 37, 69, 71-74, 77, 81-83, 90] reported the HITSP.
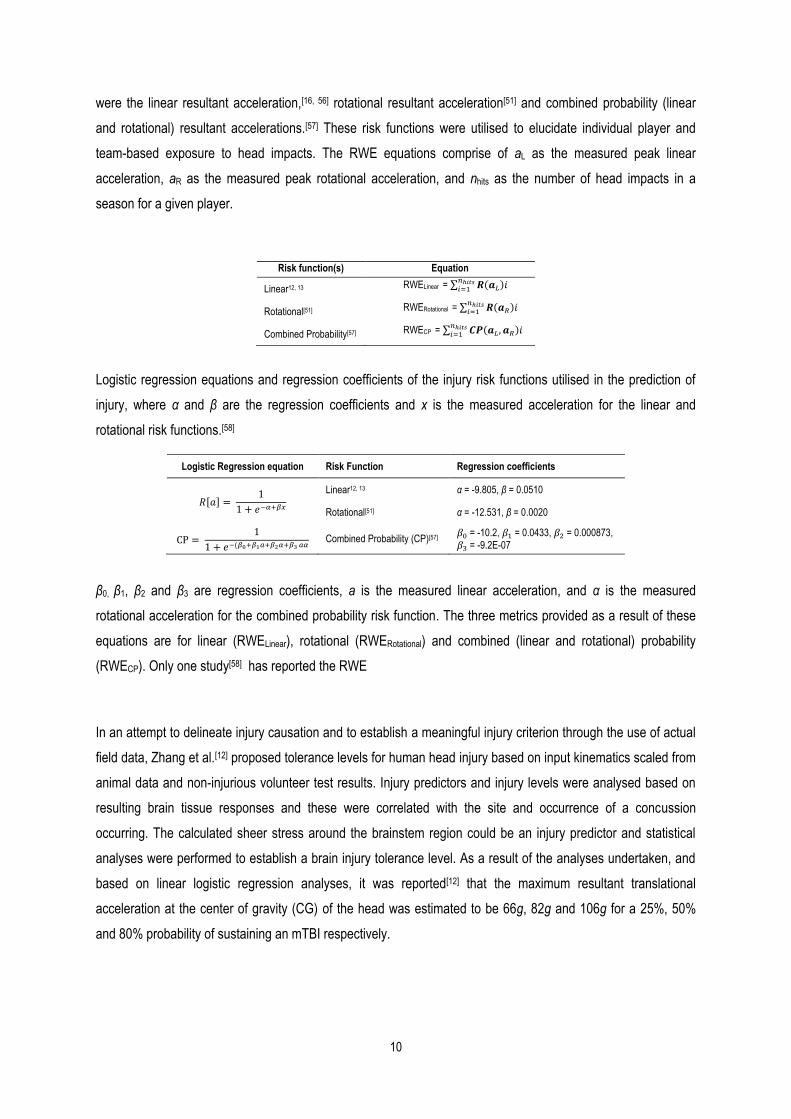
In 2013, a novel cumulative exposure metric, the Risk Weighted Cumulative Exposure (RWE) equation was
developed[58] with four previously published analytical risk functions. The four different analytical risk functions
10
were the linear resultant acceleration,[16, 56] rotational resultant acceleration[51] and combined probability (linear
and rotational) resultant accelerations.[57] These risk functions were utilised to elucidate individual player and
team-based exposure to head impacts. The RWE equations comprise of aL as the measured peak linear
acceleration, aR as the measured peak rotational acceleration, and nhits as the number of head impacts in a
season for a given player.
Risk function(s) Equation
Linear12, 13 RWELinear = ∑ 𝑹(𝒂𝐿)𝑖𝑛ℎ𝑖𝑡𝑠𝑖=1
Rotational[51] RWERotational = ∑ 𝑹(𝒂𝑅)𝑖𝑛ℎ𝑖𝑡𝑠𝑖=1
Combined Probability[57] RWECP = ∑ 𝑪𝑷(𝒂𝐿, 𝒂𝑅)𝑖𝑛ℎ𝑖𝑡𝑠𝑖=1
Logistic regression equations and regression coefficients of the injury risk functions utilised in the prediction of
injury, where α and β are the regression coefficients and x is the measured acceleration for the linear and
rotational risk functions.[58]
Logistic Regression equation Risk Function Regression coefficients
𝑅[𝑎] = 1
1 + 𝑒−𝛼+𝛽𝑥
Linear12, 13 α = -9.805, β = 0.0510
Rotational[51] α = -12.531, β = 0.0020
CP = 1
1 + 𝑒−(𝛽0+𝛽1𝑎+𝛽2𝛼+𝛽3 𝑎𝛼 Combined Probability (CP)[57]
𝛽0 = -10.2, 𝛽1 = 0.0433, 𝛽2 = 0.000873,
𝛽3 = -9.2E-07
β0, β1, β2 and β3 are regression coefficients, a is the measured linear acceleration, and α is the measured
rotational acceleration for the combined probability risk function. The three metrics provided as a result of these
equations are for linear (RWELinear), rotational (RWERotational) and combined (linear and rotational) probability
(RWECP). Only one study[58] has reported the RWE
In an attempt to delineate injury causation and to establish a meaningful injury criterion through the use of actual
field data, Zhang et al.[12] proposed tolerance levels for human head injury based on input kinematics scaled from
animal data and non-injurious volunteer test results. Injury predictors and injury levels were analysed based on
resulting brain tissue responses and these were correlated with the site and occurrence of a concussion
occurring. The calculated sheer stress around the brainstem region could be an injury predictor and statistical
analyses were performed to establish a brain injury tolerance level. As a result of the analyses undertaken, and
based on linear logistic regression analyses, it was reported[12] that the maximum resultant translational
acceleration at the center of gravity (CG) of the head was estimated to be 66g, 82g and 106g for a 25%, 50%
and 80% probability of sustaining an mTBI respectively.
11
For resultant rotational acceleration at the CG of the head this was estimated to be 4,600 rad/s2, 5,900 rad/s2 and
7,900 rad/s2 for a 25%, 50% and 80% probability of sustaining an mTBI respectively. The estimated HIC15
thresholds were 151, 240 and 369 for a 25%, 50% and 80% probability of sustaining an mTBI. These thresholds
are considerably less than the HIC15 limit of 1,000 for sustaining a serious brain injury. If the head was exposed
to a combined translational and rotational acceleration with an impact duration between 10 to 30 ms, the
suggested tolerable reversible brain injury was 85g (translational acceleration), 6,000 rad/s2 (rotational
acceleration) and HIC15 value of 240. It was reported that these values may change as more human data
become available but to date no published updates of these values have been available.
Although other variables have been proposed (Generalised Acceleration Model for Brain Injury Threshold
(GAMBIT),[14, 64, 100] and Head Impact Power (HIP);[101] these were not utilised in any studies reporting head
impacts in contact sport.
Nearly all of the studies reviewed identified the number of impacts that were recorded, however 4% studies
reported impacts in matches only, 23% recorded impacts for both match and practice activities, and 55%
combined both match and practice activity impacts. The remaining 15% of studies reviewed reported on impacts
above 90g or were reconstruction of impacts from video analysis The number of impacts ranged from 480
impacts from 22 players in Pop Warner American football[85] to 486,594 impacts from 450 players in collegiate
American football and ice hockey[89] (see Table 1).
Over half (52%) of the studies[10, 12, 16, 22, 23, 27, 37, 49, 58, 61, 65, 66, 69-75, 79, 82-86, 91, 92] reported the impact biomechanics
data as mean ± standard deviation (±SD). Some studies[23, 25, 58, 64, 73, 75, 82] (22%) also reported the head impacts
as median, but not all[23, 73] (4%) included the interquartile ranges (IQR) for the data. Of the studies that reported
the impact biomechanics by the median, only 7% reported the IQR. Most of the studies reporting the median also
reported the 95th percentile of the impacts. Other data reporting methodologies utilised within the data sets
reviewed were the median of the 95th percentile,[21] the 98th,[82, 90] 99th,[82, 90] and 99.5th[82] percentiles. Fourteen
percent of studies also included lower and upper limits[61, 71, 72, 74] for the range of impacts,[24, 89] and the mean
range[85] of the impacts. Less than a quarter of studies (23%) reported their impacts as x, y, z axis data,[22]
+1SD,[52] Cumulative Distribution Functions (CDF),[54, 58] percentage of impacts,[21, 53] and the impact duration
(ms).[16, 75, 76, 80, 81] In addition to the impact biomechanics being presented by various methodologies, 14% of
studies[12, 27, 37, 69, 74, 79, 91] also incorporated impact tolerances and impact severity levels.
3.3 Application of head impact thresholds to the rugby head impact data set
By utilising data from a previously published study[27] that used the 10g impact threshold, data were re-extracted
at differing impact thresholds from 10g to 30g. By adjusting the impact threshold (see Fig. 2) the number of
impacts decreased as the impact threshold increased (see Table 2). There were significant differences observed

12
(p<0.05) for each of the different acceleration thresholds for the number of impacts reported, the mean, median
and the 95th percentile when compared with the impacts at the 10g linear acceleration threshold (see Table 2).
Based on the differences observed in this study, at the 14.4g threshold there could have been as many as 42%
of the impacts recorded not being reported. As a result, studies[20, 23, 51, 58, 75-82, 85] using impact thresholds above
10g may have removed 2,100 to 206,573 impacts. At the 30g impact threshold it can be estimated that 80 to
85% of impacts were not reported.[85] Again, based on the differences observed in this study it is possible that
each player in the Pop Warner study[85] may have experienced a cumulative total of 1,885 impacts above 10g.
Although the impacts may not have been recorded, the players may well have been exposed to this number of
impacts between 10g and 30g. The differences between impacts reported and the possible number of impacts
(480 vs. 2,365) may result in an underestimation of the exposure risk to these players to subconcussive impacts.
4. Discussion
This study undertook to review the methods for reporting head impact data in sport and to outline the effect of
various acceleration thresholds on the number of impacts reported. A consensus on a threshold for reporting
data is important given the variation in conclusions that may be drawn if the same dataset is used with different
thresholds, as identified by our application of the range of thresholds from prior literature applied to a New
Zealand rugby union head impact data set. A standard threshold for head impact data is important given
possible monitoring of player head impact acceleration data in the hope of identifying a cumulative threshold for
concussion from subconcussive impacts.
The discussion surrounding subconcussive impacts has become popular.[32, 41, 43, 83, 102, 103] Initially the term
subconcussive impact described an impact that did not result in severe, noticeable symptoms, especially loss of
consciousness[102] However, recently, subconcussive is a term used to describe an asymptomatic non-
concussive impact to the head.[32, 41, 43, 83, 103] The issue relating to the effects of subconcussive impacts is
controversial as researchers and clinicians are divided on the true effects.[30-32, 42, 45, 104] Some research[32, 104] has
reported that these impacts have minimal effect on cognitive functions, while others[30, 31, 42, 45, 46] have reported
these impacts to be detrimental to cerebral and cognitive functions. To date, there is a paucity of evidence to
identify the impact acceleration that is adequate to produce a non-structural brain injury associated with the
neuronal changes of concussion.[30]
Animal models display metabolic changes associated with concussion, which may be similar in subconcussive
impacts.[105] To research subconcussive impacts in isolation is challenging and there are, to date, no reports on
animal models or other reliable methodologies that have been successful at identifying these impacts[105] Brain
injury may occur from concussive events as well as from an accumulation of subconcussive impacts.[41] The
effects of concussive events and multiple subconcussive impacts have been associated with long term
progressive neuropathologies and cognitive deficits.[43, 106-108] Longitudinal impact monitoring at the level where

13
these subconcussive events are beginning to occur is important, and a standard threshold needs to be
established.
4.1 What threshold should be used to monitor head impacts?
Impacts <10g of linear acceleration have been considered negligible in regards to impact biomechanical
features. The <10g impact threshold has been used in research to eliminate head accelerations from non-impact
events such as jumping and running.[21, 55, 61] The inclusion of these non-impact events to head trauma make it
difficult to distinguish between head impacts and voluntary head movement[109] and eliminating these will help
identify the true extent of the number of impacts that do occur from sports participation. A suggestion for this may
be to report the distribution of the impacts by the various resultant linear accelerations using a frequency analysis
and reporting quartile ranges i.e. 25th and 75th interquartile range. This may assist in identifying where the most
frequent resultant linear accelerations occur in the different sports. Consensus for the impact threshold will need
to be established, and should be based on validation studies to determine the best impact threshold for various
sports and injury outcomes. Biomechanical modelling of impact forces and brain movement would be needed to
identify likely impact thresholds for injury, as well as in-field validation studies using prospective monitoring of
players during tackles and impacts with the ground. As there is no established criterion for reporting head impact
biomechanics, and the majority of studies (42%)[21, 22, 24, 26, 27, 49, 52, 54, 61, 64-74] reported the resultant linear
acceleration threshold at 10g, then future studies should report all impacts above the 10g resultant linear
acceleration threshold.
4.2 What descriptive statistics should be used to report head impact biomechanics?
There were a variety of descriptive statistics used in the reporting of head impact biomechanics in the reviewed
studies which limits inter-study comparisons. Although more than half (52%) of the studies reviewed[10, 12, 16, 22, 23,
27, 37, 49, 58, 61, 64-66, 69-75, 79, 82-86, 91, 92] reported their results by means and standard deviations, the use of these
statistics may not accurately represent the true centre of the data. By reporting the mean value of the data set,
this method is subject to extreme values (i.e. outliers) such as those in skewed datasets. The use of the mean is
only appropriate if the dataset is normally distributed. In non-normal distributed data, the median is the most
useful for describing the center of the data. Of the studies[23, 25, 58, 73, 75, 82] reviewed (22%) that reported the results
by the median would more accurately have identified the center of the dataset. The New Zealand senior amateur
head impact data were non-normally distributed (i.e. not symmetrical) therefore the use of descriptive statistics
that can account for this skewness needed to be considered. To enable inter-study comparisons, and until a
consensus is established for the reporting of head impact biomechanics, future studies should report the median
[25th and 75th interquartile ranges] for all head impact biometrics.

14
4.3 What acceleration metrics should be used to monitor head impacts?
It has been suggested that both resultant linear and rotational accelerations should be reported with head impact
metrics.[110] As there is an improved correlation between impact biomechanics and the occurrence of a
concussion, than when linear accelerations are reported alone.[12] Research[18, 111-114] suggests that the brain is
more sensitive to rotational than linear accelerations. Rotational accelerations are reported[12, 115] to be correlated
to the strain response of the brain and the primary mechanism for diffuse brain injury including concussion,
contusion, axonal injuries and loss of consciousness.[111, 112, 116, 117] Linear accelerations are reported to result in
the intracranial pressure response of the brain and be the primary mechanism for skull fractures and epidural
haematomas.[115, 118] Reporting both linear and rotational accelerations should assist with identification of possible
brain injury.
More recently[57, 58] resultant linear and rotational acceleration results have been combined into a risk weighted
exposure (RWE) metric. This metric can be beneficial for fully capturing the linear (RWELinear), rotational
(RWERotational) and combined probability (from linear and rotational) (RWECP) of the risk of a concussion as it
accounts for the frequency and severity of each player’s impacts. The HIC and GSI are the most frequently
utilised head injury assessment functions in helmet and traffic restraint safety standards,[12, 119] however this was
not reflected in the sport head impact studies reviewed. Based on the Wayne State University tolerance curve, [94]
the HIC and GSI criteria are considered plausible ways of determining relative risk of severe head injury[120] but
they do not account for the complex motion of the brain, or the contribution of resultant rotational acceleration to
the head.[12, 14, 101] In particular the HIC only deals with frontal impacts and was not designed to be used for lateral
impacts that can be found in head impact biomechanics[119] and arbitrarily defines an ‘unsafe pulse” within a ‘safe
pulse” by discounting any data outside the two time points chosen for the calculation of the HIC value.[121] The
GSI and HIC may be beneficial for evaluating acute head trauma due to single impacts but they are reportedly
not beneficial for repeated impacts at lower acceleration magnitudes[119] such as those found in contact sports
such as American football, rugby union and soccer. The inclusion of the HIC and GSI by studies reporting on
head impact biomechanics may be more historical thus providing the ability for inter-study comparisons with
previous studies. However, as they are used to calculate multiple impacts and provide a nonsensical number, the
value of these metrics are limited. The use of HIC and GSI in future studies, and the value that these metrics
provide, needs to be standardised. Consensus is required on the incorporation of these and other biomechanical
metrics into future research.
4.4 Limitations in the use of accelerometery
The use of accelerometers to record and assess movement is not new to the scientific community.[122, 123] There
have been some inter-study and international comparability limitations reported for use of accelerometers to
report physical activity.[62] The identified limitations for physical activity accelerometers may be identical to areas

15
now being faced by studies reporting the biomechanics of impacts to the head. The majority of studies reporting
head impact biomechanics have utilised HITS,[20-24, 32, 37, 42, 49, 51-54, 57, 58, 61, 65-83, 85, 86, 88-91] or a variant.[26] More
recently, an electronic mouthguard has been used to assess head impacts in rugby union.[27]
The issues identified with the use of accelerometers for physical activity[62] include affordability of the
accelerometers,[62] and the administration burden[62] to the participants and researcher(s) given post data
collection analysis. The choice of accelerator brand,[124] generation[125] and firmware version,[126] wearing
position[127] based on the sports code requirements (i.e. helmet mounted vs. headband mounted vs. mouthguard
embedded vs. patch), specifics of the research being undertaken such as the epoch length[128, 129] (match vs.
training vs. combined), data imputation methods,[130] dealing with spurious data[131] and the reintegration of
smaller epochs into larger epochs[132] are all considerations for use of accelerometers. In addition to the issues
identified, there are technological developments, emerging methodological questions and a lack of academic
consensus that may also hinder the development of uniformity in the utilisation of accelerometers[62] for recording
head impact biomechanics.
In comparing the New Zealand rugby union data with data collected with the use of the HITS, it must be noted
that these are different impact telemetry systems. The mouthguard is reported to have a 10% error for linear and
rotation acceleration and for angular velocity with an average offset of 2° for azimuth and elevation impact
location.[133, 134] Although the correlation of the AIM mouthguard with laboratory head-forms is good, the impact
measurements should be assumed to have some form of error that is dependent on impact conditions and the
measure of interest and the variability tested.[89, 135] It is unlikely that the mouthguard was tested under all of the
activities seen in rugby union matches such as the rucks, mauls, lineouts and scrum situations. How these rugby
activities correlate to the laboratory conditions is unknown. .Although the majority of the impact biomechanics
studies reported in this review are helmet based telemetry systems, there is a paucity of studies reporting on
head impact biomechanics with other systems such as the mouthguard and headband. In addition there are no
published studies comparing the HITS with other forms of impact telemetry systems such as the X2Biosystems
All-In-Mouth (AIM) mouthguard.
A final consideration to the use of accelerometers in recording impacts is the need for concurrent video-analysis
to enable comparison and verification of the impacts. This would enable the identification of non-impact activities
where an impact has been recorded such as post-try celebrations, dropping equipment onto the ground, or other
activities where the equipment may record an impact. In the case of the New Zealand rugby union data, only
impacts that occurred in the tackle with the player standing were able to be verified.[27] The percentage of
impacts that were identified at the 10g inclusion limit, that were able to be visualised by video review and
analysis, varied from 65% to 85% of the total impacts recorded per match.[27]
4.5 What are the long term implications of repeated head impacts?

16
The use of impact tolerance and impact severity level data may be important if a risk assessment is undertaken
for possible long term implications from repetitive head impacts (RHI). Recently in a small sample[66] of collegiate
players with no reported concussions after a season of American football, there were white matter changes that
correlated with multiple head impact measures. Participants with more than 30-40 RHI’s with peak rotational
accelerations >4,500 radians per second per second (rad/s2) per season (r=0.91; p<0.001), and more than 10-15
RHI’s >6,000 rad/s2 (r=0.81; p<0.001), were significantly correlated with post-season white matter changes.[66]
These changes post season imply a relationship between the number of RHIs that occur over a season of
American football and white matter injury, despite no clinically evident concussion being recorded.[66]
The inclusion of impact tolerances and impact severity levels may assist with the identification of players at risk
of possible long term injuries. Impact tolerance may also act as an indicator of when to rest players if they are
exposed to RHIs above >4,500 rad/s2 and >6,000 rad/s2. This type of information will assist in formulating a
detailed understanding of the exposure and mechanism of injury of concussion.[53, 136] Further research is
required to evaluate the injury tolerance of concussive type injuries, to develop interventions to reduce the
likelihood of any concussive type injuries, and to develop exposure durations and stand down periods to
establish a broader understanding of the potential role of subconcussive events and long term health.[53]
5. Conclusion
This study identified the methodological differences in the threshold limits of impacts to the head as a result of
participation in contact sports. Of the 34 studies, 39% reported impacts at the 10g impact threshold while 22% of
studies used the 14.4g impact threshold. Resultant linear accelerations were most frequently reported (91%)
while 76% reported resultant rotational accelerations. Nearly three-quarters (74%) of studies reported both
resultant linear and rotational accelerations. Impact data were most frequently (52%) reported as mean ±
standard deviation (±SD). Some (10%) studies reported the head impact data as median, but not all (4%)
included the interquartile ranges (IQR) for these data.
The influence of head impact thresholds was shown using head impact data obtained from 38 senior amateur
rugby union players during 19 matches in New Zealand. Application of the varied impact thresholds resulted in
20,687 impacts >10g; 11,459 (44.6% less), impacts >15g; and 4,024 (80.5% less) impacts >30g.
Given head impacts are likely to cause concussive injury, and the number of head impacts may be related to a
potential concussion threshold (i.e. a cumulative threshold), the number and severity of head impacts should be
monitored in players. However, impacts can be measured with several technologies (e.g. instrumented behind
the ear patches, mouthguards, head gear), and thresholds have differed for reporting impact data in contact and
collision sports. Consensus is therefore required to identify the reporting modalities (e.g. linear threshold,
descriptive calculations), utilised in future impact studies to enable between study comparisons. Until in-field

17
validation studies are completed, it is recommended that data should be reported as mean ± standard deviation,
median and interquartile ranges using the 10g impact threshold.
Acknowledgments: The authors declare that there are no competing interests associated with the research
contained within this manuscript. No sources of funding were utilized in conducting this study. According to the
definition given by the International Committee of Medical Journal Editors (ICMJE), the authors listed above
qualify for authorship on the basis of making one or more of the substantial contributions to the intellectual
content of the manuscript.
Conflicts of interest: None.

18
6. References
1. Kirkwood M, Yeates K, Taylor H, et al. Management of pediatric mild traumatic brain injury: A
neuropsychological review from injury through recovery. Clin Neuropsychol. 2008;22(5):769-800.
2. Khurana V, Kaye A. An overview of concussion in sport. J Clin Neurosci. 2012;19(1):1-11.
3. McCrory P, Meeuwisse W, Aubry M, et al. Consensus statement on concussion in sport: the 4th
International Conference on Concussion in Sport held in Zurich, November 2012. Br J Sports Med.
2013;47(5):250-8.
4. Covassin T, Elbin III R, Sarmiento K. Educating coaches about concussion in sports: evaluation of the
CDC's "Heads Up Concussion in Youth Sports" initiative. J School Health. 2012;82(5):233-8.
5. De Beaumont L, Brisson B, Lassonde M, et al. Long-term electrophysiological changes in athletes with
a history of multiple concussions. Brain Inj. 2007;21(6):631-44.
6. McCrory P. Sports concussion and the risk of chronic neurological impairment. Clin J Sports Med.
2011;21(1):6-12.
7. King D, Brughelli M, Hume P, et al. Assessment, management and knowledge of sport-related
concussion: Systematic review. Sports Med. 2014;44(4):449-71.
8. McIntosh A, McCrory P, Comerford J. The dynamics of concussive head impacts in rugby and
Australian rules football. Med Sci Sports Exerc. 2000;32(12):1980-4.
9. Baumgartner D, Willinger R, Shewchenko N, et al. Tolerance limits for mild traumatic brain injury
derived from numerical head impact relication. Proceedings of the IRCOBI Conference on the
Biomechanics of Impact; 2001 Oct 10-12; Isle of Man (UK): IRCOBI; 2001 Oct 10-12. p. 353-5.
10. Fréchède B, McIntosh A. Numerical reconstruction of real-life concussive football impacts Med Sci Sport
Exerc. 2009; 41(2):390-8.
11. Shewchenko N, Withnall C, Keown M, et al. Heading in football. Part 2: Biomechanics of ball heading
and head response. Br J Sports Med. 2005;39(Suppl 1):i26-i32.
12. Zhang L, Yang J, King A. A proposed injury threshold for mild traumatic brain injury. J Biomed Eng.
2004;126(2):226-36.
13. Gilchrist A, Mills NJ. Protection of the side of the head. Accid Anal Prev. 1996;28(4):525-35.
14. Newman J, Barr C, Beusenberg M, et al. A new biomechanical assessment of mild traumatic brain
injury. Part 2 - results and conclusions. International IRCOBI Conference on the Biomechanics of
Impacts 2000; 2000; Montpellier (France); 2000. p. 223-33.
15. Pellman E, Viano D, Tucker A, et al. Concussion in professional football: location and direction of helmet
impacts-Part 2. Neurosurgery. 2003;53(6):1328-41.
16. Pellman E, Viano D, Tucker A, et al. Concussion in professional football: reconstruction of game
impacts and injuries. Neurosurgery. 2003;53(4):799-814.
17. Viano D, Pellman E. Concussion in professional football: biomechanics of the striking player - part 8.
Neurosurgery. 2005;56(2):266-80.

19
18. Viano DC, Casson IR, Pellman EJ. Concussion in professional football: biomechanics of the struck
player - part 14. Neurosurgery. 2007;61(2):313-27; discussion 27-28.
19. Withnall C, Shewchenko N, Gittens R, et al. Biomechanical investigation of head impacts in football. Br
J Sports Med. 2005;39(suppl 1):i49-i57.
20. Cobb B, Urban J, Davenport E, et al. Head impact exposure in youth football: Elementary school ages
9–12 years and the effect of practice structure. Ann Biomed Eng. 2013;21(12):2463-73.
21. Crisco J, Wilcox B, Beckwith J, et al. Head impact exposure in collegiate football players. J Biomech.
2011; 44(15):2673-8.
22. Rowson S, Brolinson G, Goforth M, et al. Linear and angular head acceleration measurements in
collegiate football. J Biomed Eng. 2009;131(061016):1-7.
23. Young T, Daniel R, Rowson S, et al. Head impact exposure in youth football: elementary school ages 7-
8 years and the effect of returning players. Clin J Sport Med. 2014;24(5):416-21.
24. Reed N, Taha T, Keightley M, et al. Measurement of head impacts in youth ice hockey players. Int J
Sports Med. 2010;31(11):826-33.
25. Wilcox B, Beckwith J, Greenwald R, et al. Head impact exposure in male and female collegiate ice
hockey players. J Biomech. 2013;47(1):109-14.
26. Hanlon E, Bir C. Real-time head acceleration measurements in girls youth soccer. Med Sci Sports
Exerc. 2012;44(6):1102-8.
27. King D, Hume P, Brughelli M, et al. Instrumented mouthguard acceleration analyses for head impacts in
amateur rugby union players over a season of matches. Am J Sports Med. 2015;43(3):614-24.
28. Reid S, Epstein H, Louis M, et al. Physiologic response to impact. J Trauma. 1975;15(2):150-2.
29. Reid S, Tarkington J, Epstein H, et al. Brain tolerance to impact in football. Surg Gynecol Obstet.
1971;133(6):929-36.
30. Baugh C, Stamm J, Riley D, et al. Chronic traumatic encephalopathy: neurodegeneration following
repetitive concussive and subconcussive brain trauma. Brain Imaging Behav. 2012;6(2):244-54.
31. Gavett B, Stern R, McKee A. Chronic traumatic encephalopathy: A potential late effect of sport-related
concussive and subconcussive head trauma. Clin Sports Med. 2011;30(1):179-88.
32. Gysland S, Mihalik J, Register-Mihalik J, et al. The relationship between subconcussive impacts and
concussion history on clinical measures of neurologic function in collegiate football players. Ann Biomed
Eng. 2012;40(1):14-22.
33. Webbe F, Barth J. Short-term and long-term outcome of athletic closed head injuries. Clin Sports Med.
2003;22(3):577-92.
34. Witol A, Webbe F. Soccer heading frequency predicts neuropsychological deficits. Arch Clin
Neuropsychol. 2003;18(4):397-417.
35. Bauer J, Thomas T, Cauraugh J, et al. Impacts forces and neck muscle activity in heading by collegiate
female soccer players. J Sports Sci. 2001;19(3):171-9.

20
36. Dashnaw M, Petraglia A, Bailes J. An overview of the basic science of concussion and subconcussion:
Where we are and where we are going. Neurosurg Focus. 2012;33(6):E5.
37. Broglio SP, Eckner J, Martini D, et al. Cumulative head impact burden in high school football. J
Neurotrauma. 2011;28(10):2069-78.
38. Tysvaer A, Løchen E. Soccer injuries to the brain: A neuropsychologic study of former soccer players.
Am J Sports Med. 1991;19(1):56-60.
39. Unterharnscheidt F. About boxing: Review of historical and medical aspects. Tex Rep Biol Med.
1970;28(4):421-95.
40. Shultz S, MacFabe D, Foley K, et al. Sub-concussive brain injury in the Long-Evans rat induces acute
neuroinflammation in the absence of behavioral impairments. Behav Brain Res. 2012;229(1):145-52.
41. Spiotta A, Shin J, Bartsch A, et al. Subconcussive impact in sports: a new era of awareness. World
Neurosurg. 2011;75(2):175-8.
42. Talavage T, Nauman E, Breedlove E, et al. Functionally-detected cognitive impairment in high school
football players without clinically-diagnosed concussion. J Neurotrauma. 2014;31(4):327-38.
43. Bailes J, Petraglia A, Omalu B, et al. Role of subconcussion in repetitive mild traumatic brain injury. J
Neurosurg. 2013;119(5):1235-45.
44. Erlander D, Kutner K, Barth J, et al. Neuropsychology of sports-related head injury: dementia pugilistica
to post concussion syndrome. Clin Neurophysiol. 1999;13(2):193-209.
45. McKee A, Cantu R, Nowinski C, et al. Chronic traumatic encephalopathy in athletes: progressive
tauopathy after repetitive head injury. J Neuropathol Exp Neurol. 2009;68(7):709-35.
46. Poole V, Abbas K, Shenk T, et al. MR spectroscopic evidence of brain injury in the non-diagnosed
collision sport athlete. Dev Neuropsychol. 2014;39(6):459-73.
47. Rutherford A, Stephens R, Potter D. The neuropsychology of heading and head trauma in association
football (soccer): A review. Neuropsychol Re. 2003; 13(3):153-79.
48. Johnson M, Ferreira M, Hush J. Lumbar vertebral stress injuries in fast bowlers: A review of prevalence
and risk factors. Phys Ther Sport. 2012;13(1):45-52.
49. Duma S, Manoogian S, Bussone W, et al. Analysis of real-time head accelerations in collegiate football
players. Clin J Sport Med. 2005;15(1):3-8.
50. Naunheim R, Standeven J, Richter C, et al. Comparison of impact data in hockey, football, and soccer.
J Trauma. 2000;48(5):938-41.
51. Rowson S, Duma S, Beckwith J, et al. Rotational head kinematics in football impacts: An injury risk
function for concussion. Ann Biomed Eng. 2012; 40(1):1-13.
52. Schnebel B, Gwin J, Anderson S, et al. In vivo study of head impacts in football: A comparison of
National Collegiate Athletic Association division I versus high school impacts. Neurosurgery.
2007;60(3):490-6
53. Crisco J, Fiore R, Beckwith J, et al. Frequency and location of head impact exposures in individual
collegiate football players. J Athl Train. 2010;45(6):459-559.

21
54. Daniel R, Rowson S, Duma S. Head impact exposure in youth football. Ann Biomed Eng.
2012;40(4):976-81.
55. Ng T, Bussone W, Duma S. The effect of gender and body size on linear accelerations of the head
observed during daily activities. Biomed Sci Instrum. 2006;42:25-30.
56. Rowson S, Duma S. Development of the STAR evaluation system for football helmets: Integrating
player head impact exposure and risk of concussion. Ann Biomed Eng. 2011; 39(8):2130-40.
57. Rowson S, Duma S. Brain injury prediction: Assessing the combined probability of concussion using
linear and rotational head acceleration. Ann Biomed Eng. 2013; 41(5):873-82.
58. Urban J, Davenport E, Golman A, et al. Head impact exposure in youth football: High school ages 14 to
18 years and cumulative impact analysis. Ann Biomed Eng. 2013;41(12):2474-87.
59. Allen M, Weir-Jones I, Eng P, et al. Acceleration perturbations of daily living: A comparison to 'whiplash'.
Spine (Phila Pa 1976). 1994;19(11):1285-90.
60. Kavanagh J, Barrett R, Morrison S. Upper body accelerations during walking in healthy young and
elderly men. Gait Posture. 2004;20(3):291-8.
61. Mihalik J, Bell D, Marshall S, et al. Measurements of head impacts in collegiate football players: An
investigation of positional and event type differences. Neurosurgery. 2007;61(6):1229-35.
62. Pedišić Ž, Bauman A. Accelerometer-based measures in physical activity surveillance: current practices
and issues. Br J Sports Med. 2014;doi: 10.1136/bjsports-2013-093407.
63. Stroup D, Berlin J, Morton S, et al. Meta-analysis of observational studies in epidemiology: A proposal
for reporting. J Am Med Assoc. 2000;283(15):2008-12.
64. Hernandez F, Wu L, Yip M, et al. Six degree-of-freedom measurements of human mild traumatic brain
injury. Ann Biomed Eng. 2015;doi: 10.1007/s10439-014-1212-4.
65. Brolinson P, Manoogian S, McNeely D, et al. Analysis of linear head accelerations from collegiate
football impacts. Curr Sports Med Rep. 2006;5(1):23-8.
66. Bazarian J, Zhu T, Zhong J, et al. Persistent, long-term cerebral white matter changes after sports-
related repetitive head impacts. PLoS ONE. 2014;9(4):1-12.
67. Crisco J, Wilcox B, Machan J, et al. Magnitude of head impact exposures in individual collegiate football
players. J Appl Biomech. 2012;28(2):174-83.
68. Funk J, Rowson S, Daniel R, et al. Validation of concussion risk curves for collegiate football players
derived from HITS data. Ann Biomed Eng. 2011; 40(1):79-89.
69. Harpham J, Mihalik J, Littleton A, et al. The effect of visual and sensory performance on head impact
biomechanics in college football players. Ann Biomed Eng. 2014;42(1):1-10.
70. Mihalik J, Guskiewicz K, Marshall S, et al. Does cervical muscle strength in youth ice hockey players
affect head impact biomechanics? Clin J Sport Med. 2011;21(5):416-21
71. Mihalik J, Guskiewicz K, Marshall S, et al. Head impact biomechanics in youth hockey: Comparisons
across playing position, event types, and impact locations. J Biomed Eng. 2012;40(1):141-9.
22
72. Mihalik J, Greenwald R, Blackburn J, et al. Effect of Infraction Type on Head Impact Severity in Youth
Ice Hockey. Med Sci Sport Exerc. 2010;42(8):1431-8
73. Munce T, Dorman J, Thompson P, et al. Head impact exposure and neurologic function of youth football
players. Med Sci Sport Exerc. 2015;doi: 10.1249/MSS.0000000000000591.
74. Ocwieja K, Mihalik J, Marshall S, et al. The effect of play type and collision closing distance on head
impact biomechanics. Ann Biomed Eng. 2012;40(1):90-6.
75. Beckwith J, Greenwald R, Chu J, et al. Head impact exposure sustained by football players on days of
diagnosed concussion. Med Sci Sport Exerc. 2013;45(4):737-46.
76. Beckwith J, Greenwald R, Chu J, et al. Timing of concussion diagnosis is related to head impact
exposure prior to injury. Med Sci Sport Exerc. 2013;45(4):747-54.
77. Broglio S, Martini D, Kasper L, et al. Estimation of head impact exposure in high school football:
Implications for regulating contact practices. Am J Sports Med. 2013;41(12):2877-84.
78. Daniel R, Rowson S, Duma S. Head impact exposure in youth football: Middle school ages 12-14 years.
J Biomech Eng. 2014;136(9):094501-6.
79. Broglio S, Schnebel B, Sosnoff J, et al. Biomechanical properties of concussions in high school football.
Med Sci Sports Exerc. 2010;42(11):2064-71.
80. Broglio S, Sosnoff J, Shin S, et al. Head impacts during high school football: A biomechanical
assessment. J Athl Train. 2009;44(4):342-9.
81. Broglio S, Eckner J, Surma T, et al. Post-concussion cognitive declines and symptomatology are not
related to concussion biomechanics in high school football players. J Neurotrauma. 2011;28(10):2061-8.
82. Eckner J, Sabin M, Kutcher J, et al. No evidence for a cumulative impact effect on concussion injury
threshold. J Neurotrauma. 2011;28(10):2079-90.
83. Martini D, Eckner J, Kutcher J, et al. Sub-concussive head impact biomechanics: comparing differing
offensive schemes. Med Sci Sport Exerc. 2013;45(4):755-61.
84. Wilcox B, Machan J, Beckwith J, et al. Head-impact mechanisms in men's and women's collegiate ice
hockey. J Ath Train. 2014;49(4):514-20.
85. Wong R, Wong A, Bailes J. Frequency, magnitude, and distribution of head impacts in Pop Warner
football: The cumulative burden. Clin Neurol Neurosur. 2014;118:1-4.
86. McCaffrey M, Mihalik J, Crowell D, et al. Measurement of head impacts in collegiate football players:
clinical measures of concussion after high- and low-magnitude impacts. Neurosurgery.
2007;61(6):1236-43.
87. McIntosh A, Patton D, Fréchède B, et al. The biomechanics of concussion in unhelmeted football
players in Australia: A case–control study. BMJ Open. 2014;4(5):e005078.
88. Breedlove E, Robinson M, Talavage T, et al. Biomechanical correlates of symptomatic and
asymptomatic neurophysiological impairment in high school football. J Biomech. 2012;45(7):1265-72.
89. Duhaime A-C, Beckwith J, Maerlender A, et al. Spectrum of acute clinical characteristics of diagnosed
concussions in college athletes wearing instrumented helmets. J Neurosurg. 2012;117(6):1092-9.

23
90. Greenwald R, Gwin J, Chu J, et al. Head impact severity measures for evaluating mild traumatic brain
injury risk exposure. Neurosurgery. 2008;62(4):789-98.
91. Guskiewicz K, Mihalik J, Shankar V, et al. Measurement of head impacts in collegiate football players:
relationship between head impact biomechanics and acute clinical outcome after concussion.
Neurosurgery. 2007;61(6):1244-53.
92. Wilcox B, Beckwith J, Greenwald R, et al. Biomechanics of head impacts associated with diagnosed
concussion in female collegiate ice hockey players. J Biomech. 2015;48(10):2201-4.
93. Gadd C. Use of a weighted impulse criterion for establishing injury hazard. Proceedings of the 10th
STAPP Car rash conference, Society of Automotive Engineers; 1966; New York; 1966. p. 164-74.
94. Versace J. A review of the severity index. 15th Stapp Car Crash Conference, Society of Automotive
Engineers. 1971:771–96.
95. Bartsch A, Benzel E, Miele V, et al. Impact test comparisons of 20th and 21st century American football
helmets. J Neurosurg. 2012;116(1):222-33.
96. Lewis E. Head injury and protection. In: Rainford D, Gradwell D, editors. Ernsting's aviation medicine.
Boca Ratoa, FL: CRC Press, Taylor & Francis Groupo; 2006. p. 179-88.
97. McLean A, Anderson W. Biomechanics of closed head injury. In: Reilly P, Bullock R, editors. Head
injury. London: Chapman & Hall; 1997. p. 25-37.
98. Kleinberger M, Sun E, Eppinger R, et al. Development of improved injury criteria for the assessment of
advanced automotive restraint systems: NHTSA; 1998.
99. King A, Yang K, Zhang L, et al. Is head injury caused by linear or angular acceleration? IRCOBI
Conference. Lisbon, Portugal 2003. p. 1-12.
100. Newman J. A generalized acceleration model for brain injury threshold (GAMBIT). International IRCOBI
Conference on the Biomechanics of Impacts 1986. Zurich (Switzerland); 1986. p. 121-31.
101. Newman J, Shewchenko N, Welbourne E. A proposed new biomechanical head injury assessment
function – The maximum power index. Stapp Car Crash J. 2000;44:215-47.
102. Denny-Brown D, Russell W. Experimental cerebral concussion. Brain. 1940;64(2-3):93-164.
103. Broglio S, Eckner J, Paulson H, et al. Cognitive decline and aging: the role of concussive and
subconcussive impacts. Exerc Sport Sci Rev. 2012;40(3):138-44.
104. Miller J, Adamson G, Pink M, et al. Comparison of preseason, midseason, and postseason
neurocognitive scores in uninjured collegiate football players. Am J Sports Med. 2007 August 1, 2007;
35(8):1284-8.
105. Erlanger D. Exposure to sub-concussive head injury in boxing and other sports. Brain Inj.
2015;29(2):171-4.
106. Packard R. Chronic post-traumatic headache: Associations with mild traumatic brain injury, concussion,
and post-concussive disorder. Curr Pain and Headache Rep. 2008;12(1):67-73.
107. Stern R, Daneshvar D, Baugh C, et al. Clinical presentation of chronic traumatic encephalopathy.
Neurology. 2013;81(13):1122-9.
24
108. McKee A, Stein T, Nowinski C, et al. The spectrum of disease in chronic traumatic encephalopathy.
Brain. 2012;136(1):43-64.
109. Mihalik J, Blackburn J, Greenwald B, et al. Collision type and player anticipation affect head impact
severity among youth ice hockey players. Pediatrics. 2010;125(6):e1394-e401.
110. Ommaya A. Biomechanics of head injuries: Experiemental aspects. In: Nuham A, Melvin J, editors.
Biomechanics of trauma. Norwalk, CT: Appleton-Century-Crofts; 1985. p. 245-69.
111. Kleiven S. Why most traumatic brain injuries are not caused by linear acceleration but skull fractures
are. Front Bioeng Biotechnol. 2013;1:15.
112. Kleiven S. Evaluation of head injury criteria using a finite element model validated against experiments
on localized brain motion, intracerebral acceleration, and intracranial pressure. Int J Crashworthines.
2006;11(1):65-79.
113. Shreiber D, Bain A, Meaney D. In vivo thresholds for mechanical injury to the blood-brain barrier.
Procedings of the 41st Stapp Car Crash Conference. Lake Buena Vista, Florida (USA); 1997. p. 227-91.
114. Cantu R. Head injuries in sport. Br J Sports Med. 1996;30(4):289-96.
115. Unterharnscheidt F. Translational versus rotational acceleration: Animal experiments with measured
inputs. Scand J Rehabil Med. 1972;4(1):24-6.
116. King A, Yang K, Zhang L, et al. Is Rotational Acceleration More Injurious to the Brain Than Linear
Acceleration? In: Hwang NC, Woo S-Y, editors. Frontiers in Biomedical Engineering: Springer US; 2004.
p. 135-47.
117. Kleiven S. Influence of impact duration on the human head in prediction of subdural hemotoma. J
Neurotrauma. 2003; 20(4):365-79.
118. Kleiven S. Predictors for traumatic brain injuries evaluated through accident reconstructions. Stapp Car
Crash J. 2007;51:81-117.
119. Mecham M, Greenwald R, Macintyre J, et al. Incidence and severity of head impact during freestyle
aerial ski jumping. J App Biomechan. 1999;15(1):27-35.
120. Lockett F. Biomechanics justification for emperical head impact tolerance criteria. J Biomech.
1985;18(3):217-24.
121. Fenner H, Thomas D, Gennarelli T, et al. Final report of workshop on criterion for head injury in helmet
standards. Milwaukee Wisconsin: Medical College of Wisconsin / Snell Memorial Foundation; 2005.
122. World Health Organisation. Review of physical activity surveillance data sources in European Union
Member States. Report No. 6. Copenhagen, Denmark: WHO Regional Office for Europe; 2010.
123. Colley R, Garriguet D, Janssen I, et al. Physical activity of Canadian adults: accelerometer results from
the 2007 to 2009 Canadian Health Measures Survey. Health Rep. 2011;22(1):7-14.
124. Paul D, Kramer M, Moshfegh A, et al. Comparison of two different physical activity monitors. BMC Med
Res Methodol. 2007;7:26.

25
125. Cain K, Conway T, Adams M, et al. Comparison of older and newer generations of ActiGraph
accelerometers with the normal filter and the low frequency extension. Int J Behav Nutr Phys Act.
2013;10:51.
126. John D, Sasaki J, Hickey A, et al. ActiGraph™ activity monitors: “The firmware effect”. Med Sci Sport
Exerc. 2014;46(4):834-9.
127. Yngve A, Nilsson A, Sjöström M, et al. Effect of monitor placement and of activity setting on the MTI
accelerometer output. Med Sci Sport Exerc. 2003;35(2):320-6.
128. Edwardson C, Gorely T. Epoch length and its effect on physical activity intensity. Med Sci Sport Exerc.
2010;42(5):928-34.
129. Ojiambo R, Cuthill R, Budd H, et al. Impact of methodological decisions on accelerometer outcome
variables in young children. Int J Obes. 2011;35(S1):S98-S103.
130. Lee P. Data imputation for accelerometer-measured physical activity: the combined approach. Am J Clin
Nutr. 2013;97(5):965-71.
131. Evenson K, Terry J. Assessment of differing definitions of accelerometer nonwear time. Res Q Exerc
Sport. 2012;80(2):355-62.
132. Kim Y, Beets M, Pate R, et al. The effect of reintegrating Actigraph accelerometer counts in preschool
children: Comparison using different epoch lengths. J Sci Med Sport. 2013;16(2):129-34.
133. Camarillo D, Shull P, Mattson J, et al. An instrumented mouthguard for measuring linear and angular
head impact kinematics in American football. Ann Biomed Eng. 2013;41(9):1939-49.
134. Mattson J, Schultz R, Goodman J, et al. Validation of a novel mouth guard for measurement of linear
and rotational accelerations during head impacts. Clin J Sport Med. 2012;22(3):294.
135. Beckwith J, Greenwald R, Chu J. Measuring head kinematics in football: Correlation between the head
impact telemetry system and hybrid III headform. Ann Biomed Eng. 2012; 40(1):237-48.
136. Broglio S, Eckner J, Kutcher J. Field-based measures of head impacts in high school athletes. Curr
Opin Pediatr. 2012;24(6):702-8.

26
TABLES
Table 1: MOOSE scores, data acquisition impact thresholds, study groups, sporting codes and duration,
instrumented equipment, participant numbers, impacts recorded for total and per player, and metrics
for reporting data.
Table 2: Differences in the resultant linear (PLA(g)) and rotational (PRA(rad/s2)) accelerations, head impact
criterion (15ms) (HIC15) and Gadd severity index (GSI) at different impact thresholds by the mean and
standard deviation (±SD), median [25th to 75th percentile] and 95th percentile for senior amateur rugby
union players.
FIGURES:
Figure 1: Flow of identification, screening, eligibility and study inclusion of previously published studies.
Figure 2: Percentage of impacts removed when applying different data impact threshold limits compared with
original 10g threshold limit for the New Zealand data set of head impacts to senior amateur rugby
union players for one season.

27
Table 1: MOOSE scores, data acquisition impact thresholds, study groups, sporting codes and duration, instrumented equipment, participant numbers, impacts recorded for total and per player and metrics for reporting data
Study MOOSE[63]
Score
Data acquisition
Limit (g)
Study group
Sport, No. seasons
No Participants
Impacts total
Impacts per player
Raw data Derived variables Reporting statistics
PLA(g) PRA(rad/s2) HIC15 HIC36 GSI HITsp Mean (SD) Median IQR 95% Other
Hernandez et al.[64] 4/6 (67%) 7; 10 Coll; P Am F, MM, B 2 concussions; T: 513 Y Y Y Y
Brolinson et al.[65] 5/6 (83%) 10 Coll Am F, 2 52 11,604 T; 223a Y
Y
Bazarian et al.[66] 5/6 (83%) 10 Coll Am F, 1 10 9,769 T; 977a Y Y
Y
Crisco et al.[21] 5/6 (83%) 10 Coll Am F, 3 314 286,636 T: 420;b P: 250;b M: 128b Y Y
Y
Y
Y Y
Crisco et al.[67] 5/6 (83%) 10 Coll Am F, 2 254 184,358 T: 726a Y Y
Y
y
Daniel et al.[54] 5/6 (83%) 10 Youth Am F, 1 7 748 T: 107; P: 63; M: 44 Y Y
Y
Y Y
Duma et al.[49] 5/6 (83%) 10 Coll Am F, 1 38 3,312 T: 87a Y
Y
Y
Y
Funk et al.[68] 5/6 (83%) 10 Coll Am F, 4 98 37,128 T: 379a Y
Y
Hanlon et al.[26] 5/6 (83%) 10H Youth Soccer, P 24 47 H 20 NH N/S Y Y Y
Y
Harpham et al.[69] 5/6 (83%) 10 Coll Am F, 1 38 N/S N/S Y Y
Y Y
King et al.[27] 5/6 (83%) 10M Snr Amat RU, 1 38 20,687 T: 564; M: 77 Y Y
Y
Mihalik et al.[61] 5/6 (83%) 10 Coll Am F, 2 72 57,024 T: 9,504a Y
Y
Y
Mihalik et al.[70] 5/6 (83%) 10 Youth IH, 1 37 7,770 T: 1,945a Y Y
Y
Y
Mihalik et al.[71] 5/6 (83%) 10 Youth IH, 2 52 12,253 T: 223;b P: 83;b M: 24b Y Y
Y Y
Y Y
Mihalik et al. [72] 5/6 (83%) 10 Youth IH, 1 16 4,608 T: 288a Y Y
Y Y
Y
Munce et al.[73] 5/6 (83%) 10 Youth Am F, 1 22 6,183 T: 281a Y Y
Y Y Y
Y
Ocwieja et al.[74] 5/6 (83%) 10 Coll Am F, 1 46 7,992 T: 174a Y Y
Y Y
Y
Reed et al.[24] 5/6 (83%) 10 Youth IH, 1 13 1,821 T: 140; M: 5 Y Y Y Y
Y
Rowson et al.[22] 5/6 (83%) 10 Coll Am F, 1 10 1,712 T: 171a Y Y
Y
Y
Schnebel et al.[52] 5/6 (83%) 10 Coll Am F, 1 40 54,154 T: 1,354a Y
Y
10 HS Am F, 1 16 8,326 T: 520a Y
Y
Beckwith et al.[75, 76] 5/6 (83%) 14.4 Coll / HS Am F, 6 95 161,732 T: 1,702a Y Y Y Y
Y
Broglio et al.[77] 5/6 (83%) 14.4 HS Am F, 1 42 32,510 T: 744; P: 11;c M: 24 Y Y
Y
Cobb et al.[20] 5/6 (83%) 14.4 Youth Am F, 1 50 11,978 T: 240; P: 10; M: 11 Y Y
Y
Y Y
Crisco et al.[53] 5/6 (83%) 14.4 Coll Am F, 1 188 3,878 T: 21;a P: 6; M: 14
Y
Daniel et al.[78] 5/6 (83%) 14.4 Youth Am F, 1 17 4,678 T: 275;a P: 163; M: 112 Y Y
Y
Y Y
Rowson et al.[51] 5/6 (83%) 14.4 Coll Am F, 2 314 300,977 T: 959a
Y
Talavage et al.[42] 5/6 (83%) 14.4 HS Am F, 1 21 15,264 T: 727a
Urban et al.[58] 5/6 (83%) 14.4 HS Am F, 1 40 16,502 T: 413a Y Y
Y Y Y Y
Young et al.[23] 5/6 (83%) 14.4 Youth Am F, 1 19 3,059 T: 161; P: 95; M: 65 Y Y
Y Y
Y Y
Broglio et al.[79] 5/6 (83%) 15 HS Am F, 3 78 54,247 T: 695a Y Y
Y
Y
Broglio et al.[80] 5/6 (83%) 15 HS Am F, 1 35 19,224 T: 549;a P: 9; M: 25 Y Y
Y
Broglio et al.[37, 81] 5/6 (83%) 15 HS Am F, 4 95 101,994 T: 652 Y Y
Y Y
Y
Eckner et al.[82] 5/6 (83%) 15 HS Am F, 2 20 30,298 T: 1,515a Y Y
Y Y Y Y Y Y
Martini et al.[83] 5/6 (83%) 15 HS Am F, 2 83 35,620 T: 429a Y Y
Y Y
Wilcox et al.[25] 5/6 (83%) 20 Coll IH M/F,3 91 37,411 T: 19,980d / 17,531e Y Y Y Y Y Y Y
Wilcox et al.[84] 5/6 (83%) 20 Coll IH M/F,1/3 54 616 T: 270d / 242 Y Y Y Y
Wong et al.[85] 5/6 (83%) 30 Youth Am F, 1 22 480 T: 22;a P: 4; M: 2 Y
Y
Gysland et al.[32] 5/6 (83%) <60 >90 Coll Am F, 1 46 N/S T: 1,177; 12 >90g Y
Y
McCaffrey et al.[86] 5/6 (83%) <60 >90 Coll Am F, 1 43 N/S N/S Y
Y
Y
Fréchède et al.[10] A 4/6 (67%) Recon Prof AFL / RU, 3 - - N/S
Y Y
Y
Y
McIntosh et al.[87] A 4/6 (67%) Recon Prof AFL, 3 - - N/S Y Y
Y
Pellman et al.[16] A 4/6 (67%) Recon Prof Am F, 5 - - N/S Y Y Y
Y
Zhang et al.[12] A 4/6 (67%) Recon Lab - - - - Y Y Y
Y
Y
Breedlove et al.[88] A 4/6 (67%) N/S HS Am F, 2 24 N/S N/S Y Y
Y
Y
Duhaime et al.[89] A 4/6 (67%) N/S Coll Am F, IH, 4 450 486,594 T: 1,081a Y Y
Greenwald et al.[90] A 4/6 (67%) N/S Coll / HS Am F, 3 449
17 concussions only Y Y Y
Y
Y
Guskiewicz et al.[91] A 4/6 (67%) N/S Coll Am F, 2 88 104,714 T: 1,190a Y
Y
Rowson et al.[57] A 4/6 (67%) N/S Coll Am F N/S 63,011 Combined data Y Y
Y
Wilcox et al.[92] 4/6 (67%) N/S Coll IH F, 3 58 9 concussions Y Y Y Y
Mean study quality 4.8 ±0.4 (79.6% ±7.0) Percentage of studies 91.5 92.0 76.6 76.0 21.3 18.0 4.3 4.0 6.4 4.0
Instrumented equipment used is helmet unless the data acquisition limit is reconstructed = Recon, or superscript M = Mouthguard or H = Headband. Coll = Collegiate; HS = High School; Snr Amat = Senior Amateur; Prof = Professional; Am F = American Football; IH = Ice Hockey; RU = Rugby Union; AFL = Australian Football League; MM = Mixed martial Arts; B = Boxing; T = Total impacts; P = Practice Impacts; M = Match impacts; a = calculated number of impacts; b = Median results; c = contact practice; d = male; e = female; H = Header;

28
NH = non-header; N/S = Not Stated; PLA(g) = Peak Linear Acceleration; PRA(rad/s2) = Peak Rotational Accelerations in radians/second/second (rad/s2); HIC15 = Head Impact Criterion 15 milliseconds; HIC36 = Head Impact Criterion 36 milliseconds; GSI = Gadd Severity Index; HITsp = Head Impact Telemetry severity profile; SD = Standard Deviation; IQR = Inter-Quartile Range; 95% = 95th Percentile.

29
Table 2: Differences in the resultant linear (PLA(g)) and rotational (PRA(rad/s2)) accelerations, head impact criterion (15ms) (HIC15) and Gadd severity index (GSI) at different impact
threshold limits by the mean and standard deviation (±SD), median [25th to 75th percentile] and 95th percentile for the New Zealand senior amateur rugby union total player dataset.
Data acquisition
Resultant Linear Accelerations (PLA(g)) Resultant Rotational Accelerations (PRA(rad/s2)) Head Impact Criterion 15ms (HIC15) Gadd Severity Index (GSI)
impact threshold (g)
No of impacts
Mean ±SD Median [25th-75th] 95% Mean ±SD Median [25th-75th] 95% Mean ±SD Median [25th-75th] 95% Mean ±SD Median [25th-75th] 95%
10 20,687 22 ±16 16 [12-26] 53 3,903 ±3,949 2,625 [1,324-4,934] 12,204 32 ±99 9 [5-25] 128 48 ±118 15 [8-398] 192
11 17,747 24 ±17 18 [13-29] 56 4,255 ±4,096 2,898 [1,549-5,389] 12,945 37 ±106 11 [6-30] 145 55 ±126 19 [10-47] 218
12 15,454 26 ±17 20 [15-31] 59 4,603 ±4,214 3,181 [1,781-5,860] 13,581 42 ±112 14 [7-35] 160 62 ±134 23 [12-55] 241
13 13,825 28 ±17 22 [16-32] 62 4,858 ±4,293 3,423 [1,967-6,263] 13,948 46 ±118 17 [9-40] 176 69 ±140 27 [14-62] 262
14 12,531 29 ±18 24 [18-34] 64 5,079 ±4,368 3,589 [2,123-6,596] 14,325 51 ±123 19 [10-44] 188 75 ±146 31 [17-69] 278
15 11,459 31 ±18 25 [19-35] 65 5,286 ±4,438 3,774 [2,263-6,908] 14,647 55 ±128 22 [12-49] 205 80 ±151 34 [19-76] 297
16 10,570 32 ±18 26 [20-36] 67 5,478 ±4,510 3,936 [2,400-7,180] 14,994 59 ±133 24 [14-53] 215 86 ±156 38 [21-82] 318
17 9,784 33 ±18 27 [21-38] 68 5,655 ±4,565 4,082 [2,538-7,394] 15,235 63 ±137 27 [15-57] 228 92 ±161 41 [24-88] 331
18 9,095 34 ±18 28 [22-39] 70 5,799 ±4,610 4,173 [2,644-7,567] 15,486 67 ±141 29 [17-62] 241 97 ±165 45 [27-95] 348
19 8,500 35 ±19 29 [23-40] 71 5,939 ±4,662 4,265 [2,731-7,744] 15,823 70 ±145 32 [18-66] 253 103 ±169 49 [29-102] 364
20 7,934 36 ±19 30 [24-41] 74 6,072 ±4,716 4,357 [2,810-7,931] 16,256 74 ±150 34 [20-70] 263 109 ±174 53 [31-109] 374
21 7,430 37 ±19 31 [25-42] 76 6,206 ±4,757 4,483 [2,896-8,158] 16,470 79 ±154 37 [22-75] 275 115 ±178 57 [34-114] 391
22 6,938 39 ±19 32 [26-44] 77 6,363 ±4,801 4,595 [2,992-8,426] 16,806 83 ±158 40 [24-80] 291 121 ±183 62 [37-121] 415
23 6,463 40 ±19 33 [27-45] 80 6,519 ±4,859 4,722 [3,096-8,628] 17,073 88 ±163 43 [26-85] 302 127 ±188 67 [40-129] 444
24 6,060 41 ±19 34 [28-46] 82 6,656 ±4,906 4,835 [3,201-8,798] 17,282 92 ±167 46 [28-90] 318 134±192 71 [43-135] 466
25 5,666 42 ±20 35 [29-47] 83 6,819 ±4,952 4,965 [3,305-9,012] 17,435 97 ±172 49 [31-95] 337 141 ±197 76 [47-144] 485
26 5,275 43 ±20 36 [30-48] 84 6,977 ±4,986 5,101 [3,428-9,297] 17,622 102 ±177 53 [33-101] 357 148 ±202 81 [50-152] 512
27 4,955 44 ±20 37 [31-49] 87 7,107 ±5,036 5,210 [3,495-9,459] 17,844 107 ±181 57 [35-107] 389 155 ±206 86 [54-162] 536
28 4,642 45 ±20 39 [32-51] 88 7,261 ±5,079 5,339 [3,607-9,704] 18,131 113 ±186 60 [38-114] 396 163 ±211 93 [58-173] 557
29 4,305 47 ±20 40 [33-52] 91 7,448 ±5,130 5,492 [3,778-9,917] 18,221 119 ±192 65 [41-123] 407 172 ±217 99 [64-186] 583
30 4,024 48 ±20 41 [34-54] 92 7,597 ±5,187 5,624 [3,875-10,129] 18,436 125 ±197 69 [44-131] 420 180±221 106 [68-196] 606
PLA (g) = peak linear acceleration; PRA (rad/s2) = peak rotational acceleration in radians/second/second (rad/s2); Significant difference (p<0.05) than: (a) = 10g.
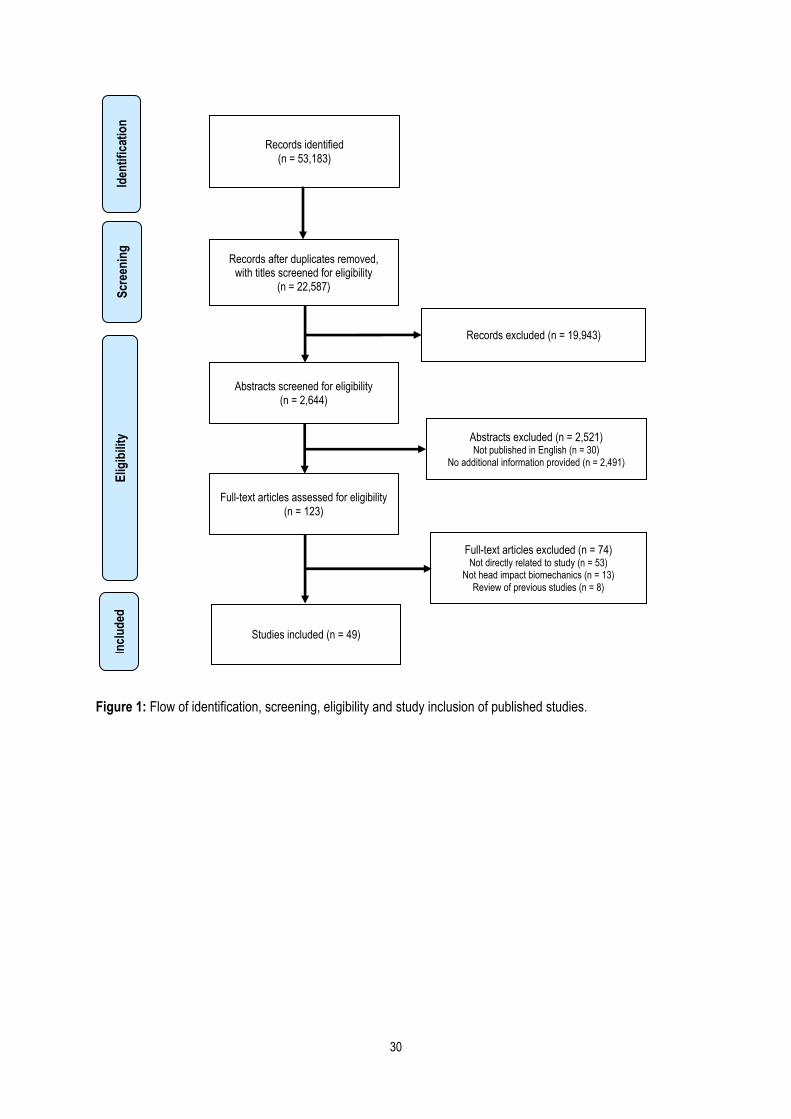
30
Figure 1: Flow of identification, screening, eligibility and study inclusion of published studies.
Records identified
(n = 53,183)
Scr
een
ing
In
clu
ded
E
ligib
ility
Id
enti
fica
tio
n
Records after duplicates removed, with titles screened for eligibility
(n = 22,587)
Records excluded (n = 19,943)
Abstracts screened for eligibility (n = 2,644)
Abstracts excluded (n = 2,521) Not published in English (n = 30)
No additional information provided (n = 2,491)
Studies included (n = 49)
Full-text articles assessed for eligibility
(n = 123)
Full-text articles excluded (n = 74) Not directly related to study (n = 53)
Not head impact biomechanics (n = 13)
Review of previous studies (n = 8)
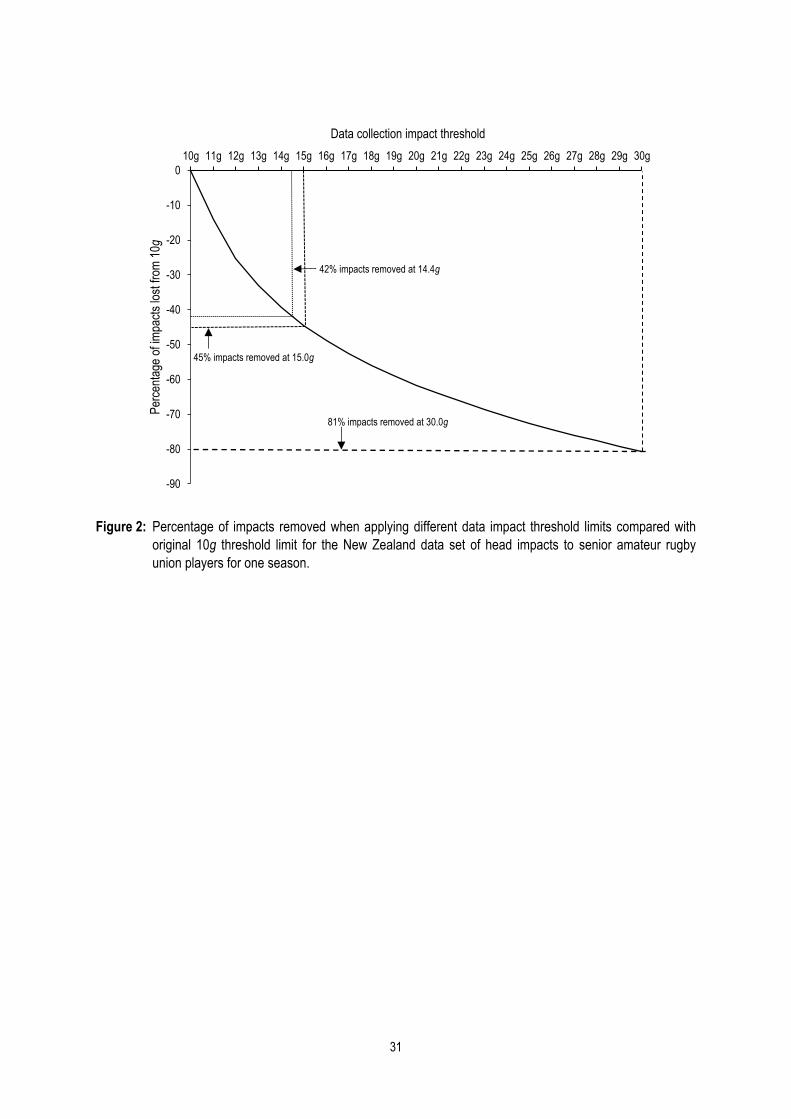
31
Figure 2: Percentage of impacts removed when applying different data impact threshold limits compared with
original 10g threshold limit for the New Zealand data set of head impacts to senior amateur rugby
union players for one season.
-90
-80
-70
-60
-50
-40
-30
-20
-10
0
10g 11g 12g 13g 14g 15g 16g 17g 18g 19g 20g 21g 22g 23g 24g 25g 26g 27g 28g 29g 30gP
erce
ntag
e of
impa
cts
lost
from
10g
Data collection impact threshold
45% impacts removed at 15.0g
42% impacts removed at 14.4g
81% impacts removed at 30.0g