title page report title: downhole power generation … library/research/oil-gas/natural gas...this...
TRANSCRIPT
1
Title Page
Report Title: Downhole Power Generation and Wireless Communications
for Intelligent Completions Applications
Type of Report: Final Report
Project Report Period: Start Date – October 01, 2002
End Date- August 31, 2005
Principal Author: Paul Tubel
Date Report was issued: September 12, 2005
DoE Cooperative Agreement No. DE-FC26-02NT41601
Submitting Organization: Tubel Technologies, Inc.
4800 Research Forest
The Woodlands, TX 77381

2
Disclaimer
This report was prepared as an account of work sponsored by an agency of the
United States Government. Neither the United States Government nor any
agency thereof, nor any of their employees, makes any warranty, express or
implied, or assumes any legal liability or responsibility for the accuracy,
completeness, or usefulness of any information, apparatus, product, or process
disclosed, or represents that its use would not infringe privately owned rights.
Reference herein to any specific commercial product, process, or service by
trade name, trademark, manufacturer, or otherwise does not necessarily
constitute or imply its endorsement, recommendation, or favoring by the United
States Government or any agency thereof. The views and opinions of authors
expressed herein do not necessarily state or reflect those of the United States
Government or any agency thereof.
3
Abstract
This paper describes a new real time downhole wireless pressure and temperature gauge for the optimization of natural gas production that was developed under a grant from the Department of Energy. The high temperature, high pressure system can be deployed anywhere in the wellbore for permanent deep gas production monitoring applications. Monitoring and control of the processes required to produce hydrocarbons constitutes an on going concern in the industry. This concern is due in part to the enormous expenses and risks associated with the execution of those processes, as well as environmental and safety factors. The ability to provide wireless monitoring of wellbore parameters has also increased completion reliability and decreased completion costs. The new gauge utilizes acoustic waves for communications and low power electronics and sensors to acquire and process in real time data related to production and geological formation parameters. The system utilizes the production tubing as the medium for the transmission of the information from downhole to the surface. The system also uses the vibration and flow generated downhole to create electricity to charge batteries downhole to operate the system. The project was completed successfully and multiple applications have already been identified for permanent and service applications of the technology.

4
Table of Content
Title Page .............................................................................................................1 Disclaimer............................................................................................................2 Abstract ...............................................................................................................3 Table of Content..................................................................................................4 List of Graphical Materials .................................................................................5 Introduction .........................................................................................................6 Executive Summary............................................................................................9 Experimental .....................................................................................................11 Bibliography ......................................................................................................25 List of Acronyms and Abbreviations...............................................................27 Appendices........................................................................................................27
5
List of Graphical Materials
Fig. 1 – Downhole Intelligent Well Completion configuration with Wireless System
Figure 2 – Acoustic surface to downhole transmitter attached to the production tubing in the well (white module). Figure 3 - Surface Pressure Request Followed By Downhole Tool Response at 112’ Figure 4 – Downhole Wireless gauge with power generator – view from the top of tool Figure 5 – Downhole Wireless gauge with power generator – view from the bottom of tool where the power generator is located Figure 6 – Wireless gauge surface system with solar panel and batteries mounted for permanent deployment. A black test box is also shown on the picture Figure 7 - Surface Pressure Request Followed By Downhole Tool Response at 953’ Figure 8 - Downhole Tool Response at 967’ With Maximum Flow Figure 9 - Half-duplex Wireless Gauge Schematic Fig. 10 – Acoustic to electrical converter at the surface
Figure 11 – Power harvesting module
Figure 12 - shows the downhole power generator (dark module) in line with flow pipe
6
Introduction
The complexity and cost of exploring for oil and gas has increased significantly in the past few years due to Intelligent Wells, Multilaterals and Deep Gas field developments. New challenges for drilling, completing, producing, intervening in a well, environmental regulations, and wide swings in the price of oil have changed the role of technology in the oil fields. The industry is relying on technology to affect the costs of exploring for hydrocarbons in the following ways:
• Reduce operating expenses (OPEX) by automating the processes used to explore and produce hydrocarbons, reducing the frequency of unplanned intervention, and improving information and knowledge management to decrease operating inefficiencies.
• Increase net present value (NPV) by providing systems that enhance the recovery of hydrocarbons from reservoirs. The new technologies improve production techniques to delay and/or reduce the production of water from downhole.
• Reduce capital expenditures (CAPEX) by creating processes that will decrease the number of wells drilled and that will reduce the number of surface facilities required. The surface equipment requirements to handle increasingly larger quantities of hydrocarbons at these facilities should also decrease with the implementation of new technologies.
New processes for drilling, completion, production, artificial lift, and reservoir management have been created by advancements in technology in fields such as high temperature sensory, downhole navigation systems, composite materials, computer processing speed and power, software management, knowledge gathering and processing, communications and power management. Horizontal drilling and new fracture techniques have allowed operators to produce hydrocarbons profitably from areas that were uneconomical just a few years ago.
Sensor technology in conjunction with data communications techniques provide on-demand access to the information necessary to optimize hydrocarbon production levels and achieve costs goals. Surface and downhole sensors are changing the way hydrocarbons are produced by optimizing production from downhole, supporting and extending the life of artificial lift systems and providing information used to update reservoir and production models.
A new technology that combines sensors with wireless telemetry provide the operators with new versatility and capability to place sensors in areas of the wellbore that were prohibitive due to technical difficulties and/or economic justification. The ability to communicate in and out of the wellbore using wireless

7
systems can increase the reliability of the production system and decrease the amount of time required for the installation of the completion hardware in the wellbore. The elimination of cables, clamps, external pressure and temperature sensors, as well as splices on the cable that can fail inside the wellbore provides a significant advantage over existing gauge technologies.
The wireless wellbore digital data communications and sensing system provides the capability to communicate through the production tubing using stress waves to transmit and receive digital data and commands inside the wellbore. The system provides information from inside the wellbore that is transmitted at intervals determined by the customer and programmed before the tool is inserted in the well. The downhole system is composed of the wireless transmission hardware, microprocessor system for data acquisition and power management, pressure and temperature gauges and a power generation unit. The surface system is composed of a detection and transmission module and a surface SCADA box for data acquisition and processing.
The ability to generate electricity to extend the life of batteries and tools inside wellbores has been a major goal in the upstream industry. This project developed successfully a downhole power generator which provides energy to charge batteries and super capacitors based on vibration and flow of water and hydrocarbon in the wellbore.
The system can be used in Intelligent Well applications to optimize the production of hydrocarbons from wellbores.
PresentationPresentation
liner hanger
Inflow Valve
Autolok (for tubing movement)
Packer
Downhole Wireless Gauge
Side Pocket Gauge Mandrel w/ Electric Gas Lift valve & pressure and temperature sensor
9-5/8” production casing
Applications - Intelligent System with Dual Zone Hydraulic Flow Control

8
Fig. 1 – Downhole Intelligent Well Completion configuration with Wireless System
9
Executive Summary
Sensor technology in conjunction with data communications techniques provide on-demand access to the information necessary to optimize hydrocarbon production levels and achieve costs goals. Surface and downhole sensors are changing the way hydrocarbons are produced by optimizing production from downhole, supporting and extending the life of artificial lift systems and providing information used to update reservoir and production models.
A new technology that combines sensors with wireless telemetry provide the operators with new versatility and capability to place sensors in areas of the wellbore that were prohibitive due to technical difficulties and/or economic justification. The ability to communicate in and out of the wellbore using wireless systems can increase the reliability of the production system and decrease the amount of time required for the installation of the completion hardware in the wellbore. The elimination of cables, clamps, external pressure and temperature sensors, as well as splices on the cable that can fail inside the wellbore provides a significant advantage over existing gauge technologies.
The wireless wellbore digital data communications and sensing system provides the capability to communicate through the production tubing using stress waves to transmit and receive digital data and commands inside the wellbore. The system provides information from inside the wellbore that is transmitted at intervals determined by the customer and programmed before the tool is inserted in the well. The downhole system is composed of the wireless transmission hardware, microprocessor system for data acquisition and power management, pressure and temperature gauges and a power generation unit. The surface system is composed of a detection and transmission module and a surface SCADA box for data acquisition and processing.
The wireless gauge hardware creates the acoustic signals from electrical pulses generated by the electronics system after the sensor information is digitized. The acoustic waves are coupled to the production pipe minimizing the amount of energy losses having a very tight fit between the acoustic generator and the production pipe. The waves travel up the pipe to the surface in a compression mode minimizing losses related to fluid coupling and tubing threads.
The electronics system provides the process control, data acquisition, data processing data encoding, command decoding and operator interface. The system provides a power saver mode while in the wellbore to maximize the downhole power efficiency. The electronics samples and digitizes the information from the gauges at specific time intervals programmed before the tool is deployed inside the wellbore. The data is processed and encoded for transmission to the surface to minimize the number of bits of data required to be sent to the surface. The microprocessor then generates the electrical pulses used to drive the acoustic generator to produce the information related to the

10
pressure and temperature data obtained inside the wellbore. Upon completion of the transmission of the information to the surface the processor places the tool in a power saver mode until it is waken to perform the data acquisition tasks again. The system can also receive commands from the surface and an acoustic detector awakes the processor for the data acquisition and process.
The sensors are composed of silicon on sapphire pressure gauges and thermocouples for sensing temperature. The sapphire gauges provide high resolution pressure measurements on the annulus and tubing while the thermocouples located inside the pressure assembly measure temperature for pressure compensation and for well monitoring. This new sapphire technology eliminates the well fluid coupling requirements to maintain the sensor assembly free of well contamination. The sapphire is in constant contact with the wellbore fluids to provide a more accurate measurement of the pressure. Higher stability is also a major advantage of the sapphire gauges over strain gauges. The gauges are also built into the tool eliminating any outside connections.
The surface system provides data acquisition, processing, storage and display capabilities for the data received from inside the wellbore. The surface system is composed of 3 modules. They are described below: 1. Surface Data Detection Transmission on Tubing – A surface module attached
to the wellhead or just below the surface is used to detect the transmitted downhole signal. It converts the signal from an acoustic wave into digital electrical pulses that are transferred via surface cable to the data processing module. It also converts electrical pulses into acoustic commands.
2. Surface Processing Module – It provides the data acquisition, processing,
display and interfaces to a pump controller or a computer. The data received from the acquisition module is conditioned and pre-processed to eliminate noise. The data is next processed in the time domain to obtain the actual parameter values obtained by the sensors inside the wellbore. The information is converted into 4-20 milliamps analog signals to be transmitted to a pump controller or recorder, and it is also converted into Modbus protocol data stream to be transferred to other computer systems.
3. A Personal Computer interfaces with the surface processing module to obtain
the downhole information. A software package for the PC processes the data for viewing the information in a graphical mode or in a tabulated format
11
Experimental
On April 26, 2004, the prototype gauge and surface system was tested at the North Test Well at the Carrollton facility of Halliburton. The wireless gauge was deployed in the test well using 3 ½ inch tubing above the gauge. The system was deployed at 200 ft in the well and the transmitter from surface to downhole was attached to the top of the tubing string at the surface slips. The surface to downhole transmitter module was connected to the processing panel and the Personal Computer. A command was initiated from the computer to request data from the tool. The information was transferred into the wellbore by the transmitter using acoustic waves. The downhole tool received the acoustic information, processed it properly and responded to the request for data providing annulus pressure readings.
The downhole module was lowered to 500 ft in the wellbore. The surface module was re-attached to the top of the tubing string and a command was transmitted in the wellbore. The downhole acoustic receiver was not capable of detecting the downhole information due to a high software threshold level implemented in the tool. A software modification was performed to lower the threshold to allow the downhole tool to receive smaller signals consequently being able to go deeper in wellbores. On August 24 and 25, 2005, the prototype gauge and surface system was retested at the Rocky Mountain Oilfield Testing Center. The system had undergone two modifications. The first modification was in the surface system where the signal requesting a downhole pressure reading was simplified. The second modification was changes in the detection algorithm for the surface pressure request. The downhole module was lowered to 112’ and the signal strength required to wake the downhole tool was measured. The voltage used to produce the signal was lowered to 8.0 V out of a possible 24.0 V, which is the minimum voltage that can be applied. Out of 27 pressure requests, 25 where correctly received, and two were missed. The well where the test was performed and the acoustic transmitter are shown on the picture below.

12
Figure 2 – Acoustic surface to downhole transmitter attached to the production tubing in the well (white module).

13
Figure 3 - Surface Pressure Request Followed By Downhole Tool Response at 112’ Since the signal received from the downhole gauge was extremely strong, and the system had reliable communications in both directions, it was decided to skip intermediate depth testing and begin testing at the maximum depth. The downhole gauge was therefore lowered to 953’. A tally was kept of received requests for pressure versus missed requests. The downhole gauge responded correctly to 14 pressure requests, and missed two requests.
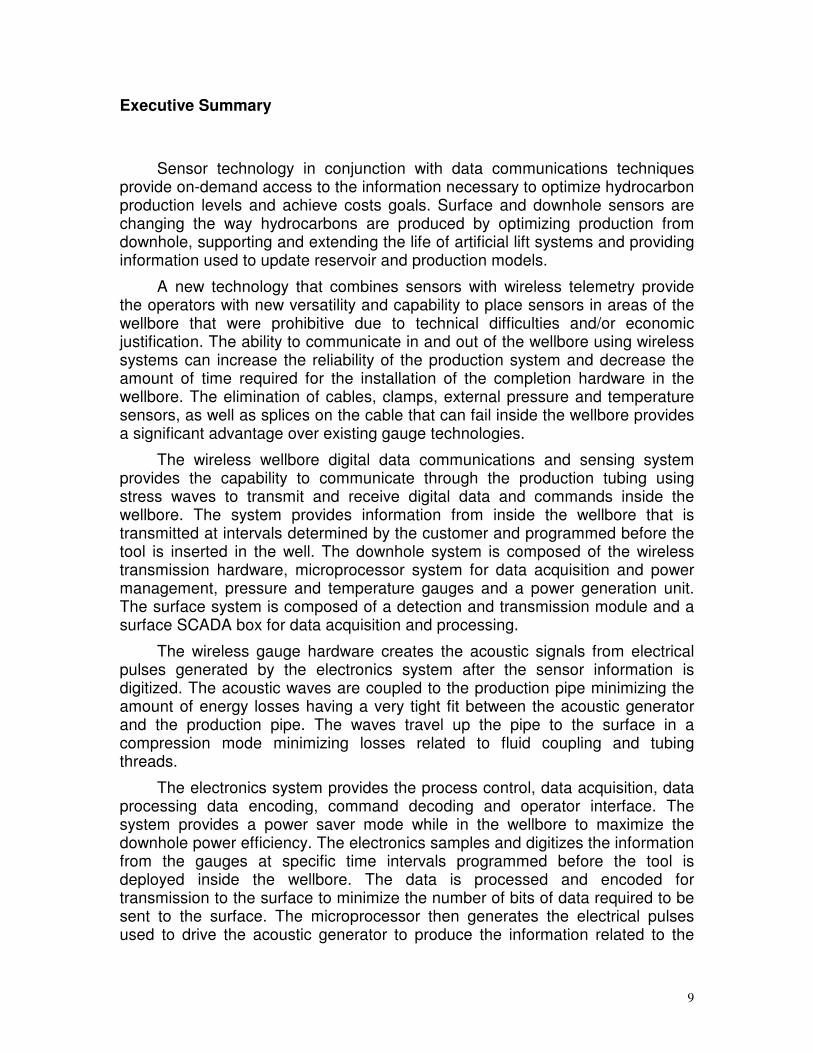
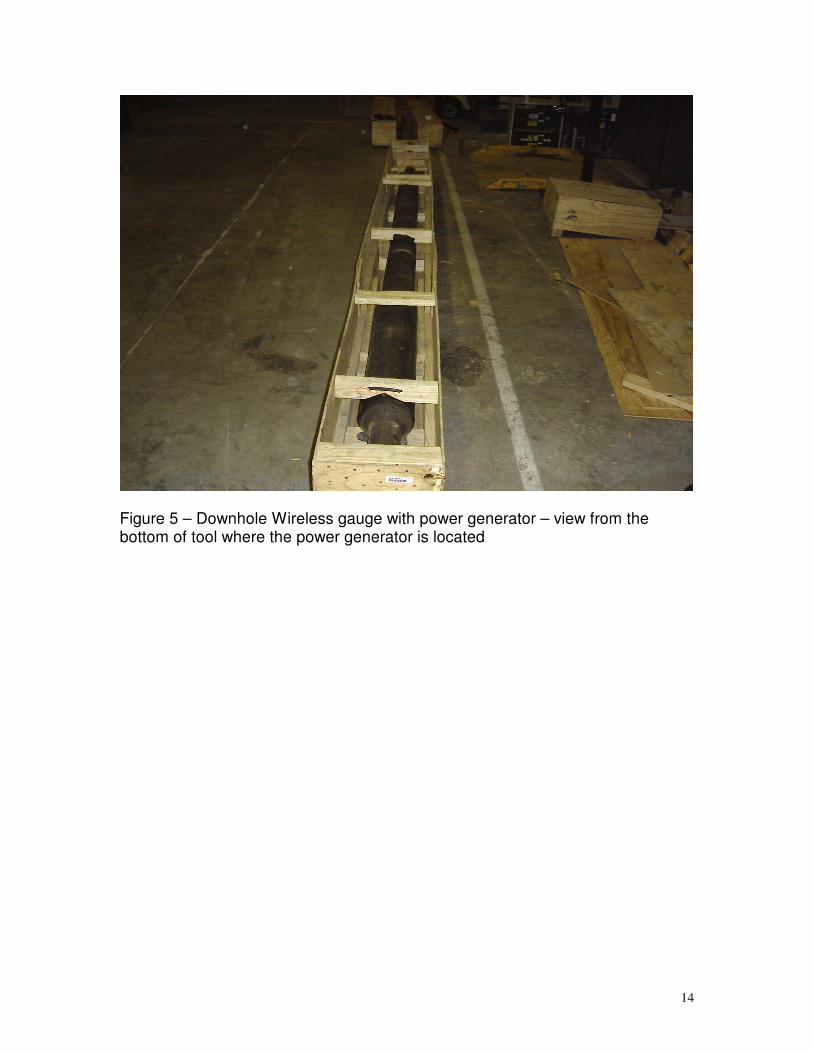
Figure 4 – Downhole Wireless gauge with power generator – view from the top of tool
14
Figure 5 – Downhole Wireless gauge with power generator – view from the bottom of tool where the power generator is located
15
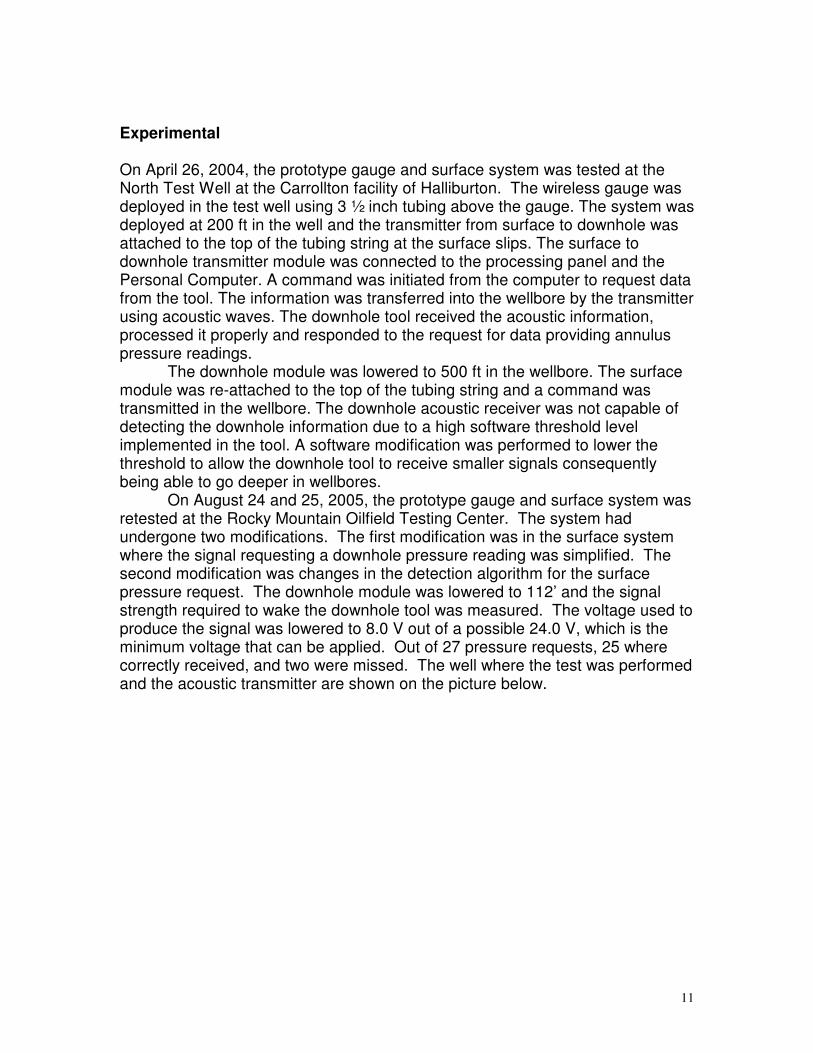
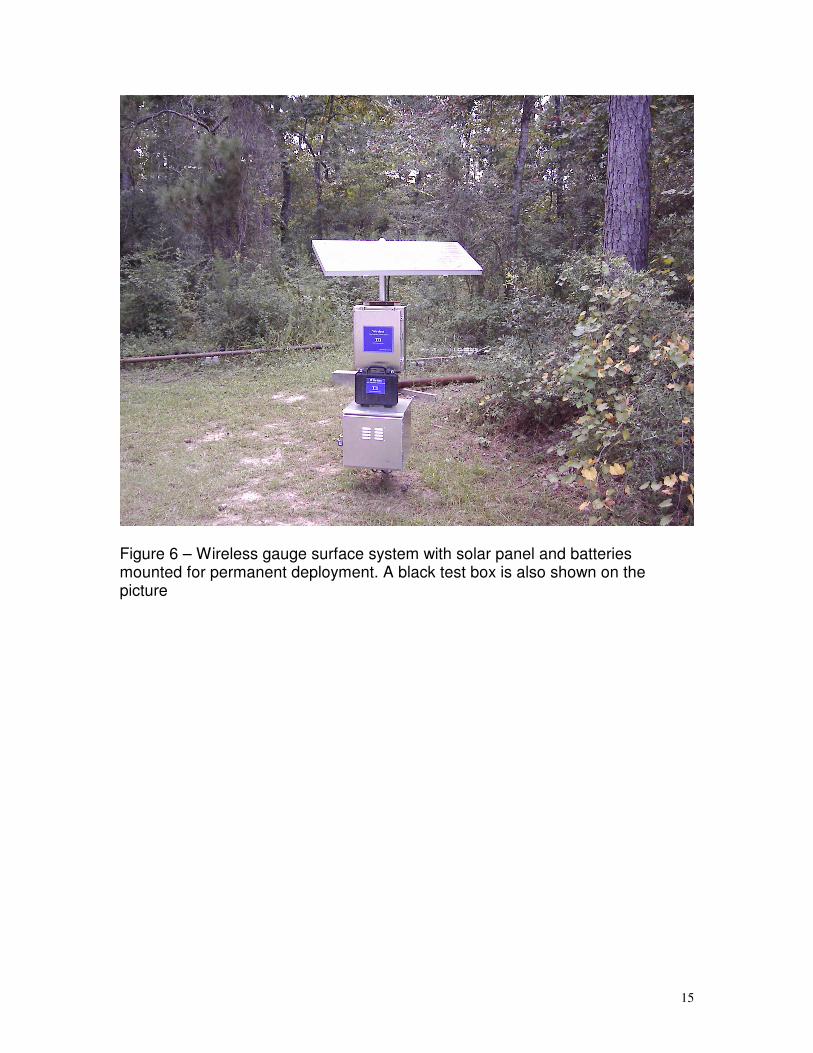
Figure 6 – Wireless gauge surface system with solar panel and batteries mounted for permanent deployment. A black test box is also shown on the picture

16
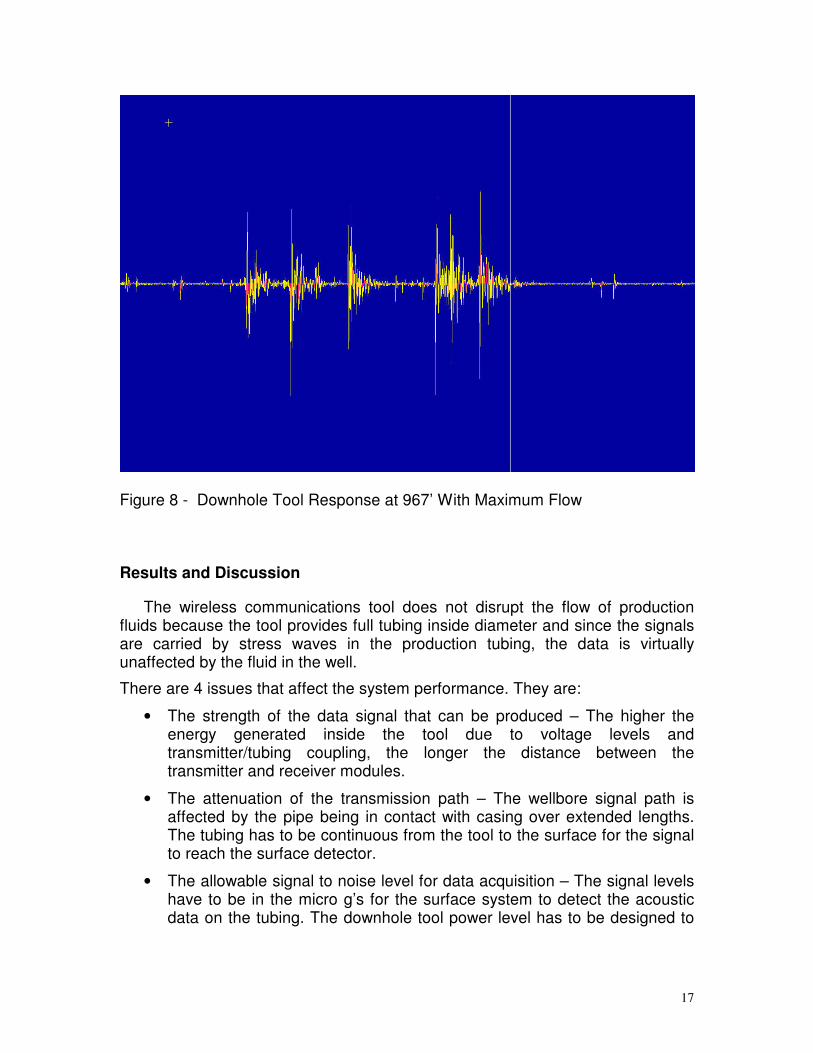
Figure 7 - Surface Pressure Request Followed By Downhole Tool Response at 953’ The following day the tests were repeated with simulated flow and a tool depth of 967’. The source of the simulated flow was water provided from a water-carrying truck. At approximately 20% of the maximum flow rate, 12 pressure requests were successfully decoded, and three were missed. The pressure measure by the gauge was 477 PSI, while the calculated pressure based on a 967’ column of water was 434 PSI. The final test performed was a test at the maximum flow rate. Aside from flow rate, no other test parameter was changed. Out of 23 pressure requests, 18 were successfully received, and five were missed. The pressure reported by the tool was again 477 PSI. Figure 8 shows the downhole tool’s response at 967’ under conditions of maximum flow.
17
Figure 8 - Downhole Tool Response at 967’ With Maximum Flow
Results and Discussion
The wireless communications tool does not disrupt the flow of production fluids because the tool provides full tubing inside diameter and since the signals are carried by stress waves in the production tubing, the data is virtually unaffected by the fluid in the well.
There are 4 issues that affect the system performance. They are:
• The strength of the data signal that can be produced – The higher the energy generated inside the tool due to voltage levels and transmitter/tubing coupling, the longer the distance between the transmitter and receiver modules.
• The attenuation of the transmission path – The wellbore signal path is affected by the pipe being in contact with casing over extended lengths. The tubing has to be continuous from the tool to the surface for the signal to reach the surface detector.
• The allowable signal to noise level for data acquisition – The signal levels have to be in the micro g’s for the surface system to detect the acoustic data on the tubing. The downhole tool power level has to be designed to
18
assure that the acoustic signal will have a level that is high enough to be detected by the surface hardware.
• Another factor determining the transmission length is the noise environment of the well. The signal to noise ratio in the passband of the surface system’s filters is critical for communication. The SNR must be maintained above a certain level for the packets to be correctly decoded by the surface system.
The advantages of an acoustic wireless gauge can be compounded if the
capability for two way communications is added. Currently, communication parameters such as data refresh rates and sensor selection must be set at the surface before deployment, and cannot be modified until the gauge is recovered. The ability for a gauge to receive surface communication removes this limitation since a command set allowing communication parameter modification can be implemented. The first command to have been implemented was an asynchronous request for a sensor reading. This drastically reduces power consumption, since sensor readings are taken only when required. Other potential commands include changing communication parameters such as transmission frequency. This is useful because each well has a unique acoustic profile and ambient noise environment. Modifying the transmission frequency in use allows communication even in a dynamic noise environment. Selecting a transmission frequency also allows multiple gauges to be deployed in a well with a single surface transceiver for the entire gauge set. Half-duplex Surface System
The major subsystems include an acoustic transmitter, an acoustic receiver, an amplifier, an analog to digital converter, and a Pentium-based processor board. The acoustic receiver was implemented as a five g accelerometer along with the required drive circuitry. The output from the accelerometer was fed into a variable gain amplifier stage, where it was amplified by approximately 2000. The exact gain provided by the amplifier was determined by the intensity of the signal received from the half duplex gauge. The gain was chosen to maximize the signal to noise ratio without saturating the amplifier. The output of the amplifier stage was fed into the analog to digital converter (ADC). The ADC was operated at a sampling frequency of 11025 Hz with 16 bit resolution. The data acquired from the ADC was processed by decoding software. The decoding software is user-configurable, and is not highly sensitive to absolute gain level. The decoding software was implemented as a set of interlocking finite state machines. Each state machine handles a different level of the communication protocol. For example, there is a separate state machine for bit detection, received packet formation, and received packet validation. Bit detection is accomplished by a time-frequency transform, accompanied by energy level hysteresis for noise immunity and energy level debouncing to avoid detection of false bits. Packets are constructed by concatenating a fixed number
19
of bits. Packet validation occurs by throwing away any packet that does not conform to the defined packet structure.
For communication in the opposite direction, there is another set of software modules responsible for encoding packets. Again, interlocking state machines were used to generate packets, with each protocol layer represented by a separate state machine. Some of the more important transmission state machines include bit generation and transmitted packet formation.
The acoustic transmitter consists of an electronic driver module, a transformer, and an acoustic generator. These three components are identical to the components in the half-duplex downhole gauge. Since power consumption is not an issue at the surface, transmission can be optimized by transmitting at the maximum level of output. Half-duplex Wireless Gauge Surface panel application development is relatively straightforward, since for all practical purposes there are unlimited resources in terms of memory, processing power, storage, etc. Downhole application development has none of those advantages. Instead, the downhole tool is severely limited in memory, sampling resolution, and especially processing power (MIPS.)
The processor has eight integrated A/D converters capable of 10 bit resolution. The 10-bit resolution is a limiting factor in tone detection since it corresponds to a dynamic range of only 60 dB. The surface system used had a 16 bit A/D with a corresponding dynamic range of over 96 dB.
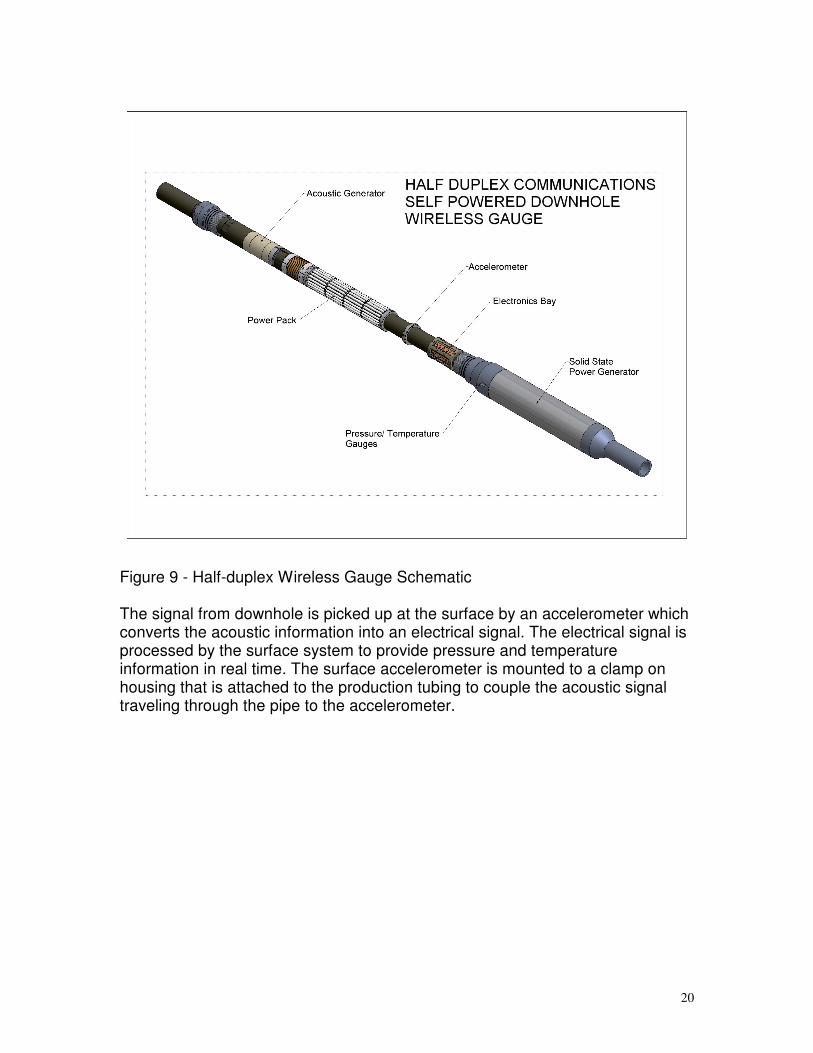
The processor is currently being operated as a microcontroller, which means that the internal RAM is being used. There are 1,536 bytes of internal RAM. This limits the size of the sampled data array that can be processed. Since sampling must continue during processing, two data buffers are required: one for signal processing, and one for current data acquisition. This can be compared to the RAM available to the surface system, 512 Mbytes. Figure 9 shows the schematic of the half duplex wireless gauge.
20
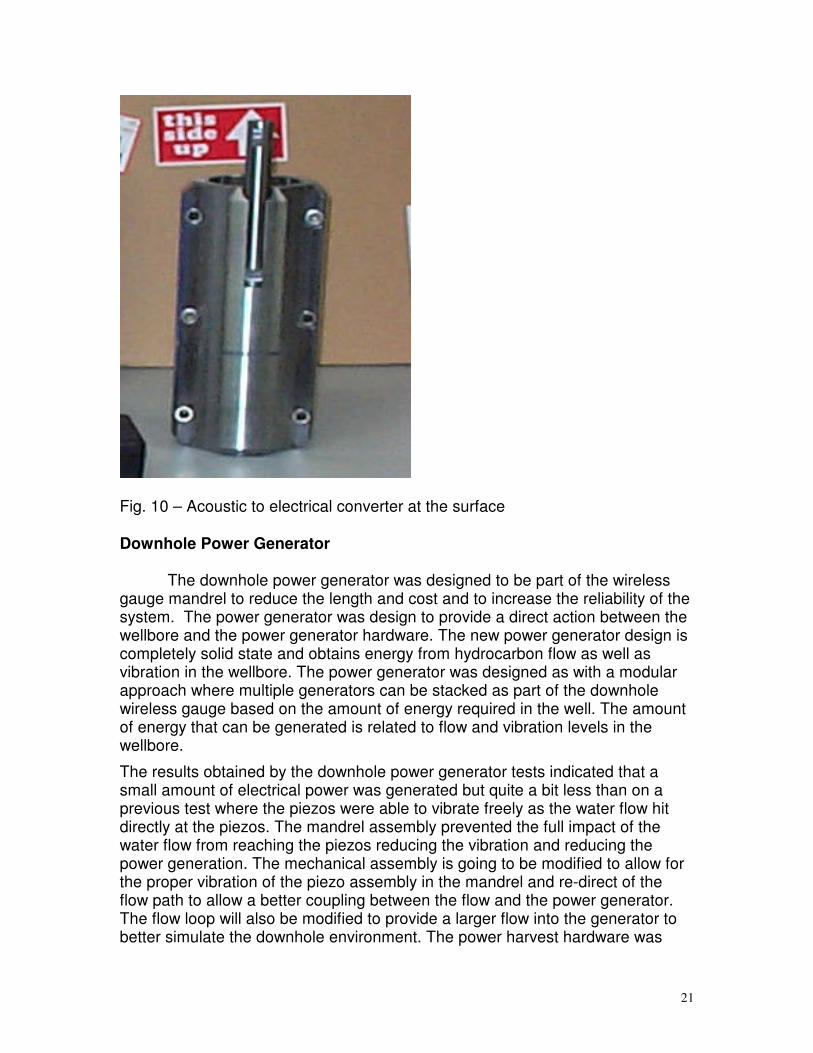
Figure 9 - Half-duplex Wireless Gauge Schematic The signal from downhole is picked up at the surface by an accelerometer which converts the acoustic information into an electrical signal. The electrical signal is processed by the surface system to provide pressure and temperature information in real time. The surface accelerometer is mounted to a clamp on housing that is attached to the production tubing to couple the acoustic signal traveling through the pipe to the accelerometer.
21
Fig. 10 – Acoustic to electrical converter at the surface
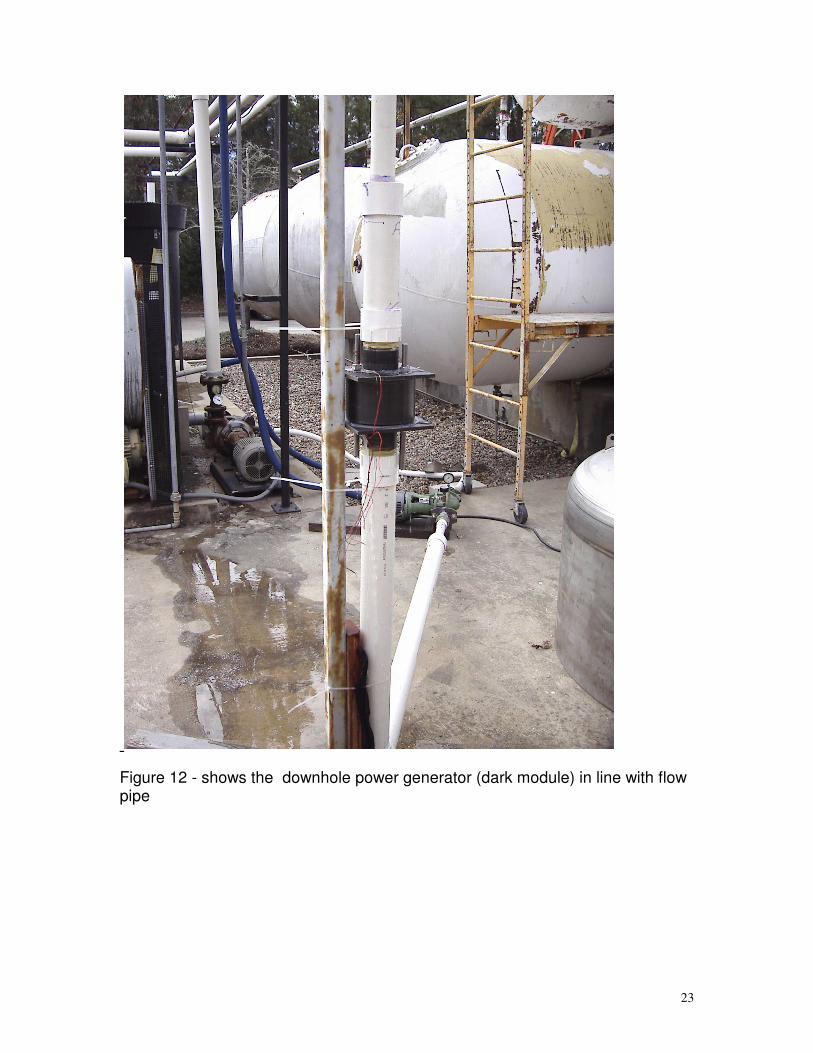
Downhole Power Generator The downhole power generator was designed to be part of the wireless gauge mandrel to reduce the length and cost and to increase the reliability of the system. The power generator was design to provide a direct action between the wellbore and the power generator hardware. The new power generator design is completely solid state and obtains energy from hydrocarbon flow as well as vibration in the wellbore. The power generator was designed as with a modular approach where multiple generators can be stacked as part of the downhole wireless gauge based on the amount of energy required in the well. The amount of energy that can be generated is related to flow and vibration levels in the wellbore.
The results obtained by the downhole power generator tests indicated that a small amount of electrical power was generated but quite a bit less than on a previous test where the piezos were able to vibrate freely as the water flow hit directly at the piezos. The mandrel assembly prevented the full impact of the water flow from reaching the piezos reducing the vibration and reducing the power generation. The mechanical assembly is going to be modified to allow for the proper vibration of the piezo assembly in the mandrel and re-direct of the flow path to allow a better coupling between the flow and the power generator. The flow loop will also be modified to provide a larger flow into the generator to better simulate the downhole environment. The power harvest hardware was

22
also tested and the results were very good and the power was acquired and stored in capacitors. The power harvest circuit diagram is shown below.
Figure 11 – Power harvesting module
23
Figure 12 - shows the downhole power generator (dark module) in line with flow pipe
24
Signal Detection Algorithms Since many off the shelf implementations exist for the fast Fourier transform, the first time-frequency transform tested was the Fast Fourier transform. Most of these implementations are floating point implementations since rarely do applications have the resource limitations listed above, or are required to operate in realtime. For speed of development, one of these implementations was modified for our application.
The frequency of our signal determined the sampling rate. The sampling rate combined with the duration of our signal led to our bin size. The result of our testing showed that the algorithm was highly successful in signal detection. Unfortunately, processing a single bin took over a second, which exceeds the available time.
In order to reduce the processing time, the floating point software was converted to fixed point. Although it reduced processing time significantly, bin processing still exceeded the maximum acceptable. The next step in increasing efficiency was to truncate the 10 bit input from the A/D converter to eight bits so that single cycle multiplications could be used. The result was that the maximum acceptable processing time was still exceeded. No further efficiencies could be identified, so algorithm testing switched to Goertzel’s algorithm. Although Goertzel’s algorithm does not provide information about the entire spectrum, for energy detection at a limited number of discrete tones it is highly efficient.
Documentation on Goertzel’s Algorithm is almost universally based on a floating point implementation. Therefore, development started using a floating point implementation. The first attempt was made using the full 10 bit output of the A/D. Testing showed that the speed of processing was still insufficient. To reduce processing time, phase information was ignored. By ignoring phase information and discarding the two least significant bits, processing time was reduced to 15 milliseconds. 15 milliseconds were significantly below our requirement, so further optimization was not needed. Just as in the case of the FFT, the next step would have been to move to a fixed point implementation.
The integration interval was determined by both the design of our bit, and the structure of our packet. The integration interval was also the basic mechanism for advance in the bit detection finite state machine.
The other input to our finite state machine was a threshold energy determined experimentally. Exceeding that threshold energy would allow the FSM to advance, while energy detection below the threshold would lead to a reset of the state machine.
For noise immunity, threshold levels for bit detection and bit absence were used.
Conclusion
A new downhole gauge has been developed for monitoring deep well gas production. The system is self sufficient where power, sensors and communications are all built as one tool. The new system can provide pressure and temperature measurements and generate power inside the well. A power
25
storage module is capable of capturing, conditioning and storing the energy generated for utilization during the data transmission to the surface. A surface to downhole communications module was also developed to transmit information to the downhole gauge to provide the ability to change data rates or to ask for data in a master-slave configuration. A new digital signal processing module for the downhole tool has been proven to work in the wellbore environment and capable of differentiating signal from noise and also capable of detecting and processing the commands issued at the surface.
Future development would include replacement of the software tone detector with a dedicated hardware tone detector. This would greatly increase the dynamic range for signal acquisition in the downhole pressure gauge. It would also increase noise rejection. With that enhancement along with a change of location of our downhole accelerometer, it can be expected that the range of the tool would be extended many thousand feet.
Bibliography Oppenheim and Schafer, Discrete-Time Signal Processing, Prentice-Hall, Englewood Cliffs, NJ, 1989. Banks, K., “The Goertzel Algorithm,” Embedded Magazine, September 2002. P. Mock, ``Add DTMF generation and decoding to DSP- designs,'' EDN, vol. 30, pp. 205-220, March 21 1985. Deitel, H. and Deitel, P., How to Program C++, Up Saddle River, NJ: Prentice
Hall, 1998. Katzen, S., The Quintessential PIC Microcontroller, London, England: Springer,
2001. Predko, M., Programming and Customizing PICmicro Microcontrollers, Second
Edition, New York, NY: McGraw-Hill, 2002. Nelson, M., Serial Communications Developer’s Guide, Second Edition, Chicago,
IL: IDG Books Worldwide, 2000. Kovitz, B., Practical Software Requirements, Greenwich, CT: Manning
Publications, 1998. Lakos, J., Large-Scale C++ Software Design, Berkeley, CA: Addison-Wesley
Longman, 1996. Maguire, S., Writing Solid Code, Redmond, WA: Microsoft Press, 1993. Yourdon, E., Death March, Saddle River, NJ: Prentice Hall, 1997.

26
Stevens, W., TCP/IP Illustrated, Volume 1, Berkeley, CA: Addison-Wesley Longman, 1994.
Roth, Jr., C., Fundamentals of Logic Design, Fourth Edition, New York, NY: PWS
Publishing Company, 1995. Microchip Corporation, MPLAB-CXX Reference Guide, Chandler, AZ: Microchip
Corporation, 2002. Microchip Corporation, MPLAB IDE, Simulator, Editor User’s Guide, Chandler,
AZ: Microchip Corporation, 2002. Callister, Jr., W., Materials Science and Engineering, Third Edition, New York,
NY: John Wiley and Sons, 1994. Budinski, K., Engineering Materials Properties and Selection, Fifth Edition,
Columbus, OH: Prentice Hall, 1996. Palmer, J. and Perlman, D., Introduction to Digital Systems, New York, NY:
McGraw-Hill, 1993. Anderson, P., Technical Writing, Fort Worth, TX: Harcourt Brace Jovanovich,
1991. Lathi, B., Modern Digital and Analog Communication Systems, Second Edition,
Fort Worth, TX: Holt, Rinhart and Winston Inc., 1989. Lathi, B., Signals, Systems, and Contols, New York, NY: Harper and Row, 1974. Kinsler, L., Coppens A., Frey A., and Sanders, J., Fundamentals of Acoustics,
Third Edition, New York, NY: John Wiley and Sons, 1982. Wiegers, K., Software Requirments, Redmond, WA: Microsoft Press, 1999. Chan, Shu-Park, Chan Shu-Yun, and Chan Shu-Gar, Analysis of Linear
Networks and Systems, Menlo Park, CA: Addison-Wesley, 1972. Humphrey, W., Managing the Software Process, New York, NY: Addison-
Wesley, 1998. Brogan, W., Modern Control Theory, Second Edition, Englewood Cliffs, NJ:
Prentice-Hall, 1985. McConnell, S., Software Project Survival Guide, Redmond, WA: Microsoft Press,
1998.

27
List of Acronyms and Abbreviations There are no acronyms or abbreviations in this report. Appendices
No appendices.