title page - home - the wildlife trust of south and west · web viewthis report draws together...
TRANSCRIPT

JNCC Report
No. XXX
Seabird monitoring on Skomer Island in 2012
C Taylor and R Kipling
The Wildlife Trust of South and West WalesThe Welsh Wildlife Centre
Cilgerran, CardiganSA43 2TB
D Boyle and CM Perrins
Edward Grey InstituteDepartment of Zoology
South Parks RoadOxford OX1 3PS
November 2012
This document should be cited as:Taylor, CJ., Boyle, D. and Perrins, CM, Kipling, R. (2012) Seabird monitoring on
Skomer Island in 2012.JNCC Report No.XXX


3
Table of ContentsSummary.....................................................................................................................................71 Introduction.........................................................................................................................9
1.1 Introduction to survival estimates...............................................................................92 General methods...............................................................................................................11
2.1 Whole island counts..................................................................................................112.2 Study plot counts of common guillemots Uria aalge and razorbills Alca torda......112.3 Breeding success.......................................................................................................122.5 Weather.....................................................................................................................12
3 Northern fulmar Fulmarus glacialis.................................................................................133.1 Breeding numbers - whole island counts..................................................................133.2 Breeding success.......................................................................................................143.3 Timing of breeding...................................................................................................15
4 European storm-petrel Hydrobates pelagicus..................................................................165 Manx shearwater Puffinus puffinus..................................................................................17
5.1 Study plot census......................................................................................................175.2 Breeding success.......................................................................................................205.3 Adult survival...........................................................................................................21
6 Great cormorant Phalacrocorax carbo.............................................................................226.1 Breeding numbers.....................................................................................................226.2 Breeding success.......................................................................................................22
7 European shag Phalacrocorax aristotelis.........................................................................237.1 Breeding numbers.....................................................................................................237.2 Breeding success.......................................................................................................23
8 Lesser black-backed gull Larus fuscus.............................................................................248.1 Methods for estimating breeding numbers...............................................................248.2 Breeding numbers – results......................................................................................258.3 Breeding success.......................................................................................................298.4 Adult survival...........................................................................................................31
9 Herring gull Larus argentatus..........................................................................................329.1 Breeding numbers.....................................................................................................329.2 Breeding success.......................................................................................................339.3 Adult survival...........................................................................................................34
10 Great black-backed gull Larus marinus.......................................................................3510.1 Breeding numbers.....................................................................................................3510.2 Breeding success.......................................................................................................3510.3 Diet study..................................................................................................................36
11 Black-legged kittiwake Rissa tridactyla.......................................................................4011.1 Breeding numbers.....................................................................................................4011.2 Breeding success.......................................................................................................4011.3 Timing of breeding...................................................................................................4311.4 Adult survival...........................................................................................................44
12 Common guillemot Uria aalge.....................................................................................4512.1 Breeding numbers - whole island counts..................................................................4512.2 Breeding numbers - study plot counts......................................................................4512.3 Breeding success.......................................................................................................4712.4 Timing of breeding...................................................................................................49
3
12.5 Adult and juvenile survival.......................................................................................4913 Razorbill Alca torda.....................................................................................................50
13.1 Breeding numbers - whole island counts..................................................................5013.2 Breeding numbers - study plot counts......................................................................5013.3 Breeding success.......................................................................................................5213.4 Timing of breeding...................................................................................................5413.5 Adult survival...........................................................................................................54
14 Atlantic puffin Fratercula arctica................................................................................5614.1 Breeding numbers.....................................................................................................5614.2 Burrow occupancy and breeding success.................................................................5714.3 Feeding rates.............................................................................................................5814.4 Adult survival...........................................................................................................59
16 References.....................................................................................................................5917 Appendices...................................................................................................................61
Appendix 1 Mean seabird counts by section....................................................................61Appendix 2 Dates of visits to Black legged kittiwake sub-colonies 2012.......................62Appendix 3 Guillemot and Razorbill Study Plots............................................................63Appendix 4 Spring Atlantic puffin counts on Skomer Island, 2012................................64Appendix 5 Mean annual estimated survival rates of seabirds on Skomer Island...........65Appendix 6 Ringing Totals for 2012................................................................................66Appendix 7 Skomer Island Guillemot Study 2011 (Birkhead, 2010)..............................67
Appendix 8 Gull Diet Survey Comparison of Methods...................................................81
4
4 Seabird monitoring on Skomer Island in 2012

5
List of figures
Figure 1 Northern fulmar breeding numbers on Skomer Island 1963-2012.............................13Figure 2 Northern fulmar breeding success on Skomer Island 1986-87 and 1992-2012..........15Figure 3 Trend of annual survival estimate of Manx Shearwater from 1997 to 2010..............21Figure 4 Great cormorant breeding numbers on Skomer Island 1960-2012.............................22Figure 5 European shag breeding numbers on Skomer Island 1960-2012...............................23Figure 6 Lesser Black-backed gull breeding numbers on Skomer Island 1961-2012...............28Figure 7 Number of fledgling Lesser Black-backed Gulls per pair..........................................30Figure 8 Trend of annual survival estimate of Lesser Black-backed gull 1978 to 2010...........31Figure 10 Breeding success of coast-nesting herring gulls on Skomer Island, 1962-2012........33Figure 11 Trend of annual survival estimate of Herring gull 1978 to 2010................................34Figure 12 Great Black-backed gull: breeding numbers on Skomer Island 1960-2012...............35Figure 13 Great Black-backed gull breeding success on Skomer Island 1996-2012..................36Figure 14 Greater Blacked-backed gull diet remains from 25 nests on Skomer Island 2012.....37Figure 15 Frequency of occurrence of food items around 25 great black-backed gull nests in
2012.............................................................................................................................38Figure 16: Mean number of Shearwater carcasses found at Greater black-backed gull nests in 1959, 1965, 1973, 1992 and 2008 - 2012.......................................................................................38Figure 17 Black-legged kittiwake breeding numbers on Skomer Island 1960-2012..................40Figure 18 Black-legged kittiwake breeding success on Skomer Island 1989-2012....................42Figure 19 Trend of annual survival estimate of Black-legged kittiwake from 1978 up to and
including survival in 2010..........................................................................................44Figure 20 Common guillemot breeding numbers on Skomer Island 1963-2012........................47Figure 21 Common guillemot breeding success on Skomer Island 1989-2012..........................49Figure 22 Razorbill breeding numbers on Skomer Island 1963-2012........................................52Figure 23 Razorbill breeding success on Skomer Island 1993-2012..........................................54Figure 24 Trend of adult survival of Razorbill up to and including survival from 1979 to 2010....
....................................................................................................................................55
Figure 25 Maximum spring counts of Atlantic puffin on Skomer Island 1989-2012.................57Figure 26 Feeding rates of Puffins in relation to time of day.............................................59Figure 27 Trend of annual survival estimate of Atlantic puffin 1972 up to and including
survival from 2010......................................................................................................59
5

List of Tables
Table 1 Northern fulmar whole island count details 2004-2012.............................................12Table 2 Northern fulmar breeding success on Skomer Island 2012........................................14Table 3 Northern fulmar breeding success on Skomer Island 2006 - 2012.............................14Table 4 Northern fulmar timing of breeding on Skomer Island 2007 - 2012..........................15Table 6 Number of responses from Manx shearwater study plots 1998 – 2012......................19Table 7 Breeding success of Manx Shearwaters 2012.............................................................20Table 8 Breeding of success of Manx Shearwaters 1995-2012...............................................20Table 8.1 Record of Lesser Black-backed Gull Cane counting area...........................................24Table 9 Lesser Black-backed Gull actual nest count, total in cane counted areas and cane:eye
count ratio...................................................................................................................25Table 10 Mean eye count totals of Lesser Black-backed Gull AON or S in sub colonies........27Table 11 Percentage of empty Lesser Black-backed Gull nests counted in May 2012.............28Table 12 Lesser Black-backed Gull empty nest ratios 1998 - 2012..........................................28Table 13 Estimated number of Lesser Black-backed Gull fledglings in 2012..........................29Table 14 Lesser Black-backed Gull productivity in 2012.........................................................29Table 15 Estimated productivity of herring gulls on Skomer, 2012..........................................33Table 16 Black-legged kittiwake whole island count details Skomer 2007-2012.....................40Table 17 Black-legged kittiwake breeding success (per Apparently Occupied Nest) on Skomer Island in 2012..................................................................................................................................41Table 18 Black-legged kittiwake breeding success (per AON) on Skomer Island in 1989-2012.
........................................................................................................................................42
Table 19 Black-legged kittiwake fledging success in relation to the number of chicks hatched per nest on Skomer Island 2012..................................................................................43
Table 20 Black-legged kittiwake - timing of breeding on Skomer Island 2007 - 2012.............43Table 21 Common guillemot whole island counts on Skomer Island, 2004-2012....................45Table 22 Common guillemot study plot totals on Skomer Island 2008-2012...........................46Table 23 Common guillemot breeding success (per active and regular sites) on Skomer Island
1989-2012...................................................................................................................47Table 24 Guillemot breeding success (per active site and per active and regular site) on
Skomer Island 2012....................................................................................................48Table 25 Common guillemot timing of breeding 2007-2012....................................................49Table 26 Razorbill whole island count details on Skomer Island, 2006-2012..........................50Table 27 Razorbill study plot totals on Skomer Island 2008 -2012..........................................51Table 28 Razorbill breeding success on Skomer Island 1993-2012..........................................52Table 29 Razorbill breeding success (per active site and per active and regular site) on Skomer
Island 2012..................................................................................................................53Table 30 Razorbill timing of breeding 2007 – 2012..................................................................54Table 31 Maximum spring counts of Atlantic puffin on Skomer Island and Middleholm 1989-
2012.............................................................................................................................56Table 32 Burrow occupancy and breeding productivity of Puffins on Skomer 2012...............57Table 33 Feeding rates of Puffins in 2012.................................................................................58
6
6 Seabird monitoring on Skomer Island in 2012
7
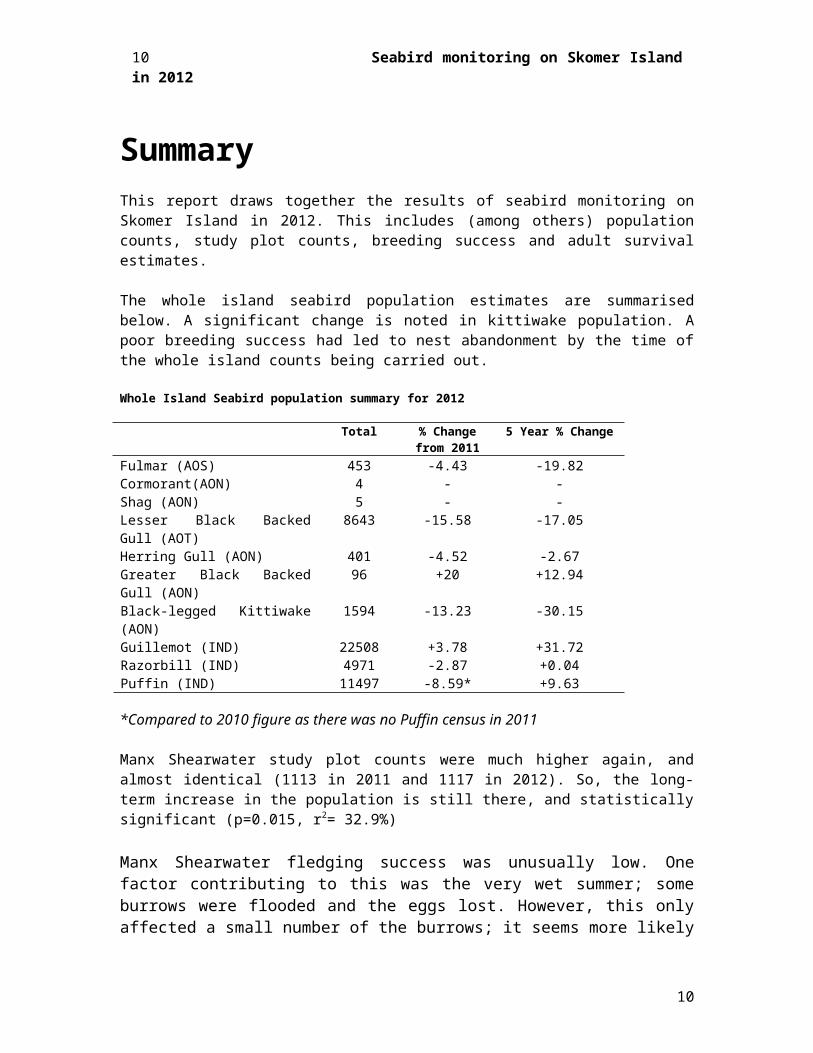
SummaryThis report draws together the results of seabird monitoring on Skomer Island in 2012. This includes (among others) population counts, study plot counts, breeding success and adult survival estimates.
The whole island seabird population estimates are summarised below. A significant change is noted in kittiwake population. A poor breeding success had led to nest abandonment by the time of the whole island counts being carried out.
Whole Island Seabird population summary for 2012
Total % Change from 2011
5 Year % Change
Fulmar (AOS) 453 -4.43 -19.82Cormorant(AON) 4 - -Shag (AON) 5 - -Lesser Black Backed Gull (AOT) 8643 -15.58 -17.05Herring Gull (AON) 401 -4.52 -2.67Greater Black Backed Gull (AON) 96 +20 +12.94Black-legged Kittiwake (AON) 1594 -13.23 -30.15Guillemot (IND) 22508 +3.78 +31.72Razorbill (IND) 4971 -2.87 +0.04Puffin (IND) 11497 -8.59* +9.63
*Compared to 2010 figure as there was no Puffin census in 2011
Manx Shearwater study plot counts were much higher again, and almost identical (1113 in 2011 and 1117 in 2012). So, the long-term increase in the population is still there, and statistically significant (p=0.015, r2= 32.9%)
Manx Shearwater fledging success was unusually low. One factor contributing to this was the very wet summer; some burrows were flooded and the eggs lost. However, this only affected a small number of the burrows; it seems more likely that lack of food around hatching time was more important, a number of chicks were very light later in the year.
Fulmar productivity in 2012 was 0.38 per AON (increase on 2011)
Lesser Black-backed Gull productivity was 0.5 chicks per AON. As before, the persistent low productivity, combined in many years with a low adult survival rate, should combine to show a steady decline in the breeding population.
Herring Gull productivity was 0.86 per AON The average breeding success for all years monitored between 1962 and 2011 is 0.72 large chicks per AON. This year breeding success at returned to above average after four relatively low years.
Greater Black Backed Gull productivity was 0.92. This is a decrease in breeding success compared to last year. In the diet study Manx Shearwater remains were recorded at 92 % of the nests studied. Feather pellets and unidentified bones were the most prevalent prey items, being
7

found at 92 % of the nests. Refuse was found at 72 % of the nests, compared to only 44 % in 2010. Other birds were found at 68 % of nests and included Puffins and Guillemots.
Kittiwake showed a low breeding success rate. 89% of AONs went on to apparently incubate eggs (93% in 2011), with 41% of these producing chicks (64% in 2011). 6% of pairs did not complete nests (‘trace’ nests only) (2% in 2011).
Guillemot breeding success saw a mean productivity of 0.63 fledged birds per active and regularly occupied site, which is an increase of 0.08 from 2011
Razorbill productivity was 0.17 (0.21 per active only site), a large decrease from the 2010 productivity figures.
Puffin productivity had an 85% success rate Puffins on Skomer had another excellent breeding season in 2012
8
8 Seabird monitoring on Skomer Island in 2012
9
1 IntroductionSeabirds are a significant component of the marine environment and Britain has internationally important populations of several species. A national Seabird Monitoring Programme, co-ordinated by the Joint Nature Conservation Committee (JNCC), includes a small number of "key site" seabird colonies where detailed monitoring of breeding success, annual survival rates and population trends is carried out. These sites are geographically spread to give as full coverage of British waters as possible.
Skomer Island is the most suitable site for this work in south-west Britain. It is a National Nature Reserve managed by The Wildlife Trust of South and West Wales (WTSWW) under a lease from the Countryside Council for Wales (CCW). Not only is Skomer the most important seabird colony in southern Britain, but the waters around the island have been designated a Marine Nature Reserve. Seabird monitoring fits within a broader framework of monitoring marine and terrestrial organisms on and around the island.
There is an impressive data set for seabirds on Skomer. This is especially important for species such as seabirds with long periods of immaturity and high adult survival rates. The Wildlife Trust has been monitoring seabirds on the island since the early 1960s. Additional detailed studies of particular species, annual adult survival rates, breeding success and other aspects of seabird ecology have been carried out for many years by other bodies.
In 2012, the whole island counts and study plot counts of common guillemot and razorbill, the whole island counts of northern fulmar and all breeding gulls (including black-legged kittiwake) and breeding success rates of fulmar, herring gull, great black-backed gull, kittiwake and guillemot were funded by JNCC. This work is carried out by the island Warden and a contract Field Assistant with additional help in some areas by the island Assistant Wardens and volunteers. Richard Kipling was the Field Assistant in 2012.
Lesser Black-backed gulls cane count areas were altered in 2012 to build up a picture of correction factors across all colonies on the island. To be of use this must be continued into 2013.
A review of the Greater Black-backed Gull diet study was also carried out in 2012 and can be read in Appendix 8.
This report includes other seabird monitoring studies undertaken on Skomer by the Edward Grey Institute and Sheffield University.
1.1 Introduction to survival estimatesThe survival rate analyses presented have been made in the same way as in the other years since 1978, in that they have been made from a computer calculation of Maximum Likelihood Measurements (using the programme MARK) and only one measure of survival for each year is presented. As with similar methods, two years of observations are needed to obtain the estimate for a given year, i.e. the 1999 estimate can only be obtained after observations in 2000 and 2001. Hence the survival figure for the last year (2011-12) is not comparable with the others and is not presented. The estimates for other more recent years are likely to change (hopefully not much) with the addition of further years of data. Years for which the survival rates are not given are ones
9
in which estimates cannot be made accurately; this is normally because they are very high and the confidence limits exceed 100.
The six graphs showing estimated survival rates of the species concerned are presented under each species account. A table listing the actual figures, are given together in Appendix 5. Each graph has a line at 90% survival for ease of reading. For those species where a significant trend is apparent, the trend-line is also presented.
Survival rates were measured for a number of species on the island. Observations were made by David Boyle (EGI). We are grateful to Matt Wood for helping with the survival analyses in this report.
10
10 Seabird monitoring on Skomer Island in 2012
11
2 General methods2.1 Whole island countsThe herring gull Larus argentatus and great black-backed gull Larus marinus censuses were carried out from mid to late May. The lesser black-backed gull Larus fuscus census followed the established method of counts from vantage points of sub-colonies (in the second week of May) corrected by a figure established from actual nest counts in sample areas (during 14-17 May).
The whole island counts of the cliff-nesting species were largely carried out during the first two weeks of June (1 – 14th).
Counting units and methods follows those recommended in Walsh et al. (1995), but note that the lesser black-backed gull census methodology has been developed on the island (see Sutcliffe 1993).
Graphs showing whole island populations since the 1960s are presented for each species. Note that in past years different counting units and methods have been used for some species, although those in recent years have been standardised. General trends can nonetheless be identified with some confidence.
2.2 Study plot counts of common guillemots Uria aalge and razorbills Alca tordaCounts were made during the first two weeks of June of the same study plots used in previous years, using methods outlined in Walsh et al. (1995). In mid-June 1999, black-and-white photographs were taken of all study plot sites; these are filed on the island.
11

2.3 Breeding successMethodology follows that of Walsh et al. (1995). Brief details are given separately in each species account. Black-and-white photographs of the breeding success plots were taken in mid June 1999 and are filed on the island.
2.5 WeatherMarch – Generally calm and sunnyApril – Two fierce storms hit the island – both with wind >F6 from the North. A very wet month.May – August. Unusually high levels of rainfall.
The affects of weather on the island this year have been observed with possible affects on kittiwake productivity (both at the colony and foraging ability). Puffins do not seem to have suffered in the study plots but Manx Shearwater productivity this year was lower than usual – probably partly due to flooded burrows.
12
12 Seabird monitoring on Skomer Island in 2012

13
3 Northern fulmar Fulmarus glacialis3.1 Breeding numbers - whole island countsA mean total of 453 Apparently Occupied Sites (AOS) were counted in 2012 (see Table 1 and Figure 1). Study plot counts and whole island counts suggest a decline in population since 199, but also since 1998 there has been a gradual increase in productivity. Suggesting the population may have stabilised with regards to food availability and competition for both nest sites and food.
Table 1 Northern fulmar whole island count details 2004-2012
Total % Change
5 Year %
Change2004 730 +15.1 +5.62005 726 -0.5 -0.52006 595 -18.0 -6.32007 611 +2.7 -3.62008 565 -7.5 -22.62009 527 -6.7 -27.42010 530 +0.6 -10.922011 474 -10.57 -22.422012 453 -4.43 -19.82
Figure 1 Northern fulmar breeding numbers on Skomer Island 1963-2012
1960
1962
1964
1966
1968
1970
1972
1974
1976
1978
1980
1982
1984
1986
1988
1990
1992
1994
1996
1998
2000
2002
2004
2006
2008
2010
2012
0
100
200
300
400
500
600
700
800
Whole Island CountStudy plot count
No.
of A
OS
13
14
14 Seabird monitoring on Skomer Island in 2012
15
3.2 Breeding success3.2.1 Methods
Three visits were made to the seven fulmar study plots on 20th May, 23rd May and 27th May to observe site occupancy. Sites were considered occupied if a bird appeared to be incubating or an egg was seen on two consecutive visits. A further visit was made on the 7 th August to determine the presence or absence of large chicks on the sites. All large chicks were assumed to have fledged.
3.2.2 Results
124 AOSs were identified in late May. The mean breeding success of 0.38 per AOS was higher than that found in 2011 (0.33). It was below the average for the period 1986 to 2011 (0.48). The most successful site was at Matthew’s Wick, with 0.58 chicks fledging per AOS (Table 2). No chicks fledged from Tom’s House, a site which frequently experiences complete breeding failure, or at Castle Bay (North) (Table 2).
Table 2 Northern fulmar breeding success on Skomer Island 2012.
No. site monitored
No. sites occupied
Chicks fledged
Breeding success
Tom’s House 11 4 0 0.00Basin (west) 50 20 9 0.45Basin (east) 27 14 6 0.43North Haven 85 38 18 0.47South Haven 30 15 5 0.33Castle Bay 27 14 6 0.43Matthew’s Wick 36 19 11 0.58Mean 0.38SD 0.18SE 0.07Mean 1986-2011 0.48
Table 3 Northern fulmar breeding success on Skomer Island 2006 - 2012.
2006 2007 2008 2009 2010 2011 2012
Tom’s House 0 0 0 0.25 0.43 0.00 0.00Basin (west) 0.18 0.38 0.21 0.32 0.38 0.38 0.45Basin (east) 0.14 0.36 0.25 0.33 0.64 0.43 0.43North Haven 0.3 0.26 0.37 0.34 0.39 0.25 0.47South Haven 0.1 0.5 0.32 0.11 0.24 0.23 0.33Castle Bay 0.29 0.43 0.38 0.25 0.33 0.44 0.43Matthew’s Wick 0.39 0.5 0.29 0.32 0.45 0.56 0.57Mean 0.2 0.35 0.26 0.27 0.41 0.33 0.38SE 0.05 0.07 0.05 0.03 0.05 0.06 0.07
15
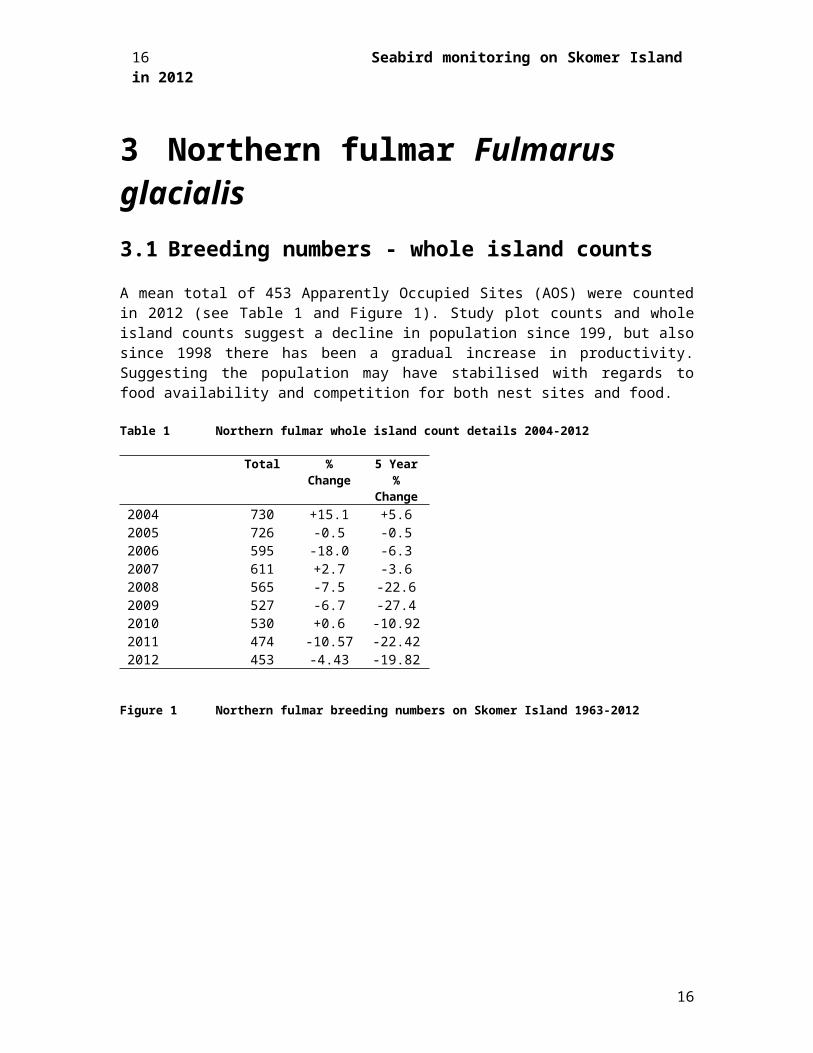
Figure 2 Northern fulmar breeding success on Skomer Island 1986-87 and 1992-2012.
1986
1987
1988
1989
1990
1991
1992
1993
1994
1995
1996
1997
1998
1999
2000
2001
2002
2003
2004
2005
2006
2007
2008
2009
2010
2011
2012
0
0.1
0.2
0.3
0.4
0.5
0.6
0.7
0.8
No.
of c
hick
s fled
ged
per A
OS
3.3 Timing of breedingTime of breeding was recorded in 2012 and is detailed in Table 4.
Table 4 Northern fulmar timing of breeding on Skomer Island 2007 - 2012.
2007 2008 2009 2010 2011 2012
First egg Not recorded 23rd May 20th May 22nd May 9th May 20th MayFirst chick Not recorded 14th July 8th July 6th July 2nd July 13th July
16
16 Seabird monitoring on Skomer Island in 2012

17
4 European storm-petrel Hydrobates pelagicusNo surveys on Skomer have been carried out for European storm-petrel in 2012
A paper recently published by Soanes (2012) compared the response rates of different and manipulated recordings. Then the paper compared different estimation methods for censusing (“Standard” and the “du Feu”).
Estimate Number of AOS(95% confidence interval)
Method (Year of census)
Standard Method (2008)
de Fue Method(2008)
Brown (2003)
Whole Island
101(91-130)
64(55-79)
203(178-239)
The main aim of the study was to test the monitoring method and before using this figure as a population estimate there must be some investigation done into the extent of “searching” for burrows to ensure that this was a true whole island estimate.
References:
Brown, J.G. (2005) Storm Petrel census on Skomer Island in 2003. CCW Contract Science Report no 671.
Soanes, LM., Thomas, R.J. & Bolton, M. (2012) Evaluation of field and analytical methods for estimating the population size of burrow-nesting seabirds from playback surveys. Bird Study, 59(3), 353-357
17

5 Manx shearwater Puffinus puffinus
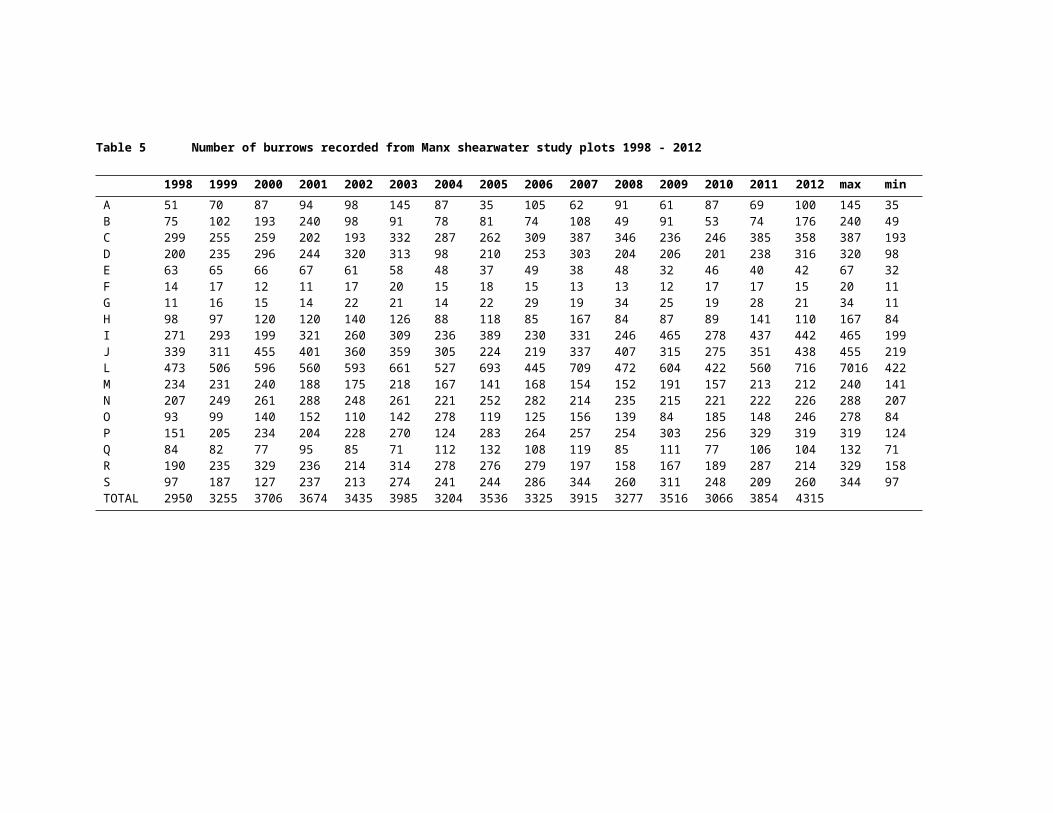
5.1 Study plot censusThis is the 15th year in which the Oxford “team” have carried out the counts of Manx Shearwaters in the study plots on Skomer. Up until last year most of the wsorkers were MSc stuyudnbets. This course finished last year and the work this year was done by D.Phil students and post-docs. Tables 5 and 6 show the number of burrows found and the number of shearwater responses from them. Over the years there has been a significant rise in the numbers of responses though this rise has not been steady and the between-year variation within plots has sometime been surprisingly large; we do not have an explanation for this. Only males respond to the tape (of a male call). The two members of a pair share incubation, roughly equally, each stint being around a week. It would therefore be possible for some of the variation to be due to variation in the proportion of the two sexes present, but the variation in the number of responses seems to be too large for this to be the only explanation.
The total number of responses in 2009 (1181) was 30% higher than the number in 2008, an increase hardly likely to be explained by a population rise in a species with as low as reproductive rate as a shearwater, so a reduction in the number of responses in 2010 was to be expected. However, the 741 responses in 2010 was very much lower – only 65% of the previous year’s responses and the lowest of all years (though the 789 in 2001 was similar). This apparent decline was not observed in other island data. The numbers of birds breeding in the study plot on the Isthmus were similar to those in 2009 and although the over-winter survival rates from these were not yet available, the return rate to the intensively-studied burrows did not seem low. There were hints that the students were not as dedicated to the task as usual, but if so, both groups (two groups come on for four days each) were equally inefficient.
In 2011 and 2012 the counts were much higher again, and almost identical (1113 in 2011 and 1117 in 2012). So, the long-term increase in the population is still there, and statistically significant (p=0.015, r2= 32.9%). This is equivalent to a population increase of some 2.12% p.a. [ If the 2010 figure is excluded the figures are, of course, much higher (p<0.001, r2=66.0%, rate of increase some 2.8%].
Notes:1) There is no plot K2) Same tape used as in previous years
18
18 Seabird monitoring on Skomer Island in 2012
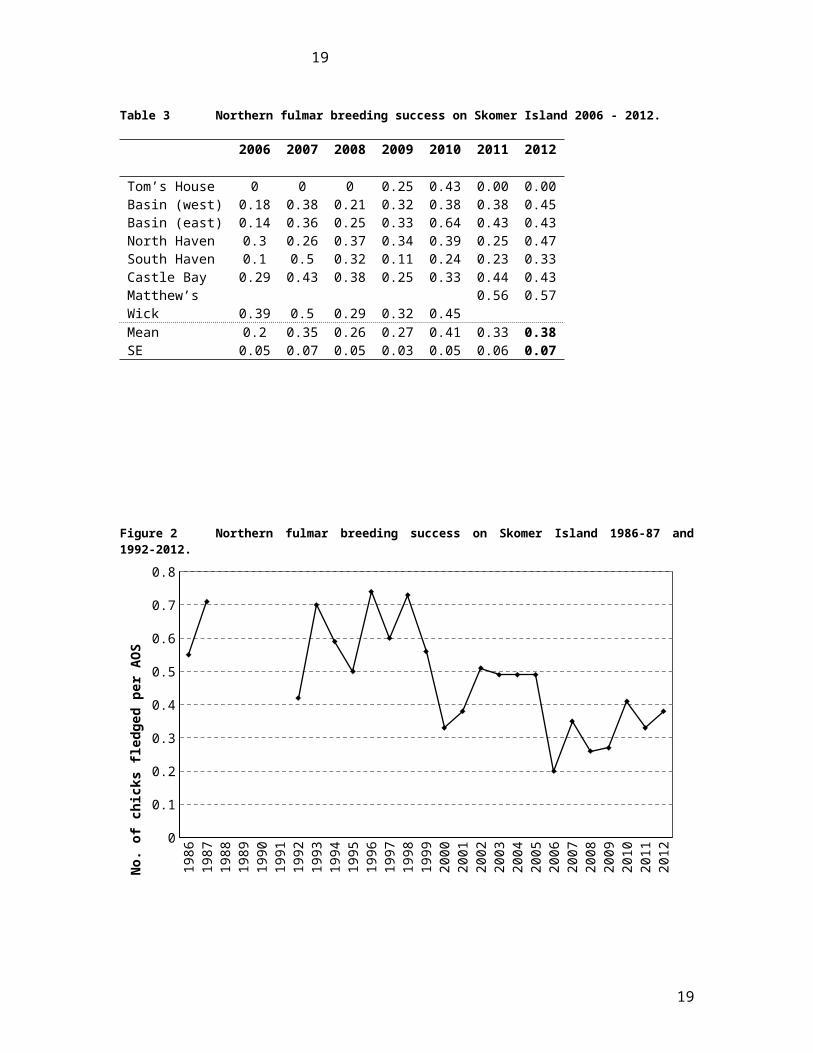
Table 5 Number of burrows recorded from Manx shearwater study plots 1998 - 2012
1998 1999 2000 2001 2002 2003 2004 2005 2006 2007 2008 2009 2010 2011 2012 max min
A 51 70 87 94 98 145 87 35 105 62 91 61 87 69 100 145 35B 75 102 193 240 98 91 78 81 74 108 49 91 53 74 176 240 49C 299 255 259 202 193 332 287 262 309 387 346 236 246 385 358 387 193D 200 235 296 244 320 313 98 210 253 303 204 206 201 238 316 320 98E 63 65 66 67 61 58 48 37 49 38 48 32 46 40 42 67 32F 14 17 12 11 17 20 15 18 15 13 13 12 17 17 15 20 11G 11 16 15 14 22 21 14 22 29 19 34 25 19 28 21 34 11H 98 97 120 120 140 126 88 118 85 167 84 87 89 141 110 167 84I 271 293 199 321 260 309 236 389 230 331 246 465 278 437 442 465 199J 339 311 455 401 360 359 305 224 219 337 407 315 275 351 438 455 219L 473 506 596 560 593 661 527 693 445 709 472 604 422 560 716 7016 422M 234 231 240 188 175 218 167 141 168 154 152 191 157 213 212 240 141N 207 249 261 288 248 261 221 252 282 214 235 215 221 222 226 288 207O 93 99 140 152 110 142 278 119 125 156 139 84 185 148 246 278 84P 151 205 234 204 228 270 124 283 264 257 254 303 256 329 319 319 124Q 84 82 77 95 85 71 112 132 108 119 85 111 77 106 104 132 71R 190 235 329 236 214 314 278 276 279 197 158 167 189 287 214 329 158S 97 187 127 237 213 274 241 244 286 344 260 311 248 209 260 344 97TOTAL 2950 3255 3706 3674 3435 3985 3204 3536 3325 3915 3277 3516 3066 3854 4315

Table 6 Number of responses from Manx shearwater study plots 1998 – 2012
1998 1999 2000 2001 2002 2003 2004 2005 2006 2007 2008 2009 2010 2011 2012 Max MinA 12 15 17 12 20 15 16 12 28 10 23 20 9 13 17 28 9B 19 35 18 19 32 28 32 15 21 30 12 15 9 18 19 35 9C 56 45 27 35 36 45 52 41 53 66 69 82 30 66 41 82 27D 81 65 61 51 71 55 52 64 64 73 61 57 31 80 97 97 31E 17 14 17 15 14 7 9 9 10 5 8 3 5 5 5 17 3F 3 3 2 5 5 6 4 7 8 6 6 3 4 3 9 17 2G 2 6 4 3 9 7 5 8 9 2 9 12 6 7 9 19 2H 23 17 10 15 16 10 14 16 13 17 14 22 12 18 32 32 10I 72 88 74 117 75 67 102 134 111 116 83 169 110 135 144 169 67J 77 75 107 67 54 66 81 73 42 70 72 80 46 95 93 107 42L 147 132 186 131 142 164 185 244 150 157 156 222 123 159 179 244 123M 85 80 67 62 79 94 71 75 66 73 65 81 33 95 89 94 33N 51 67 39 49 52 44 40 63 75 23 37 70 41 82 62 75 23O 27 29 38 34 30 36 84 34 40 29 25 38 30 51 45 84 25P 30 60 57 67 78 77 32 67 95 72 117 93 80 107 127 127 30Q 34 26 17 17 29 26 32 32 32 31 20 65 20 25 28 65 17R 48 44 65 39 56 83 91 92 72 65 62 53 65 79 65 92 39S 37 67 45 51 63 75 63 65 55 73 69 96 87 75 56 96 37TOTAL 821 868 851 789 861 905 965 1052 944 918 908 1181 767 1113 1117
20 Seabird monitoring on Skomer Island in 2012
20

5.2 Breeding successManx Shearwater breeding success in The Isthmus study plot in 2012 is detailed in the table 7 below. Fledging success was unusually low. One factor contributing to this was the very wet summer; some burrows were flooded and the eggs lost. However, this only affected a small number of the burrows; it seems more likely that lack of food around hatching time was more important, a number of chicks were very light later in the year.
Table 7 Breeding success of Manx Shearwaters 2012
NumberTotal Number of eggs laid 91Number of eggs that hatched1 50Number of chicks found dead 4Number of missing chicks2 9Number of chicks surviving to ringing age3 37Hatching success4 40%Fledging success4 55%
Notes: 1) No chick was found in 41 burrows: 18 burrows are known to have failed at the egg stage (1 burrow was taken over by Puffins and in the other 17 burrows either cold, abandoned eggs or broken eggs were found). The other 23 burrows were empty when they were checked for chicks in early July so it is not known if the egg failed or the chick died when very small; as in previous years it is assumed the eggs failed (but it is probably more likely they failed at the small chick stage).
2) These chicks definitely hatched, being recorded when small, but their burrows were empty when it came to ringing the chicks and they are assumed to have died.
3) Birds surviving to this stage are assumed to have fledged as they are not ringed until large.
4) Due to the 23 burrows that are assumed to have failed at the egg stage but could have actually failed when the chick was very small hatching success is a minimum and fledging success a maximum.
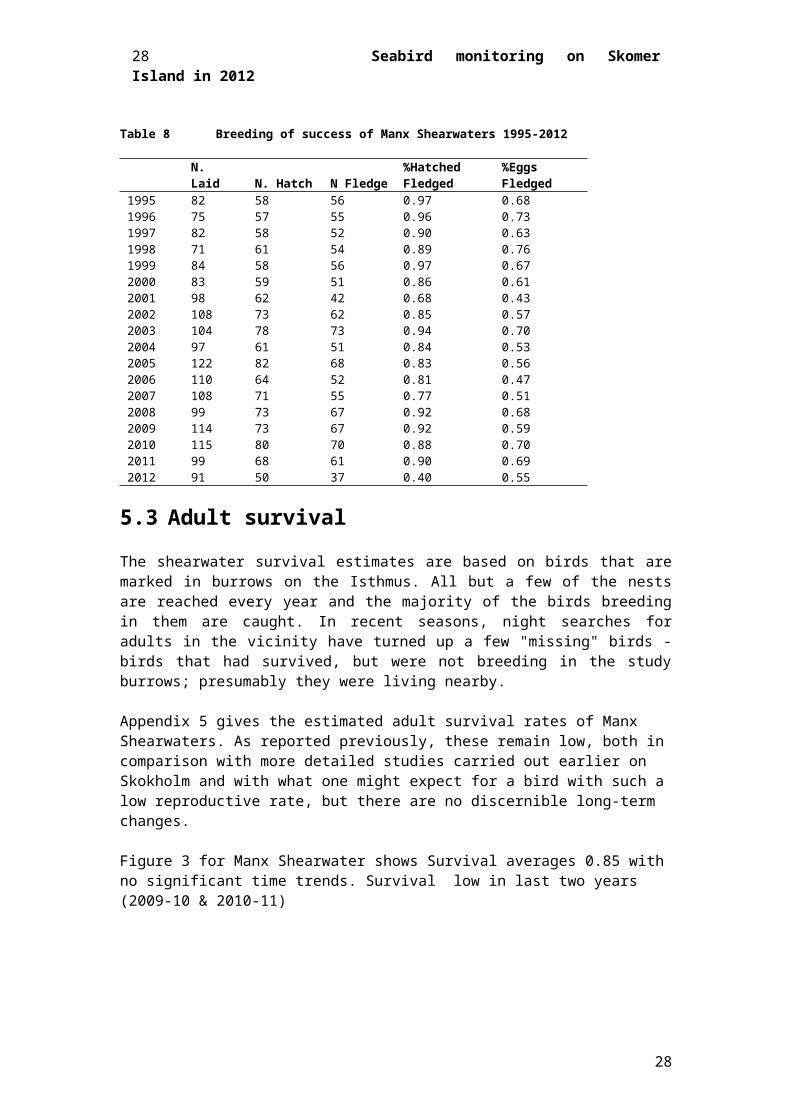
Table 8 Breeding of success of Manx Shearwaters 1995-2012
N. Laid N. Hatch N Fledge%Hatched Fledged
%Eggs Fledged
1995 82 58 56 0.97 0.681996 75 57 55 0.96 0.731997 82 58 52 0.90 0.631998 71 61 54 0.89 0.761999 84 58 56 0.97 0.672000 83 59 51 0.86 0.612001 98 62 42 0.68 0.432002 108 73 62 0.85 0.572003 104 78 73 0.94 0.702004 97 61 51 0.84 0.532005 122 82 68 0.83 0.562006 110 64 52 0.81 0.472007 108 71 55 0.77 0.512008 99 73 67 0.92 0.682009 114 73 67 0.92 0.592010 115 80 70 0.88 0.702011 99 68 61 0.90 0.692012 91 50 37 0.40 0.55
5.3 Adult survivalThe shearwater survival estimates are based on birds that are marked in burrows on the Isthmus. All but a few of the nests are reached every year and the majority of the birds breeding in them are caught. In recent seasons, night searches for adults in the vicinity have turned up a few "missing" birds - birds that had survived, but were not breeding in the study burrows; presumably they were living nearby.
Appendix 5 gives the estimated adult survival rates of Manx Shearwaters. As reported previously, these remain low, both in comparison with more detailed studies carried out earlier on Skokholm and with what one might expect for a bird with such a low reproductive rate, but there are no discernible long-term changes.
Figure 3 for Manx Shearwater shows Survival averages 0.85 with no significant time trends. Survival low in last two years (2009-10 & 2010-11)
22 Seabird monitoring on Skomer Island in 2012
22

Seabird monitoring on Skomer Island in 2012
Figure 3 Trend of annual survival estimate of Manx Shearwater from 1997 to 2010
23
6 Great cormorant Phalacrocorax carbo6.1 Breeding numbersAfter a four year decline resulting in no nests observed in 2011, in 2012 four pairs were seen on nests regularly on the Mew Stone.
Figure 4 Great cormorant breeding numbers on Skomer Island 1960-2012
1960
1962
1964
1966
1968
1970
1972
1974
1976
1978
1980
1982
1984
1986
1988
1990
1992
1994
1996
1998
2000
2002
2004
2006
2008
2010
2012
0
5
10
15
20
25
30
No.
of A
ON
6.2 Breeding successIn total 6 juvenile Cormorants fledged from 4 nests. Giving a productivity of 1.5 per AON
24 Seabird monitoring on Skomer Island in 2012
24

Seabird monitoring on Skomer Island in 2012
7 European shag Phalacrocorax aristotelis7.1 Breeding numbersFive pairs were seen nesting on the North coast of Skomer.
Figure 5 European shag breeding numbers on Skomer Island 1960-2012.
1960
1962
1964
1966
1968
1970
1972
1974
1976
1978
1980
1982
1984
1986
1988
1990
1992
1994
1996
1998
2000
2002
2004
2006
2008
2010
2012
0
5
10
15
20
25
No.
of A
ON
7.2 Breeding successNo consistent monitoring of the breeding success of European shags on Skomer took place in 2012, but young were seen during June cliff counts. On nearby Middleholm there were 46 Apparently Occupied Nests. 2.89 chicks per AON were raised (South Pembrokeshire Ringing Group).
25

8 Lesser black-backed gull Larus fuscus8.1 Methods for estimating breeding numbersCounts of AOS were made from various standardised viewpoints around the island. On most occasions a group of observers counted sub-colonies simultaneously (defined as the count ‘event’); the mean counts from each event were then used to calculate the overall mean for each sub-colony. Nests, including empty nests, in selected sub-colonies were then systematically searched for, counted and marked with canes. The difference between the counts from viewpoints and the actual nest counts produced a mean adjustment factor, that was applied to the mean of the counts from viewpoints for the whole island. The method assumes that each pair built one nest. Applying a single correction factor to the whole range of sub-colonies, which vary in habitat type and breeding density, may lead to errors, although it is difficult to overcome this.
At the request of JNCC in 2012 the areas selected for cane counting were changed. The aim is to build up a rolling picture of the correction factors for specific sections. 2012 was the first year of this trial and for 2013 JNCC will need to decide whether there needs to be a new analysis to account for individual area correction factors. The standard analysis method was applied to all cane counting areas in 2012. The benefits of this are that the same areas are not disturbed each year.
Table 8.1 Record of Lesser Black-backed Gull Cane counting areastandard
areas2012
1 South Old Wall2 Marble Rocks 3 Abyssinia + 24 4 Anvil Rock 5 Bull Hole 6 Pyramid Rock 7 North Plain 8 Sheer Face W 9 Sheer Face E 10 The Hill 11 Double Cliff 12 North slopes 13 N Valley Rise 14 Green Plain 15 S Neck - Thorn Rock 16 W/S Field 17 Saunders Fist 18 Harold Stone 19 Wick Cliff 20 Tom's House-Sk Head 21 colony now joined with X 22 Garland Stone 23 NW Neck 24 E of W Pond – see 3 25 Toms House to Wick26 Mew StoneA Lantern
26 Seabird monitoring on Skomer Island in 2012
26

Seabird monitoring on Skomer Island in 2012
B Neck E CNeck main ridge D South Castle E Neck SW coast F South Haven G S Stream CliffH Welsh Way I High Cliff J S Wick Ridge K Wick L Welsh Way Ridge M N Wick Ridge - S N N Wick Ridge - N O Moory Meadow P South Stream Q Bramble R Lower Shearing Hays S New Park T Shearing Hays U Captain Kites V Wick Basin W The Basin X / 21 (see 21) Y Field 11 Z Basin-South Pond
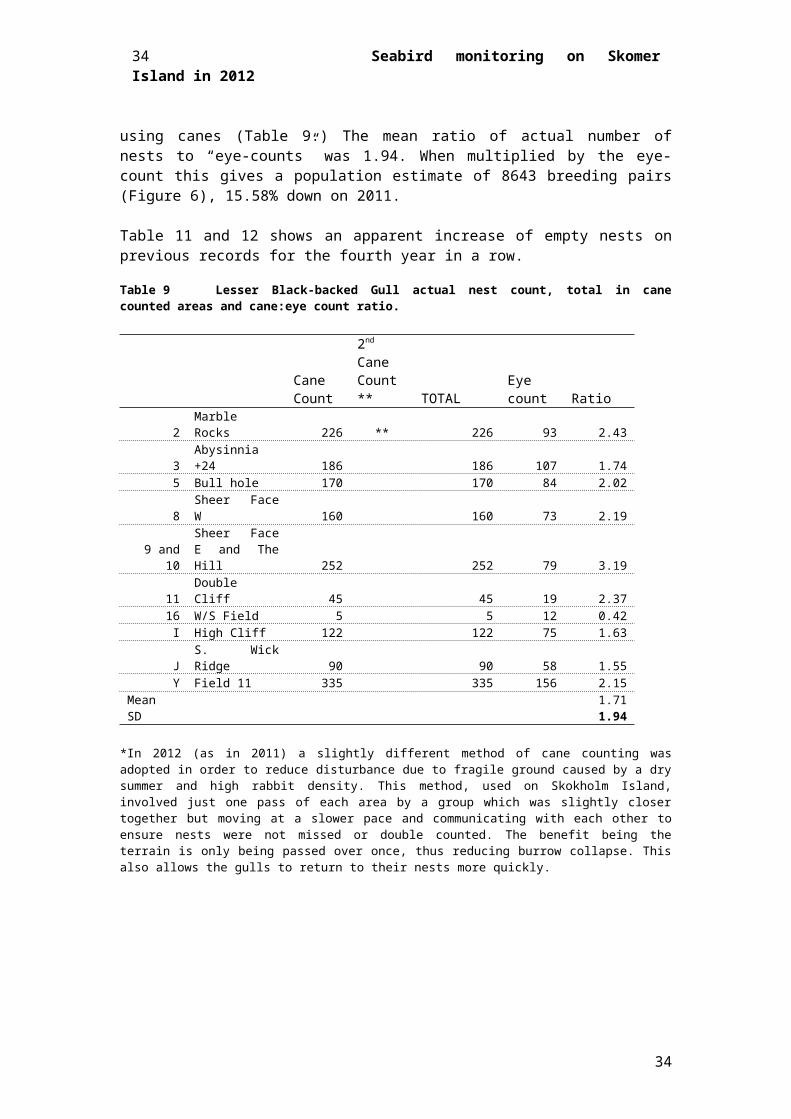
8.2 Breeding numbers – resultsA mean total of 4443 Apparently Occupied Territories (AOT) were counted by eye from various standardised viewpoints around the island (Table 10). This count is then corrected for by nest searches in a selected sample of sub-colonies.
The number of nests, including empty (but active) nests, in selected sub-colonies were systematically counted physically using canes (Table 9.) The mean ratio of actual number of nests to “eye-counts” was 1.94. When multiplied by the eye-count this gives a population estimate of 8643 breeding pairs (Figure 6), 15.58% down on 2011.
Table 11 and 12 shows an apparent increase of empty nests on previous records for the fourth year in a row.
Table 9 Lesser Black-backed Gull actual nest count, total in cane counted areas and cane:eye count ratio.
Cane Count
2nd Cane Count ** TOTAL
Eye count Ratio
2 Marble Rocks 226 ** 226 93 2.433 Abysinnia +24 186 186 107 1.745 Bull hole 170 170 84 2.028 Sheer Face W 160 160 73 2.19
9 and 10Sheer Face E and The Hill 252 252 79 3.19
11 Double Cliff 45 45 19 2.3716 W/S Field 5 5 12 0.42
I High Cliff 122 122 75 1.63J S. Wick Ridge 90 90 58 1.55
Y Field 11 335 335 156 2.15Mean 1.71SD 1.94
27
*In 2012 (as in 2011) a slightly different method of cane counting was adopted in order to reduce disturbance due to fragile ground caused by a dry summer and high rabbit density. This method, used on Skokholm Island, involved just one pass of each area by a group which was slightly closer together but moving at a slower pace and communicating with each other to ensure nests were not missed or double counted. The benefit being the terrain is only being passed over once, thus reducing burrow collapse. This also allows the gulls to return to their nests more quickly.
28 Seabird monitoring on Skomer Island in 2012
28

Seabird monitoring on Skomer Island in 2012
Table 10 Mean eye count totals of Lesser Black-backed Gull AON or S in sub colonies
20121 South Old Wall 702 Marble Rocks 933 Abyssinia + 24 1074 Anvil Rock 1205 Bull Hole 846 Pyramid Rock 547 North Plain 2908 Sheer Face W 739 Sheer Face E 7410 The Hill 511 Double Cliff 1912 North slopes 8213 N Valley Rise 25314 Green Plain 46615 S Neck - Thorn Rock 016 W/S Field 1217 Saunders Fist 018 Harold Stone 219 Wick Cliff 020 Tom's House-Sk Head 2021 colony now joined with X 12022 Garland Stone 2523 NW Neck 5024 E of W Pond – see 3 25 Toms House to Wick 2226 Mew Stone 2A Lantern 0B Neck E 99CNeck main ridge 129D South Castle 111E Neck SW coast 24F South Haven 126G S Stream Cliff 84H Welsh Way 53I High Cliff 75J S Wick Ridge 58K Wick 0L Welsh Way Ridge 83M N Wick Ridge - S 212N N Wick Ridge - N 135O Moory Meadow 95P South Stream 90Q Bramble 23R Lower Shearing Hays 195S New Park 92T Shearing Hays 68U Captain Kites 87V Wick Basin 11W The Basin 77X / 21 (see 21) Y Field 11 156Z Basin-South Pond 151Extra coastal 166TOTAL 4443
29

Figure 6 Lesser Black-backed gull breeding numbers on Skomer Island 1961-2012.
1961
1963
1965
1967
1969
1971
1973
1975
1977
1979
1981
1983
1985
1987
1989
1991
1993
1995
1997
1999
2001
2003
2005
2007
2009
2011
0
5000
10000
15000
20000
25000Eye CountEye Count X Correction Factor
Num
ber o
f AO
Ns
Table 11 Percentage of empty Lesser Black-backed Gull nests counted in May 2012
TOTALEmpty total %empty
2 Marble Rocks 226 71 31.423 Abysinnia +24 186 56 30.115 Bull hole 170 37 21.768 Sheer Face W 160 61 38.13
9 and 10Sheer Face E and The Hill 252 59 23.41
11 Double Cliff 45 22 48.8916 W/S Field 5 0 0.00
I High Cliff 122 45 36.89J S. Wick Ridge 90 34 37.78
Y Field 11 335 68 20.30Mean 28.03
Table 12 Lesser Black-backed Gull empty nest ratios 1998 - 2012
1998 1999 2000 2001 2001 2003 2004 2005 2006 2007 2008 2009 2010 2011%
Empty nests
14 20 24 16 31 36 19 19 19 28 19 10.8 22.5 25.3
2012%
Empty nests
28
30 Seabird monitoring on Skomer Island in 2012
30

Seabird monitoring on Skomer Island in 2012
8.3 Breeding successThe breeding success of Lesser Black-backed Gulls in the 2012 season was relatively good. We make an estimate of the total numbers by using a simple capture:recapture technique. To do this we ring some of the large fledglings and then count the ringed:unringed ratio when most of the chicks have fledged. Our normal target is to ring at least 300 large chicks. In a few years it has been difficult to find this number, but this year was not particularly bad and 374 were ringed. The ringed/resighting estimates based on these are shown in Table 13.
Table 14 gives the productivity. This is calculated using the figures in Table 5a together with the island count of AONs. Figures are given based on the mean, and the maximum and minimum estimates. There is a further complication in that the birds breeding on The Neck do not congregate there after fledging. Some probably disperse to the main part of the island, but others go elsewhere. Productivity figures including and excluding the number of AONs on The Neck are presented; fortunately this is only about 10% of the total AONs on Skomer. As before, the persistent low productivity, combined in many years with a low adult survival rate, should combine to show a steady decline in the breeding population.
Table 13 Estimated number of Lesser Black-backed Gull fledglings in 2012
No. RINGED FLEDGLINGS SEEN
No. UNRINGED FLEDGLINGS SEEN
TOTAL No. FLEDGLINGS SEEN
Est. No. OF FLEDGLINGS
25/07 23 191 214 348027/07 37 235 272 275029/07 27 288 315 436331/07 27 353 380 526402/08 28 293 321 4288Mean 28 272 300 4029
Estimated No. of fledglings = No. fledglings ringed (374) x Total No. fledglings seen / No. ringed fledglings seen
Table 14 Lesser Black-backed Gull productivity in 2012Est No. of fledglings
Whole Island Productivity(Total AON = 8643)
Not including The Neck(Total AON = 7840)
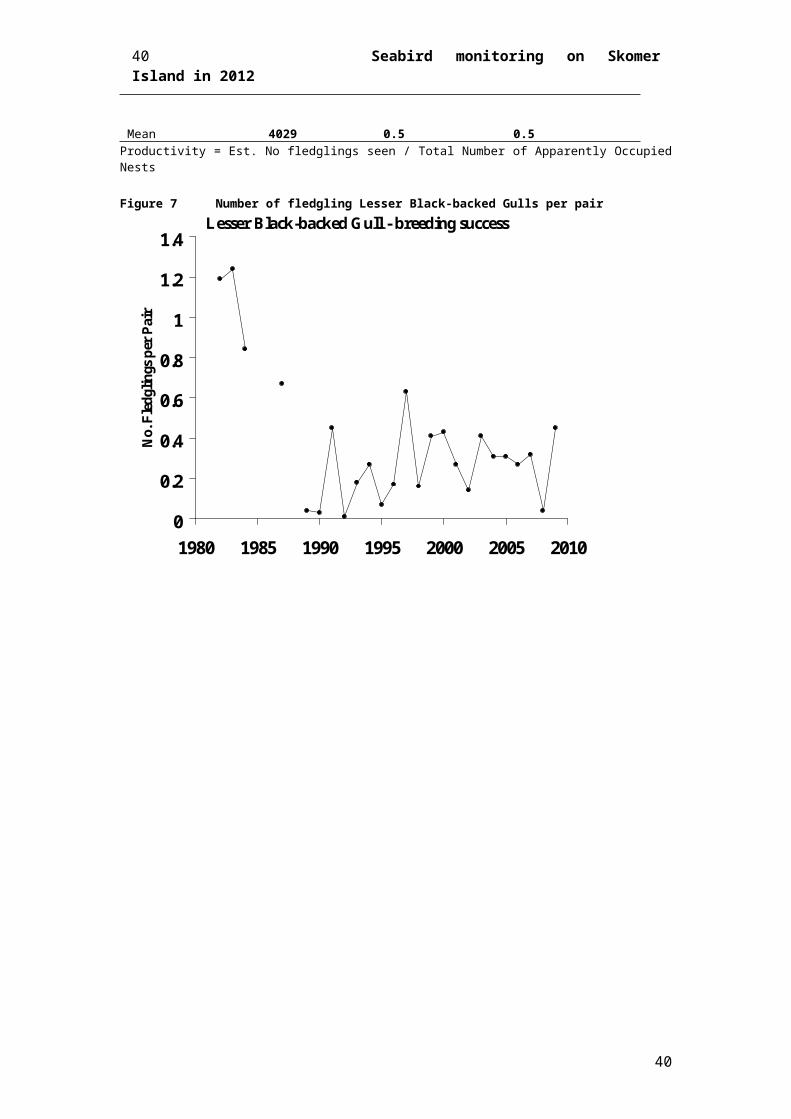
Max Productivity 5264 0.6 0.7Min. Productivity 2750 0.3 0.4Mean 4029 0.5 0.5
Productivity = Est. No fledglings seen / Total Number of Apparently Occupied Nests
31

Figure 7 Number of fledgling Lesser Black-backed Gulls per pair
0
0.2
0.4
0.6
0.8
1
1.2
1.4
1980 1985 1990 1995 2000 2005 2010
No.
Fle
dglin
gs p
er P
air
Lesser Black-backed Gull - breeding success
32 Seabird monitoring on Skomer Island in 2012
32

Seabird monitoring on Skomer Island in 2012
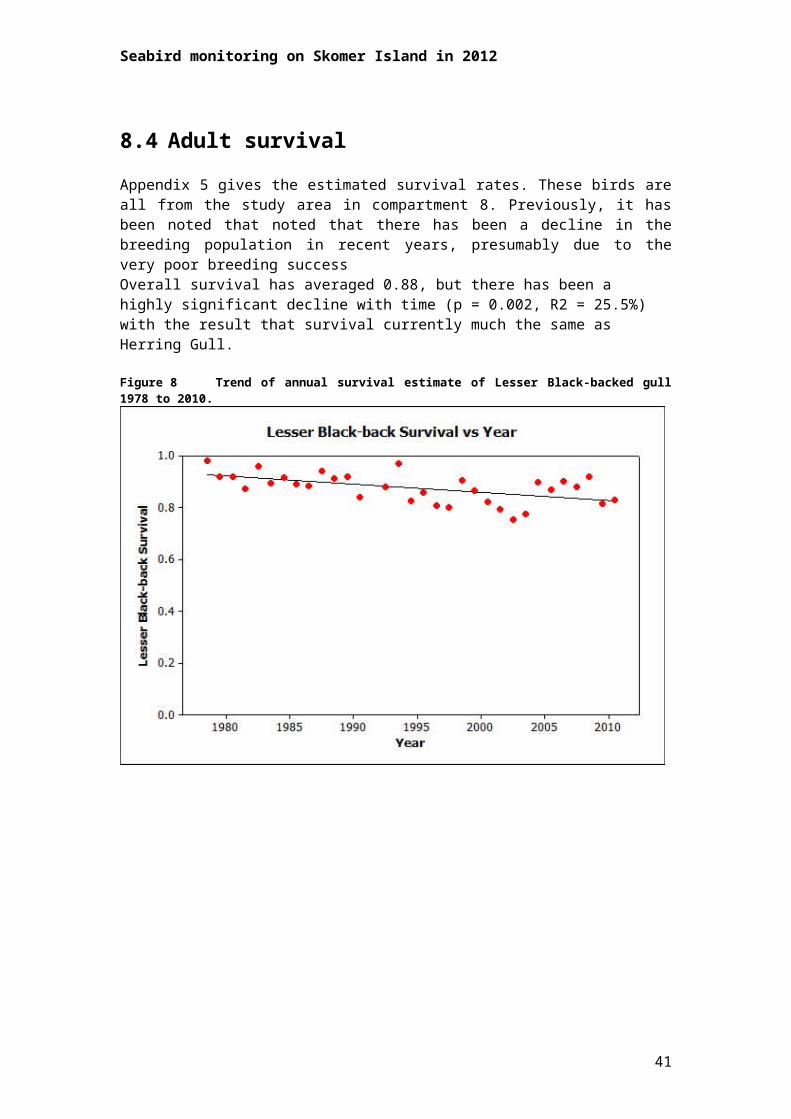
8.4 Adult survivalAppendix 5 gives the estimated survival rates. These birds are all from the study area in compartment 8. Previously, it has been noted that noted that there has been a decline in the breeding population in recent years, presumably due to the very poor breeding successOverall survival has averaged 0.88, but there has been a highly significant decline with time (p = 0.002, R2 = 25.5%) with the result that survival currently much the same as Herring Gull.
Figure 8 Trend of annual survival estimate of Lesser Black-backed gull 1978 to 2010.
33
9 Herring gull Larus argentatus9.1 Breeding numbersA total of 401 Apparently Occupied Nests were observed in 2011. This has been a similar figure for the past 10 years after a dramatic decline in the 1980s.273 of these were coastal nesting birds with the remainder nesting inland (128). This meant 68% of Herring Gulls nested on the coast.
Figure 9Herring gull: Number of AONs on Skomer Island 1961-2012.
1961
1963
1965
1967
1969
1971
1973
1975
1977
1979
1981
1983
1985
1987
1989
1991
1993
1995
1997
1999
2001
2003
2005
2007
2009
2011
0
500
1000
1500
2000
2500
3000
3500
No.
of A
ON
34 Seabird monitoring on Skomer Island in 2012
34

Seabird monitoring on Skomer Island in 2012
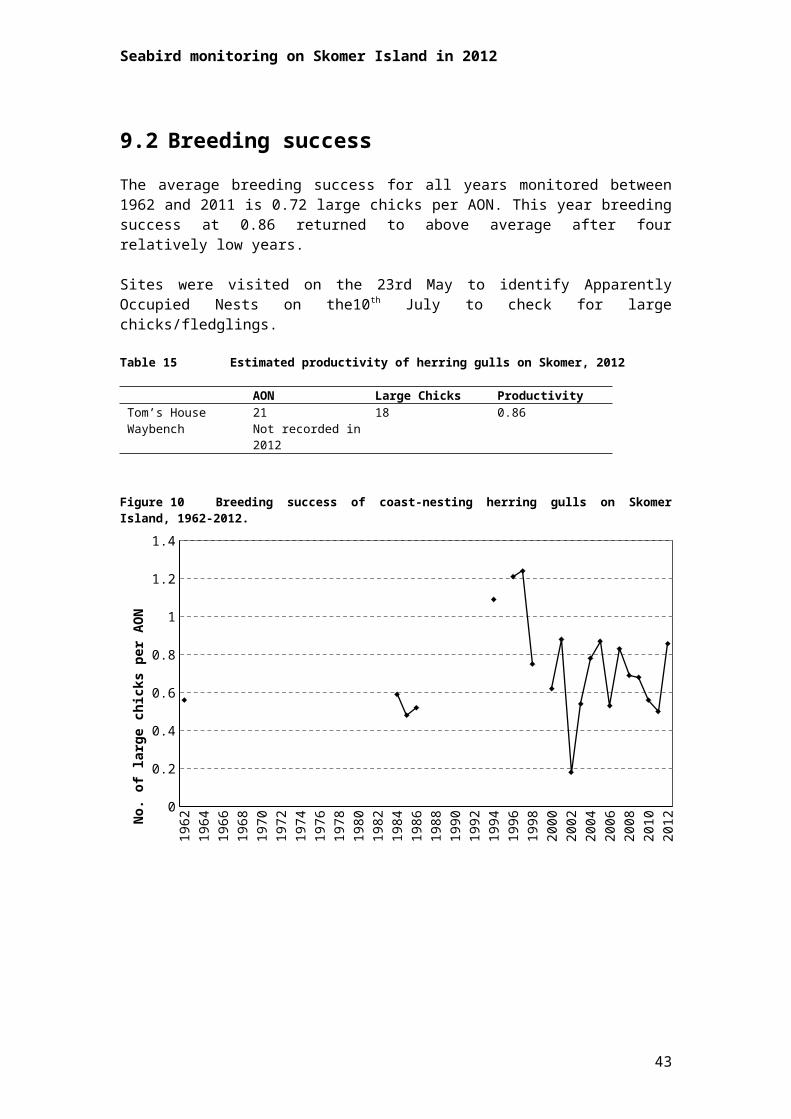
9.2 Breeding successThe average breeding success for all years monitored between 1962 and 2011 is 0.72 large chicks per AON. This year breeding success at 0.86 returned to above average after four relatively low years.
Sites were visited on the 23rd May to identify Apparently Occupied Nests on the10th July to check for large chicks/fledglings.
Table 15 Estimated productivity of herring gulls on Skomer, 2012
AON Large Chicks ProductivityTom’s House 21 18 0.86Waybench Not recorded in
2012
Figure 10 Breeding success of coast-nesting herring gulls on Skomer Island, 1962-2012.
1962
1964
1966
1968
1970
1972
1974
1976
1978
1980
1982
1984
1986
1988
1990
1992
1994
1996
1998
2000
2002
2004
2006
2008
2010
2012
0
0.2
0.4
0.6
0.8
1
1.2
1.4
No.
of l
arge
chick
s per
AO
N
35

9.3 Adult survivalAppendix 5 gives the estimated survival rates. These were originally based mainly on birds nesting along the north coast, but because the population dropped so markedly, we had to open up a second study plot in the area from the Amos to Skomer Head. The samples are still smaller than desirable.
As reported before, the figures for this species start off with more or less normal survival rates for such a gull, but after the first two years, the survival rates plummeted in 1981-1983, were almost up to what might be expected for a normal Herring Gull population in four of the five years 1984-1988.
Overall survival rate averages at 0.82, but there is no long-term trend. Survival in the last two years (2009-10 [0.69] & 2010-11[0.76]), particularly poor.
Figure 11 Trend of annual survival estimate of Herring gull 1978 to 2010
36 Seabird monitoring on Skomer Island in 2012
36

Seabird monitoring on Skomer Island in 2012
10Great black-backed gull Larus marinus
10.1 Breeding numbersIn 2012 there were 96 AONs. The breeding population of great black-backed gulls (GBBG) on Skomer appeared to increased from 2011 figures but has stayed within the same range of that for the last ten years suggesting the population may have found a natural level given competition for food (see Figure 12). This has also been matched by a slight decrease in productivity around 2006. This relatively stable level in breeding numbers doesn’t reflect the national trend which has shown a slow decline in numbers since 2002.
Figure 12 Great black-backed gull: breeding numbers on Skomer Island 1960-2012.
1960
1962
1964
1966
1968
1970
1972
1974
1976
1978
1980
1982
1984
1986
1988
1990
1992
1994
1996
1998
2000
2002
2004
2006
2008
2010
2012
0
50
100
150
200
250
300
Num
ber o
f AO
Ns
The decline (1960 – 1980) has been attributed largely to control measures in the 1960s and 1970s that were implemented as a result of the species’ perceived predatory impact on other seabirds. An outbreak of botulism in the early 1980s contributed to the decline (Sutcliffe 1997).
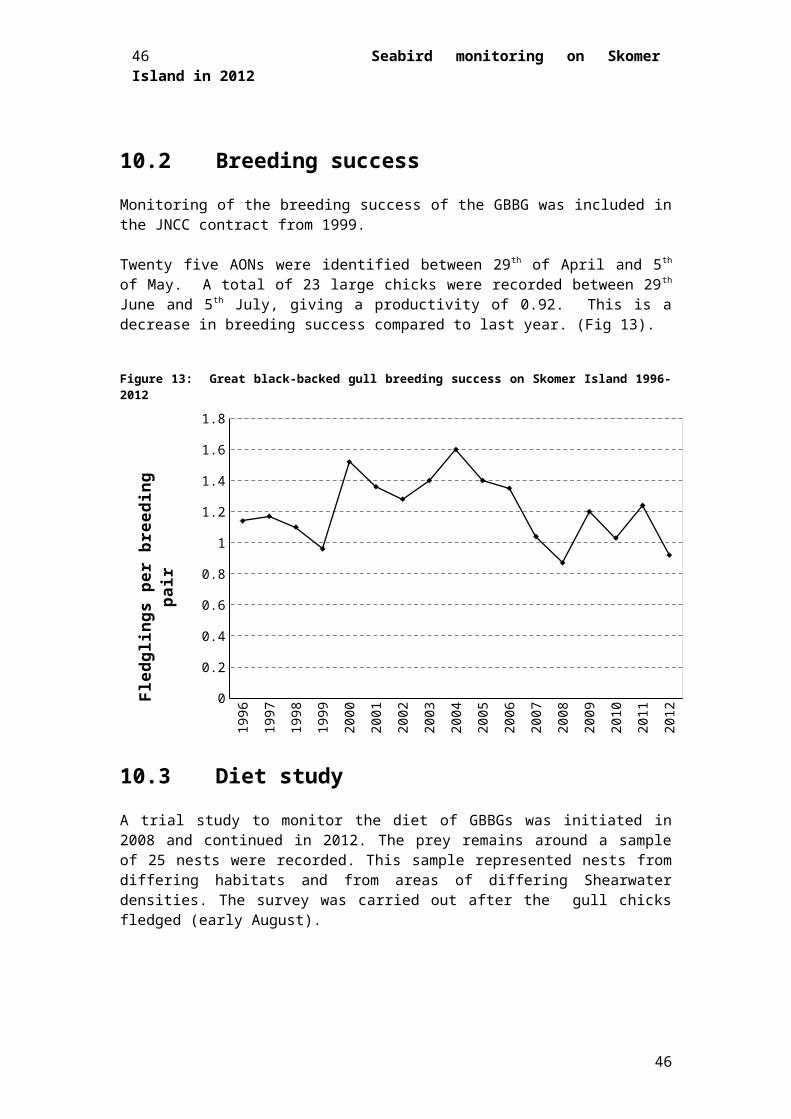
10.2 Breeding successMonitoring of the breeding success of the GBBG was included in the JNCC contract from 1999.
37

Twenty five AONs were identified between 29th of April and 5th of May. A total of 23 large chicks were recorded between 29th June and 5th July, giving a productivity of 0.92. This is a decrease in breeding success compared to last year. (Fig 13).
Figure 13: Great black-backed gull breeding success on Skomer Island 1996-2012
1996
1997
1998
1999
2000
2001
2002
2003
2004
2005
2006
2007
2008
2009
2010
2011
2012
0
0.2
0.4
0.6
0.8
1
1.2
1.4
1.6
1.8
Fled
glin
gs p
er b
reed
ing
pair
10.3 Diet studyA trial study to monitor the diet of GBBGs was initiated in 2008 and continued in 2012. The prey remains around a sample of 25 nests were recorded. This sample represented nests from differing habitats and from areas of differing Shearwater densities. The survey was carried out after the gull chicks fledged (early August).
38 Seabird monitoring on Skomer Island in 2012
38

Seabird monitoring on Skomer Island in 2012
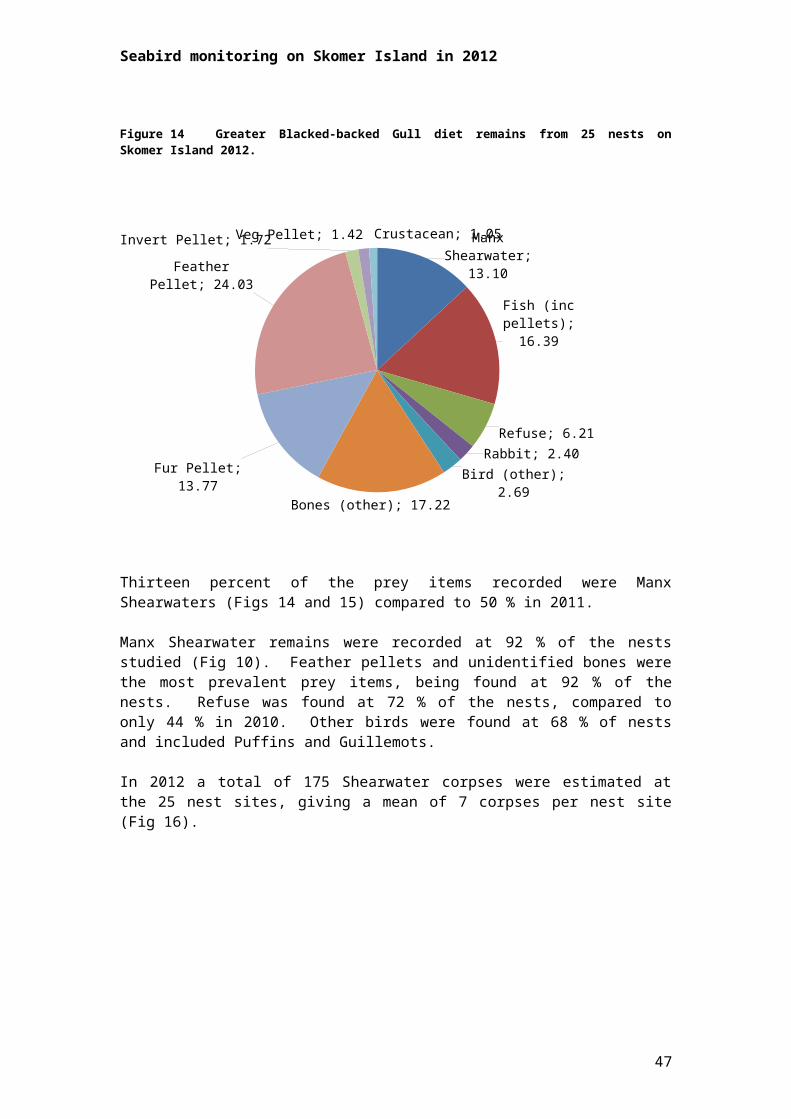
Figure 14 Greater Blacked-backed Gull diet remains from 25 nests on Skomer Island 2012.
Manx Shearwater; 13.10
Fish (inc pellets); 16.39
Refuse; 6.21
Rabbit; 2.40Bird (other); 2.69
Bones (other); 17.22
Fur Pellet; 13.77
Feather Pellet; 24.03
Invert Pellet; 1.72 Veg Pellet; 1.42 Crustacean; 1.05
Thirteen percent of the prey items recorded were Manx Shearwaters (Figs 14 and 15) compared to 50 % in 2011.
Manx Shearwater remains were recorded at 92 % of the nests studied (Fig 10). Feather pellets and unidentified bones were the most prevalent prey items, being found at 92 % of the nests. Refuse was found at 72 % of the nests, compared to only 44 % in 2010. Other birds were found at 68 % of nests and included Puffins and Guillemots.
In 2012 a total of 175 Shearwater corpses were estimated at the 25 nest sites, giving a mean of 7 corpses per nest site (Fig 16).
39
Man
x Sh
earw
ater
Fish
(inc
pel
lets
)
Refu
se
Rabb
it
Bird
(oth
er)
Bone
s (ot
her)
Fur P
elle
t
Feat
her P
elle
t
Inve
rt P
elle
t
Veg
Pelle
t
Crus
tace
an
0
10
20
30
40
50
60
70
80
90
100Fr
eqen
cy o
f occ
urre
nce
at n
est s
ite
Figure 15 Frequency of occurrence of food items around 25 great black-backed gull nests in 2012.
1959 1965 1973 1992 2008 2009 2010 2011 20120
2
4
6
8
10
No. o
f Man
x Sh
earw
ater
car
cass
es p
er
GBB
G n
est
Figure 16: Mean number of Shearwater carcasses found at Greater black-backed gull nests in 1959, 1965, 1973, 1992 and 2008 - 2012.
This year the items included in the GBBG diet survey were altered in order to increase the accuracy of recording. For example, scattered bones, feather and fur pellets were counted separately from Manx shearwaters and rabbits, to avoid including remains in these categories that may in fact have come from other species (for example, chicken bones from off-island landfill sites). Invertebrate and crustacean remains were counted separately, and a new category ‘vegetation pellet’ was added. These changes account for the apparent decline in the percentage of Manx shearwater remains found at nests (from 50 % in 2011 to 13 % in 2012) – in fact the number of shearwater carcasses (175) was similar to that found in 2011 (206).
40 Seabird monitoring on Skomer Island in 2012
40
Seabird monitoring on Skomer Island in 2012
Overall, these changes mean that comparisons of prey percentages with previous years should be treated with care.
A more intensive survey of GBBG diet was carried out this season, using quadrats to examine the amount of prey found at different distances from nest sites. This survey also provided a means of evaluating the accuracy of the current methodology. The findings of the intensive survey results, and the comparison with the results of the current survey above, can be found in Appendix 8.
41

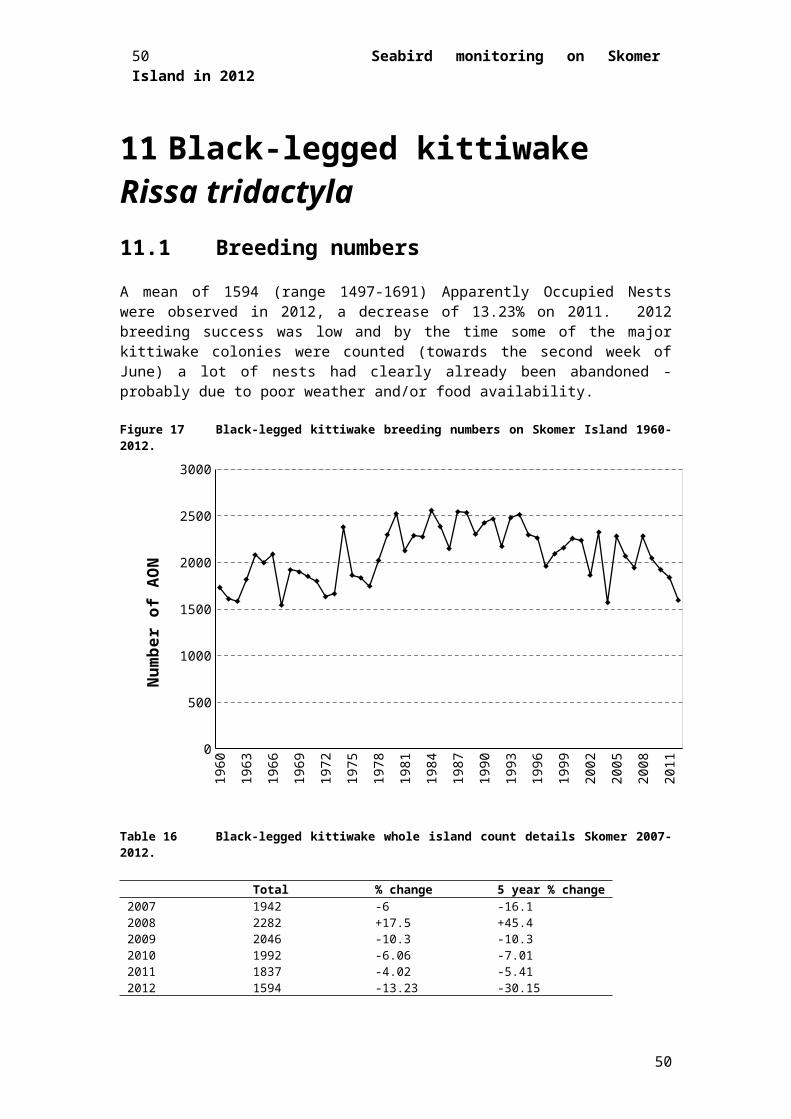
11Black-legged kittiwake Rissa tridactyla11.1 Breeding numbersA mean of 1594 (range 1497-1691) Apparently Occupied Nests were observed in 2012, a decrease of 13.23% on 2011. 2012 breeding success was low and by the time some of the major kittiwake colonies were counted (towards the second week of June) a lot of nests had clearly already been abandoned - probably due to poor weather and/or food availability.
Figure 17 Black-legged kittiwake breeding numbers on Skomer Island 1960-2012.
1960
1962
1964
1966
1968
1970
1972
1974
1976
1978
1980
1982
1984
1986
1988
1990
1992
1994
1996
1998
2000
2002
2004
2006
2008
2010
2012
0
500
1000
1500
2000
2500
3000
Num
ber o
f AO
N
Table 16 Black-legged kittiwake whole island count details Skomer 2007-2012.
Total % change 5 year % change
2007 1942 -6 -16.12008 2282 +17.5 +45.42009 2046 -10.3 -10.32010 1992 -6.06 -7.012011 1837 -4.02 -5.412012 1594 -13.23 -30.15
11.2 Breeding success11.2.1 Methods
The breeding success of 591 kittiwake AONs was monitored at the same three sub-colonies studied since 1989 (but note some areas within the sub-colonies have been dropped since
42 Seabird monitoring on Skomer Island in 2012
42
Seabird monitoring on Skomer Island in 2012
then, with new photographs taken this year) using the same methods as in previous years. Photographs of the cliffs were used and each nest marked on a transparent overlay. Visits were made to each sub-colony to monitor progress from nest construction to fledging. Five visits were made between 24th May and 30th July (see appendix 2 for details). All chicks that were large (in class ‘d’ and ‘e’ in Walsh et al 1995) on the final visit were assumed to have fledged. Two nests with smaller chicks were rechecked on the 5 th of August to ascertain if the chicks had reached size class ‘d’ or ‘e’. One of these nests contained a large chick which was assumed to have fledged. First chicks were seen on the 11 th June this year. Standard recording sheets from the Seabird Monitoring Handbook (Walsh et al 1995) were used for data collection.
11.2.2 Results
In 2012,observations on 632 nests were started in the study areas, which is a reduction of 86 nests from 2011. Study sites Wick 8 A+B contained no nests (there was one nest in these plots in 2011). There was a substantial decrease in breeding productivity compared to 2011, following the downward trend from 2010 (Table 18). Only part of this decrease could be attributed to storm damage.
The 591 AONs produced a minimum of 288 chicks. Because of the difficulty of recording small chicks in some of the plots this is likely to be an underestimate. 194 chicks survived to ‘large’ status, and were counted as fledged.
The lowest breeding success (0.29) was at the Wick sub-colony, with the highest (0.40) at South Stream, as in 2011. (Table 18).
In 2012, 89% of AONs went on to apparently incubate eggs (93% in 2011), with 41% of these producing chicks (64% in 2011). 6% of pairs did not complete nests (‘trace’ nests only) (2% in 2011).
Table 17 Black-legged kittiwake breeding success (per Apparently Occupied Nest) on Skomer Island in 2012.
Nests starte
dAON'
SIncubatin
g Pairs
Nests w/chick
s
Total chick
s
Large chicks
(fledged)
Chicks fledge
d
Breeding
SuccessS.Stream 183 167 145 71 98 67 0.40High Cliff 110 105 92 49 61 36 0.34The Wick 339 319 287 95 129 91 0.29
Total 632 591 524 215 288 194 Mean 0.32SD 0.06SE 0.03
43

Table 18 Black-legged kittiwake breeding success (per AON) on Skomer Island in 1989-2012.
Year Mean breeding success Standard Error
1989 0.70 0.041990 0.60 0.071991 0.86 0.071992 0.47 0.121993 0.65 0.081994 0.90 0.141995 0.94 0.111996 0.45 0.061997 0.68 0.061998 0.79 0.091999 0.95 0.062000 0.78 0.082001 0.21 0.082002 0.61 0.072003 0.60 0.062004 0.53 0.082005 0.47 0.082006 1.01 0.162007 0.30 0.072008 0.39 0.132009 0.55 0.092010 0.65 0.062011 0.52 0.102012 0.32 0.03Mean (SE) 0.64 0.09
Figure 18 Black-legged kittiwake breeding success on Skomer Island 1989-2012.
1989
1990
1991
1992
1993
1994
1995
1996
1997
1998
1999
2000
2001
2002
2003
2004
2005
2006
2007
2008
2009
2010
2011
2012
0.00
0.20
0.40
0.60
0.80
1.00
1.20
Chic
ks fl
edge
d pe
r AO
N
44 Seabird monitoring on Skomer Island in 2012
44

Seabird monitoring on Skomer Island in 2012
As in previous years, the relationship between breeding success and number of chicks hatched was examined (Table 19). However, the number of nests where egg numbers could be observed with certainty was small this year, due both to lower numbers of nests, and to more birds sitting tight on eggs in the poor weather, reducing views of nest contents.
Bigger broods were again more successful than smaller ones in 2012. The success rate per brood was low compared to 2011, but sample sizes this year are probably too small to make meaningful comparisons. No nests were observed with three eggs, which is unsurprising as only three nests contained three eggs in 2012.
Table 19 Black-legged kittiwake fledging success in relation to the number of chicks hatched per nest on Skomer Island 2012.
No. of chicks in nest
No. of nests
Total no. of chicks
No. chicks fledged
Success rate per nest
20121 11 11 2 0.182 11 22 4 0.363* - - - -
* No nests were observed with three eggs in 2012
11.3 Timing of breedingNest building was first seen on the 7th May. This was the same as in 2011 (see Table 20). The first egg was seen on the 20th of May with the first chick sighted on the 11th of June. There does not appear to be any major change in the timing of breeding over the last 7 years.
Table 20 Black-legged kittiwake - timing of breeding on Skomer Island 2007 - 2012.
2007 2008 2009 2010 2011 2012
Nest building start 7th May 8th May 30th April 30th April 7th May 7th MayFirst egg 19th May 24th May 11th May 21st May 13th May 20th MayFirst chick 16th June 20th June 11th June 8th June 10th June 11th June
45
11.4 Adult survivalAppendix 5 gives the estimated survival rates of Kittiwakes. These are based on colour-ringed birds at two sites, Tom's House and South Cliff.
Survival averages 0.84. Slight but not nearly significant, decline with time. Unusually low 2006-2007 (see Razorbill), but high in last two years (2009-10 & 2010-11)
Figure 19 Trend of annual survival estimate of Black-legged kittiwake from 1978 up to and including survival in 2010.
46 Seabird monitoring on Skomer Island in 2012
46
Seabird monitoring on Skomer Island in 2012
12Common guillemot Uria aalge12.1 Breeding numbers - whole island counts
The whole-island population of common guillemots in 2012 increased at by 3.75% to 22508 (Range 21547-23453) (Table 21, Figure 20).
Table 21 Common guillemot whole island counts on Skomer Island, 2004-2012.
Land count
% change Sea count % change Total count
% change 5-year% change
2008 11579 -23.6 5509 +56.5 17088 -2.60 +20.452009 14339 +23.8 5173 -6.10 19512 +14.19 -1.012010 15643 +9.09 4319 -16.51 19962 +2.31 +17.582011 15064 -3.70 6624 +53.37 21688 +8.65 +23.622012 16557 +3.78 5951 -10.17 22508 3.78 +31.72
The dramatic changes in the percentages of birds counted by land and from sea are due to methodological changes to counts on the north west coast. Up until 2008 Bull Hole to Garland Stone was counted from Payne’s Rock. Over the past few years these have been counted by sea.
12.2 Breeding numbers - study plot countsThe study plots are thought to be representative of the whole colony (Wilson 1992) and may reflect any population change more accurately than the whole island counts, as repeated counts take account of variations in attendance that are thought to occur within colonies. For details of counts refer to Appendix 3.
There was a significant increase in the number of birds attending the study plots in 2012 compared to 2011 matching a continued trend over the last 5 years both within the study plot and the whole island counts.
47
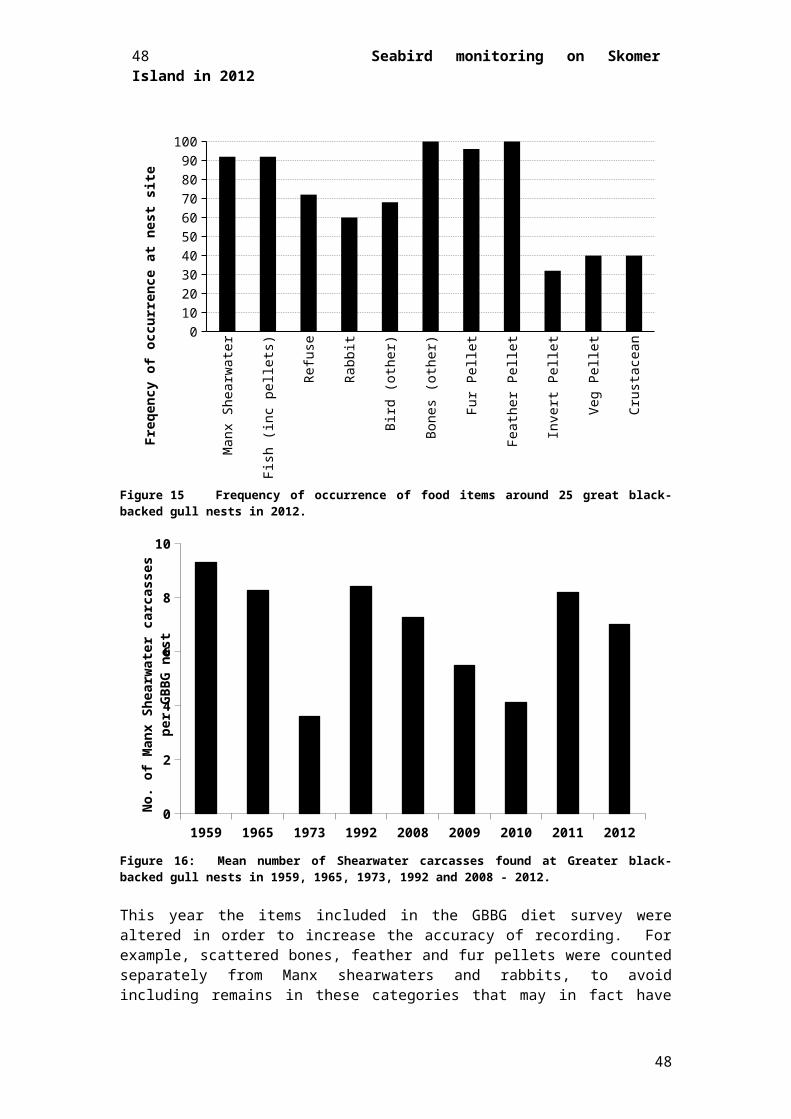
Table 22 Common guillemot study plot totals on Skomer Island 2008-2012.
Year Mean SD SE Signif %change 5yr %changeBull Hole 2008 2922.0 180.0 56.9 NS -0.6 +26.1
2009 3503.1 126.4 40.0 * * +19.9 +27.7 2010 3493.9 287.2 90.8 NS -0.26 +23.7 2011 3569.1 348.1 110.1 NS +2.2 +21.4 2012 4201.29 214.14 80.94 ** +17.7 +43.8
High Cliff 2008 1510.0 81.0 25.6 NS -0.98 +11.6 2009 2057.8 105.3 33.3 * * +36.3 +37.4
2010 2024.1 158.6 50.2 NS -1.6 +34.8 2011 2006.5 124.1 39.2 NS -0.9 +31.6 2012 1801.71 346.55 130.98 * -10.2 +19.3
S.Stream 2008 646.0 59.3 18.7 NS -4.2 +10.6 2009 897.4 70.7 22.4 * * +38.9 +36.7
2010 882.4 98.3 31.1 NS -1.7 +23.7 2011 804.1 47.3 15.0 * -8.8 +19.3 2012 908.14 100.58 38.02 * +12.9 +40.6
All 2008 5078.0 299.4 94.7 NS -1.2 +19.4 2009 6458.3 282.3 89.3 * * +27.2 +31.9
2010 6400.4 446.2 141.1 NS -0.9 +27.5 2011 6360.5 419.2 148.2 NS -0.62 +23.7 2012 6911.14 416.54 157.44 * +8.66 +36.1
Note: Significance between years in Table 16 established using the t-test for comparing the means of two small samples (two-tailed test, df=17). N.S.Not significant, *Statistically significant (P<0.05), **Statistically highly significant (P<0.01).
48 Seabird monitoring on Skomer Island in 2012
48
Seabird monitoring on Skomer Island in 2012
Figure 20 Common guillemot breeding numbers on Skomer Island 1963-2012.
1963
1965
1967
1969
1971
1973
1975
1977
1979
1981
1983
1985
1987
1989
1991
1993
1995
1997
1999
2001
2003
2005
2007
2009
2011
0
5000
10000
15000
20000
25000Whole Island CountStudy plot count
No.
of i
ndiv
idua
ls
12.3 Breeding success
12.3.1 Methods
The number of active and regularly occupied sites was established at study plots and their histories were followed, using the methodology outlined in Walsh et al. (1995). Sites were visited every one to two days. The first recording visit was made on 26 th April, and the last on the 18th July. All sites were visited with a similar frequency of between 46 and 52 visits during the season.
12.3.2 Results
2012 saw a mean productivity of 0.63 fledged birds per active and regularly occupied site, which is an increase of 0.08 from 2011 (Table 24 and 25, Fig 21), and is slightly lower than the overall mean of 0.69 (1989 – 2012). Three hundred and eighteen active and regular sites were recorded this year, 26 more than last year. However, only 89% of these sites were active, which leads to a relatively higher productivity quota for active sites only of 0.70.
Fifty eight percent of chicks ‘fledged’ between 25 th June and 30th June inclusive. The median fledge date was 27th June, 1 day earlier than in 2011.
Table 23 Common guillemot breeding success (per active and regular sites) on Skomer Island 1989-2012.
Year No. Sites Large ChicksMean Productivity
across sites SE1989 120 96 0.8 0.051990 112 80 0.69 0.051991 117 89 0.76 0.051992 169 121 0.72 0.04
49
1993 198 141 0.72 0.051994 187 131 0.72 0.031995 198 151 0.75 0.041996 210 161 0.77 0.021997 226 174 0.77 0.331998 201 154 0.77 0.041999 242 147 0.65 0.052000 227 143 0.65 0.082001 259 160 0.65 0.082002 259 170 0.68 0.032003 268 179 0.71 0.052004 292 184 0.63 0.012005 297 200 0.7 0.032006 287 142 0.47 0.072007 258 164 0.63 0.022008 269 164 0.62 0.062009 254 185 0.73 0.052010 315 211 0.69 0.042011 292 149 0.55 0.062012 318 185 0.63 0.08
Mean (1989-2012) 0.69 0.06
Table 24 Guillemot breeding success (per active site and per active and regular site) on Skomer Island 2012.
No. active + regular sites No. active sites
Large chicks
Productivity (a+r)
Productivity (a only)
Wick 1G 62 57 42 0.68 0.74Wick 2G 95 92 43 0.45 0.47
Wick Corner 125 100 70 0.56 0.70Bull Hole 36 34 30 0.83 0.88
Mean 0.63 0.70SD 0.16 0.17SE 0.08 0.09
50 Seabird monitoring on Skomer Island in 2012
50

Seabird monitoring on Skomer Island in 2012
Figure 21 Common guillemot breeding success on Skomer Island 1989-2012.
1989
1990
1991
1992
1993
1994
1995
1996
1997
1998
1999
2000
2001
2002
2003
2004
2005
2006
2007
2008
2009
2010
2011
2012
0
0.1
0.2
0.3
0.4
0.5
0.6
0.7
0.8
0.9Fl
edgl
ings
per
acti
ve a
nd re
gula
r nes
t sit
e
12.4 Timing of breedingThe first egg was noted on 23st April at the Amos (2 days later than in 2011), the first chicks on the 26th of May and the first ‘jumpling’ on the 18 th of June at Bull Hole (3 days later than in 2011). The last ‘jumpers’ were 18th July, compared to 13th-16th July in 2011.
Table 25 Common guillemot timing of breeding 2007-2012.
2007 2008 2009 2010 2011 2012First egg 5th May 11th May 25th April 29th April 21st April 23rd AprilFirst chick 8th June 14th June 26th May 31st May 26th May 27th MayFirst ‘jumpling’ 30th June 25th June 11th June 23rd June 15th June 18th June
12.5 Adult and juvenile survivalThis and other common guillemot studies were undertaken by University of Sheffield in 2011. This report is attached in Appendix 7.
51

13Razorbill Alca torda13.1 Breeding numbers - whole island countsDue to difficulties in censusing the species (being less concentrated than common guillemots and often breeding in hidden sites amongst boulders and in burrows), the pattern of razorbill numbers on Skomer has at times been fairly erratic (Figure 22). In 2012 the total count mean was 4971 (Range 4852 – 5090) (Table 26). As with guillemot changes in percentages of land and sea are directly related the change in wardens. Low population count (as with kittiwake) is probably due to low productivity relating to high nest site abandonment by the time of counting.
Table 26 Razorbill whole island count details on Skomer Island, 2006-2012
Land count
% change Sea count % change Total count
% change % 5-yr change
2006 2955 -22.5 1606 -17.6 4561 -20.8 -10.52007 3588 +21.4 1259 -21.6 4847 +6.3 +14.32008 2336 - 34.9 2637 + 109.5 4973 + 2.6 + 2.62009 2970 +27.1 2292 -13.1 5262 +5.8 - 8.62010 2835 -4.55 2556 +11.6 5391 +2.5 +18.22011 2141 -24.48 2977 16.47 5118 -5.06 5.592012 2428 13.40 2543 -14.58 4971 -2.87 -0.04
13.2 Breeding numbers - study plot counts
The Razorbill study plot counts are not thought to be as representative of the whole island population as those of Guillemots (Wilson 1992) although changes in the plot counts between years is still useful information.
There were no significant changes at any of the study plots in comparison to 2011. Overall, numbers in study plots decreased by 11.4 % and were significantly different from those in 2011 (Table 27).
52 Seabird monitoring on Skomer Island in 2012
52

Seabird monitoring on Skomer Island in 2012
Table 27 Razorbill study plot totals on Skomer Island 2008 -2012.
Study plot Year Mean S.D. S.E. Significance
% change
5-year change
Bull Hole 2008 307.2 46.9 14.8 NS -3.8 +35.82009 390.1 32.8 10.4 * * +27.0 +34.62010 432.5 88.0 27.8 NS +10.9 +87.32011 304.3 45.4 14.3 * -29.7 -4.712012 316.6 77.8 29.4 NS +4 +3
High Cliff 2008 276.2 47.1 14.9 NS +9.8 +8.70
2009 393.4 67.2 21.3 * * +42.4 +31.02010 380.2 63.4 20.0 NS -3.4 +102.82011 292.1 54.8 17.3 * -23.2 16.12012 309.9 68 25.7 NS +6 +12.2
South Stream 2008 73.8 13.9 4.4 NS -21.5 -17.2
2009 97.4 17.8 5.6 * * +32.0 -15.82010 111.4 26.3 8.3 NS +14.4 +23.82011 72.0 24.7 7.8 NS -35.4 -23.42012 78 46.7 17.6 NS +8.3 +5.7
The Wick 2008 727.8 35.8 11.3 NS +35.8 +29.6
2009 739.6 39.6 12.5 NS +1.6 +40.52010 723.8 33.1 10.5 NS -2.1 +40.52011 718.0 19.8 6.3 NS -0.8 +33.92012 568 29.9 11.3 ** -20.9 -21.9
All plots 2008 1385.0 68.2 21.6 NS +15.4 +22.4
2009 1620.5 105.21 33.27 * * +17.0 +31.52010 1647.9 184.7 58.4 NS +1.7 +61.02011 1386 102 36 * -15.9 15.42012 1227.4286 168 63.5 * -11.4 -11.4
Note: Significance between years established using the t-test for comparing the means of two small samples (two-tailed test, df=16). N S Not significant, * Statistically significant (P<0.05), * * Statistically highly significant (P<0.01). See Appendix 9 for count details.
53

Figure 22 Razorbill breeding numbers on Skomer Island 1963-2012
1963
1965
1967
1969
1971
1973
1975
1977
1979
1981
1983
1985
1987
1989
1991
1993
1995
1997
1999
2001
2003
2005
2007
2009
2011
0
1000
2000
3000
4000
5000
6000
7000
Whole Island Count
Study plot count
No.
of i
ndiv
idua
l
13.3 Breeding successSites were visited were every one to two days. The date of the first visit was on 23 rd April, with the last visit on 8th July. All sites were visited at similar frequency between 34 and 51 times.
Productivity was given as the number of fledged or apparently fledged chicks (last seen at 15 or more days old) per active and regularly occupied site and per active only site (as defined by Walsh et al. 1995). Results are presented in Table 29, 30 and Figure 23. The mean productivity per active and regular site was 0.17 (0.21 per active only site), a large decrease from the 2010 productivity figures (Table 29).
The least productive site was Wick 3A (0.08), with the most productive High Cliff (0.27) (Table 30).
34 % of chicks ‘fledged’ between 20th of June and 25th of June inclusive. The median fledge date was 5 days earlier than 2010.
54 Seabird monitoring on Skomer Island in 2012
54

Seabird monitoring on Skomer Island in 2012
Table 28 Razorbill breeding success on Skomer Island 1993-2012Productivity peractive site
Productivity per active + regular site
1993 - 0.561994 - 0.551995 0.79 0.721996 0.71 0.641997 0.73 0.751998 0.71 0.661999 0.74 0.562000 0.54 0.482001 0.64 0.582002 0.37 0.362003 0.61 0.482004 0.56 0.52005 0.64 0.572006 0.33 0.32007 0.62 0.562008 0.32 0.222009 0.47 0.392010 0.51 0.402011*
- -
2012 0.21 0.17Mean 0.62 0.55
*As part of a study into Guillemot monitoring on Skomer Island the 2011 productivity of Razorbills was omitted
Table 29 Razorbill breeding success (per active site and per active and regular site) on Skomer Island 2012.
No. active + regular sites No. active sites
Large chicks
Productivity (a+r)
Productivity (a only)
High Cliff 118 103 32 0.27 0.31Wick 1A 51 36 8 0.16 0.22Wick 3A 77 60 6 0.08 0.10Wick 3B 35 32 6 0.17 0.19Bull Hole 76 63 14 0.18 0.22
Mean 0.17 0.21SD 0.08 0.09SE 0.04 0.04
55

Figure 23 Razorbill breeding success on Skomer Island 1993-2012.
1993
1994
1995
1996
1997
1998
1999
2000
2001
2002
2003
2004
2005
2006
2007
2008
2009
2010
2011
2012
0
0.1
0.2
0.3
0.4
0.5
0.6
0.7
0.8Fl
edgl
ings
per
acti
ve a
nd re
gula
r nes
t sit
e
13.4 Timing of breedingThe first egg was noted at the Amos on 23th April (two days earlier than in 2011 ), the first chick was seen on 27th May at the Basin and the first ‘jumplings’ on 13st of June at High Cliff (8 days later than 2009).
Table 30 Razorbill timing of breeding 2007 – 2012.
2007 2008 2009 2010 2011 2012First egg 1st May 6th May 26th April 24th April 22nd April 23rd April
First chick 2nd June 5th June 24th May 3rd June 18th May 27th MayFirst
‘jumpling’23rd June 28th June 13th June 21st June 17th June 13th June
56 Seabird monitoring on Skomer Island in 2012
56

Seabird monitoring on Skomer Island in 2012
13.5 Adult survivalAppendix 5 gives the estimated survival rates of Razorbill. The main point to make about these data is the one made in previous reports, namely that they indicate that the survival rates, averaged over several years, for this species were higher in the early 1970s than they have been since. However, there is no significant long term trend and there are no unusual figures in the last few years.(see figure 24)
Razorbills are very difficult to census accurately and the changes in the numbers recorded do not match the variations in survival rates.
Figure 24 Trend of adult survival of Razorbill up to and including survival from 1979 to 2010
57
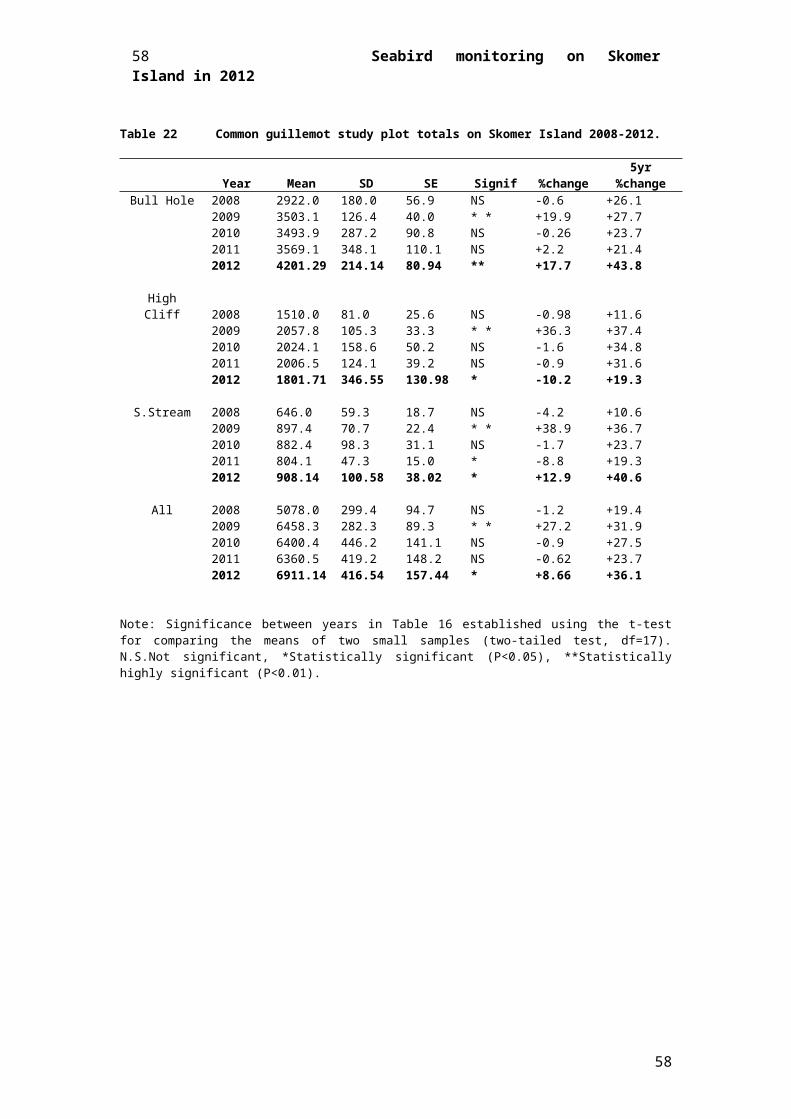
14Atlantic puffin Fratercula arctica14.1 Breeding numbersWhole island puffin counts were successfully completed in 2012. Numbers were lower than previous census in 2010 but on remaining fairly high (Table 31 and Figure 25).
Table 31 Maximum spring counts of Atlantic puffin on Skomer Island and Middleholm 1989-2012.
Year No. individual puffins %change 5 year % change2004 10688 +25.2 +0.72005 10717 +0.3 +36.52006 10876 +1.5 +5.52007 11821 +8.7 +38.52008 10487 -11.3 -1.92009 13508 +28.8 +26.02010 12577 -6.89 +15.642011* - - -2012 11497 -8.59 +9.63
* 2011 – No puffin count was possible due to timings/weather/availability of counters.
Figure 25 Maximum spring counts of Atlantic puffin on Skomer Island 1989-2012.
1988
1989
1990
1991
1992
1993
1994
1995
1996
1997
1998
1999
2000
2001
2002
2003
2004
2005
2006
2007
2008
2009
2010
2011
2012
0
2000
4000
6000
8000
10000
12000
14000
16000
Num
ber o
f ind
ivid
uals
58 Seabird monitoring on Skomer Island in 2012
58

Seabird monitoring on Skomer Island in 2012
14.2 Burrow occupancy and breeding successPuffin burrow occupancy and breeding success in the South East Isthmus study plot for 2012 is shown in the table below.
Table 32 Burrow occupancy and breeding productivity of Puffins on Skomer 2012
Burrow distance from the cliff edge (m)
Total No. burrows
No. occupied burrows
% Occupied
No. of chicks based on 2 (3+) feeds
Max. Productivity
< 5 97 73 75% 64 (55) 0.88 (0.75)5-10 64 48 75% 41 (37) 0.85 (0.77)>10 60 32 53% 24 (19) 0.75 (0.59)Total 221 152 69% 129 (111) 0.85 (0.73)
Burrow occupancy was established over eight evening watches, from 1830 to dusk, between the 13th April and 14th May. This is the earliest that the watches to establish burrow occupancy have been carried out. However, with hindsight, this was later than it should have been. Observations on parents bringing in fish showed that the first eggs must have been laid at the end of the first week of April and so many birds would have already been incubating by the time that these watches were commenced.
Breeding success was based on the number of burrows to which adults brought food in to during two 24 hour watches.
The first watch was carried out from 04:30-22:00 on 18 th June. The first adults were seen coming in with fish on 17th May so this watch should have been before any birds had fledged, given a minimum fledging age of 35 days. The first chicks caught ready to fledge were found on 22nd June, giving a rough potential fledging period of 36 days.
The second watch was carried out from 12:00-22:00 on 30 June and 04:30-12:00 on 1 st July. This was after some chicks would have fledged but nevertheless two birds were still found incubating in the study area after the watch had finished.
If fish were brought to a burrow in the first watch and not the second, the pair has still been assumed to have been successful and the chick fledged between watches. If fish were brought in to a burrow in the second watch but not the first the chick is also assumed to have been successful. If no fish was brought in to a burrow during either watch the burrow is assumed to have failed, even though there is a slight chance the egg could have hatched and the chick still successfully in mid August.
Overall, with an 85% success rate Puffins on Skomer had another excellent breeding season in 2012.
Recommendation. The timing of these observations needs to be reconsidered. There is good evidence that the birds are now breeding earlier than they used to be. Hence, the observations should be started earlier. Further, with large spread of laying dates it might be worth considering doing more feeding watches in the future to get a more accurate assessment of productivity. If feeding watches were carried out every two weeks from the first adult seen coming in with fish then chicks would have to be fed during two watches to be considered successful. Early chicks would be fed during the first and second watch, later chicks during the second and third watch and any really late chicks during the third and fourth watches.
59

14.3 Feeding ratesTable 33 Feeding rates of Puffins in 2012.
18 June1 30 June/1 July2
Total No. burrows to which feeds were recorded 127 118Total No. recorded feeds 409 382Mean No. feeds per burrow (range) 3.2 (1-9) 3.2 (1-15)
1 Includes thirteen single feeds to burrows considered unoccupied or unsuccessful2 Includes seven single feeds to burrows considered unoccupied or unsuccessful
Figure 26 Feeding rates of Puffins in relation to time of day (Vertical axis = number of feeds)
04:30-05:00
05:00-06:00
06:00-07:00
07:00-08:00
08:00-09:00
09:00-10:00
10:00-11:00
11:00-12:00
12:00-13:00
13:00-14:00
14:00-15:00
15:00-16:00
16:00-17:00
17:00-18:00
18:00-19:00
19:00-20:00
20:00-21:00
21:00-22:000
10
20
30
40
50
60
18-Jun30-Jun/1-Jul
60 Seabird monitoring on Skomer Island in 2012
60

Seabird monitoring on Skomer Island in 2012
14.4 Adult survivalAppendix 5 gives the estimated survival rates of Puffins. As with Razorbills survival rates for the last few years show no unusual patterns. Average survival remains at 0.90, but there is an almost significant decline with time (p = 0.063, R2 = 7.0%). Survival poor 2010-11, but good in the two years prior to that (2008-09 & 2009-2010).
Figure 27 Trend of annual survival estimate of Atlantic puffin 1972 up to and including survival from 2010.
61

16ReferencesAshton, H (1993) The Breeding Population of the British Storm Petrel Hydrobatespelagicus on Skomer Island, Dyfed. Report to the Dyfed Wildlife Trust.
Birkhead, TR (2003) Skomer guillemot studies 1999-2001. Department of Animal and Plant Sciences, The University of Sheffield. CCW Contract Science Report 532.
Birkhead, TR and Hatchwell,BJ (2000) Skomer Island Razorbill Study 2000. Department of Animal & Plant Sciences, University of Sheffield.
Birkhead, TR and Hatchwell,BJ (2001) Skomer Island Razorbill Study 2001. Department of Animal & Plant Sciences, University of Sheffield.
Birkhead, TR, Hatchwell,BJ and Bowgen, K. (2010) Skomer Island Guillemot Study 2010. Department of Animal & Plant Sciences, University of Sheffield.
Boulinier, T and Danchin, E (1996) Population trends in Kittiwake Rissatridactyla colonies in relation to tick infestation. Ibis 138:326-334.
Cramp, S and Simmons, KEL (eds) (1983) Handbook of the birds of Europe, the Middle East and North Africa: the birds of the Western Palearctic. Volume III. Waders to gulls. Oxford University Press, Oxford.
Field, RH, Birkhead, TR &Hatchwell, BJ (1999) Skomer Island razorbill study 1999. Department of Animal and Plant Sciences, The University of Sheffield.
James, PC (1984a) The vocal and homing behaviour of the Manx shearwater Puffinuspuffinus with additional studies on other Procellariformes. Appendix B. PhD thesis, Oxford University.
James, PC (1984b) Sexual dimorphism in the voice of the British Storm Petrel Hydrobatespelagicus. Ibis, 126, 89-92.
Poole, J and Sutcliffe, SJ (1992) Seabird studies on Skomer Island in 1992. JNCC Report No. 139.
Poole, J & Sutcliffe, SJ (1993) Monitoring of seabirds on Skomer Island in 1993. Report to JNCC by DWT.
Poole, J, Smith, S, Perrins, CM, Birkhead, TR and Thompson, KR (2001) Seabird monitoring on Skomer Island in 1997 and 1998. JNCC Report, No.318.
Sutcliffe, SJ (1993) Population trends of the Larusgulls breeding on Skomer Island NNR 1960-92. Report by Dyfed Wildlife Trust for CCW.
62 Seabird monitoring on Skomer Island in 2012
62

Seabird monitoring on Skomer Island in 2012
Sutcliffe, SJ (1997) Populations of breeding Larus gulls on Welsh islands. In Rhind, PM, Blackstock, TH and Parr, SJ (eds.) Welsh islands: ecology, conservation and land use. CCW.
Walsh, PM, Halley, DJ, Harris, MP, del Nevo, A, Sim, IMW, Tasker, ML (1995) Seabird monitoring handbook for Britain and Ireland. Peterborough, JNCC, RSPB, ITE, Seabird Group.
Wilson, SA (1992) Population trends of guillemots Uria aalge and razorbills Alcatorda on Skomer Island, Wales 1963-1991. Report to CCW by Sheffield University.
63

17AppendicesAppendix 1 Mean seabird counts by section
Counted from Sea or Land?
Fulmar - AOS Kittiwake - AON Guillemot - IND Razorbill - IND
1 Sea 21 0 363 2592 Sea 0 0 320 843 Sea 0 100 348 974 Sea 20 8 227 355 Sea 14 30 854 1356 Sea 12 0 0 187 Sea 0 0 24 348 Land and sea 21 0 169 869 Land 19 0 38 4810 Sea 0 0 0 811 Sea 31 0 199 23612 Land 29 0 0 1413 Land 0 0 0 3614 Land 4 276 911 7815 Sea 0 4 0 1516 Land 37 108 1801 30917 Sea 0 0 0 2418 Sea 0 0 0 019 Sea 0 0 269 21320 Sea 0 0 0 3621 Land 0 0 0 4222 Land 66 676 4561 56823 Land 0 0 0 024 Sea 0 0 12 4125 Sea 0 0 0 2226 Land 32 1 330 23527 Land 0 127 2780 13328 Land 0 0 0 3229 Sea 0 0 0 030 Land 0 0 230 7131 Land 0 2 258 1932 Land 0 0 142 7033 Land 0 18 411 15534 Land 0 11 690 21635 Sea 0 0 310 18436 Sea 3 0 366 7537 Land 10 91 4236 31638 Sea 0 142 554 8539 Sea 36 0 720 21140 Sea 2 0 555 12441 Sea 11 0 86 5242 Sea 54 0 200 13443 Sea 27 0 139 11544 Sea 4 0 392 23845 Sea 0 0 13 68TOTAL 453 1594 22508 4971
64 Seabird monitoring on Skomer Island in 2012
64

Seabird monitoring on Skomer Island in 2012
Appendix 2 Dates of visits to Black legged kittiwake sub-colonies 2012.1st visit 23-27 May to identify nests sites2nd visit 09-11 June to record incubating birds / new sites3rd visit 21-23 June to record incubating birds / small chicks4th visit 07-09 July to record large chicks / site attendance5th visit 19-20 July to record fledgers / site attendance6th visit 22 Jul-27 July to record fledgers / site attendance
65
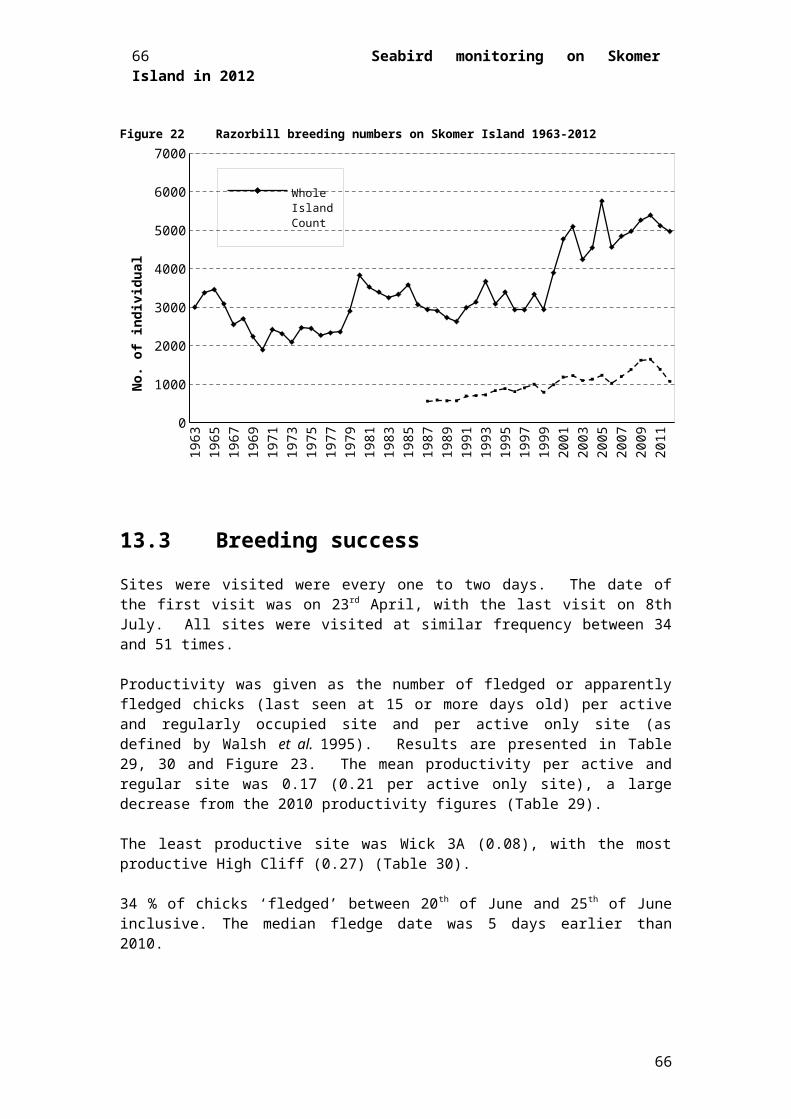
Appendix 3 Guillemot and Razorbill Study Plots
Common guillemot study plot totals in 2012 (no. individuals)
South Stream High Cliff Bull Hole All Plots02-Jun - 890 1316 3990 619604-Jun - 1070 2040 4001 711109-Jun - 930 2120 4299 734910-Jun - 859 1890 4497 724611-Jun - 780 1330 4434 654414-Jun - 828 1804 4184 681617-Jun - 1000 2112 4004 7116- - - - - -- - - - - -- - - - - -
Mean 908.14 1801.71 4201.29 6911.14SD 100.58 346.55 214.14 416.54SE 38.02 130.98 80.94 157.44
Razorbill study plot totals in 2012 (no. individuals)
* South Stream High Cliff Bull Hole Wick All Plots02-Jun - 61 247 215 588 111104-Jun - 59 284 298 602 124309-Jun - 180 440 302 522 144410-Jun - 76 240 344 542 120211-Jun - 38 344 470 550 140214-Jun - 74 299 287 581 124117-Jun - 58 315 300 591 949- - - - - - -- - - - - - -- - - - - - -
Mean 78.00 309.86 316.57 568.00 1227.43SD 46.68 68.00 77.80 29.92 168.09SE 17.64 25.70 29.41 11.31 63.53
* Weather observations are on original field sheets stored on the island. (write up done in winter period on mainland)
66 Seabird monitoring on Skomer Island in 2012
66

Seabird monitoring on Skomer Island in 2012
Appendix 4 Spring Atlantic puffin counts on Skomer Island, 2012.
Count date No. individual puffins
1 May 11,497
67

Appendix 5 Mean annual estimated survival rates of seabirds on Skomer IslandNote: figures relate to estimated survival rate from the year in column one to the following year.Skomer Seabird Survival Estimate to 2010
ManxShearwater Razorbill Puffin
Lesser Black-backed Gull
Herring Gull Kittiwake
1970 0.94861971 0.97931972 0.9744 0.95891973 0.9660 0.94611974 1.0000 0.92731975 0.9094 0.95541976 0.9932 0.97281977 0.8125 0.8673 0.99111978 0.7805 0.9086 0.8241 0.9830 0.8936 0.94411979 0.7931 0.8759 0.8960 0.9211 0.8087 0.89101980 0.6118 1.0000 0.9125 0.9214 0.88611981 1.0000 0.6607 0.8490 0.8741 0.6075 0.84231982 0.8865 0.8372 0.8656 0.9596 0.7050 0.91821983 0.8505 0.8985 0.9080 0.8943 0.7237 0.72641984 0.9534 0.8456 0.8469 0.9170 0.8959 0.82971985 1.0000 0.8276 0.8727 0.8923 0.7270 0.80461986 0.8764 0.8970 0.9485 0.8834 0.8721 0.91391987 0.9420 0.8997 0.9349 0.9437 0.9507 0.89771988 1.0000 0.9087 0.9715 0.9144 0.9383 0.89681989 0.7216 0.9201 0.9640 0.9217 0.8798 0.95951990 0.9235 0.8964 0.8855 0.8422 0.8204 0.90031991 1.0000 0.9508 0.9217 0.83811992 0.8226 0.9236 0.9804 0.8812 0.8751 0.85741993 0.7298 1.0000 1.0000 0.9727 0.90301994 0.8910 0.8668 0.8922 0.8255 0.7996 0.76621995 0.8902 0.9075 0.9195 0.8586 0.7715 0.77451996 0.8819 0.8944 0.8676 0.8091 0.7213 0.70641997 0.8702 0.8813 0.9156 0.8025 0.73251998 0.9424 0.9626 0.8741 0.9059 0.8296 0.86601999 0.9806 0.9021 0.9280 0.8680 0.8466 0.77662000 0.9037 0.9520 0.8808 0.8220 0.8678 0.90732001 0.9062 0.8807 0.9184 0.7944 0.7870 0.91722002 0.8346 0.8830 0.8874 0.7548 0.8713 0.79492003 0.9175 0.8465 0.8294 0.7755 0.8043 0.88782004 0.9095 0.9580 0.8922 0.8984 0.8557 0.75602005 0.8141 0.8790 0.8792 0.8701 0.7814 0.82762006 0.9234 0.7723 0.8681 0.9019 0.8063 0.67182007 0.8474 0.8629 0.8475 0.8810 0.8913 0.74312008 0.8183 0.9796 0.9389 0.9209 0.8800 0.74672009 0.7609 0.9043 0.9339 0.8156 0.6949 0.94552010 0.7220 0.9629 0.8333 0.8286 0.7632 0.9063
68 Seabird monitoring on Skomer Island in 2012
68

Seabird monitoring on Skomer Island in 2012
Appendix 6 Ringing Totals for 2012.Adult Pullus Total
Manx ShearwaterStorm PetrelPuffinGuillemotRazorbillKittiwakeLesserBlack-backed GullHerring Gull
*All birds ringed as part of Research Projects. Guillemots ringed by Prof T.R. Birkhead are estimated
69

Appendix 7 Skomer Island Guillemot Study 2011 (Birkhead, Hatchwell and Meade, 2010)
SKOMERISLANDGUILLEMOTSTUDY2012
T. R. BIRKHEAD, B. J. HATCHWELL, T. FINCH
DEPARTMENT OF ANIMAL AND PLANT SCIENCES,
70 Seabird monitoring on Skomer Island in 2012
70

Seabird monitoring on Skomer Island in 2012
ALFREDDENNYBUILDING,UNIVERSITY OF SHEFFIELD,
WESTERNBANK,SHEFFIELD,
S10 2TN
Summary
1. A total of 179individuals ringed as adults was seen at the Amos colony. Annual survival (the number of individuals seen in 2012 that were ringed as adults in previous years) was therefore 70% (179/257).
2. A total of 524individuals ringed as chicks was seen.
3. A total of 299 chicks was ringed on the Amos, and48 new adults were ringed. A further nine adults had rings replaced due to loss or damage. One re-trap had been ringed as a chick on Great Saltee in either 1979 or 1983: because the ring was worn we cannot be sure which. Either way this is a old guillemot.
4. Of 27 geolocators currently in deployment on breeding guillemots at Amos sub-site D, 14 were recovered (of which data was successfully downloaded from 12) and 11 were redeployed.
5. The productivity of 80breeding sites (where one or both partners are ringed) at the Amos was monitored between2 April and 6 July, with 76 of these pairs laying eggs and 60 chicks fledging. Breeding success was 0.79 (66/76) fledged young per pair.
6. The first egg was seen on the Amos(sub-site D) on 23 April, just 2 days later than the earliest ever egg on the Amos (2011), which could be due to the record high temperatures experienced in late March. The median lay, hatch and fledge dates however, of focal pairs were 7 May, 9 June and 1 July respectively.
7. Sprats constituted 94.9% (626) of the 660 identified feeds recorded during the 48 hour feeding watch. The remaining feeds were 4.9% (32)sandeels and 0.3% (2)gadids. 90 feeds were unidentified. The mean feeding rate (including 90 unidentified feeds) was 3.79 feeds per day per chick.
71

Skomer 2012, Crynodeb
1. Gwelwyd 179 o adar a fodrwywyd pan ynoedoliongeryr Amos. Y goroesiadblynyddol (h.y. y nifer o adar a welwydyn 2012 a gawsanteumodrwyoyn y blynyddoeddcynharach) oedd 70% (179/257).
2. Gwelwydcyfanswm o 524 adar a fodrwywyd panyngywion.
3. Modrwywyd 299 o gywiongeryr Amos, ynogystal a 48 o oedolionnewydd. Fe ail-fodrwywydnaw o oedolionychwanegoloherwyddiddyntgollieumodrwyon, neu am fodnamarnynt. Darganfu un ‘re-trap’ iddogaeleifodrwyoar ‘Great Saltee’, y naill au yn 1979 neuyn 1983. Oherwydd bod namar y fodrwy, niallwnsicrhauymhaflwyddyneifodrwywyd. Ta waeth, maehwnyn hen aderyn!
4. Ymwisgwyd 27 o Wylogodaoeddynmagu a dyfeision G.L.S. (Geolocators) geryr Amos (sub-site D). Adenillwyd14 ohonynt, ac ail-ddefnyddiwyd 11 ohonynt. Enillwydgwybodaethelectronig (data) defnyddioloddiwrth 12 ohonynt.
5. Arolygwyd 80 o fagwrfeydd (lle ‘roeddmodrwyonynbresennolarnaill au yr un neu’rddauaderyn) am gynhyrcheddaryr Amos rhwngEbrill 2, a Gorffennaf 6, gyda76 o’radar-barauyndodwy, a 60 o gywionynhedfanynllwyddianus. Mesurwyd y llwyddiantbridioyn 0.79 (66/76) o gywionllwyddianus / adar-bar.
6. Gwelwydyrwycyntafelenigeryr Amos (sub-site D) arEbrill 23,-dau ddiwrnodynhwyrachna’rdarganfyddiadmwyafbuanerioedgeryr Amos yn 2011. Mae’nbosibmaieffaithtymheredduchel a recordiwyddiweddmisMawrthoeddachoshyn. Dyddiadaucanolrifol (ynberthnasoliadar-barau a ymchwiliwydynfanwl) dodwy, deor ac hedfan y nythoedd Mai 7, Mehefin 9 a Gorffennaf 1 ynol y drefnhonno.
7. ‘RoeddGorbenwaigyncyfansoddi 94.9% (626) o’r 660 achlysurionbwydo a gofnodwydynfanwl o fewncyfnod o 48 awr.‘Roedd y gweddillyncynnwys 4.9% (32) o Lymyriaid, a 0.3% o Gadid. Nidoeddbosibdarganfodcyfansoddiad 90 o’rachlysurionbwydo.Cymedr y raddfabwydo’rcywion (yncynnwys y 90 achlysurbwydodiddarganfod) oedd 3.79 o achlysurionbwydoi bob cyw, bob dydd.
72 Seabird monitoring on Skomer Island in 2012
72
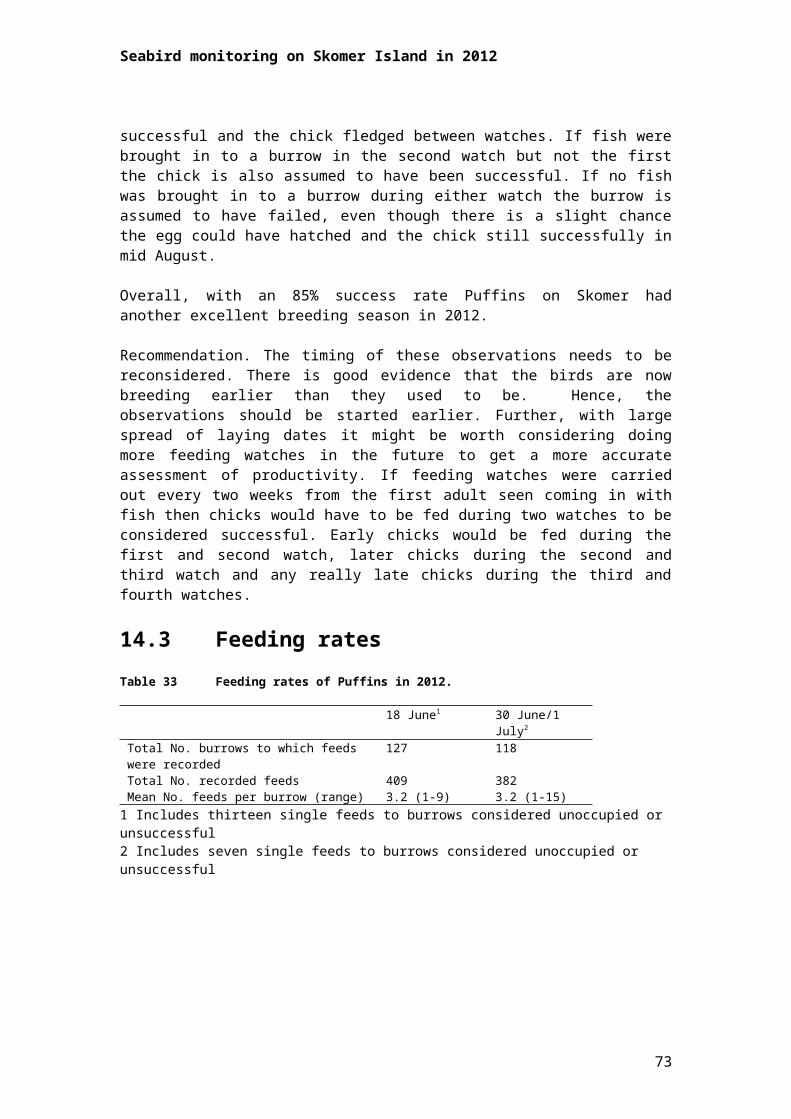
Seabird monitoring on Skomer Island in 2012
Introduction
The aims of this study were:
1. To estimate the survival of guillemots ringed as adults (adult survival)2. To estimate the survival of guillemots ringed as chicks (immature survival)3. To monitor the timing and success of breeding4. To ring both adult guillemots and chicks5. To record the feeding rate and diet of guillemot chicks
Day-to-day fieldwork was carried out by TF. TRB visited Skomer on1– 2 April, 29 – 30 May, and again with BJH on 24 – 26June to ring guillemot adults and chicks and tohelp with geolocator recoveries.
All major guillemot colonies on Skomer (South Stream, High Cliff, The Wick, The Amos, Pigstone & Pigstone Bay, The Spit, Little Will Bench, The Table, Bull Hole, Payne’s Ledge, North Haven) were visited regularly and the presence of ringed guillemots noted. The smaller colonies of the Neck (Shag Hole Bay, Amy’s Reach, Matthew’s Wick, Transverse Ledge and Surprise Ledge) were visited three times, and the North Coast once during the field season. This re-sighting data formed the basis of survival calculations.
Breeding was monitored at Amos sub-sites A and B.Eighty pairs, with one or both partners ringed, were followed throughout the breeding season, with the presence or absence of eggs and chicks recorded every day (where possible). Laying, hatching and fledging dates were recorded as accurately as possible. Each site was mapped using acetates laid over photographs of the colony, and positions were transferred to a computer database, allowing sites to be identified even in the absence of the ringed member of a pair.
A 48 hour feeding watch was carried out by Tom Finch and Dave Boyle at Amos sub-site A. Birds within a delineated plot containing 99 chicks were watched intensively during daylight hours from 11:00 on the 18June until 11:00 on the 20 June. Fishfed to chicks were identified where possible, and size was recorded.
1. Adult survival
Adult survival is estimated as the number of birds ringed as adults on the Amos seen on the Amos in the current year, as a proportion of the number of birds ringed as adults on the Amos known to be alive in the previous year. This year, 179 birds ringed as adults were seen, out of 257 birds known to be alive in 2011, giving an annual survival estimate of 70%.
Whilst this is considerably lower than recent survival estimates (Figure 1), it should be made clear that this estimate is preliminary, as some birds are likely to have been missed this year. Only retrospectively, when these missed birds have been resighted in subsequent years can a more accurate survival estimate be made. As Figure 1 shows, the current estimate (‘seen’ birds) usually underestimates the survival estimate based on ‘alive’ birds, but the magnitude by which it falls short is usually consistent, providing a good approximation of the direction of any survival trends.
73

1998 2000 2002 2004 2006 2008 2010 2012
0.0
0.2
0.4
0.6
0.8
1.0
Year
Surv
ival
SeenAlive
Figure 1.Adult survival as estimated by the number of birds seen (open triangles, solid line) and number of birds known to be alive (crosses, dotted line). The latter can be calculated only retrospectively, when ‘missed’ birds have been resighted in subsequent years, whereas the former is a more crude (under-) estimate.
2. Immature survival
Immature survival is calculated as the number of guillemots ringed as chicks seen this year as a proportion of the number of chicks ringed in previous years. However, this estimate is likely to lack accuracy, due to the difficulty of resighting immature birds: after fledging, they spend two years away from their natal colony. On their return they visit ‘clubs’ – tidal rocks below the major colonies – around the island, not joining a breeding colony until they reach 5-7 years old (sometimes earlier).
Nine (3%) of the 277 chicks ringed in 2010 that are now 2 years old were seen in 2012, the first of these on 19May.Of all guillemots ringed as chicks on Skomer, 524 were resighted this year.Figure 2 shows the proportion of each ringing cohort resighted this year and in 2011.
74 Seabird monitoring on Skomer Island in 2012
74
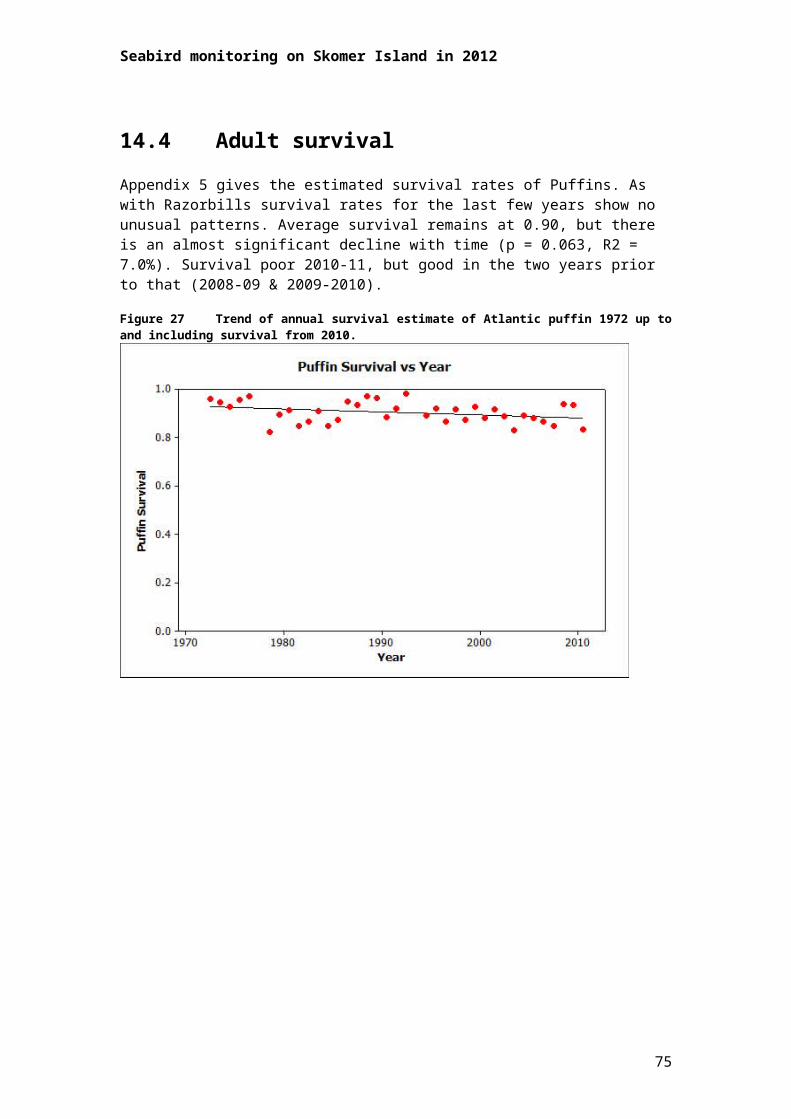
Seabird monitoring on Skomer Island in 2012
1986
1987
1988
1989
1990
1991
1992
1993
1994
1995
1996
1997
1998
1999
2000
2001
2002
2003
2004
2005
2006
2007
2008
2009
2010
Year
Prop
ortio
n of
coh
ort r
esig
hted
0.00
0.05
0.10
0.15
0.20
0.25
0.30
0.3520112012
Figure 2. Proportions of each ringing cohort resighted in 2011 (black bars) and 2012 (grey bars).
3. Monitoring productivity
Breeding was monitored for a sample of 80pairs at Amos sub-sites A and B.Only pairs in which one or both partners could be identified from colour rings were included in the sample. Pairs were followed from 2 April until 6 July, and the presence or absence of eggs or chicks was recorded daily, where possible, following the full-scale method of Birkhead & Nettleship(1980). The presence or absence of eggs or chicks was used to estimate lay, hatch and fledge dates as accurately as possible, as well as overall breeding success (chicks fledged per pair).
Although guillemots have a characteristic incubating posture, this can also be adopted when ‘brooding’ pieces of eggshell, pebbles or other debris. The presence of eggs was therefore always confirmed with a direct sighting of an egg. If a guillemot was seen to be adopting the incubating posture, but the presence of an egg was not confirmed until the following day, then it was assumed that incubation started on the day that the posture was adopted. Guillemots usually lay one egg per breeding season, but may replace a lost egg after a minimum of 12 days. Only very rarely will they lay a third egg to replace a lost second egg (Gaston & Jones, 1998).
Posture changes again when eggs hatch, although for the first few days the chick is brooded beneath the adult, making it challenging to see chicks when they first hatch. After this, they are then brooded under the adult’s wing, and are more conspicuous. Care was taken therefore to confirm sightings of eggs or chicks around the predicted hatch day (33 days after lay date).
75

Again, if a definite sighting was obtained only on the day following a change in posture, it was assumed that the chick hatched on the day that the posture changed.
The median length of the chick-rearing period is 21 days, although chicks can fledge several days earlier than this. For the purposes of measuring breeding success, if a chick disappeared from the ledge on or after the 16th day after hatching (with hatch date as day 1) it was assumed to have fledged successfully. If a chick younger than 16 days old disappeared, it was assumed to have been predated or accidentally lost.
Timing of breeding
Only dates accurate to within 2 days were included in phenology analyses. The first egg on the Amos was laid on the23April (in sub-site D), but it was another 8 days until an egg was laid at one of the monitored sites. This delay, and the broad distribution of first egg dates shown in Figure 3, could be due to the record high temperatures at the end of March, followed by an extremely cold, wet April.
01-M
ay02
-May
03-M
ay04
-May
05-M
ay06
-May
07-M
ay08
-May
09-M
ay10
-May
11-M
ay12
-May
13-M
ay14
-May
15-M
ay16
-May
17-M
ay18
-May
19-M
ay20
-May
21-M
ay22
-May
23-M
ay24
-May
25-M
ay26
-May
27-M
ay28
-May
29-M
ay30
-May
31-M
ay01
-Jun
02-J
un03
-Jun
04-J
un05
-Jun
06-J
un07
-Jun
08-J
un09
-Jun
10-J
un11
-Jun
12-J
un
Date
Num
ber o
f egg
s
0
2
4
6
8
10First eggSecond egg
Figure 3. Distribution of lay dates at monitored breeding sites.
The first hatchling in the breeding sample was seen on 4 June, and the first chick fledged on 26 June. Median first and last laying, hatching and fledging dates are given in Table1.
Table 1. Median lay, hatch and fledge date, along with range and sample size. Note that this analysis excluded replacement eggs and estimates with less than 2 days accuracy.
Median Range n
Lay date 7 May 1 – 26 May 61
Hatch date 9 June 4 – 29 June 52
Fledge date 1 July 26 June – 5 July 49
76 Seabird monitoring on Skomer Island in 2012
76

Seabird monitoring on Skomer Island in 2012
Breeding success
Of the 80pairs monitored at Amos sub-sites A and B, 76 (95%) laid eggs. Four pairs apparently did not lay. None of these pairs was monitored in 2011. Of the 76 pairs that laid, 9eggs were predated, accidentally lost, or failed to hatch; one failed egg was replaced, but later failed. A total of 67 chicks hatched, of which60 fledged successfully, five failed, and two were assumed to have failed, due to very late hatching. This gives a hatching rate of 88% (67/76), a post hatching success rate of90% (60/67) and an overall success of 79% (60 chicks fledged from 76 breeding pairs; Table 2).
Table2.Summary of breeding success in 2012
Pairs followed 80
Pairs that laid eggs (% of pairs followed) 76 (95%)
Pairs with hatchlings (% of pairs with eggs) 67 (88%)
Pairs that fledged chicks (% of pairs with hatchlings) 60 (90%)
Breeding success (chicks fledged per breeding pair) 0.79 (60/76)
4. Chick diet
A 48-hour feeding watch was carried out by TF and Dave Boyle at the Amos during all daylight hours (approximately 04:30 – 22:00) between 11:00 18 June and 11:00 20th June. A section of sub-site A was delineated, and all feeding events in this area were recorded. 99 chicks were counted in the area on the morning of 18 June. The median age of the 21 chicks monitored for breeding success within the feeding watch plot was 9 days (minimum 4, maximum 17). The weather was clear, calm and dry for the majority of the period.
Where possible, fish were classified as sprat (Sprattussprattus), sandeel (Ammodytes sp.) orgadid (Gadidae), and fish size was estimated relative to bill length (small = shorter than bill; medium = roughly equal in length to bill; large = longer than bill).
In total, 750 fish were fed to chicks during the 48-hour period, of which 88% (660) were identified. On average, chicks received 3.79 feeds/day; a higher feed rate than that observed in recent years (3.08 feeds/day in 2011; 3.38 in 2010; and 3.30 in 2009). Peak feeding occurred between 05:00 and 07:00. Table 3 summarises the composition of feeds, broken down into species and size.
77
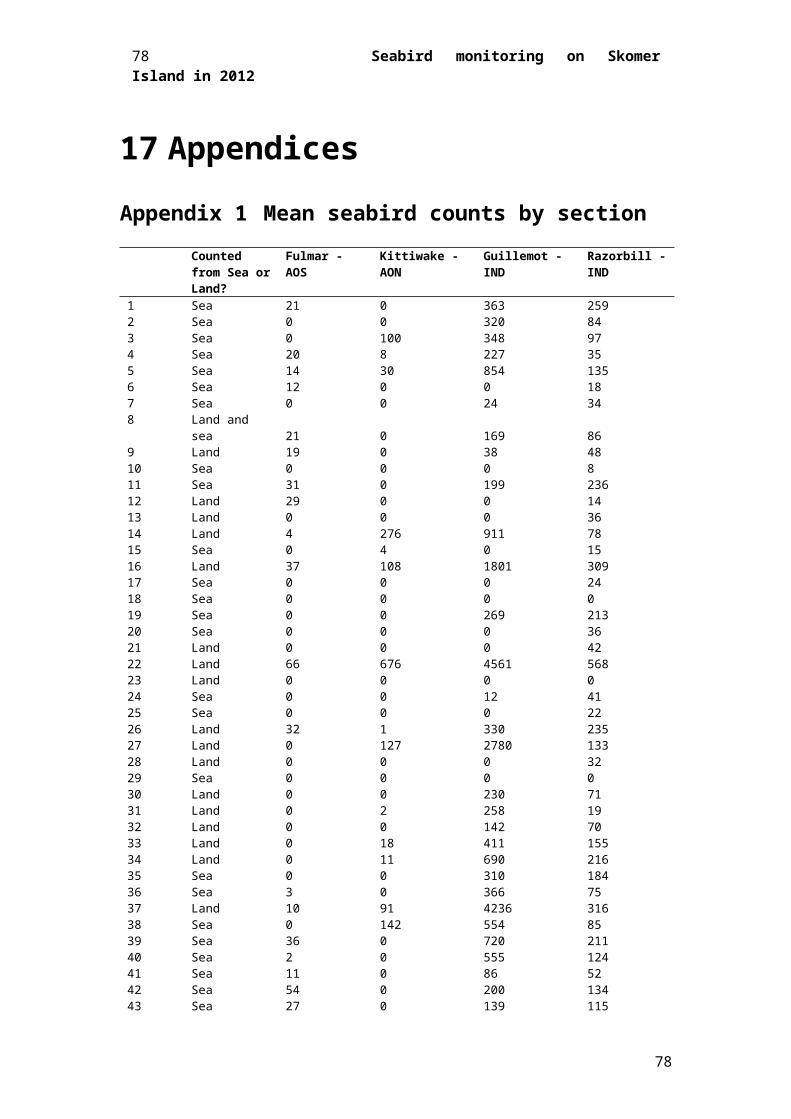
Table3. Breakdown of feed composition by species (calculated as a percentage of all identified feeds) and size (calculated as a percentage for each species).
Species Number of feeds Size Number of feeds
Sprat 626 (94.9%)
S 43 (6.9%)
M 420 (67.1%)
L 163 (26.0%)
Sandeel 32 (4.9%)
S 3 (9.4%)
M 20 (62.5%)
L 9 (28.1%)
Gadid 2 (0.30%)
S -
M 1 (50%)
L 1 (50%)
(Unidentified 90)
5. Adult ringing
Ringing was carried out on 25 June by TRB, BJH and Dave Boyle with TF assisting. Of the 57 adults captured this year, 48 were new,eight had previously been captured on Skomer and the ninth had an old‘G’ size BTO ring (?861616) for which we are awaiting recovery information (Table 4). These recaptured birds had missing or damaged rings replaced. Of these 57 birds, only 12 were observed on the Amos after ringing. This number is likely low due to the inclement weather experienced in the period soon after ringing. Despite the fine weather on 25 June, the following two days were thick with fog, making it impossible to view the Amos. Rain and winds also made it difficult to read rings for the rest of the week, which means many adults may have left the colony before being resighted.
Table 4. Details of adults guillemots ringed on the Amos in 2012. 48 new birds were captured, and 9 birds had missing or damaged rings replaced.
Date Location Recapture/New Previous rings New rings Breeding
status Resighted Y/N25/6 Amos A/B N N05051 Y901 On chick Y25/6 Amos A/B N N05052 Y902 On chick Y25/6 Amos A/B R R58080 N05053 Y903 On chick N25/6 Amos A/B N N05054 Y904 On chick N25/6 Amos A/B N N05055 Y905 On chick N25/6 Amos A/B N N05056 Y907 On chick ? N25/6 Amos A/B N N05057 Y908 On chick Y25/6 Amos A/B N N05058 Y909 On chick N25/6 Amos A/B N N05059 Y910 On chick N25/6 Amos A/B N N05060 Y911 On chick N25/6 Amos A/B N N05061 Y912 On chick N25/6 Amos A/B N N05062 Y913 On chick N25/6 Amos A/B N N05063 Y914 On chick N25/6 Amos A/B N N05064 Y915 On chick N25/6 Amos A/B N N05065 Y916 On chick N25/6 Amos A/B N N05066 Y917 On chick Y25/6 Amos A/B N N05067 Y918 On chick ? N25/6 Amos A/B N N05068 Y919 On chick N25/6 Amos A/B N N05069 Y920 On chick N25/6 Amos A/B N N05070 Y922 On chick N
78 Seabird monitoring on Skomer Island in 2012
78

Seabird monitoring on Skomer Island in 2012
25/6 Amos A/B N N05071 Y923 On chick N25/6 Amos A/B N N05072 Y924 On chick ? N25/6 Amos A/B N N05073 Y925 On chick Y25/6 Amos A/B N N05074 Y926 On chick Y25/6 Amos A/B N N05075 Y927 On chick ? Y25/6 Amos A/B N N05076 Y928 On chick N25/6 Amos A/B N N05077 Y929 On chick ? N25/6 Amos A/B N N05078 Y930 On chick ? N25/6 Amos A/B N N05079 Y931 On chick N25/6 Amos A/B N N05080 Y932 On chick N25/6 Amos A/B R R22097 Bu44T - Y933 On chick N25/6 Amos A/B N N05081 Y934 On chick? N25/6 Amos A/B N N05082 Y935 Unknown Y25/6 Amos A/B N N05083 Y936 On chick N25/6 Amos A/B N N05084 Y937 On chick N25/6 Amos A/B N N05085 Y938 On chick N25/6 Amos A/B N N05086 Y939 On chick Y25/6 Amos A/B N N05087 Y940 On chick N25/6 Amos A/B N N05088 Y941 On chick Y25/6 Amos A/B N N05089 Y942 On egg N25/6 Amos A/B N N05090 Y943 On chick N25/6 Amos A/B N N05091 Y944 Unknown N25/6 Amos A/B N N05092 Y945 Unknown N25/6 Amos A/B N N05093 Y496 On chick N25/6 Amos A/B N N05094 Y947 On chick ? N25/6 Amos A/B R R22332 N05095 Y948 On chick N25/6 Amos A/B N N05096 Y949 Unknown N25/6 Amos A/B N N05097 Y950 Unknown N25/6 Amos A/B N N05098 Y951 On chick N25/6 Amos A/B N N05099 Y952 Unknown N25/6 Amos A/B N N05100 Y953 Unknown N25/6 Amos A/B R R58253 - Y954 On chick Y25/6 Amos A/B R R07423 - Y955 Unknown N25/6 Amos A/B R N05260 Y957 Unknown N25/6 Amos A/B R N05281 Y958 Unknown N25/6 Amos A/B R ??61616 - Y960 Unknown N25/6 Amos A/B R X92207 R/YT - Y961 Unknown Y
6. Chick ringing
Ringing was carried out by TRB, BJH and Dave Boyle with TF assisting. In total, 299 chicks were ringed on the Amos from sub-sites A, B, ‘Gulley’, ‘Top’ and ‘End’. The following yellow numbered Darvic sequences were used: Y355 – Y379 and Y401 – Y684 (some Darvic rings in this sequence broke).
7. Guillemot tracking
In 2010, geolocator devices were fitted to 27 adult guillemots in sub-site D of the Amos. These devices use day length and the timing of sunrise and sunset to determine approximate location to within c. 200km. Whilst they are insufficiently accurate to gain information on foraging trips, their long battery life (2-5 years) means that they are useful for providing information on winter movements. Additionally, the devices include salt-water immersion sensors which can determine whether the bird is on the sea or in flight, providing behavioural information. Data cannot be downloaded remotely, however, so birds must be recaptured.
79

On 25 June 2012, 14 geolocators were recovered from sub-site D, and 11 were redeployed. A further five devices were seen, but not recovered. Of the 14 recovered devices, data were successfully downloaded from 12, half of which contained two-year’s worth of data. The remaining six devices contained one-year’s worth of data. The results of this tracking study will be reported elsewhere.
8. Comparison with previous breeding seasons
Egg and chick failure rates each increased by 4% compared to last year, resulting in 0.08 fewer chicks fledged per pair. However, a breeding success of 0.79 is well within the range of the last 5 years (Table 5).
Table 5. Comparison with previous breeding seasons.
Parameter 2012 2011 2010 2009 2008 2007
Adult survival (estimated from birds ‘seen’) 70% 87% 83% 78% 77% 79%
Number of sites monitored for breeding success 80 118 141 113 64 106
Number of monitored pairs that laid eggs. 76 106 110 113 64 102
First egg date 23 Apr 21 Apr 2 May 26 Apr 12May 5 May
Median lay date 7 May 1 May 6 May 30 Apr 19 May 10 May
Median hatch date 9 Jun 2 Jun 11 Jun 1 Jun 18 Jun 13 June
Median fledge date 1 Jul 25 Jun 29 Jun 24 Jun 12Jul 7 July
% eggs hatched 88% 92% 84% 87% 80% 85%
% chicks fledged 90% 94% 84% 97% 94% 92%
Breeding success (No. chicks fledged/
breeding pair)0.79 0.87 0.76 0.86 0.75 0.80
The first egg on the Amos was seen just 2 days later than the earliest egg on record (2011), continuing the observed trend towards early laying shown in Figure 4.Unsurprisingly, hatch and fledge dates were similarly early.
The estimate of adult survival was considerably lower than previous years, although it remains to be seen by how much this estimate will increase following the observation of ‘missed’ birds in subsequent years. Nevertheless, this could be an indication of the beginning of a downward trend in the survival of adult guillemots. The poor weather (notably the record levels of rainfall experienced during April and June) may also be to blame for this low estimate of survival, by making the observation of colour rings more challenging than usual.
80 Seabird monitoring on Skomer Island in 2012
80
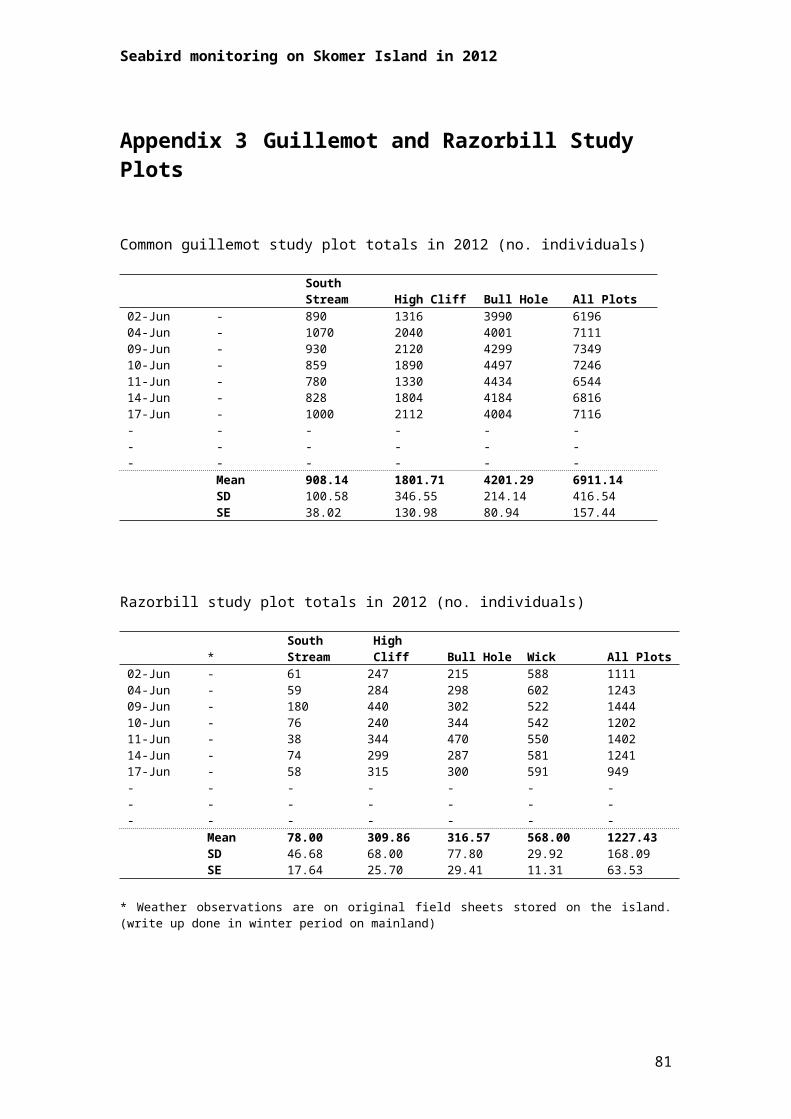
Seabird monitoring on Skomer Island in 2012
1992 1994 1996 1998 2000 2002 2004 2006 2008 2010 2012
05
1015
2025
Year
Med
ian
Lay
Dat
e (d
ay 1
= 1
May
)
Figure 4. Median lay date in relation to time: the median laying date has advanced by 2-3 weeks over the last 20 years.
81
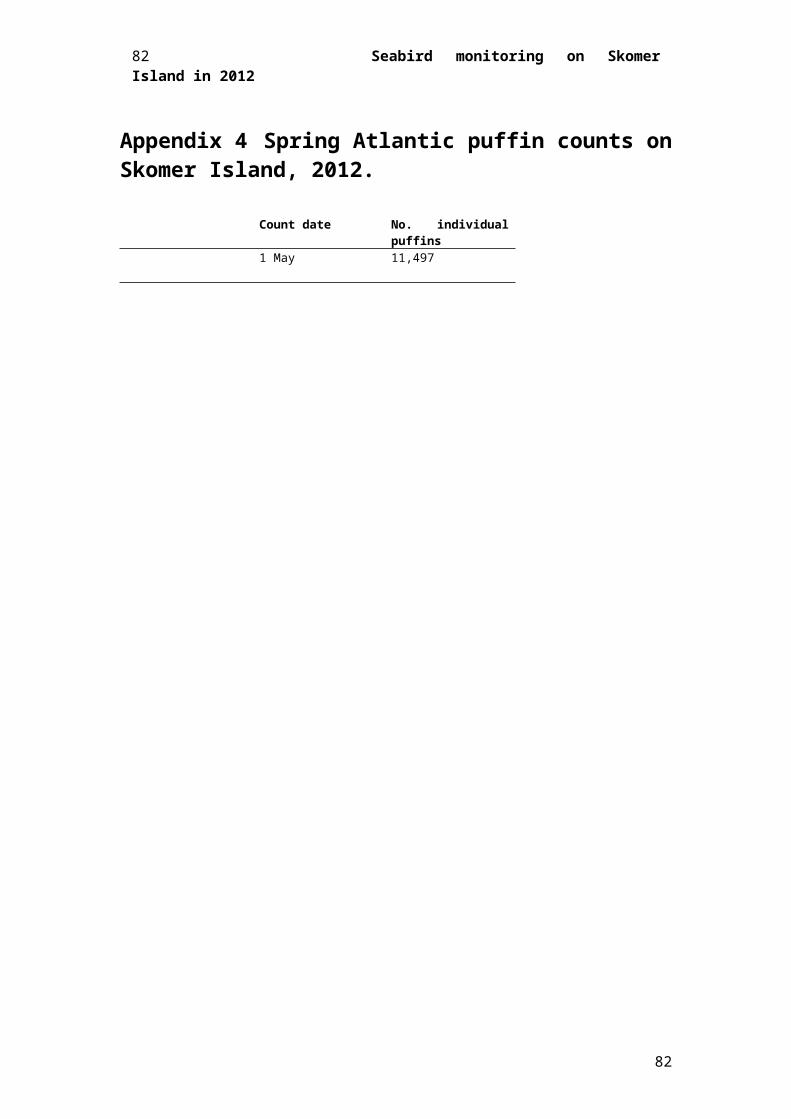
Appendix 1
1970 1980 1990 2000 2010
5000
1000
015
000
2000
0
Year
Popu
latio
n
Figure 5. Whole island counts of guillemots on Skomer. Numbers show a steady increase from c 1980 and reached over 20,000 individuals in 2012. However, it should be noted that as the population increases, so the counting accuracy decreases. Larger colonies were counted in larger groups (e.g. 50s, rather than 5s or 10s).Data from Chris Taylor, Skomer Island Warden.
Acknowledgments
We would like to thank the Warden,Chris Taylor, and the crew of the Dale Princess for their wonderful help throughout the season on Skomer. We also thank the Wildlife Trust for South and West Wales for permission to work and stay on Skomer, and the Countryside Council for Wales for funding the study. Finally, we are grateful to Dave Boyle, Jessica Meade, Annette Fayet, Akiko Shoji, Philip Collins and Tim Guilford for help with field work, and Ian Stevenson for technical support throughout the season.
References
Birkhead&Nettleship (1980) Census methods for murres, Urialomvia, at the Gannet Islands, Labrador. II. Breeding success and site characteristics. Canadian Journal of Zoology, 65, 1630-1637.
82 Seabird monitoring on Skomer Island in 2012
82
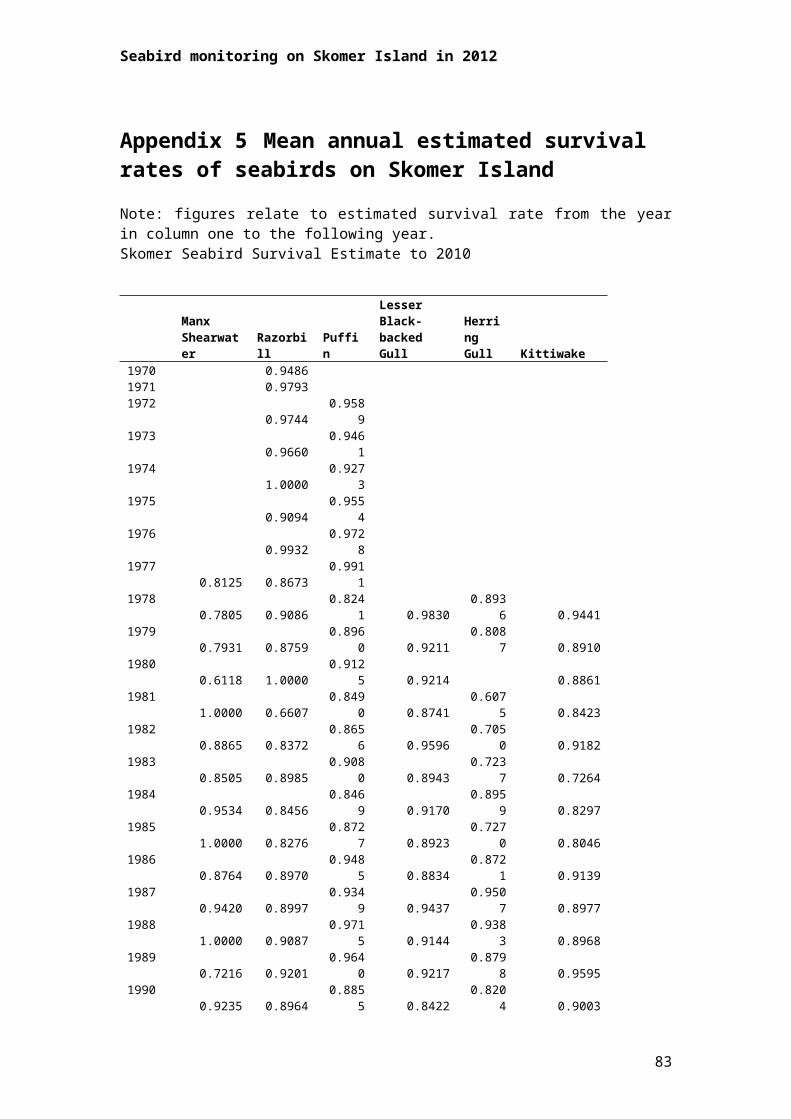
Seabird monitoring on Skomer Island in 2012
Gaston, A.J. & Jones, I. (1998) The Auks Cambridge University Press, Cambridge
83
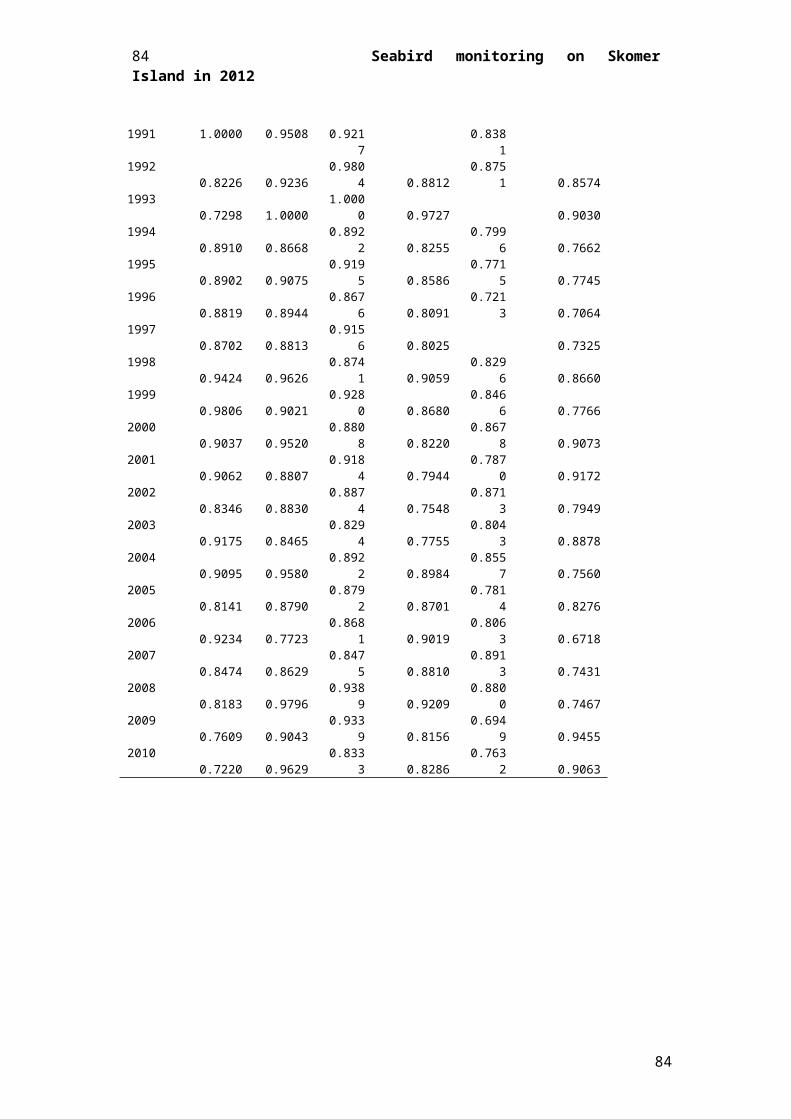
Appendix 8 Gull Diet Survey Comparison of MethodsThis report was issued to JNCC in November 2012. The JNCC have had the raw data and doing some further analysis. (2012)
Ali Quinney and Richard KiplingIntroductionFor several years the WTSWW Field Assistant on Skomer Island has carried out a diet survey of the 25 Great Black-backed gull nests included in the breeding productivity survey. The diet survey has evolved over time, and as a result there are some vagaries in the methodology which may affect the accuracy of findings. Here, the results of the WT diet survey carried out in 2012 are compared with the results of a more rigorous method, in order to test the validity of the WT findings.
The WT MethodThe WT survey of GBBG diet involves a visit to each nest shortly after the chicks have fledged. The purpose is to provide a straightforward estimate of the diet of GBBG chicks, and to record the frequency, number and relative abundance of rabbit and Manx Shearwater remains. A simple visual survey is made of the area surrounding each nest, and each prey item is recorded.There are two issues with the WT methodology: 1) Some of the prey categories are to some extent subjective, and some prey items could be fitted into a number of them, depending on the experience of the recorder. For example, if a bone is found it may be classed simply as ‘bone’, identified as bird or mammal, or identified to species level. A number of bones found close together may be grouped together as a single entry, or treated separately, and again this is a matter of judgement for the surveyor. 2) The size of the area around the nest in which prey is included is left to the discretion of the recorder, and this introduces a further element of uncertainty into the dataset.
The Comparison (Transect) MethodThe purpose of the comparison method was: 1) To assess if the proportions of recorded prey types differed from those found using the WT survey method.2) To assess changes in the amount or type of prey items found at increasing distances from each nest, in order to provide recommendations on how far from a nest prey items should be recorded.A cross-shaped transect centred on each nest was used to observe prey items. Along the transect a one metre square quadrat was used, and prey items observed within each quadrat recorded. Prey categories defined in a previous intensive diet survey were used as the basis for the classification of prey. Items were divided into categories specific enough to minimise subjectivity in the classification of each prey type (Appendix 2). Prey were recorded at the centre of the transect (the nest site itself, distance zero). From the centre, quadrats then led out from the centre to a total distance of ten metres. The direction of each arm of the cross-shaped transect was, either, north south east and west, or along and perpendicular to the rocky outcrop (for nests found on linear ridges). Nests were allocated to three categories: ridge (nest on linear feature), rocky outcrop (nest on non-linear feature),
84 Seabird monitoring on Skomer Island in 2012
84

Seabird monitoring on Skomer Island in 2012
plateau (nest on flat area with no significant drops or edges close). Only at ridge nests were transect arms dictated by the direction of the geographical feature on which the nest was situated. The nest categories allowed data gathered using different orientation rules to be analysed separately, and enabled a comparison of ecological differences between nest sites to be undertaken (results in separate report).
Data Analysis MethodsAnalysis of Prey Changes with Distance from nestThe amounts of different prey types recorded at each distance (0-10 m) from nests were calculated. Because each distance except zero metres (the centre) included observations from four quadrats (one on each transect arm), these data were divided by four to allow comparison with the amount of prey recorded in the central quadrat. All prey items were included, and results were summed across all nests. Linear regression was used to ascertain whether the number of prey items decreased significantly with increasing distance from the nest, and the cumulative percentage of total prey recorded was calculated for each increase in distance. The analysis was repeated for nests in the three different categories defined, so see if the location of a nest affected the spread of prey around it.Changes in the type of prey recorded at increasing distances from the nest were analysed by comparing the proportions of different prey types recorded at different distances. A Chi Squared Test was used, and data were merged into broad prey categories to ensure that the test was valid (no categories with expected values < 5).Methodological Comparison of FindingsData were collected using the Transect Method at 18 of the 25 nest sites at which the WT diet study was conducted. The WT survey was carried out at the same time as the Transect survey where possible. At the remaining sites the WT survey was carried out first, with care taken not to disturb prey items. In order to compare the two methods, prey categories used in the Transect survey were merged to match those in the WT survey. Prey amounts were summed over all 18 nests for both methods. The proportion of prey in each merged category was compared across methodologies using a Chi Squared test, in order to ascertain if the two methods returned significantly different prey proportions.
ResultsPrey Changes with Distance from NestThe amount of prey found was found to decrease with distance from nests with a leptokurtic distribution (Fig. 1a). Linear regressions were carried out on Log10 transformed data for all nests (Fig. 1b) and showed a significant relationship between distance and amount of prey for all nests, and for Ridge and Stony Outcrop type nests treated separately (Table 1). There was only one Plateau type nest, so no analyses were carried out on this category. More than 80 % of prey was found between zero and five metres from nests.
85

Fig. 1. Amounts of prey found at different distances from nest sites: a) total amounts, b) Log10 transformed amounts, with the results of linear regression analysis.
Fig.2. Log10 transformations of amounts of prey found at different distances from nest sites, with results of linear regression analysis a) Ridge nests, b) Stony Outcrop nests.
86 Seabird monitoring on Skomer Island in 2012
86

Seabird monitoring on Skomer Island in 2012
The proportions of different types of prey found close to the nest (zero to five metres) were significantly different to the proportions found further from the nest (six to ten metres) (Fig. 2). The proportion of Manx Shearwaters was lower closer to the nest site and the proportion of rabbits higher. There was no significant difference between the proportions of different types of prey found between zero and five metres from the nest, and the proportions found over all distances (Fig. 3).
Fig. 2. Proportions of prey found close to nests (0-5 metres) and far from nests (6-10 metres). Results of Chi Squared analysis are shown.
87
Fig 3. Proportions of prey found close to nests (0-5 metres) compared to overall proportions of prey found (0-10 metres). Results of Chi Squared analysis are shown.
Methodological Comparison of FindingsThe proportions of prey in different categories for each survey methodology are shown in Fig. 4, along with the results of Chi Squared analysis. There were significant differences in the proportions of different prey items recorded using each method. The largest differences were in the categories: rabbit, bones (other), fur pellet and fish pellet. Manx shearwater, refuse, bird (other), feather pellet and crustacean categories differed least between methodologies.
88 Seabird monitoring on Skomer Island in 2012
88
Seabird monitoring on Skomer Island in 2012
Fig. 4. The proportions of prey types found using the WT and Transect survey methods, a) arranged by method, and b) arranged by prey type. Panel b) includes the results of a Chi Squared test on the differences in prey proportions between methods.
DiscussionThe results of this study, and big differences in the proportions of prey found in 2012 relative to 2011 (sea Skomer Sea Bird Reports 2011 & 2012) show that the outcomes of the WT GBBG diet survey are highly sensitive to changes in the definition of prey categories, and their interpretation on the ground. This sensitivity means that the findings of previous studies must be treated with caution. Problems with prey categorisation appear to be the main reason that the WT and Transect methodologies yielded different results, and overcoming such difficulties would increase confidence in the data from WT method surveys.Analysis of the distribution of prey around nests suggests that more than 80 % of prey remains are deposited within five metres of a nest site. Prey proportions up to five metres from nests are significantly different to prey proportions between six and ten metres (Fig. 4). This suggests that a survey area greater than five metres is necessary to capture prey proportions and amounts more accurately. However, as so little prey is found beyond five metres, excluding larger distances would not have significantly changed the prey proportions recorded using the transect method within a five metre area (Fig. 3). It appears that surveying up to five metres from a nest is sufficient to gain an accurate estimate of prey types.As Manx Shearwater and Rabbit remains are quick to survey, and their relative numbers are of ecological significance, future surveys could include a wider sweep (up to ten metres) for these prey remains only. Of course, extra rabbit and shearwater remains found in this wider area should not be included in comparisons with prey types sampled only within five metres of nests.Although many of the differences between the WT and Transect survey could be accounted for by differences in categorisation, some are likely to have arisen due to prey being
89

overlooked using the WT method. The use of quadrats is likely to increase survey accuracy, providing detailed analysis of specific areas; small pellets etc are liable to be missed in a general sweep of an area. However, quadrats are time consuming so a decision needs to be taken as to whether the increased accuracy achieved is worth the added survey effort. One solution would be to give a set time for observations at each nest (fifteen minutes may be reasonable), which would to some extent standardise survey effort and ensure that estimates of prey amounts between years were comparable.
Summary and Recommendations1) Prey categories should be clearly and unambiguously defined for future WT surveys.
Eleven broad categories are suggested below (Appendix 1).2) It should be ensured that surveyors do not try to identify remains in more detail than
the categories suggest. If this occurs, similar remains are likely to be counted differently depending on the knowledge of the surveyor (for example, an experienced worker might identify a bone as rabbit remains, while a less experienced worker would simply record them as ‘bones – other’)
3) An area of five metres, centred on the nest, should be sufficient to gain a good estimate of prey remains for all nest types
4) If a quadrat-based method is not used (due to the survey effort required) a set time should be defined for the WT search method, within the zero to five metre perimeter. This should ensure that a similar survey effort is made each year, so that prey estimates are comparable.
5) Manx shearwater and rabbit remains may be estimated up to ten metres from a nest, in order to capture differences in the proportions of these species observed at increasing distances. Only observations of rabbits and shearwaters found within the five metre area should be included in comparisons with other prey types.
Appendix 1: Suggested Prey CategoriesManx Shearwater Includes shearwater bones, wings, skulls, carcassesFish (inc pellets) Fish bones, or entire pelletsRefuse Pieces of plastic, cloth, glass etcRabbit Bones with rabbit fur, carcasses, pellets with feet etc (if bones w/o fur
etc count as Bones (other)Bird (other) All bird remains (gull, guillemot, razorbill etc). Can make note e.g. of
puffin numbers separate from main analysis; for analysis include all species except Manx shearwaters in this category.
Bones (other) All bones not obviously Manx shearwater or fish (do not attempt detailed ID as many bones taken from landfill sites)
Fur pellet Pellets containing fur. Unless obvious rabbit foot or bone count in this category, not as rabbit
Feather pellet All pellets containing feathers. Include pellets with egg shellInvert Pellet All pellets containing invertebratesVeg Pellet All pellets which are vegetation only (without feathers/fur/invertsCrustacean All pellets, crustacean remains, shells
Appendix 2: Prey Categories used in Transect surveyPrey type Prey ItemManx shearwater Complete carcasse Partial carcasse Wings
90 Seabird monitoring on Skomer Island in 2012
90
Seabird monitoring on Skomer Island in 2012
Pellet of feathers without inverts Pellet of feathers with inverts Head Assorted bonesRabbit Complete carcasse Partial carcasse Fur pellet without inverts Fur pellet with inverts BonesRefuse Plastic Paper Bones (not from island) OtherFish Pellet BonesIntertidal Crab remains Mussel/limpetPellet: Vegetation solely veg with invert remains egg shell in pelletOther birds(record species as reqd) Other bird bone Puffin foot Puffin wing LBB Remains Guillemot/Razorbill carcass Puffin skullBones Bird sp.
Mammal sp.
91