title of presentation -...
TRANSCRIPT

©2017 Graphic Packaging International, Inc.
Investor Presentation March 2017
©2017 Graphic Packaging International, Inc. 2
Forward Looking Statements
Any statements of the Company’s expectations in these slides constitute "forward-looking statements" as defined in the Private Securities Litigation Reform Act of 1995. Such statements, including but not limited to, expected increases in Adjusted EBITDA and cash flow, as well as expected capital spending, pension expense, cash taxes, depreciation and amortization, pension amortization, interest expense, effective tax rate, and net leverage, are based on currently available information and are subject to various risks and uncertainties that could cause actual results to differ materially from the Company's present expectations. These risks and uncertainties include, but are not limited to, inflation of and volatility in raw material and energy costs, cutbacks in consumer spending that reduce demand for the Company’s products, continuing pressure for lower cost products, the Company’s ability to implement its business strategies, including productivity initiatives and cost reduction plans, currency movements and other risks of conducting business internationally, and the impact of regulatory and litigation matters, including the continued availability of the Company’s net operating loss offset to taxable income, and those that impact the Company’s ability to protect and use its intellectual property. Undue reliance should not be placed on such forward-looking statements, as such statements speak only as of the date on which they are made and the Company undertakes no obligation to update such statements except as required by law. Additional information regarding these and other risks is contained in the Company's periodic filings with the SEC.

©2017 Graphic Packaging International, Inc.
Food
Beverage
Household and Personal Care
We are a Packaging Company Making Products for the World’s Food, Beverage and Consumer Products Companies
3
©2017 Graphic Packaging International, Inc.
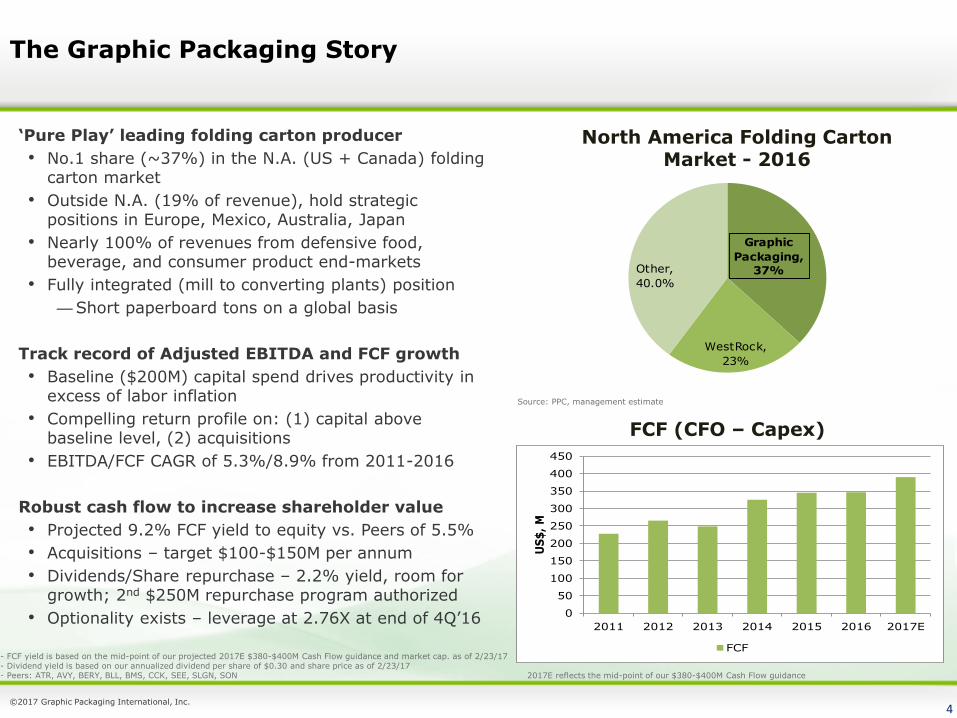
The Graphic Packaging Story
‘Pure Play’ leading folding carton producer
• No.1 share (~37%) in the N.A. (US + Canada) folding carton market
• Outside N.A. (19% of revenue), hold strategic positions in Europe, Mexico, Australia, Japan
• Nearly 100% of revenues from defensive food, beverage, and consumer product end-markets
• Fully integrated (mill to converting plants) position
—Short paperboard tons on a global basis
Track record of Adjusted EBITDA and FCF growth
• Baseline ($200M) capital spend drives productivity in excess of labor inflation
• Compelling return profile on: (1) capital above baseline level, (2) acquisitions
• EBITDA/FCF CAGR of 5.3%/8.9% from 2011-2016
Robust cash flow to increase shareholder value
• Projected 9.2% FCF yield to equity vs. Peers of 5.5%
• Acquisitions – target $100-$150M per annum
• Dividends/Share repurchase – 2.2% yield, room for growth; 2nd $250M repurchase program authorized
• Optionality exists – leverage at 2.76X at end of 4Q’16
Source: PPC, management estimate
FCF (CFO – Capex)
- FCF yield is based on the mid-point of our projected 2017E $380-$400M Cash Flow guidance and market cap. as of 2/23/17 - Dividend yield is based on our annualized dividend per share of $0.30 and share price as of 2/23/17 - Peers: ATR, AVY, BERY, BLL, BMS, CCK, SEE, SLGN, SON
4
2017E reflects the mid-point of our $380-$400M Cash Flow guidance
0
50
100
150
200
250
300
350
400
450
2011 2012 2013 2014 2015 2016 2017E
US
$,
M
FCF
Graphic
Packaging,
37%
WestRock,
23%
Other,
40.0%
North America Folding Carton Market - 2016

©2017 Graphic Packaging International, Inc.
Key Strategic Priorities
Operational Excellence Re-Investment In The Business Capital Allocation
Outperform in tough end-market volume environment • Primary food and beverage end-
markets are highly stable, but are not growing
• Brand Building • Convenience • Food Service • Strength • Substrate substitution away from
SBS, corrugated into CUK • Focus on mid-tier customers that
are winning in the market place
Ensure price offsets commodity inflation over reasonable timeframe • Roughly, 50% of the contracts that
adjust use an index pricing model and 50% is on a cost-model
• Focused on shifting business away from index to cost models over the next 2 years
Drive productivity in excess of labor inflation within baseline capital spend • Baseline capital spend = $200M
Maintenance = $100M Return focused = $100M
When capital exceeds $200M, clearly outline the project scope and return profile • Size of projects typically in the $15-$40M
range • Target after-tax IRR’s in mid-to-high teens
Three key projects in 2016 that were above baseline capital spend • Machine upgrade at W. Monroe
$40M investment Projected $12M EBITDA by year-
end 2017 • Curtain coater installation at Macon
$30M investment Projected $10M EBITDA by year-
end 2017 • Menasha, WI and Piscataway, NJ plant
consolidation $15M investment Projected $10M EBITDA by year-
end 2017
Acquisitions • Purchase assets at post-synergy
multiple well below our current valuation trading multiple
• Continue to increase our integrated (mill to converting) position, to drive cash flow engine
• Extend run-way for organic capital deployment at compelling IRRs
Dividends • Recently increased dividend by 50%
to an annualized $0.30/share • At $0.30/share, dividend/cash flow
ratio is 25% • Good run-way to grow dividend
Share repurchases • Excess cash flow after acquisitions
and dividends back to shareholders via share repurchases, when valuation for our stock is compelling
5

©2017 Graphic Packaging International, Inc.
Key Financial Metrics
Adjusted EBITDA and EBITDA Margins Cash Flow from Operations (CFO), Capex, FCF
Dividends and Share Repurchases Net Debt/Adjusted EBITDA
6
(400)
(200)
0
200
400
600
800
2011 2012 2013 2014 2015 2016
US
$ M
CFO Capex FCF Capex Avg.
4.3
3.5 3.53.3
2.62.4
2.7
0.0
0.5
1.0
1.5
2.0
2.5
3.0
3.5
4.0
4.5
2010 2011 2012 2013 2014 2015 2016
Net
Deb
t/EB
ITD
A
Net Debt/Adjusted EBITDA
0
20
40
60
80
100
120
140
160
180
2014 2015 2016
US$,
M
Dividends Share Repurchases
15.8
% 17.8
%
10.0%
11.0%
12.0%
13.0%
14.0%
15.0%
16.0%
17.0%
18.0%
19.0%
$400
$450
$500
$550
$600
$650
$700
$750
$800
2011 2012 2013 2014 2015 2016 EB
ITD
A
Ma
rgin
s (%
)
EB
ITD
A
US
$ M
Adjusted EBITDA
Adjusted EBITDA (excluding divested business)
Adjusted EBITDA Margins
Adjusted EBITDA Margins (excluding divested business)

©2017 Graphic Packaging International, Inc.
Adjusted EBITDA Growth Algorithm
• Performance (productivity) is the key driver of our Adjusted EBITDA growth
• Acquisitions add to EBITDA and extend runway for further productivity gains
• We are focused on offsetting our commodity input costs with pricing over time
• 2016 was a difficult pricing year driving the negative change in price/commodity costs
• Over time, we continue to expect that pricing will offset commodity input costs
7

©2017 Graphic Packaging International, Inc.
Low Cost Mills
• 2 Virgin Paper Mills located near Southeast low cost pine wood baskets – Largest producer of CUK in
world at ~1.4M tons • 5 Recycled Mills located near
largest customers – Largest N. America
producer of CRB at ~1.0M tons
• Recent investments:
– Reduce energy footprint – Reduce chemical usage – Reduce water usage
• Generate ~1-2% growth annually from innovation
• Focused on consumer trends: – Sustainability – Specialty Brands – Convenience – Freshness – Healthier Choices
• Innovation centers world-wide
Innovative Cartons Efficient Converting
• 40+ Global Converting Plants
• U.S. National Accounts – Located close to mills to
minimize logistics costs
• U.S. Regional Accounts – Located close to customers
to optimize response time
• Europe – Acquired network of high
quality, low cost assets
Drives Long-Term EBITDA & Cash Flow
A Vertically Integrated Business Drives Cash Flow by Selling Folding Cartons to leading CPG companies
8
©2017 Graphic Packaging International, Inc.
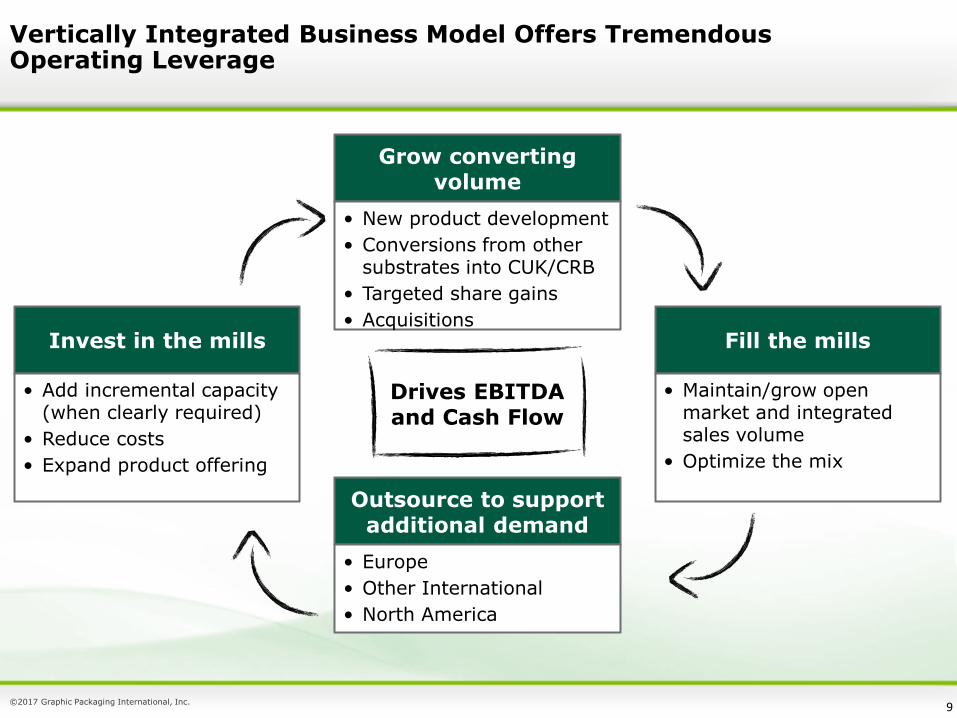
Vertically Integrated Business Model Offers Tremendous Operating Leverage
9
Outsource to support additional demand
Grow converting volume
• Europe
• Other International
• North America
• New product development
• Conversions from other substrates into CUK/CRB
• Targeted share gains
• Acquisitions Fill the mills
• Maintain/grow open market and integrated sales volume
• Optimize the mix
Invest in the mills
• Add incremental capacity (when clearly required)
• Reduce costs
• Expand product offering
Drives EBITDA and Cash Flow

©2017 Graphic Packaging International, Inc.
New Product Development (NPD)
Brand Building
10
Summary • NPD adds roughly $40-$50M to revenues per annum • GPK’s core volume has roughly been flat over the last 5-years as NPD and growth with new customers and in
new geographies offset the end-market trend in packaged food • NPD focus areas – Brand Building, Convenience, Food Service, Strength – substrate substitution opportunities
• Differentiate product on shelf • Substrate substitution
• Shrink wrap to CUK
Food Service
• Growing vertical • Substrate substitution
• SBS to CUK
Convenience
• Improved convenience features for customers • On the go consumption • Proprietary microwave technology
Strength
• Exposed to the Club Store channel • Substrate substitution
• Corrugated to CUK • Drives savings to CPG • Improved shelf appeal and convenience
features

©2017 Graphic Packaging International, Inc.
Recent North American Acquisitions Provide Profitable Growth Platform in Key Geographies and End Markets
Metro Packaging & Imaging
(Mar ’16) Wayne, NJ
• Combined 2016 Sales ~$450M
• Combined 2016 EBITDA of $54M
− Expected annual EBITDA of ~$70-80M in 12-24 months
• Added 11 folding carton facilities and a CRB mill
− Increased U.S. East Coast presence
− Extended reach in Western U.S., Canada and Mexico
− Integrated additional tons
− Broadened customer base
− Offering new and existing customers a wider range of products
• Gained outstanding leadership and a talented workforce
• Enabled closure of 3 higher cost, legacy facilities (Renton, WA; Piscataway, NJ; Menasha, WI)
RECENT ACQUISITIONS JAN 2015 – MAR 2016
Walter G. Anderson
(Feb ’16)
Hamel, MN
Newton, IA
Tijuana, Mexico
Monterrey, Mexico
G-Box (Jan ’16)
Cascades’ Norampac Mill (Feb ’15)
Cascades’ Norampac (Feb ’15)
Rose City (Jan ’15)
Carded Graphics (Oct ’15)
11

©2017 Graphic Packaging International, Inc.
Current European Manufacturing Footprint
12
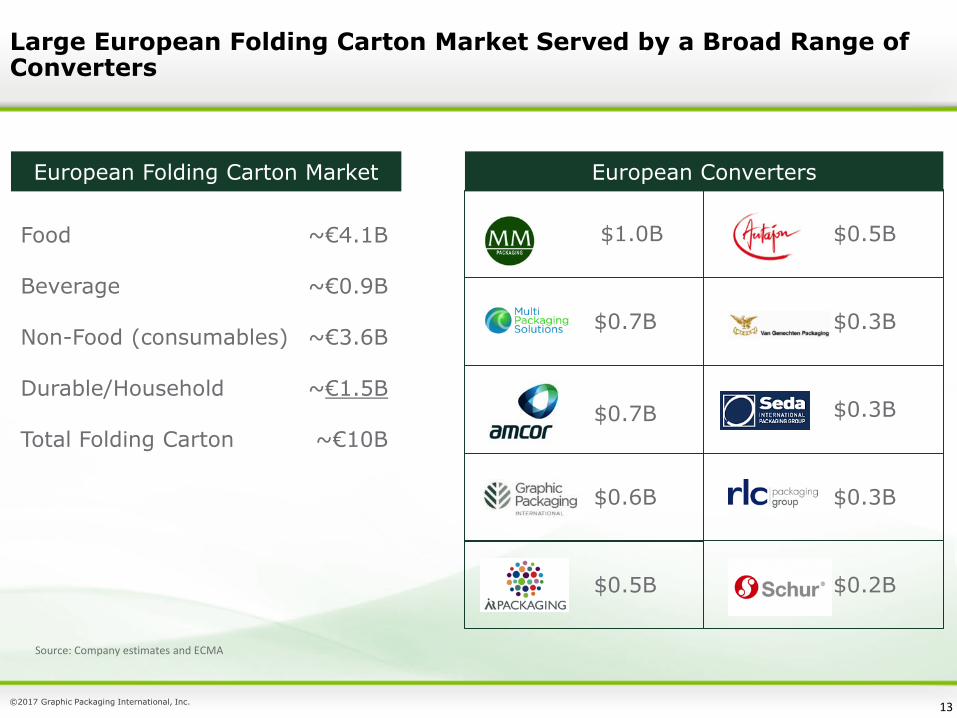
European Expansion by Applying our Successful North American Strategy into a Fragmented European Market
We have built a successful European business since December 2012:
– $600M Revenue base
• Low double digits EBITDA margins
• 11 plants convert ~300k tons per year
• Strong market positions in Beverage, Food, Convenience
– Significant opportunity to further consolidate market through acquisitions
• Large, stable, and steadily growing folding carton market, €10B
• No. 2 market share position, but less than 10% of the market
Folding Cartons Plants
©2017 Graphic Packaging International, Inc.
$1.0B
$0.7B
$0.6B
$0.5B
$0.3B
$0.3B
$0.2B
$0.7B
$0.5B
European Converters
$0.3B
European Folding Carton Market
Food ~€4.1B Beverage ~€0.9B Non-Food (consumables) ~€3.6B Durable/Household ~€1.5B Total Folding Carton ~€10B
Source: Company estimates and ECMA
Large European Folding Carton Market Served by a Broad Range of Converters
13

©2017 Graphic Packaging International, Inc.
Colorpak Acquisition Expanded Presence in Key Geographies and End Markets
• Enterprise Value of ~A$90M ($68M USD)1
• FY152 Sales of ~A$160M ($122M USD)1
• FY15 EBITDA of ~A$13M ($10M USD)1
− Expected to contribute $5-6M USD of EBITDA in 2016
• Run rate EBITDA of $11-13M USD in 12-24 months
• Three converting facilities
− Grows business in developed food and beverage end use markets
− Allows further expansion of proven integrated supply chain
− Better serves new and existing customers
− Compliments existing Australian Beverage business
14
COLORPAK ACQUISITION
Melbourne, Australia
Sydney, Australia
Auckland, New Zealand
1 Assumes an Exchange Rate of $0.76 USD per $1.00 AUD (Apr ’16 FX rate)
2 FY15 represents the Colorpak fiscal year July ’14 – June ‘15

©2017 Graphic Packaging International, Inc.
Capital Allocation Priorities
Key priorities
• Capital above baseline level ($200M) to generate compelling IRRs
• Acquisitions at ~5X post-synergy EV/EBITDA multiples vs. current ~8.0X FY2017 multiple
• Dividends
• Annual $0.20/share dividend announced on 2/4/15
• Recent 50% increase to $0.30/share
• Room for further growth
• Share repurchases
• Executing on $250M repurchase program authorized on 2/4/15
• $232M in shares purchased as of 12/31/16
• New $250M share repurchase program authorized in January 2017
• Track record of share repurchases
• Shares outstanding have declined by 19% since year-end 2011
• Optionality exists given reasonable leverage (2.76X) at end of 4Q2016
• Target leverage ratio is 2.5-3.0X
• Significant deleveraging through organic cash flow generation since 2008
Notes: (1) GPK Proforma assumes: $0.30/share dividend, annualized share repurchase of $140M, and the mid-point of GPK’s 2017E Cash Flow guidance of $380-$400M (2) Packaging Peers: ATR, AVY, BERY, BLL, BMS, CCK, SEE, SLGN, SON (3) Paper Peers include: IP, PKG, WRK Source: Company data, management estimate.
15
250.0
270.0
290.0
310.0
330.0
350.0
370.0
390.0
410.0
(350)
(300)
(250)
(200)
(150)
(100)
(50)
0
2012 2013 2014 2015 2016
Sh
are
s O
/S
US
$ M
Share Repurchase Shares O/S
17%
25%
21%
42%39%
0%
5%
10%
15%
20%
25%
30%
35%
40%
45%
GPK
(*FY2016)
GPK
Proforma
Packaging
Wgtd Avg
(FY2015)
Paper
Wgtd Avg
(FY2015)
S&P 500
Dividend/Cash Flow
Share Repurchases

©2017 Graphic Packaging International, Inc.
Appendix
16

©2017 Graphic Packaging International, Inc.
Strong Track Record of Capital Allocation and Compelling Valuation Multiple Compared to Packaging Peers
• Mid-to-high teens IRR on organic capital investments that drive spending above the baseline $200M level
• Post-synergy multiple of ~5X on completed acquisitions
• Recently increased dividend to annualized $0.30/share (2.2% yield); room to grow
• Establishing consistent share repurchase profile
• Since commencing $250M share repurchase on 2/5/2015 have repurchased $248M or 19M shares for ~$13/share, which is equivalent to ~6% of shares outstanding as of 4Q2014
• The share count has declined 19% since year-end 2011
• Compelling valuation multiple compared to Packaging peers
EV/EBITDA Multiple M&A – Since 2012
870
1,329
102170
0
200
400
600
800
1000
1200
1400
US
$,
M
10
8.5
5.1
0
2
4
6
8
10
12
Notes: EV/EBITDA Multiple Based on 2017 Consensus Estimates Source: Capital IQ
0.0
2.0
4.0
6.0
8.0
10.0
12.0
14.0
BLL SEE ATR AVY SLGN SON BERY BMS MPSX CCK GPK
17

©2017 Graphic Packaging International, Inc.
2017 Guidance
2016 Actual
2017 Guidance
– Cash Flow available for Net Debt Reduction, Dividends & Share Repurchase (before M&A/Capital Markets activity)
$358M $380-$400M
– Capital Expenditures $295M $250M
– Cash Pension Contributions $51M $30-$50M
– Pension Expense/(Income) (includes pension amortization)
$22M ($4M)
– Cash Taxes $15M $15-$25M
– Depreciation & Amortization (excluding pension amortization)
$299M $300-$320M
– Pension Amortization $28M $7M
– Interest Expense $77M $75-$85M
– Effective Tax Rate (Normalized) 35.6% 35-37%
– Year End Net Leverage Ratio 2.76x 2.5x-3.0x
18

©2017 Graphic Packaging International, Inc.
Food –~60% of Revenue
Strong competitive position
• High share across core CRB/SUS food market
• Strong track record of innovation
• Low cost converting network
• Optimized freight position
Markets are highly stable, but not growing
• Cereal, dry foods, frozen foods
Focus on outperforming tough end-market environment
• Brand building
• Convenience
• Food Service
• Strength
• Substrate substitution from corrugated, SBS to CUK
• Focus on mid-tier customers that are winning in the market place
• GPK’s volume flattish over the last 5-years, despite difficult end-market environment
Grow business through acquisitions
• Closed 6 acquisitions in N.A. over the last 18 months
• Acquisitions provide significant runway for cost savings via closure of higher cost assets
19

©2017 Graphic Packaging International, Inc.
Beverage –~30% of revenue
Strong competitive position
• Leading global market position across all paperboard multipack geographies
• ~80% of Global Beverage business is running on our machines
• ~40% of business is protected by proprietary innovation
Mature markets are stable with pockets of growth
• Big beer represents the majority of the portfolio
• Volume trended slightly positive in 2016
• Carbonated soft drink (CSD) volume continues to decline
• The pace moderated slightly in 2016
• Growth in other areas helping offset CSD decline
• Craft beer
• Sparkling water
• Ready-to-drink teas and energy drinks
• Other opportunities for growth
• Beer is growing globally with paperboard taking share from shrink, reflecting the premiumization trend globally
20

©2017 Graphic Packaging International, Inc.
Non-Food Consumer Products–~10% of revenue
Market exposure
• Selling into highly stable non-food consumer product end-markets
• Household products
• Pet care
• Laundry
• Personal care
• Non-food cartons highly complimentary to food cartons
• Strong track record of innovation
• Convenience features
• Substrate substitution
21

©2017 Graphic Packaging International, Inc.
Americas – Food, Beverage, Consumer Products ~82% of revenue
Current profile
• N.A (US + Canada), Mexico, Brazil represents about $3.5B in revenue
• N.A. is ~$3.3-3.4B
• Mexico and Brazil is ~$100-150M
• N.A.
• Leading market positions across the food, beverage, and household products verticals
• Established position in food-service
• Leader in innovation
• Low cost mill and converting network
• Optimized freight position for food in the US Midwest
• Dedicated plants for Beverage
• Mexico
• Recent G-Box acquisition expands footprint in Mexico beyond beverage and provides platform for further acquisitions
End-market exposure
• Food
• 60%
• Beverage
• 30%
• Household and Consumer Products
• 10%
22

©2017 Graphic Packaging International, Inc.
Europe – Food, Beverage, Consumer Products ~15% of revenue
Current profile
• Europe represents about $600M in revenue
• UK is about 50% and rest of Europe (primarily W. Europe) is 50%
• Achieved material margin improvement as Europe acquisitions Contego, A&R Carton, and Benson have been integrated – low double digits EBITDA margin vs. 4% in 2012
• On track to ship 150k+ tons of CUK to Europe in 2016, up from 90k into 2014
• No. 2 market share position in a fragmented market
• Significant opportunity to grow via M&A
Balanced end-market exposure
• Beverage
• 50%
• Food
• 20%
• Consumer Products
• 10%
• Convenience
• 10%
• Food Service
• 10%
23

©2017 Graphic Packaging International, Inc.
Rest of the World – Australia/Japan/China ~3%
Current profile
• Established positions in growing markets around the world
• Australia/New Zealand
• China
• Japan
• Majority of business is beverage, with strong market share positions
• Recent Colorpak acquisition expands footprint in Australia/New Zealand beyond beverage and provides platform for further acquisitions
• Potential for continued growth via bolt-on acquisitions
24

©2017 Graphic Packaging International, Inc.
Recession Resistant Model
Nearly 100% of revenue from defensive end-markets
• Food – 60%
• Beverage – 30%
• Consumer staples folding cartons – 10%
• North America – 80% of revenues
• Integrated mill to converting network
—Short paperboard tons on a global basis
What happened in 2009?
• Core paper folding carton volume was down 3.6% in 2009
• GPK’s Adjusted EBITDA was up $81 million yoy in 2009 to $556 million or 14%
— Altivity acquisition closed in March 2008 and added $26 million to EBITDA
— Excluding Altivity, EBITDA increased by $54 million yoy driven by positive price/cost spread, productivity, synergies realization
Adjusted EBITDA and Converting Volume
25
-6.0%
-4.0%
-2.0%
0.0%
2.0%
4.0%
6.0%
8.0%
10.0%
0.0
100.0
200.0
300.0
400.0
500.0
600.0
700.0
800.0
2008 2009 2010 2011 2012 2013 2014 2015
Yo
Y %
Ch
an
ge
US
$,
M
Adjusted EBITDA Net Tons Sold Y/Y % Chg.
Beverage,
30%
Food, 55%
Food
Service, 5%
Non-Food,
10%
End-Market Exposure
©2017 Graphic Packaging International, Inc. 26
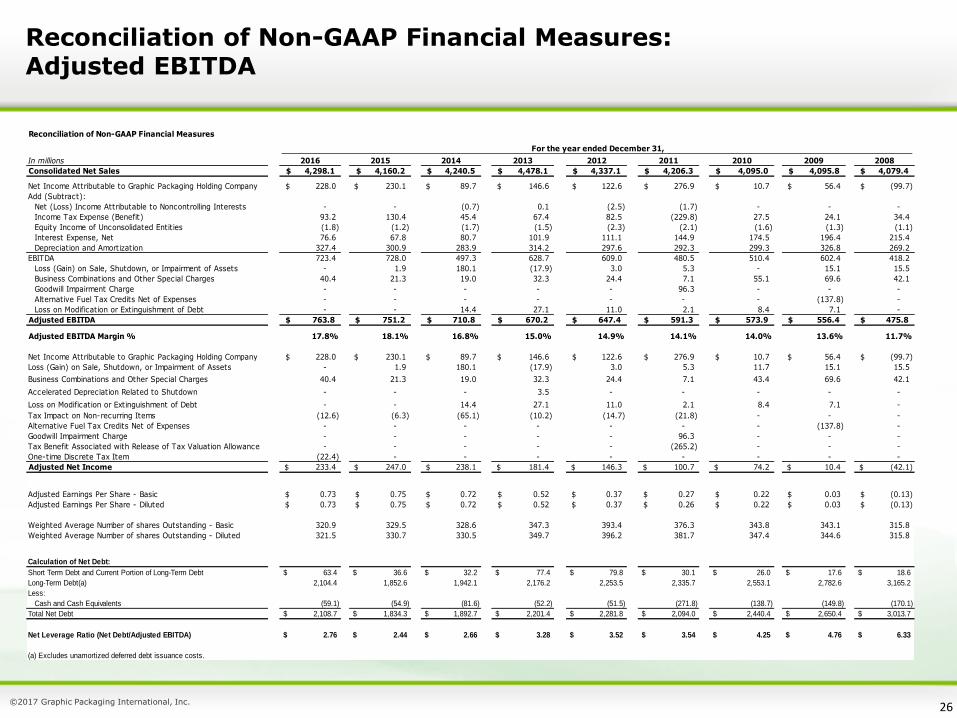
Reconciliation of Non-GAAP Financial Measures: Adjusted EBITDA
Reconciliation of Non-GAAP Financial Measures
In millions 2016 2015 2014 2013 2012 2011 2010 2009 2008
Consolidated Net Sales 4,298.1$ 4,160.2$ 4,240.5$ 4,478.1$ 4,337.1$ 4,206.3$ 4,095.0$ 4,095.8$ 4,079.4$
Net Income Attributable to Graphic Packaging Holding Company 228.0$ 230.1$ 89.7$ 146.6$ 122.6$ 276.9$ 10.7$ 56.4$ (99.7)$
Add (Subtract):
Net (Loss) Income Attributable to Noncontrolling Interests - - (0.7) 0.1 (2.5) (1.7) - - -
Income Tax Expense (Benefit) 93.2 130.4 45.4 67.4 82.5 (229.8) 27.5 24.1 34.4
Equity Income of Unconsolidated Entities (1.8) (1.2) (1.7) (1.5) (2.3) (2.1) (1.6) (1.3) (1.1)
Interest Expense, Net 76.6 67.8 80.7 101.9 111.1 144.9 174.5 196.4 215.4
Depreciation and Amortization 327.4 300.9 283.9 314.2 297.6 292.3 299.3 326.8 269.2
EBITDA 723.4 728.0 497.3 628.7 609.0 480.5 510.4 602.4 418.2
Loss (Gain) on Sale, Shutdown, or Impairment of Assets - 1.9 180.1 (17.9) 3.0 5.3 - 15.1 15.5
Business Combinations and Other Special Charges 40.4 21.3 19.0 32.3 24.4 7.1 55.1 69.6 42.1
Goodwill Impairment Charge - - - - - 96.3 - - -
Alternative Fuel Tax Credits Net of Expenses - - - - - - - (137.8) -
Loss on Modification or Extinguishment of Debt - - 14.4 27.1 11.0 2.1 8.4 7.1 -
Adjusted EBITDA 763.8$ 751.2$ 710.8$ 670.2$ 647.4$ 591.3$ 573.9$ 556.4$ 475.8$
Adjusted EBITDA Margin % 17.8% 18.1% 16.8% 15.0% 14.9% 14.1% 14.0% 13.6% 11.7%
Net Income Attributable to Graphic Packaging Holding Company 228.0$ 230.1$ 89.7$ 146.6$ 122.6$ 276.9$ 10.7$ 56.4$ (99.7)$
Loss (Gain) on Sale, Shutdown, or Impairment of Assets - 1.9 180.1 (17.9) 3.0 5.3 11.7 15.1 15.5
Business Combinations and Other Special Charges 40.4 21.3 19.0 32.3 24.4 7.1 43.4 69.6 42.1
Accelerated Depreciation Related to Shutdown - - - 3.5 - - - - -
Loss on Modification or Extinguishment of Debt - - 14.4 27.1 11.0 2.1 8.4 7.1 -
Tax Impact on Non-recurring Items (12.6) (6.3) (65.1) (10.2) (14.7) (21.8) - - -
Alternative Fuel Tax Credits Net of Expenses - - - - - - - (137.8) -
Goodwill Impairment Charge - - - - - 96.3 - - -
Tax Benefit Associated with Release of Tax Valuation Allowance - - - - - (265.2) - - -
One-time Discrete Tax Item (22.4) - - - - - - - -
Adjusted Net Income 233.4$ 247.0$ 238.1$ 181.4$ 146.3$ 100.7$ 74.2$ 10.4$ (42.1)$
Adjusted Earnings Per Share - Basic 0.73$ 0.75$ 0.72$ 0.52$ 0.37$ 0.27$ 0.22$ 0.03$ (0.13)$
Adjusted Earnings Per Share - Diluted 0.73$ 0.75$ 0.72$ 0.52$ 0.37$ 0.26$ 0.22$ 0.03$ (0.13)$
Weighted Average Number of shares Outstanding - Basic 320.9 329.5 328.6 347.3 393.4 376.3 343.8 343.1 315.8
Weighted Average Number of shares Outstanding - Diluted 321.5 330.7 330.5 349.7 396.2 381.7 347.4 344.6 315.8
Calculation of Net Debt:
Short Term Debt and Current Portion of Long-Term Debt 63.4$ 36.6$ 32.2$ 77.4$ 79.8$ 30.1$ 26.0$ 17.6$ 18.6$
Long-Term Debt(a) 2,104.4 1,852.6 1,942.1 2,176.2 2,253.5 2,335.7 2,553.1 2,782.6 3,165.2
Less:
Cash and Cash Equivalents (59.1) (54.9) (81.6) (52.2) (51.5) (271.8) (138.7) (149.8) (170.1)
Total Net Debt 2,108.7$ 1,834.3$ 1,892.7$ 2,201.4$ 2,281.8$ 2,094.0$ 2,440.4$ 2,650.4$ 3,013.7$
Net Leverage Ratio (Net Debt/Adjusted EBITDA) 2.76$ 2.44$ 2.66$ 3.28$ 3.52$ 3.54$ 4.25$ 4.76$ 6.33$
(a) Excludes unamortized deferred debt issuance costs.
For the year ended December 31,