title line roadmapping whole of health initiatives
TRANSCRIPT
Program Management Office
Title Line Document type/Sub heading
DD Month 20xx
[Presenter Name]
Program Management Office Program Management Office
Roadmapping Whole of Health Initiatives
Emma Malica, A/General Manager – NSW Health PMO
Melissa Willis, Manager PMO Partnerships – NSW Ambulance PMO
James Harrison, Project Officer – NSW Health PMO Wednesday 7th of December 2016

Program Management Office
What does the PMO Do?
1
RIGOROUS PROGRAM MANAGEMENT

Program Management Office
Project Management vs. Program Management
2
Program Management Project Management
Managing a single project Managing a portfolio of projects

Program Management Office
Exceptions-based Focuses on the critical issues requiring senior input and effort to resolve, not all activities
• Spotlights key risks to the realisation of benefits to ensure outcomes are delivered
Forward-looking Designed to maximise forward visibility of likely outcomes to ensure early, proactive management of risks
• Allows senior executive to take course-correcting actions, well before impacts are delivered
Objective Applies clear and consistent rules across whole program to limit subjectivity and debate and ensure senior effort focused on issues that matter
• E.g., consistent set of traffic lights rules
These principles inform the design of all aspects of RPM, from its overall philosophy to the underlying software and tools
Rigorous Program Management- The principles of RPM methodology:
3

Program Management Office 4

Program Management Office 5
Total Savings Profile
2014-15 2015-16 2016-17 2017-18 2018-19
Total Impact 635 1,905 3,640 3,640 3,640
Net one-time Impacts 635 1,905 - - -
Net ongoing Impacts - - 3,640 3,640 3,640
Ongoing - achieved current year - - 3,640 - -
Ongoing - achieved prior year - - - 3,640 3,640
Note: (1) "Ongoing - achieved current year" = pro-rata of ongoing impacts achieved for f irst time in current FY;
(2) "Ongoing -achieved prior year" = annualized ongoing impacts achieved in previous FYs
-
500
1,000
1,500
2,000
2,500
3,000
3,500
4,000
2014-15 2015-16 2016-17 2017-18 2018-19
$k
Ongoing - achieved prior year Ongoing - achieved current year Net one-time Impacts
2014-15 2015-16 2016-17 2017-18 2018-19
Total Impact 477 2,540 3,175 3,175 3,175
Net one-time Impacts - 1,905 - - -
Net ongoing Impacts 477 635 3,175 3,175 3,175
Ongoing - achieved current year 477 - 2,540 - -
Ongoing - achieved prior year - 635 635 3,175 3,175
Note: (1) "Ongoing - achieved current year" = pro-rata of ongoing impacts achieved for f irst time in current FY;
(2) "Ongoing -achieved prior year" = annualized ongoing impacts achieved in previous FYs
-
500
1,000
1,500
2,000
2,500
3,000
3,500
2014-15 2015-16 2016-17 2017-18 2018-19
$k
Ongoing - achieved prior year Ongoing - achieved current year Net one-time Impacts

Program Management Office
While a project may focus on one domain, it will have flow on effects to other domains…
6
Includes clinical and non-clinical
strategies.
An Improvement Project is any initiative which improves one domain of the Performance
Management Framework without negatively impacting
on the others.
Financial Performance
Safety and Quality
Improvement Projects
Patient Flow

Program Management Office
Public Health Organisations (LHDs and SHNs)
Engagement
7
NSW Health PMO
Ministry of Health
Supporting Entities
Management Accountants
Redesign Leads
Integrated Care Leads
Whole of Health Program
Integrated Care
Directors of Finance
eHealth
Ambulance NSW
Treasury
HealthShare
Clinical Coders
Clinical Staff
Nurse Unit Managers
WoHP Leads
Directors of Clinical Services
System Performance
Finance
ACI
CEC
HETI
Rostering Best Practice
Patient Flow Managers
Corporate Services
Pathology
Business and Asset Services
ABM Portal
Supporting Entities
Quality Managers

Program Management Office
So what are these Roadmaps, and how do we use them?
8
Drafting Roadmaps
Maintaining Roadmaps

Program Management Office
PAC 4 RAC Providing Appropriate Care for Residents in Aged Care
9

Program Management Office
Summary of the initiative
10
Roadmap overview
Objectives and key
metrics
To improve clinical outcomes for aged care patients by providing the most appropriate care for the presenting condition. For NSW Ambulance, Twilight Aged Care (TAC) and Northern Sydney LHD to collaboratively provide alternate and appropriate integrated healthcare options to best meet the healthcare needs of residents from TAC Facilities. By June 2017, the number of TAC residents transported via NSW Ambulance to emergency departments within NSLHD will be reduced by 25%. By June 2017, all agreed identified treatable conditions will be managed within RACF 50% of the cases. By June 2017, the number of “000” calls for NSW Ambulance for TAC residents will be reduced by 25%.
Financial background
and assumptions
The targeted 25% reduction in calls is predicted to lead to an overall XX% drop in attendances at TAC Facilities, saving $XX per call-out.

Program Management Office
Basics of Risk Mitigation and Stakeholder Engagement
11
Issues / risks to be
managed Mitigation Plan
Risks
Failure to call
when they should
Careful strategy of
education and
communication
Families still want
residents
transported
Open
communication
and consultation
with residents and
families
Group Engagement plan
Key
stakeholders
Staff at Twilight
Aged Care
Facilities
Meetings,
workshops,
newsletters
NSW Ambulance
paramedics
Email updates
NSLHD staff Email updates

Program Management Office
Key milestones set during planning
12
Milestone Milestone owner
Milestone
date
dd/mm/yyyy
Operational KPI Up (# or %)
Operational KPI Down (# or %)
Workshop to develop possible solutions conducted J. Tunhavasana 30/06/2016
Handover training and guide implemented J. Tunhavasana 30/08/2016
Roll out of changes to patient records completed C. Banister-Jones 30/08/2016
Bimonthly progress meetings initiated J. Tunhavasana 30/09/2016
Training of Twilight Staff Members completed C. Banister-Jones 30/10/2016
NSW Ambulance Responses to Twilight Aged Care
Facilities – September vs. Baseline data, % reduction J. Tunhavasana 31/09/2016 25
NSW Ambulance Responses to Twilight Aged Care
Facilities – October vs. Baseline data, % reduction J. Tunhavasana 31/10/2016 25
NSW Ambulance Responses to Twilight Aged Care
Facilities – November vs. Baseline data, % reduction J. Tunhavasana 30/11/2016 25
And onwards…
Program Management Office 13
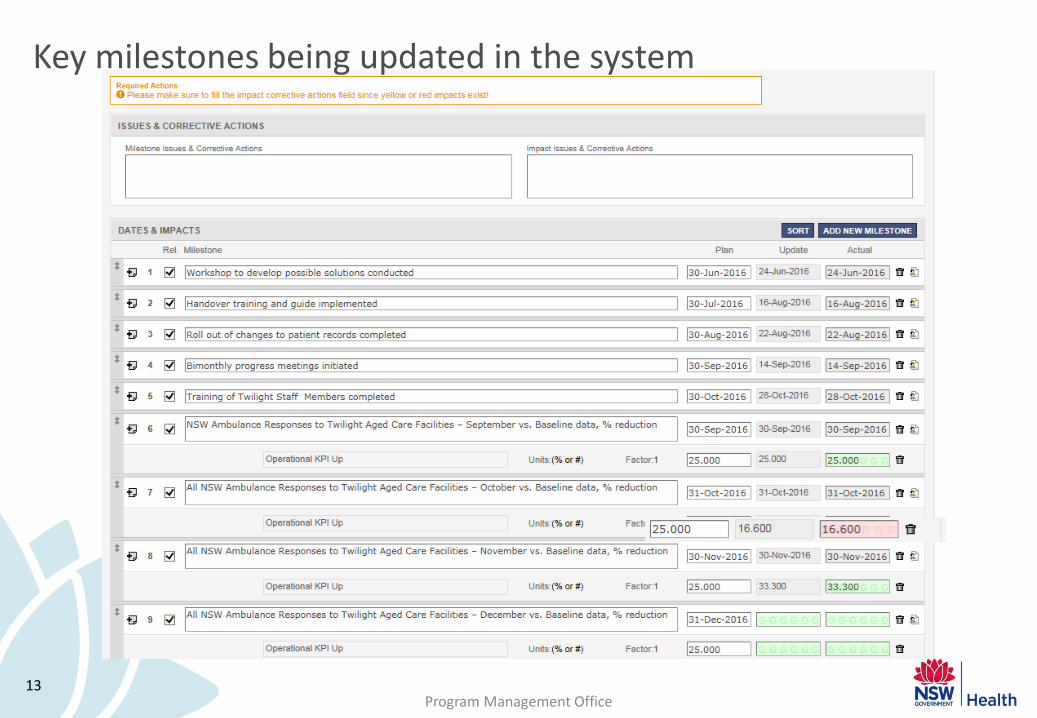
Key milestones being updated in the system

Program Management Office 14
Key milestones being updated in the system

Program Management Office
Measuring Program Impacts
15
Group Examples of metrics
Resources
• Revenue • Expenditure on a line item e.g., nursing staff, or
programme e.g., HITH or a subset of DRGs • FTEs, staffing hours • Overtime hours • No. of locums, locum hours • No. of bed days • No. of chargeable bed days
• Nursing time per bed day • No. or % of private hospital admissions • No. or % of private non-inpatients • Vol. drugs dispensed • No. of tests • Use of blood products • Equipment usage rates
Activity
• No. of admissions e.g., to hospital, to HITH, by source, by patient type.
• Admissions per consultant • No. of unplanned admissions • No. of avoidable admissions • Time in ED (ETP, Transfer of Care) • Hours in ICU • Average Length of Stay
• % beds with delayed discharge • Bed occupancy rates • Theatre utilisation rates • No. of recalls to radiology • No. of allied health interventions • Procedural rates • Home dialysis rates
Quality and safety
• % readmissions (e.g., within 14 or 28 days) • No. of adverse events/medical errors • Infection rates (e.g. MRSA, MRAB, CLAB) • No. of bed days due to medication errors • Mortality/morbidity rates by disease, patient cohort • Waiting time from referral to surgery • Waiting time in ED
• Uptake of a new service/care plan • % patients on a clinical pathway • % adherence to protocols • No. of days sick leave, sick leave payments • Patient satisfaction rates • Staff satisfaction rates
Program Management Office
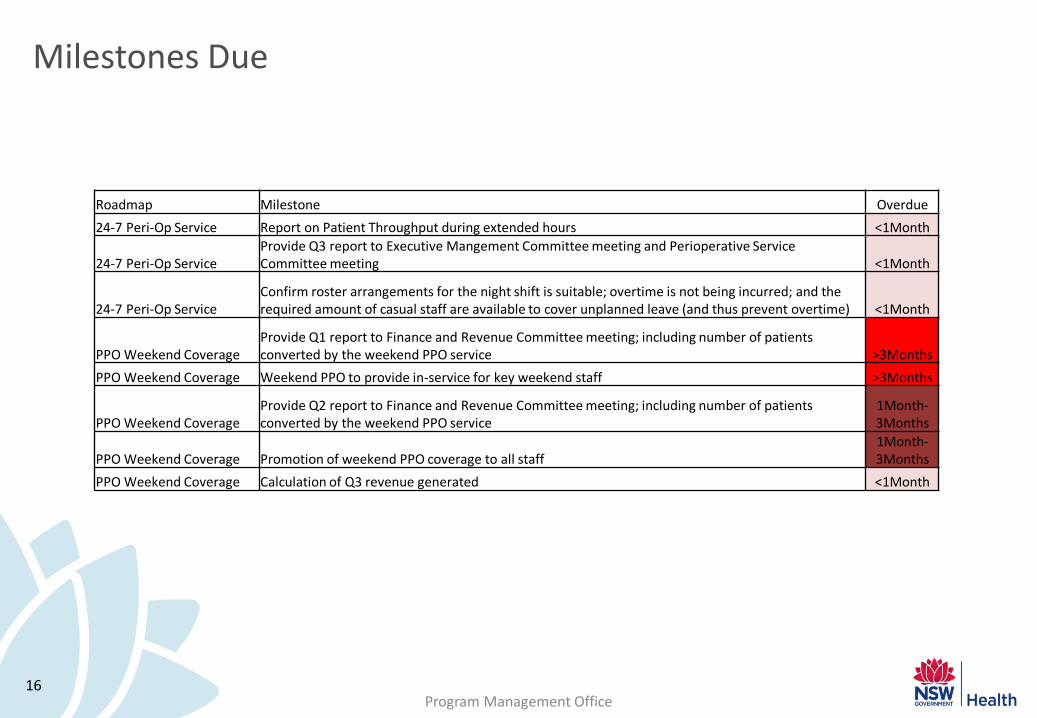
Milestones Due
16
Roadmap Milestone Overdue
24-7 Peri-Op Service Report on Patient Throughput during extended hours <1Month
24-7 Peri-Op Service Provide Q3 report to Executive Mangement Committee meeting and Perioperative Service Committee meeting <1Month
24-7 Peri-Op Service Confirm roster arrangements for the night shift is suitable; overtime is not being incurred; and the required amount of casual staff are available to cover unplanned leave (and thus prevent overtime) <1Month
PPO Weekend Coverage Provide Q1 report to Finance and Revenue Committee meeting; including number of patients converted by the weekend PPO service >3Months
PPO Weekend Coverage Weekend PPO to provide in-service for key weekend staff >3Months
PPO Weekend Coverage Provide Q2 report to Finance and Revenue Committee meeting; including number of patients converted by the weekend PPO service
1Month-3Months
PPO Weekend Coverage Promotion of weekend PPO coverage to all staff 1Month-3Months
PPO Weekend Coverage Calculation of Q3 revenue generated <1Month

Program Management Office
DICE tracks four elements critical to program success
17
The timeline or Duration either until completion of the project or the next learning checkpoint D
I The "Performance Integrity" of the project team
C The Commitment to the change by senior management and local staff
E The additional amount of local Effort (to normal working requirements) required during implementation
Highly successful
Highly unsuccessful
Act
ual
ou
tco
me
Mediocre
DICE scores
Win Worry Woe
7 8 9 10 11 12 13 14 15 16 17 18 19 20 21 22 23 24 25 26 27 28

Program Management Office
Executive and Board Reports
18

Program Management Office
Resources
19
RIGOROUS PROGRAM MANAGEMENT
Program Management Office 20
Find out who your local SuperUser is!