title how well is denmark doing against international...
TRANSCRIPT

Center for Macroecology, Evolution and Climate
University of Copenhagen
Title: How well is Denmark doing against international commitments for protected areas?Presenter: Professor Neil Burgess, CMECHead of Science – UNEP World Conservation Monitoring Centre
Department of Biology
C E N T E R F O R M A C R O E C O L O G Y E V O L U T I O N A N D C L I M AT ED E PA RT M E N T O F B I O L O G Y
U N I V E R S I T Y O F C O P E N H A G E N

Role of UNEP-WCMCMissionTo evaluate and highlight the many values of biodiversity and put authoritative biodiversity knowledge at the centre of decision-making
UNEP’s specialist Biodiversity Assessment Centre– Provide the data and information that supports decision-making– Strengthen capacity for biodiversity decision-making
Global mandate: United Nations List of Protected Areas “713 (XXVII). Establishment by the Secretary-General of the United Nations of a list of national parks and equivalent reserves.”www.unep-wcmc.org

2010 - CBD Cop 10 : Aichi Target 11By 2020, at least 17 per cent of terrestrial and inland water areas, and 10 per cent of coastal and marine areas, especially areas of particular importance for biodiversity and ecosystem services, are conserved through effectively and equitably managed, ecologically representative and well connected systems of protected areas and other effective area-based conservation measures, and integrated into the wider landscapes and seascapes.

Tracking progress towards protected area targets
CBD Aichi 2020 Biodiversity targetsMillennium Development GoalsRio +20 Sustainable Development Goals
• World Database of Protected Areas
• Registry of Indigenous and Community Conserved Areas
• Effectiveness of reserve management

In this talk we will cover....
• Protected Area coverage (land and sea)
• Protected Area effectiveness
• Evidence for protected areas delivering conservation outcomes (species and habitats)

1962UN List of National Parks and Equivalent Reserves
1981World Database on Protected Areas established
2003UN List Mandate Renewed and updated to include WDPA
2010ProtectedPlanet.netOnline data portal for WDPA
1975IUCN Categories system began to be developed
1994Six IUCN Categories published
2008Revised IUCN categoriespublished
2014World Parks Congress, Sydney? Updated UN List published? WDPA updated to include Management/Governance data? 2014 Protected Planet report
World Database of Protected Areas

Global Protected Area coverage
Target 17% of land and 10% of seaAchievement: 13% of land and c.2-3% of sea (205,000 sites)

22 April, 2013 8
Danish Dataset in the WDPA provided via Danish government and EEA
International sites

Denmark and Tanzania

Denmark Protected Area growth over recent decades
-
2.000,00
4.000,00
6.000,00
8.000,00
10.000,00
12.000,00
14.000,00
1990 2000 2010 2012
Are
a (k
m2)
Terrestrial
Marine
-
5,00
10,00
15,00
20,00
25,00
30,00
35,00
1990 2000 2010 2012Pe
rcen
tage
Years
Terrestrial
Marine

Attributes of Danish protected areas reserves within the WDPA
Assignment of reserves to IUCN PA categories How complete is the Danish data

Measurement of management input within reserves (PAME)
Common reporting format
Thousands of indicators
45 headline indicators
Diverse systems
Many data-sources
‘translation’ developed
WCPA Framework Elements
6 framework elements
Single database

What data do we have on reserves effectiveness?
Around 7,000 of 200,000 sites have been assessed

How are countries responding to CBD PAME targets?
44
47
30
16
64
60+ 30-59 10-29 1-9 No assessments
CBD - Global target 60% coverage. Only a few countries have met this. Mainly in Africa

Growth in number of PAs assessed in terms of PAME
• Decline in rate of new assessments 2009-2012 is an artefact of lack of data collection not lack of assessments
0
1000
2000
3000
4000
5000
6000
7000
8000
9000
10000
1991 1993 1995 1997 1999 2001 2003 2005 2007 2009 2011
Num
ber
of a
sses
smen
ts
Year of assessment
Total assessments known – 10,500

Are reserves effectively managed according to these data?
Global Study(4,151 assessments) European Study
(738 assessments)

Official Protected Area Management Effectiveness systems in Denmark
Are there any?
Map in European PA effectiveness study, 2010

Reserves assessed for PAME in Denmark
Assessment data submitted by BirdLife Denmark for 88 sites; CBD Target is 60% coverage of sites

What’s the point of PAME?
Outcome (Results)
Broad scale outcomes- Better land cover changes- Improve Biodiversity trends
-Detailed monitoring
- Linking protection to actual site results
Input Measures
Coverage- Where are we placing our PAs- How are we designing our PAs
--
Management effectiveness- What are we doing in the PAs- What are the threats to PAs

Evaluation of Danish management of biodiversity (spatial locations of reserves)
CMEC & Danish Economic Council2012CMEC 2005
CMEC & Danish Economic Council2001

Research on actions that deliver conservation outcomes
Species Habitats
Global meta-analysis by Jonas Geldmann; in press Biol Cons.

Could the success of Danish protected areas be evaluated?
Has this been done?
What data is there?
How might you do it?
Would it link to PAME data as well?
How would you determine ‘success’ or ‘failure’ compared with the ‘do nothing’ scenario
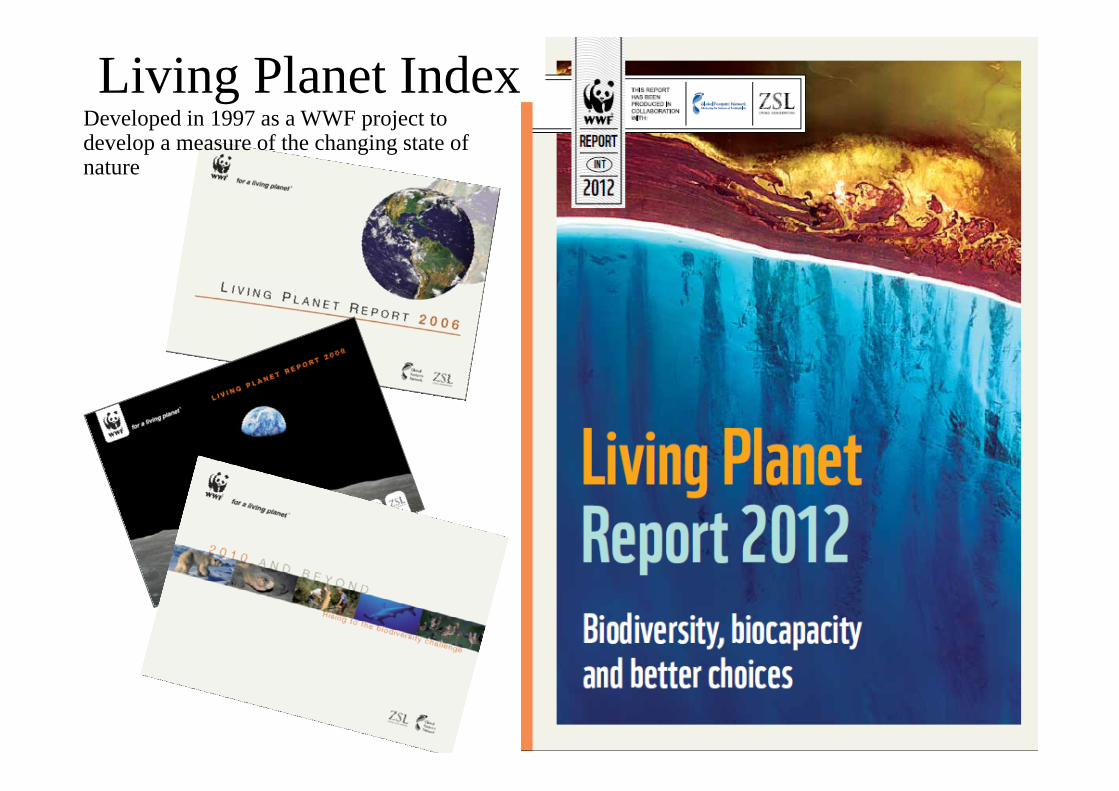
Living Planet IndexDeveloped in 1997 as a WWF project to develop a measure of the changing state of nature

Example data - Tipperne reserve trends in Vanellus vanellus from 1950s to 1990s
0,00
50,00
100,00
150,00
200,00
250,00
1 2 3 4 5 6 7 8 9 10 11 12 13 14 15 16 17 18 19 20 21 22
Pairs
Years (exact years removed)

Data to look at Danish Reserves effectiveness•Globally compiled (LPI) data
• Denmark : 19 time-series (18 birds and 1 grey seal)• Finland : 25• Greenland: 48• Iceland: 9• Norway: 185• Sweden: 18
•Are there other Danish tine series data within and outside protected areas?
•Where is that data stored?
•Is it accessible?•Is there effectiveness data as well (staff, budgets, management plans)
•Could a study systematically look at PA outcomes in Denmark compared to similar non protected land and considering the management inputs that have been made???

Conclusions-international perspective
• Denmark is meeting CBD PA coverage targets on land• And is also meeting them in the marine environment• There is bias in reserve location to marine and forests –
some other habitats not well represented (and species)• PAME will have to be reported within coming rounds to
CBD. Are systems in place in management authorities?• Are systems in place in NGOs?• Q1: Do reserves deliver more conservation than similar –
unreserved – land in Denmark?• Q2: Do better managed reserves do better than poorly
managed ones at delivering conservation outcomes?