title functional effects of distinct innervation styles of...
TRANSCRIPT

Title Functional effects of distinct innervation styles of pyramidalcells by fast spiking cortical interneurons
Author(s)Kubota, Yoshiyuki; Kondo, Satoru; Nomura, Masaki; Hatada,Sayuri; Yamaguchi, Noboru; Mohamed, Alsayed A.; Karube,Fuyuki; Lübke, Joachim; Kawaguchi, Yasuo
Citation eLife (2015), 4
Issue Date 2015-07-04
URL http://hdl.handle.net/2433/218637
Right
© Kubota et al. This article is distributed under the terms of theCreative Commons Attribution License, which permitsunrestricted use and redistribution provided that the originalauthor and source are credited.
Type Journal Article
Textversion publisher
Kyoto University

elifesciences.org
RESEARCH ARTICLE
Functional effects of distinct innervationstyles of pyramidal cells by fast spikingcortical interneuronsYoshiyuki Kubota1,2,3*, Satoru Kondo3,4, Masaki Nomura3,5†, Sayuri Hatada1,Noboru Yamaguchi1, Alsayed A Mohamed1,6, Fuyuki Karube1,3,9,Joachim Lubke7,8,10, Yasuo Kawaguchi1,2,3
1Division of Cerebral Circuitry, National Institute for Physiological Sciences, Okazaki,Japan; 2Department of Physiological Sciences, The Graduate University for AdvancedStudies, Okazaki, Japan; 3Core Research for Evolutional Science and Technology,Japan Science and Technology Agency, Tokyo, Japan; 4Department of MolecularPhysiology, Kyushu University, Fukuoka, Japan; 5Department of Mathematics, KyotoUniversity, Kyoto, Japan; 6Department of Anatomy and Embryology, South ValleyUniversity, Qena, Egypt; 7Institute of Neuroscience and Medicine, Research CentreJulich, Julich, Germany; 8Department of Psychiatry, Psychotherapy and Psychosomatics,Medical Faculty, RWTH/University Hospital Aachen, Aachen, Germany; 9Laboratory ofNeural Circuitry, Graduate School of Brain Science, Doshisha University, Kyotanabe,Japan; 10JARA Translational Brain Medicine, Julich/Aachen, Germany
Abstract Inhibitory interneurons target precise membrane regions on pyramidal cells, but
differences in their functional effects on somata, dendrites and spines remain unclear. We analyzed
inhibitory synaptic events induced by cortical, fast-spiking (FS) basket cells which innervate dendritic
shafts and spines as well as pyramidal cell somata. Serial electron micrograph (EMg) reconstructions
showed that somatic synapses were larger than dendritic contacts. Simulations with precise
anatomical and physiological data reveal functional differences between different innervation styles.
FS cell soma-targeting synapses initiate a strong, global inhibition, those on shafts inhibit more
restricted dendritic zones, while synapses on spines may mediate a strictly local veto. Thus, FS cell
synapses of different sizes and sites provide functionally diverse forms of pyramidal cell inhibition.
DOI: 10.7554/eLife.07919.001
IntroductionMicrocircuits of cerebral cortex are composed of excitatory pyramidal cells and different types of
GABAergic interneurons. Inhibitory circuits regulate cortical activity (Kubota et al., 2011b; Lee et al.,
2012; Kubota, 2014), development and plasticity (Hensch, 2005; Donato et al., 2013). Perturbed
inhibitory function is associated with pathologies including epilepsy, autism and schizophrenia
(Rubenstein and Merzenich, 2003; Gonzalez-Burgos et al., 2010). However, mechanisms controlling
inhibitory synaptic actions are incompletely understood. For instance, inhibitory synapses target
multiple membrane domains of pyramidal cells: soma, axon initial segment, dendritic shafts and
spines (Kisvarday et al., 1985; Kawaguchi and Kubota, 1998; Szabadics et al., 2006; Kubota et al.,
2007; Jiang et al., 2013). Contacts at these different sites produce inhibitory postsynaptic potentials
(IPSP) with different properties (Miles et al., 1996; Xue et al., 2014).
Recent data suggests IPSCs generated by FS basket cells may be matched to the level of
synaptic excitation in cortical pyramidal cells (Xue et al., 2014), and differ with target cell subtypes
*For correspondence: yoshiy@
nips.ac.jp
Present address: †Center for iPS
Cell Research and Application,
Kyoto University, Kyoto, Japan
Competing interests: The
authors declare that no
competing interests exist.
Funding: See page 23
Received: 03 April 2015
Accepted: 04 July 2015
Published: 04 July 2015
Reviewing editor: Marlene
Bartos, Albert-Ludwigs-
Universitat Freiburg, Germany
Copyright Kubota et al. This
article is distributed under the
terms of the Creative Commons
Attribution License, which
permits unrestricted use and
redistribution provided that the
original author and source are
credited.
Kubota et al. eLife 2015;4:e07919. DOI: 10.7554/eLife.07919 1 of 27

(Lee et al., 2014). Unitary inhibitory postsynaptic currents (uIPSCs) are significantly smaller in neurons of
Disc1 mice, a genetic model of depression, and may underlie reduced low-gamma oscillations in the
frontal cortex (Sauer et al., 2015). GABA receptors on spine heads are thought to control local synaptic
excitation (Chiu et al., 2013). However the structural basis for these effects remains unclear. Modeling
studies assume that somatic, dendritic shaft and spine inhibition is mediated by pre-synaptic elements
of identical size and strength (Gidon and Segev, 2012). In contrast, excitatory synaptic terminals vary in
size and their strength is correlated with terminal size (Holderith et al., 2012). We therefore examined
this point for cortical inhibition by correlating structural and functional properties of synapses of FS
basket cells on layer V (L5) pyramidal cells of rat frontal cortex. Physiological and anatomical data from
paired recordings let us simulate the dendro-somatic conduction of the effects of inhibitory synapses
made on different membrane sites on pyramidal cells. We show that synapses made by FS basket cells
on the soma and on dendritic shafts and spines have dramatically different functional effects.
Results
Double recordingCrossed-corticostriatal (CCS) ‘slender untufted’ pyramidal cells (Larkman and Mason, 1990
Morishima and Kawaguchi, 2006) are a discrete neuronal population in L5. We investigated
connections between FS basket cells and CCS pyramidal cells, identified by injecting a fluorescent
retrograde tracer into the contralateral striatum (Figure 1—figure supplement 1). IPSCs were evoked
in postsynaptic CCS pyramidal cell soma by single APs in FS basket cells (Figure 1—figure supplement
2). With pyramidal cell membrane potential maintained at −65 mV, IPSCs reversed on average at −52.5mV (Figure 1—figure supplement 2C), providing a mean driving force of 12.5 mV. After recording and
biocytin-filling, axonal and dendritic morphology and the number and distribution of possible synaptic
contacts from each coupled pair were analyzed (n = 10) using Neurolucida software (Figure 1B–E,G–I,
Figure 2A–D,F–I). Paired recordings were made from neighboring cells (Table 1, inter-somatic
eLife digest The brain contains millions of cells called neurons that communicate with one
another as part of complex circuits. To send information around these circuits, neurons ‘fire’
electrical signals along their length. These trigger the release of chemicals across a structure—known
as the synapse—that forms a connection with a neighboring cell. Different types of neurons affect
their neighbors in different ways. For example, signals from a pyramidal cell make it more likely that
the next cell in the circuit will fire, whereas a signal sent by an inhibitory interneuron has the opposite
effect. Pyramidal cells and interneurons make up the circuits in the brain’s outer layer—the cortex.
Despite their opposing roles, these cells share the same basic structure. Each consists of a cable-
like axon that can efficiently transmit electrical signals, and a cell body that contains the nucleus. The
cell body bears numerous short branches called dendrites, which are in turn covered in bump-like
protrusions called spines. Synapses typically form between the end of one cell’s axon and a dendrite
on another cell. However, synapses can also form between the end of an axon and an individual
dendritic spine, or the end of an axon and a cell body.
Models of inhibitory synapses—connections from interneurons that inhibit pyramidal cells—tend
to assume that these three types of connection are equivalent. However, Kubota et al. have now
combined electron microscopy with electrode recordings of the activity of pairs of connected cells to
show that the size and ability of inhibitory synapses to inhibit signaling varies depending on their
location. Specifically, inhibitory synapses that form with the cell bodies of pyramidal cells are larger
and inhibit signaling more strongly than those that form with dendrites, which are in turn larger and
more inhibitory than those on dendritic spines.
Thus, depending on the point at which an interneuron contacts a pyramidal cell, it can inhibit
signaling throughout the entire cell body, or only across a dendrite, or even just within a single
dendritic spine. Incorporating this information into computer models of the brain will improve how
accurately they simulate how the brain works. It will also help when modeling disorders in which
inhibitory networks are disrupted, such as schizophrenia and depression.
DOI: 10.7554/eLife.07919.002
Kubota et al. eLife 2015;4:e07919. DOI: 10.7554/eLife.07919 2 of 27
Research article Neuroscience
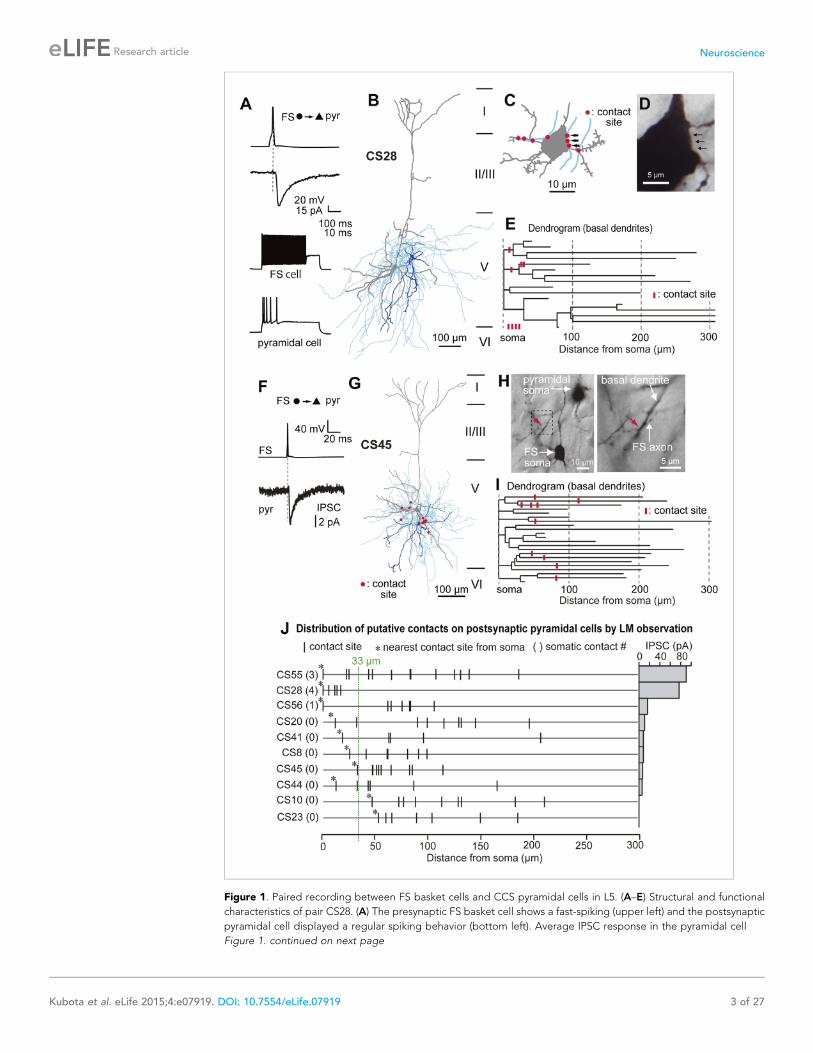
Figure 1. Paired recording between FS basket cells and CCS pyramidal cells in L5. (A–E) Structural and functional
characteristics of pair CS28. (A) The presynaptic FS basket cell shows a fast-spiking (upper left) and the postsynaptic
pyramidal cell displayed a regular spiking behavior (bottom left). Average IPSC response in the pyramidal cell
Figure 1. continued on next page
Kubota et al. eLife 2015;4:e07919. DOI: 10.7554/eLife.07919 3 of 27
Research article Neuroscience

distance: 44.5 ± 23.7 μm, 20.6–66.6 μm, n = 10). There was typically a large overlap of the basal
dendrites of postsynaptic pyramidal cells and the axonal arbor of presynaptic FS basket cells (Figure 1B,
G, Figure 2B,G, Figure 2—figure supplement 1). In three cell pairs, FS basket cell axons established
putative synaptic contacts on the soma and dendrites of a postsynaptic CCS pyramidal cell (Figure 1J,
upper three lines). In seven pairs, synaptic contacts were located exclusively on dendrites at various
distances from the soma (Figure 1J, lower 7 lines). The number of putative synaptic contacts was 5–14
(8.2 ± 4.8, 10 pairs). Most light microscopic contacts were made where FS basket cell axons crossed
basal pyramidal cell dendrites (Figure 1D,E,H,I, Figure 2D,I, Figure 3B) (Marlin and Carter, 2014). The
distance from the soma to dendritic contacts was 5.8–208.4 μm with a mean value of 82.5 ± 50.0 μm.
Peak IPSC amplitude was larger in pairs with putative somatic contacts than those when contacts were
exclusively dendritic (Figure 1J). Transmission never failed for pairs with somatic contacts but failures
occurred with dendritic contacts (Table 1). Mean IPSC amplitude, from pairs with only dendritic
contacts, was reduced at increasing distances from the soma to the nearest contact (Figure 1J). IPSCs
were not detected in two pairs, where light microscopy (LM) suggested 7 and 9 contacts were made at
distances further than 33 μm from the soma (Figure 1J, lower 2 lines). In each case the pyramidal cell
elicited large EPSC in the interneurons (Table 1).
We found large differences in IPSC amplitude evoked by FS cells in L5 pyramidal cells (Figure 1A,
F,J, Figure 2E,J). Large IPSCs were found in two pairs with somatic synaptic contacts. The size of
IPSCs in the other pair with somatic/dendritic contacts was smaller (Figure 1J). Higher numbers of
putative somatic terminals were correlated with larger synaptic events (Figure 2C,D,H,I). Thus the
number of intersections of the presynaptic FS cell axon fibers within 18 μm from somatic center were
larger in the pair CS55 with an IPSC of amplitude −91.3 pA than in pair CS56 where IPSC amplitude
was −17.3 pA (Figure 2—figure supplement 2).
Synapses identified by 3D reconstructions from serial EMgsThe number of synaptic terminals was verified and their size was measured using electron microscopy
(EM). Junctional size governs transmitter release probability (Holderith et al., 2012) and docking sites
(Pulido et al., 2015), with the number of postsynaptic receptors (Nusser et al., 1997; Tanaka et al.,
2005) which determines synaptic current amplitude. All putative synaptic contacts (Figure 2D,I) were
completely reconstructed from serial EMgs (Figure 3, Figure 3—figure supplement 1) for measure-
ment of synaptic junction and dendritic cross sectional areas. Similar data from sixty one dendritic
Figure 1. Continued
(bottom right) to a single action potential (AP) elicited in the FS basket cell (upper right). (B) Reconstruction of the
neuron pair. The somatodendritic domain of the presynaptic FS basket cell is shown in blue, the axonal arborization
in sky blue, and the somatodendritic domain of the postsynaptic pyramidal cell in gray. (C) Illustration showing the
number and distribution of putative synaptic contacts (red dots) established by the FS basket cell axonal collaterals
on the soma and proximal dendritic segments of the postsynaptic pyramidal cell. (D) LMg of the pyramidal cell soma
with its inhibitory synaptic contacts (arrows) illustrated in (C). (E) Dendrogram of the pyramidal cell basal dendrites
with putative contact sites (red bars). (F–I) Structural and functional characteristics of pair CS45. (F) Averaged IPSC in
the pyramidal cell in response to a single AP in the presynaptic FS basket cell. (G) Reconstruction of the cell pair.
Same color code as in (B) with putative synaptic contacts (red). Note that synaptic contacts were exclusively found on
dendrites. (H) Low power LMg of the cell pair showing a putative contact site on the basal dendrite of the pyramidal
cell (red arrow) by the FS basket cell axon at low (left panel) and high (right panel) magnification. (I) Dendrogram of
the basal dendrites of the pyramidal cell with ten LM-identified contact sites (red bars). (J) Summary diagram
showing the number and distribution of putative contacts established on postsynaptic pyramidal cell somata and
dendrites for all investigated pairs. The corresponding averaged IPSC peak amplitude is shown on the right. For the
last two pairs, no IPSCs were detectable despite the presence of LM-identified contact sites.
DOI: 10.7554/eLife.07919.003
The following figure supplements are available for figure 1:
Figure supplement 1. The CCS pyramidal cell in layer V identified by retrograde fluorescent tracer.
DOI: 10.7554/eLife.07919.004
Figure supplement 2. Physiological properties of IPSCs evoked in CCS pyramidal cells in L5.
DOI: 10.7554/eLife.07919.005
Kubota et al. eLife 2015;4:e07919. DOI: 10.7554/eLife.07919 4 of 27
Research article Neuroscience

segments (mean length 16.8 ± 6.8 μm) of the CS56 postsynaptic pyramidal cell and the entire soma of
the pyramidal cell (Figure 4) was also used in neuron simulations (Kubota et al., 2011a).
EM analysis let us verify possible synaptic contacts from LM. For the pair CS56, 3 of 7 possible contacts
were verified by EM, but no synaptic contact was made at 4 other potential sites (Figure 4). One putative
LM contact was resolved as three distinct en passant boutons (S1–S3 in Figure 5A–E) and another somatic
contact was detected only by EM (S4, Figure 5—figure supplement 1). The other two verified contacts
terminated on spine heads (Sp2, Sp3 in Figure 6A,C). One with a thin dendrite (D1 in Figure 5F,G,I,
Figure 6A,C) and nearby spine head (Sp1, Figure 5F–I, Figure 6A,C) were detected only by EM. The
junctional area of synapses made by single interneurons varied strikingly with the post-synaptic site that is
innervated. For somatic synapses junctional area was 0.194–0.350 μm2, it was 0.102 μm2 for synapses with
dendritic shafts and 0.042–0.056 μm2 for synapses onto spine heads (Figure 6F, Table 2). Axonal bouton
volume was linearly correlated with synaptic junction area (Figure 6—figure supplement 1A).
Fourteen potential contacts, 3 at somatic and 11 at dendritic sites, were identified by LM for the
pair CS55 (Figure 2I). Complete EM reconstruction of the post-synaptic soma let us explore sites
obscured in LM where axon crossed the soma (Figure 5J–N, Figure 5—figure supplement 2) and
revealed 13 synaptic contacts (S1–S13, Figure 5K-N, Figure 6B,E,G). Eight terminals made onto
dendrites and spine heads less than 33 μm away from the soma presumably contributed to the
somatic IPSC (Figure 5J, Figure 6B,D,E,G). Three dendritic shaft synapses (D5–D7), were located
further than 33 μm from soma. Two potential LM contacts showed 2 synaptic contact sites, each. Four
potential LM contacts were discounted from EM data (Figure 5—figure supplement 3), 2 potential
LM contacts were not analyzed by EM (Figure 6E), and 4 synapses were only evident in EM. 3D EM
reconstructions of all synapses (CS55 and CS56) showed that synaptic area was larger for somatic than
dendritic contacts (Figure 6F,G, Table 3) and decreased continuously with distance from the soma.
Numbers of synaptic contacts were defined for two further neuron pairs, CS44 and CS23, by serial
EMgs (Figure 1J). In the CS44 cell pair the closest confirmed synaptic contact was 32 μm distant from
the soma, consistent with the inverse relation between synapse distance from the soma and the peak
IPSC amplitude (Figure 6E). In pair CS23, EM verified five dendritic synaptic contacts with the nearest
contact site 53 μm from the soma. Physiological analysis revealed the connection was nearly silent
(Figure 6E). IPSCs induced by single FS interneurons at dendritic shaft synapses at 32 μm from soma
(CS44) were detected with a somatic electrode, but with our recording configuration, IPSCs
generated by terminals at 47 μm (CS10) and 53 μm (CS23) from the soma were not detected.
Three types of FS basket cell innervation can then be distinguished. Multiple synapses made with
the soma or proximal dendrites of L5 CCS pyramidal cell produce large IPSCs, weaker somatic and
proximal dendritic innervation produce intermediate IPSCs, while IPSCs are small or absent when
synapses terminate exclusively on dendrites. From all paired records, 28.4 ± 7.6% (17.2–43.1%) of FS
interneuron terminals contacted cell somata (Figure 5, Figure 5—figure supplement 3A, Table 4),
consistent with previous data (Karube et al., 2004). We note that an FS cell that innervates only
dendrites of one L5 pyramidal cell, may contact somatic sites of other postsynaptic neurons (Figure 7).
Simulation analysis of IPSC conductionExcitatory synaptic currents are correlated with synaptic size (Holderith et al., 2012). At larger
synaptic junctions, Ca2+ entry into presynaptic terminals is greater, transmitter release probability is
increased (Holderith et al., 2012) and the number of postsynaptic receptors is larger (Nusser et al.,
1997). We tested this relation for inhibitory transmission by comparing summed synaptic junction area
with maximal IPSC amplitude for pairs CS56 and CS55. Maximal IPSCs (Table 5) were assumed to
occur when all somatic and proximal dendritic terminals (<33 μm) (Figure 5A–E) released transmitter.
The unit electrical charge was calculated as the maximum charge divided by the summed junction area
of S1–S4: 326.1 fC/0.95 μm2, or, 343.3 fC μm−2 for pair CS56, and S1–S13, D1–D4, Sp1–Sp4: 1057.8
fC/3.011 μm2, or 351.3 fC μm−2 for pair CS55 (Table 6). This parameter was similar for the two
connections, suggesting that currents are well correlated with synaptic junction area. Thus at these
inhibitory synapses, conductance can be calculated from junctional area based on the unit IPSC
electric charge using morphologically realistic CS56 postsynaptic pyramidal model cell based on our
measurement of the cell dimensions (see ‘Materials and method’, Table 2).
Inhibitory synaptic connections made by FS basket cell axons terminate on the soma, dendritic
shafts or spines of L5 CCS pyramidal cells (Kubota et al., 2007). We asked how these differences in
Kubota et al. eLife 2015;4:e07919. DOI: 10.7554/eLife.07919 5 of 27
Research article Neuroscience

Figure 2. Different unitary IPSCs induced by single FS basket cells in L5 CCS pyramidal cells. (A) Pre-synaptic basket
cell and post-synaptic pyramidal cell. Light micrograph (LMg) of the CS56 pair. (B) Reconstruction of pyramidal cell
soma-dendrites (blue) and axon (sky blue), basket cell soma-dendrites (red) and axon (pink). (C) Close-up of the
pyramidal cell soma. Scale, 10 μm. (D) Putative synaptic contacts (blue bars) shown on dendrogram including basal
(gray) and apical (sky blue) dendrites. (E) Maximum (upper) and averaged (lower) IPSCs evoked by single FS basket
cell spikes. (F) Pre-synaptic basket cell and post-synaptic pyramidal cell. LMg of CS55 pair. Scale is as in A.
(G) Reconstruction. Scale is as in B. (H) Close-up of the pyramidal cell soma. (I) Dendrogram with putative synaptic
contact sites (blue bar). (J) Maximum (upper) and average (lower) IPSCs evoked by single FS basket cell APs. Scale is
as in E.
Figure 2. continued on next page
Kubota et al. eLife 2015;4:e07919. DOI: 10.7554/eLife.07919 6 of 27
Research article Neuroscience

synaptic site and junctional size affect function in simulations based on our measurements of synaptic
currents and dimensions. IPSC propagation was examined on an electrotonic simulation of the
pyramidal cell from pair CS56. Injecting a 0.11 nS current on the spine head of Sp1 (Table 2) resulted
in a strong 0.78 mV hyperpolarization of the spine, but only 0.12 mV was transmitted to the basal
dendrite and 0.07 mV to the soma (Figure 8A,C,K). The peak synaptic current was 1.27 pA at the
spine head, and 0.81 pA at the soma (Figure 8B). At noise levels of ∼10 pA (Figure 1—figure
supplement 2B), a spine-head IPSC would not be detected at the soma. The spine neck effectively
isolated the spine head from the dendritic shaft (neck length, 0.5 μm; diameter, 0.07 μm; volume,
0.043 μm3; resistance, 500 MΩ [Harnett et al., 2012]). Thus spine inhibition did not change nearby
dendritic shaft or somatic potential (Araya et al., 2006). In contrast, injecting a 0.21 nS synaptic
current on the dendritic shaft (D1) (Table 2) caused a hyperpolarization of 0.23 mV on the shaft and
Figure 2. Continued
DOI: 10.7554/eLife.07919.006
The following figure supplements are available for figure 2:
Figure supplement 1. Drawings of the paired recording between FS basket cells and CCS pyramidal cells in L5.
DOI: 10.7554/eLife.07919.007
Figure supplement 2. Sholl analysis of presynaptic FS basket cell axon to postsynaptic CCS pyramidal cell soma center.
DOI: 10.7554/eLife.07919.008
Table 1. Synapse properties of pair recordings
Amplitude (pA)
Success rate Neurolucida analysis Distance from soma (μm)mean sd max
IPSC
CS4 −5.7 5.1 −19.5 0.6
CS8 −8.6 4.0 −17.6 0.5 yes 48.8
CS20 −10.9 5.3 −27.4 0.9 yes 51.8
CS21* −7.6 3.2 −17.8 0.6
CS22* −8.0 3.4 −14.5 0.6
CS28 −76.9 20.9 −107.3 1.0 yes 48.8
CS36* −6.5 2.6 −12.5 0.4
CS41 −8.6 4.3 −20.8 0.7 yes 41.3
CS44 −6.2 2.1 −12.6 0.5 yes 66.6
CS45* −7.1 4.1 −21.2 0.7 yes 53.2
CS55 −91.3 11.2 −111.0 1.0 yes 35.8
CS56 −17.3 3.0 −24.9 1.0 yes 20.6
CS61 −9.6 4.6 −22.2 0.8
CS62 −36.4 14.0 −69.5 1.0
EPSC
CS10 67.5 22.2 109.3 1.0 yes 26.5
CS21* 18.6 8.7 44.5 0.9
CS22* 70.9 38.3 201.6 1.0
CS23 45.3 14.2 83.4 1.0 yes 51.2
CS36* 4.4 1.0 6.5 0.5
CS45* 43.1 19.0 86.1 1.0 yes 53.2
*Reciprocal connection between FS and pyramidal cell was observed.
DOI: 10.7554/eLife.07919.009
Kubota et al. eLife 2015;4:e07919. DOI: 10.7554/eLife.07919 7 of 27
Research article Neuroscience

0.13 mV at the soma (Figure 8D,F,K). The spine
head Sp1 was hyperpolarized without attenua-
tion (Harnett et al., 2012), while the D1 synapse
reached only 30% of the Sp1 synapse peak
membrane potential. The peak synaptic current
was 2.45 pA at the spine head, and 1.55 pA at
the soma (Figure 8E). Injecting a synaptic wave-
form of 0.71 nS at the soma (S1) (Table 2)
hyperpolarized that site by 0.48 mV (Figure 8G,
H) resulting in an IPSC of 8.29 pA (Figure 8H), in
the range of background noise. Simultaneous
activation of somatic contacts S1–S4 resulted in
a hyperpolarization of 1.33 mV, corresponding to
a somatic current of 22.67 pA, (Figure 8I,J)
similar to IPSP amplitudes from paired recordings
of FS basket cells to hippocampal pyramidal cells
(0.5–3 mV) (Buhl et al., 1994) and our own data
(Figure 2E, Table 5). Thus for a similar driving
force, proximal inhibitory synapses produce
larger somatic hyperpolarizations than distal
ones (Figure 8K).
Spines innervated by inhibitory synapses are
typically excited by thalamic inputs (Kubota
et al., 2007). We modeled the Sp1 spine to ask
how spine-head IPSCs affect these excitatory
thalamic signals (Gulledge et al., 2012). Excit-
atory synaptic events (0.2 nS) were greatly
reduced by a coincident spine-head IPSC
(Figure 8L). Excitation of the spine-head site
depolarized the pyramidal cell soma by 0.12 mV.
Simulated release from four somatic inhibitory
synaptic sites hyperpolarized the soma by 1.33
mV. Thus inhibition from clustered somatic
synapses of one FS basket cell effectively sup-
pressed dendro-somatic conduction of inputs
from ∼11 excitatory spine synapses. If release
probability depends on terminal size (Holderith et al., 2012), then GABA may be infrequently
liberated from smaller inhibitory terminals made by FS basket cells at dendritic sites. Since inhibitory
synapses from a single cell usually contact different, distant dendrites, resulting hyperpolarizations
may sum poorly (Figure 9). Even so, summation of integrated dendritic signals during inhibitory cell
firing at frequencies of 40–50 Hz (Isomura et al., 2009) together with GABAergic shunting effects
(Gidon and Segev, 2012) may permit FS cell synapses to suppress excitatory inputs on innervated
dendritic branches (Cossart et al., 2001). Diffusely located inhibitory terminals on dendritic shafts
can therefore effectively control afferent excitatory signals.
Variation in release from single synaptic boutons contributes to event-by-event fluctuations in post-
synaptic currents (Sasaki et al., 2012). IPSC amplitude varied substantially between trials in all dual
recordings (Figure 8N,O, Table 5). Monte Carlo simulations were made on the model of pair CS56 to
ask whether this variability might result from probabilistic IPSC generation at somatic terminals, S1–S4
(Figure 8P). Mean IPSC charge transfer was 193.1 fC ± 56.2 (89.9–326.1 fC, n = 60 traces; Table 5),
with putative electric charge at somatic synapses calculated by multiplying junctional size by unit
electrical charge, S1–S4 to give 120.1, 59.7, 66.6 and 79.6 fC respectively (Table 2). Release
probability (0.59) was obtained by dividing the average electrical charge, 193.1 fC, by the maximum
charge, 326.1 fC (Table 5). Somatic synapses were activated randomly with release probabilities
correlated with junctional area (S1: 0.8. S2: 0.4, S3: 0.45, S4: 0.55) (Figure 8—figure supplement 1)
(Holderith et al., 2012). IPSC charge distributions from paired recordings and simulations were
statistically similar (p = 0.41 Kolmogorov–Smirnov, Figure 8N,P), suggesting that IPSC amplitude
Figure 3. 3D reconstruction from serial EMgs.
(A) Neurolucida reconstruction of the postsynaptic pyra-
midal cell of the CS56 pair. A dendritic segment (C1) is
given in red and marked by red arrow. (B) Corresponding
LMg of the dendritic segment C1 (focus stack image). The
FS basket cell axon terminal is indicated by arrow.
(C) EMgs from three adjacent ultrathin sections of
segment C1. (D) 3D reconstruction of the dendritic
segment C1. The FS basket cell axon (red) did not
establish a synaptic contact with the dendritic segment
C1 (red arrow). Scale bar in (B) is the same for (D).
DOI: 10.7554/eLife.07919.010
The following figure supplement is available for figure 3:
Figure supplement 1. Focus step images for C1
dendritic segment with FS cell axonal fiber contact site
shown in Figure 2B.
DOI: 10.7554/eLife.07919.011
Kubota et al. eLife 2015;4:e07919. DOI: 10.7554/eLife.07919 8 of 27
Research article Neuroscience

variations result from an independent, stochastic activation of individual somatic and proximal
synapses (Sasaki et al., 2012).
General principle of cortical inhibitory connectionsWe suggest that FS cell inhibitory synaptic strength is progressively reduced from terminals
contacting the soma to dendritic shafts and then spines of target pyramidal cells. We asked whether
this represents a general principle for cortical inhibitory connections by comparing synapses made by
different classes of cortical interneurons stained using the whole cell recording method (Figure 10A)
(Kubota et al., 2007). 3D reconstruction of serial EMgs let us calculate synaptic junction area and the
cross sectional area of postsynaptic dendrite or spine volume, for 305 synapses made by 9 different
types of interneuron. The junctional area of somatic inhibitory synapses was 0.40 ± 0.15 μm2 (n = 23),
Figure 4. Dendritic segments and the somatic region selected for further quantitative EM analysis. Dendrogram of the apical (left) and basal (right)
dendrites of the postsynaptic pyramidal cell of pair CS56. Dendritic segments indicated by red circles and numbers and the somatic region (inset grey
drawing) were selected and analyzed in serial ultrathin sections at the EM level. In this pair seven synaptic contact sites were identified at the light
microscopic level (C1–C7).
DOI: 10.7554/eLife.07919.016
Kubota et al. eLife 2015;4:e07919. DOI: 10.7554/eLife.07919 9 of 27
Research article Neuroscience

Figure 5. EM identification of synaptic contacts. (A) LMg of putative synaptic contacts (white arrows) established by a basket cell axon on the soma of
a pyramidal cell of CS56. (B–D) EMgs of three somatic synaptic contacts (S1–S3). Thick arrows indicate synaptic junctions, small arrows the extremities of
the synaptic cleft. (E) The upper view is a 3D reconstruction of somatic synapses (red) on the soma (green) in the same plane as in (A), the middle image,
rotated by 90˚, shows three boutons apposed to the pyramidal cell soma and the lower view shows their synaptic junctions. (F) LMg of putative synaptic
contacts on a pyramidal cell dendrite. (G) EMg of synapses with a dendritic spine (Sp1, upper left arrow) and dendritic shaft (D1, bottom right arrow) 40˚
tilting angle. (H) EMg of the spine synapse in G (arrow). (I) 3D reconstructions of the synapses in (G). Lower left image shows the dendritic segment
indicated by arrows in (F). Middle view, rotated by ∼60˚, shows the junction made with the spine (red). Right image is rotated by ∼ −90˚ to visualize the
junction on the dendrite. (J) Focus stack image of LMg of putative contacts (arrows) made by basket cell axonal terminals on a pyramidal cell soma and
dendrites of CS55. (K, L) EMgs of the S6 (K) and S7 (L) somatic junctions. (M, N) Two views of a 3D reconstruction of a FS cell axon (red) and pyramidal cell
soma (green) showing all contacts. (at, axon terminal; sp, spine; dend, dendrite).
DOI: 10.7554/eLife.07919.012
The following figure supplements are available for figure 5:
Figure supplement 1. Somatic synapse contact sites identified using electron microscopic observation.
DOI: 10.7554/eLife.07919.013
Figure supplement 2. Focus step images for CS55 pair neurons shown in Figure 3J.
DOI: 10.7554/eLife.07919.014
Figure supplement 3. The presynaptic FS basket cell axon terminal crosses the postsynaptic pyramidal cell CS55 dendrite.
DOI: 10.7554/eLife.07919.015
Kubota et al. eLife 2015;4:e07919. DOI: 10.7554/eLife.07919 10 of 27
Research article Neuroscience

for dendritic shaft synapses it was 0.19 ± 0.12 μm2 (n = 195) and for synapses terminating on spines it
was 0.09 ± 0.05 μm2 (n = 87). Synaptic junctional area was therefore correlated with the size of the
target structure (Figure 10B–L) with the possible exception of Martinotti cell terminals (Figure 10J)
that contact distal pyramidal cell dendrites (Silberberg and Markram, 2007). Linear relations between
synapse junction and post-synaptic target size (Figure 10B–L) may provide an effective impedance
matching (Kubota and Kawaguchi, 2000) and thus control the inhibitory efficacy at different sites.
Thus the variation in effects of FS basket cell synapses targeting different membrane regions on L5
pyramidal cells may reflects a general principle for inhibitory cortical circuits.
DiscussionThese data show that FS basket cells mediate either a global somatic inhibition of variable strength,
a local dendritic shaft inhibition or act as a local veto at single spines. These distinct effects depend on
differences in junctional size. Local spine or shaft potential changes are small and locally restricted.
In contrast, somatic inhibitory currents are large, and summation of events from several somatic
terminals produces a global control of pyramidal cell excitation. Somatic junctions have large areas,
suggesting high release probability (Holderith et al., 2012) and typically contact multiple sites
(Buhl et al., 1994). This enhances the likelihood of simultaneous release as FS cells fire repetitively at
30–50 Hz during motor behaviors in vivo (Isomura et al., 2009). Some FS basket cell connections with
Figure 6. Synapse contact sites identified by EM observation of pairs CS56 and CS55. (A, B) Synaptic contact sites are shown in drawings of CS56 pair
neurons (A) and CS55 pair neurons (B). Postsynaptic pyramidal cell soma and dendrites are in blue, presynaptic FS basket cell soma and dendrites are in
red, and axon in pink. (C, D) The synapse contact sites are shown in dendrograms of the basal dendrites of postsynaptic pyramidal cell of CS56 pair (C) and
CS55 pair (D). (E) Distribution of putative synaptic contacts (black bars) made by single basket cells on somato-dendritic membrane of 10 pyramidal cells.
Contacts confirmed by EM are shown in red. (F, G) Area of somatic synaptic junctions is significantly larger than those on dendritic shafts and spines of
CS56 pair neurons (F) and CS55 pair neurons (G).
DOI: 10.7554/eLife.07919.017
The following figure supplement is available for figure 6:
Figure supplement 1. Linear correlation of synapse junction area and bouton volume.
DOI: 10.7554/eLife.07919.018
Kubota et al. eLife 2015;4:e07919. DOI: 10.7554/eLife.07919 11 of 27
Research article Neuroscience

pyramidal cells involved exclusively dendritic sites while others consisted of both peri-somatic and
proximal dendritic contacts. Spines receiving inhibitory synapses are typically large (Kubota et al.,
2007) and their thalamic excitatory inputs presumably express both NMDA and AMPA receptors
(Matsuzaki et al., 2004; Kubota et al., 2007). Inhibitory synapses may then efficiently veto these
thalamic inputs before activation of NMDA receptors (Gulledge et al., 2012) so reducing the
probability of pyramidal cell firing.
In paired recordings IPSCs were detected only for terminals that contacted proximal pyramidal cell
dendrites. However, IPSCs initiated on distal dendrites have been recorded at the soma in some studies
(Silberberg and Markram, 2007; Jiang et al., 2013). Possibly differences in experimental paradigm are
responsible. In this work post-synaptic potentials were more hyperpolarized (−65 mV rather than −55/−57 mV) and Cl− in the recording pipette was higher (19 rather than 10 mM) than in other studies. Both
differences would encourage somatic propagation of IPSPs initiated at distant dendritic sites. In our
somatic recordings we did not detect IPSPs generated at synapses more distant than ∼40 μm. Possibly,
the Cl− reversal potential was similar to the holding potential resulting in a small or null driving force at
these sites. Indeed unperturbed Cl− reversal potentials may be 10–25 mV more hyperpolarized than in
invasive whole-cell recordings (Verheugen et al., 1999; Bevan et al., 2000). Further work is needed to
define unperturbed Cl− reversal potentials in the dendrites and soma of L5 pyramidal cells.
Distinct numbers and sites of synaptic contacts made by FS interneurons with pyramidal cells may
be regulated by network function (Yoshimura et al., 2005) and activity during different states
(Klausberger and Somogyi, 2008; Puig et al., 2008). The strength of inhibition mediated by
hippocampal FS basket cells varies with different target pyramidal cells. Synaptic strength is greater at
connections with CA1 pyramidal cells in deep rather than superficial layers of stratum pyramidale (Lee
et al., 2014) and it is genetically coded (Donato et al., 2015). The innervation patterns of cortical
basket cells appear to be regulated by experience, environment or fear conditioning (Donato et al.,
2013), according to network properties (Yoshimura et al., 2005; Lee et al., 2014) and the activity in
specific target cells (Xue et al., 2014), and activity level of them may be regulated by learning as well
as genetics (Donato et al., 2015). In contrast, the efficacy of synapses made by Martinotti cells seems
to be independent of target pyramidal cell activity (Xue et al., 2014). Thus different cortical
interneurons respond in distinct ways to neuronal network state.
The size, and thus efficacy, of synaptic terminals made by FS interneurons with the soma, dendritic
shafts and spines of target pyramidal cells were measured from 3D EM reconstructions. Other
GABAergic interneurons establish domain-specific contacts (Kawaguchi and Kubota, 1998; Jiang
et al., 2013; Kubota, 2014; Marlin and Carter, 2014). Paired recordings from other cortical
interneurons and pyramidal cells followed by complete reconstruction of terminals will be needed to
establish rules relating terminal size to efficacy. Nevertheless a somato-dendritic gradient of inhibitory
terminal size may be a general principle. Our data suggests that relations between post-synaptic site,
terminal properties including junctional area, and GABA release patterns may be maintained for other
types of cortical interneurons.
Table 2. Synapse properties of pair CS56
Synapse Target junction area (μm2) Electric charge (fC)* Conductance (nS)† Distance from soma (μm)
S1 Soma 0.350 120.1 0.71 0
S2 Soma 0.174 59.7 0.35 0
S3 Soma 0.194 66.6 0.39 0
S4 Soma 0.232 79.6 0.47 0
Sub total 0.950
D1 Dendrite 0.102 35.2 0.21 34
Sp1 Spine 0.056 19.2 0.11 34
Sp2 Spine 0.051 17.6 0.10 83
Sp3 Spine 0.042 14.4 0.08 106
*Estimated from junctional area.
†Estimated from electric charge.
DOI: 10.7554/eLife.07919.019
Kubota et al. eLife 2015;4:e07919. DOI: 10.7554/eLife.07919 12 of 27
Research article Neuroscience

Inhibitory synapses terminating on spines form 25–50% of GABAergic contacts with cortical
pyramidal cell (Kubota et al., 2007; Chen et al., 2012) and so form a major part of inhibitory
microcircuits. Spines contacted by an inhibitory synapse are typically co-innervated by an excitatory
thalamic input (Kubota et al., 2007). Our simulations show single inhibitory synapses can effectively
veto synaptic excitation and intercept NMDA current (Gulledge et al., 2012; Harnett et al., 2012;
Chiu et al., 2013) at the spine head. They could then prevent summation of thalamic excitatory inputs
arriving within about 20 ms (Marlin and Carter, 2014), as pyramidal cell and FS basket cells are
co-activated by thalamo-cortical afferents (Kimura et al., 2010). Hence the FS basket cell acts as
a feed forward inhibition to thalamic input.
Excitatory synapses innervating cortical pyramidal cell spines can be modulated by visual experience
(Chen et al., 2012) or by somatosensory stimulation (Knott et al., 2002). The veto by inhibitory
synapses terminating on spines may be especially important for such plastic changes (Chen et al., 2012).
Pyramidal cell dendritic spines are tuned to distinct modalities and spines with similar preferences may
not cluster together on the same dendritic branch but averaged across a neuron biased towards the
orientation tuning of the cell’s output (Chen et al., 2013). Inhibitory synapses on dendritic shafts may
then inhibit tuned/untuned excitatory inputs on the same but not different dendritic branches and
so efficiently and specifically adjust pyramidal cell activity (Liu, 2004; Marlin and Carter, 2014). Our
data shows dendritic IPSCs may exert strictly local effects. Cl− reversal potential at distal dendrite/spine
synapses may normally be close to the local resting membrane potential. However this small driving
Table 3. Synapse properties of pair CS55
Synapse Target Junction area (μm2) Electric charge (fC)* Distance from soma (μm)
S1 Soma 0.116 40.9 0
S2 Soma 0.221 77.6 0
S3 Soma 0.052 18.4 0
S4 Soma 0.120 42.3 0
S5 Soma 0.436 153.0 0
S6 Soma 0.194 68.2 0
S7 Soma 0.344 121.0 0
S8 Soma 0.151 52.9 0
S9 Soma 0.068 23.8 0
S10 Soma 0.138 48.3 0
S11 Soma 0.132 46.2 0
S12 Soma 0.211 74.1 0
S13 Somatic spine 0.092 32.3 0
Sub total 2.274
D1 Dendrite 0.044 15.3 6
D2 Dendrite 0.176 61.8 8.6
Sp1 Spine 0.180 63.2 12.6
D3 Dendrite 0.058 20.3 22.6
Sp2 Spine 0.054 19.1 22.6
D4 Dendrite 0.060 21.1 24.7
Sp3 Spine 0.099 34.6 24.9
Sp4 Spine 0.067 23.4 24.9
Sub total 3.011
D5 Dendrite 0.055 19.3 44.8
D6 Dendrite 0.060 21.1 84.5
D7 Dendrite 0.046 16.2 188.5
*Estimated from junctional area.
DOI: 10.7554/eLife.07919.020
Kubota et al. eLife 2015;4:e07919. DOI: 10.7554/eLife.07919 13 of 27
Research article Neuroscience

force would be increased by depolarization due to dendritic EPSPs. IPSPs will then reduce EPSP
amplitude at the soma even if they do not propagate somatically. FS cells can thus control excitation of
L5 pyramidal cells by a specific, local veto of co-innervated spines, by reducing dendritic propagation of
summed EPSPs as well as by a strong, global peri-somatic inhibition.
We have estimated a peak amplitude of 5.7 ± 3.1 pA for EPSCs generated at single synaptic
contacts with CCS pyramidal cell proximal dendrites (Morishima et al., 2011). Here we found a peak
IPSC amplitude of 2.4 pA at dendritic shaft synapses. Our simulations suggest that summation of
single excitatory and inhibitory synaptic currents may reduce dendritic excitation and suppress
calcium entry via NMDA receptors (Larkum et al., 2009). GABAA receptor activation will also reduce
EPSP amplitude by shunting (Hao et al., 2009; Gidon and Segev, 2012). Thus, activation of a single
Table 4. Proportion of basket terminal
Pair Basket terminal Total bouton Basket terminal (%)
CS55 106 285 37.2
CS28 – – –
CS56 91 211 43.1
CS20 52 217 24.0
CS41 73 248 29.4
CS8 59 201 29.4
CS45 26 151 17.2
CS44 67 233 28.8
CS10 59 226 26.1
CS23 63 315 20.0
Total/average 596 2087 28.4 ± 7.6
DOI: 10.7554/eLife.07919.021
Figure 7. Schematic summary. Schematic drawing to summarize our main findings.
DOI: 10.7554/eLife.07919.022
Kubota et al. eLife 2015;4:e07919. DOI: 10.7554/eLife.07919 14 of 27
Research article Neuroscience

dendritic inhibitory synapse should effectively suppress EPSCs at nearby excitatory synapses.
This distal dendritic inhibition is functionally strong (Cossart et al., 2001; Gidon and Segev, 2012).
Inhibitory synapses on dendrites and spines act to reduce neuronal excitability by blocking local
EPSCs and so decrease the amplitude of summed EPSPs. The synchronization of FS basket cell activity
via gap junctions (Gibson et al., 1999) will further counter the summation of afferent EPSPs.
It is generally accepted that synaptic contacts detected by LM must be confirmed with EM.
We verified 14 synapses of 25 putative dendritic contacts with LM (56%) in this study and 78% in our
previous study (Karube et al., 2004). In addition, we newly found 6 dendritic/spine synapses with EM
(30%; 6/20). Care must also be taken with somatic inhibitory terminals which are much smaller than the
soma, so that terminals behind or in front of a soma may be impossible to resolve in LM. Indeed, we
identified 14 somatic synapses with EM for CS55 and 4 somatic synapses with EM for CS56, although our
estimation of the contacts with LM was three for the CS55 and one for the CS56 pair. Our data shows the
importance of EM data for quantitative measurements on the number and size of synaptic junctions.
Passive cable properties and voltage-dependent resting conductances affect IPSP amplitude. Since
postsynaptic target size is related to input resistance and synaptic junction area to the number of
post-synaptic receptors (Nusser et al., 1997), alterations in synaptic dimensions may govern the size
of GABAergic currents. The dependence of synaptic terminal areas on postsynaptic dendritic cross
sectional areas would tend to maintain a constant ratio of synaptic conductance to post-synaptic input
resistance. Thus, presynaptic interneuron actions are efficiently regulated to provide an appropriate
hyperpolarization of their post-synaptic target (Kubota and Kawaguchi, 2000).
EPSC amplitude is correlated with synaptic junction area, release probability, calcium entry and
receptor number (Holderith et al., 2012). At inhibitory synapses, currents are also correlated with
release probability, docking site number and receptor number (Nusser et al., 1997; Pulido et al.,
2015). Synaptic junctional area should then govern IPSC amplitudes. Surprisingly unit IPSCs from
recordings in this work were quite similar, suggesting that the inhibitory synaptic current is well
correlated with synaptic junction area. Larger synapses may generate larger IPSCs, due to multiple
release sites or higher numbers of post-synaptic receptors. The presence of multiple release sites at
some synaptic junctions has been shown by anatomy (Holderith et al., 2012; Nakamura et al., 2015)
or estimated from neurophysiological data (Nakamura et al., 2015; Pulido et al., 2015). Clusters of
the Cav2.1 Ca-channels in large synaptic junctions have been correlated with estimates of the number
of vesicular docking sites. GABA release from multiple sites in a large synapse could saturate post-
synaptic receptors and initiate large synaptic currents of similar amplitude, as at single-terminal
synaptic connections made by molecular layer interneurons of the cerebellum. In contrast, the IPSCs
Table 5. IPSC properties of pair CS56 and CS55
CS56 CS55
Electric peak Electric peak
Charge (fC) (pA) Charge (fC) (pA)
Average 193.1 −17.3 895.2 −91.3
SD 56.2 3.0 96.2 11.2
Max 326.1 −24.9 1057.8 −111.0
Min 89.9 −11.8 766.0 −74.0
n 60 60 10 10
Average Trace 217.5 −14.2 994.6 −89.4
DOI: 10.7554/eLife.07919.023
Table 6. Unit IPSC
Pair Electric charge (fC) Junction area (μm2) Unit IPSC (fC/μm2)
CS56 326.1 0.950 343.3
CS55 1057.8 3.011 351.3
DOI: 10.7554/eLife.07919.024
Kubota et al. eLife 2015;4:e07919. DOI: 10.7554/eLife.07919 15 of 27
Research article Neuroscience

Figure 8. Simulated conduction for dendritic spine, shaft and somatic IPSCs. (A–C) Dendro-somatic conduction of a spine synapse IPSC. (A) Peak
membrane potential changes (color-coded as in (M)) over somato-dendritic membrane induced by an IPSC of 0.11 nS injected at Sp1 of the model
pyramidal cell (red arrow). Peak inhibitory potential of the spine in red. (B) IPSC waveform injected at Sp1 spine head is reduced to 64% at the soma.
Figure 8. continued on next page
Kubota et al. eLife 2015;4:e07919. DOI: 10.7554/eLife.07919 16 of 27
Research article Neuroscience

examined here were mediated by multiple synaptic contacts of FS basket cells on L5 CCS pyramidal
cells. IPSC amplitude fluctuations presumably reflected variations and failures in release from different
terminals.
Axons of cortical non-pyramidal cells project to distinct laminar and columnar zones (Kubota, 2014),
enabling different subtypes of interneurons to form synapses with specific targets. Projecting to
a specified zone, an axon could make contacts nonspecifically with any available target neuron (Fino and
Yuste, 2011; Packer and Yuste, 2011; Packer et al., 2013). Alternatively synaptic contacts may be
established preferentially with specific neuronal subtypes or target domains, such as soma, axon or
dendrites (Jiang et al., 2013). Target preference may depend on an activity dependent control of
excitatory and inhibitory synaptic input size in order to maintain E/I balance (Xue et al., 2014). Our data
show FS basket cells may form synaptic contacts with the perisomatic region of post-synaptic pyramidal
cells or with their proximal dendritic shafts and spines. Inhibitory synaptic junctional area was matched to
the synaptic site—it was larger at somatic than dendritic sites and larger at synapses made with shafts than
at those made with dendritic spines. Molecular cues to recognize a somatic or dendritic innervation site
may include chemoattractive and cell adhesion molecules. Such mechanisms are involved in a segregation
of dendritic spine inhibitory inputs and distinct sources of afferent excitation. Spines innervated by FS
basket cell terminals also receive excitatory synapses from thalamus, but never recurrent cortical
pyramidal cell inputs (Kubota et al., 2007). Both activity dependent chemoattractant factors (Yee et al.,
1999) and cell adhesion molecules of the protocadherin family (Meguro et al., 2015; Yagi, 2015) have
been linked to this specificity. Functionally it would permit FS cell inhibitory synapses to mediate an
efficient and selective veto on excitatory inputs from the thalamus.
A recent modeling paper (Gidon and Segev, 2012) enhanced our understanding of dendritic
inhibitory operations. It assumed that inhibitory synapses targeting pyramidal cell somata, dendritic
shafts and dendritic spines possess a uniform size, and strength. Our data suggests the model could
be refined to explore the effects of variation in synaptic size and strength from soma to dendrite
spine. Quantitative 3-D EM reconstructions provide an exact basis to assign different weights to
inhibitory synapses that contact different sites. This inhibitory synaptic machinery differs from that at
excitatory synapses subject to both plasticity (Matsuzaki et al., 2004) and scaling functions (Magee,
2000; Katz et al., 2009). Defects in these microcircuits may contribute to depression and other
neuronal diseases (Sauer et al., 2015). Our data thus provide novel insights into biophysical design
principles for inhibitory synaptic operations in neural microcircuits.
Materials and methods
Retrograde labeling of CCS cellsRetrograde labeling of CCS cells was performed as described previously (Morishima and
Kawaguchi, 2006). Briefly, young Wistar rats (between postnatal 19–23 days old; Charles River, Japan)
Figure 8. Continued
(C) Simulated IPSPs. Current flow indicated by arrows. IPSP attenuation was 15% at the basal dendrite and 9% at the soma. (D–F) Conduction of a dendritic
shaft IPSC, D1. (D) Peak somato-dendritic potential changes induced by an IPSC of amplitude 0.21 nS injected at a dendritic shaft (red arrow). (E) IPSC
waveform injected at D1 (upper) and simulated somatic IPSC (lower trace) with an attenuation of 63%. (F) IPSP wave form. Current flow indicated by
arrows. IPSP attenuation at the soma is 57%, but no attenuation at the spine. (G, H) Conduction of a somatic IPSC, S1. (G) Peak somato-dendritic potential
changes induced by an IPSC of amplitude 0.7 nS injected at the S1 somatic site (red arrow). (H) IPSC waveform injected at S1 (upper) resulting in a somatic
IPSP (lower). (I) Somato-dendritic conduction of the IPSC resulting from activating (red arrow) four somatic synapses S1, S2, S3 and S4. (J) Summed
IPSC waveform (upper trace, S1–S4) and somatic IPSP (lower). (K) Peak somatic IPSPs for eight different injected IPSCs. (L) Reduction (green) of the
EPSP resulting from the injection of an EPSC waveform of 0.2 nS (red) at the spine head, Sp1, by an IPSC (blue) injected at the same site and time.
(M) Color-coded dendrogram and corresponding somatic synaptic contacts on the model cell. (N) Bar histogram showing the distribution of IPSC electric
charge of the pair CS56. (O) IPSC variance of the pair CS56. (P) Bar histogram of the distribution of IPSC electric charge when simulated. Here, the IPSC
electric charge also substantially varied from trial to trial and is not significantly different as in the paired recording (Kolmogorov–Smirnov test, p = 0.41).
DOI: 10.7554/eLife.07919.025
The following figure supplement is available for figure 8:
Figure supplement 1. Relationship showing synapse conductance and release probability used for simulation analysis in Figure 6P.
DOI: 10.7554/eLife.07919.026
Kubota et al. eLife 2015;4:e07919. DOI: 10.7554/eLife.07919 17 of 27
Research article Neuroscience

Figure 9. Dendrograms with contact sites of the post synaptic pyramidal cells. Individual dendrograms of all investigated postsynaptic pyramidal cells (n =10). Apical dendrograms are shown in blue and basal dendrograms are in gray.
DOI: 10.7554/eLife.07919.027
Kubota et al. eLife 2015;4:e07919. DOI: 10.7554/eLife.07919 18 of 27
Research article Neuroscience

Figure 10. Linear correlation between synapse junction area and postsynaptic target size of non-pyramidal cells. (A) Different types of cortical GABAergic
non-pyramidal cells. The somatodendritic domain of the neurons is given in black and their axons in red. Abbreviations: LS, late spiking cell; FS, fast
spiking cell; BSNP, burst spiking non-pyramidal cell; RSNP, regular spiking non-pyramidal cell; CR, calretinin; CRF, corticotropin releasing factor. (B, C) 3D
Figure 10. continued on next page
Kubota et al. eLife 2015;4:e07919. DOI: 10.7554/eLife.07919 19 of 27
Research article Neuroscience

were anesthetized with ketamine (40 mg/kg body weight) and xylazine (4 mg/kg body weight). Rats
were placed in a stereotaxic frame and the skull on the injection hemisphere was partially removed and
the cortex, hippocampus and fimbria caudal to the striatum were suctioned to prevent the spilling of
dye into the cortex during injection. Cholera toxin subunit B conjugated with Alexa Fluor 555 (CTB-555;
C34776, Invitrogen, NY) was used as the retrograde tracer (0.2% dissolved in distilled water). Injection
site was determined by using stereotaxic coordinates (0.8 mm posterior to bregma, 2.5 mm lateral to
the midline, depth 4 mm) and a glass pipette (tip diameter is around 100 micron) filled with CTB-555
was inserted to the striatum obliquely. Injection (80–100 nl) was performed using positive pressure from
a pneumatic pico-pump (PV-820, World Precision Instrument, Sarasota, FL). After injection, the
aspirated brain space was filled with a gel sponge (Spongel, Astellas Pharma Inc., Tokyo, Japan)
immersed with saline and the skin was sutured. Rats recovered from surgery in the animal facility and
were used for electrophysiological experiments at 2–3 days after the injection.
Slice preparationRats were deeply anesthetized with isoflurane and were decapitated after the loss of all responses to
tactile stimuli, such as pinching legs. Slices of frontal cortex (300 μm thick) were cut in ice-cold artificial
cerebrospinal fluid ACSF with a vibratome (VT1000S, Leica, Germany) and kept at room temperature
in ACSF until recordings. The ACSF consisted of (in mM) 124 NaCl, 3 KCl, 2.4 CaCl2, 1.2 MgCl2, 26
NaHCO3, 1 NaH2PO4, 20 glucose, 0.4 ascorbic acid, 2 pyruvic acid and 4 lactic acid and saturated with
95%O2/5%CO2.
Paired recordingsSlices were transferred to a recording chamber and perfused at 1–2 ml/min with ACSF (25˚C). Patch
pipettes (3–5 MΩ) were pulled from borosilicate glass and filled with 20 μl of internal solution containing
(in mM): 126 K-methylsulfate, 6 KCl, 2 MgCl2, 0.2 EGTA, 4 ATP, 0.3 GTP, 10 phosphocreatine, 10 HEPES
and 0.75% biocytin. The pH of the pipette solution was adjusted to 7.3 with KOH and the osmolality was
set to 295 mOsm. Potassium-methylsulfate as internal solution provided a physiological space clamp
(Fleidervish and Libman, 2008). Dual patch-clamp whole-cell recordings (EPC9/dual, HEKA, Germany)
were made in the frontal cortex (medial agranular and anterior cingulate cortex) with the use of × 40
water-immersion objective (Axioskop FS, Carl Zeiss, Germany). Series resistance was typically 6–15 MΩand was not compensated. If it exceeded 20 MΩ, data were discarded. Liquid junction potential was not
corrected. The data were recorded at 10 kHz and filtered at 2 kHz. For paired whole-cell recordings,
retrogradely labeled pyramidal neurons were selected under fluorescence and differential interference
contrast microscope (DIC) (Stuart et al., 1993). FS basket cells were identified in acute slices by their
appearance under DIC microscopy. FS cells were recorded using the above internal solution, while
pyramidal cells were recorded using an internal solution with the KCl concentration raised to 15 mM and
K-methylsulfate lowered to 117 mM to depolarize the reversal potential of Cl− (−52.5 mV). IPSCs were
recorded as inward currents at −65 mV holding potential. APs were initiated in the presynaptic neuron
by 1 ms depolarizing pulses of 300 pA. Presynaptic APs and postsynaptic currents were recorded
simultaneously.
Electrophysiological data analysis (Figure 1—figure supplement 2)Recorded presynaptic potentials and postsynaptic IPSCs were analyzed off-line with IGOR software
(WaveMetrics, Lake Oswego, OR). For the calculation of kinetic parameters of postsynaptic currents,
traces with spontaneous synaptic currents on the rising or decay phase were omitted. The onset of the
postsynaptic current was estimated by fitting the rising phase with a parabola and extrapolating back
Figure 10. Continued
reconstructions of synaptic junctions (red) on target structures (green) of inhibitory axon terminals by cortical FS basket cell (B) and descending basket
BSNP-CR cell (C) using 3D serial EMgs. The thickness of the target structure (from left to right) is positively correlated with the size of the junction area.
(D–L) Line diagrams correlating synaptic junction area of the non-pyramidal neurons with spine head volume (left panel), dendrite cross sectional area
(middle panel) and plots with soma (right panel). The synapse junction area on spines and dendrites is linearly correlated with the target size. The somatic
synapse is larger when compared with dendritic and spine synapse.
DOI: 10.7554/eLife.07919.028
Kubota et al. eLife 2015;4:e07919. DOI: 10.7554/eLife.07919 20 of 27
Research article Neuroscience

to the baseline. Postsynaptic current amplitude was measured as the difference between the peak
current, measured from a 1.5 ms window centered at the peak, and the average baseline current,
measured in a 4 ms window preceding the presynaptic AP. The decay time constant was obtained
by fitting the decay phase of postsynaptic current with a double exponential equation. Since
synaptic responses systematically run-down during the time course of some experiments, the
amplitudes of postsynaptic currents were plotted against time and only stable periods were
selected for further analysis. On average 100 traces (range 50–150) were analyzed for each
experiment. Postsynaptic currents smaller than 2 times the noise level were discarded as failures,
and the amplitudes of the remaining postsynaptic currents were analyzed. Cumulative histograms
of postsynaptic current and noise were constructed and compared with a paired t-test and
confirmed the separation between two (Figure 1—figure supplement 2B). To average
postsynaptic currents, the peaks of the postsynaptic currents were aligned. The electric charge
of IPSC was analyzed using AxoGraph (Molecular Devices, Sunnyvale, CA). Values are reported as
mean ± standard deviation.
Visualization of recorded cellsAfter electrophysiological recordings, slices were immersion-fixed (1.25% glutaraldehyde, 4% para-
formaldehyde, 0.2% picric acid in 0.1 M phosphate buffer) and irradiated for 10 s using a microwave,
and kept at room temperature for 2 hr. Slices were then cryoprotected with sucrose containing 0.1 M
phosphate buffer (15% followed by 30% of sucrose solution) and freeze-thawed in the liquid nitrogen.
Slices were re-sliced at 50 μm thickness with the vibratome and reacted with avidin-biotin peroxidase
complex solution (ABC kit, Vector Laboratory, Burlingame, CA). Biocytin-filled cells were visualized with
3,3′-diaminobenzidine tetrahydrochloride (0.02%), nickel ammonium sulfate (0.3%), and H2O2 (0.004%).
Slices were further post-fixed in 1% OsO4 with 7% glucose, dehydrated and embedded in plastic (Epon
812 resin kit, TAAB, Aldermaston, UK) between silicone (Sigma coat, Sigma–Aldrich, St. Louis, MO)
coated glass slide and cover slip.
Morphological analysisAxons, dendrites, and somata of stained neurons were reconstructed using the Neurolucida software
(MBF Bioscience, Williston, VT) attached to a NIKON ECLIPSE microscope equipped with a 60×objective lens (NA 1.4, NIKON, Tokyo, Japan). Inter point interval of drawing axons and dendrites
was less than 2 micron. No correction was made for tissue shrinkage, which should be about 90%
(Karube et al., 2004). Putative synaptic contacts were identified and their location was marked on
the traces of axons and dendrites. The software Neuroexplorer was used for morphometrical and
quantitative analyses of reconstructed cells, including total dendritic length and distances
between somata and putative synaptic contacts.
Focus stack imageThe dendritic segment or soma images of every 0.5 μm focus step in the same image field were
captured using the Neurolucida software (MBF Bioscience, Williston, VT) attached to a NIKON ECLIPSE
microscope equipped with a 60× objective lens (NA 1.4, NIKON, Tokyo, Japan) and CCD camera (1392
× 1040 pixels). The focus stack image was obtained using ‘auto-blend layers/stack images’ function of
Photoshop (Adobe, San Jose), which combine the best focused area of the multiple focus step images,
to give a greater depth of field (http://en.wikipedia.org/wiki/Focus_stacking).
EM analysisAfter reconstruction with Neurolucida, stained neurons were serially sectioned at a thickness of
50 nm with an ultramicrotome (Reichert Ultracut S, Leica Microsystems, Germany). Ultrathin
sections were mounted on Formvar-coated single-slot grids. EM images of labeled axon terminals
and dendrites were captured with a CCD camera (XR-41, Advanced Microscopy Techniques) in
Hitachi H-7000, and HT-7700 EMs (Hitachi, Tokyo, Japan) at magnification ×8,000 or ×15,000.Structures of interest were reconstructed and quantified from the serial EM images, with the 3D
reconstruction software, Reconstruct (http://synapses.clm.utexas.edu/tools/index.stm) (Fiala,
2005). The synaptic junctions were segmented at a typical cleft structure that was found between
presynaptic vesicle aggregations and postsynaptic membrane density.
Kubota et al. eLife 2015;4:e07919. DOI: 10.7554/eLife.07919 21 of 27
Research article Neuroscience

Simulation analysisSimulations were made with NEURON (Hines and Carnevale, 1997). The morphology of the model
neuron was reconstructed from the EM imaging data. Pyramidal cell dendrites typically possessed
elliptical cross sections, but NEURON is limited to circular morphologies. We circumvented this
problem by first modeling the pyramidal neuron with circular dendritic cross sections, preserving the
cross sectional area from EM. Then, leak conductance and membrane capacitance densities in each
section in the circular model were adjusted to be equivalent to those predicted from EM imaging
data. Our pyramidal model incorporates passive leak channels only. The passive leak conductance and
membrane capacity before adjustment were 0.0001 S/cm2 and 1 μF/cm2, respectively. The intracellular
resistance for somata, basal and apical dendrites was 100 Ωcm, and for the spine head and spine
neck 385 Ωcm, respectively. The equilibrium potential of the leak current was set to −65 mV.
As above, the passive leak conductance and membrane capacitance density in each section in
the NEURON model were modified in order to mimic the elliptical shape (for further details, refer
to our previous paper [Kubota, et al., 2011a]). The relationship between cross sectional area (S),
circumference (L) and summed length of distal dendrites (R) we used here is (S) = 0.00033258(R) +0.048097 and (L) = 0.0012661(R) + 1.3206.
The membrane potential was set to −65 mV (Morishima and Kawaguchi, 2006), and the GABAA
reversal potential to −77.5 mV (Gulledge and Stuart, 2003) to fit our measurements of driving force.
The electrical charge of each synaptic contact was calculated by multiplying the synapse junction area
by the unit electrical charge; in turn individual synaptic conductance was calculated from the electric
charge (Table 2). The synaptic current was adjusted to the average current of pair CS56 (Figure 2E,
lower panel) with a double exponential fit. It was injected at sites where the presynaptic FS basket cell
axon established synaptic contacts with the pyramidal cell.
A kinetic model was used for inhibitory synapses (Destexhe et al., 1994). Parameters were
estimated by fitting the model to the unitary max IPSC data (Figure 2E upper panel). The
estimated duration time, rise time constant, decay time constant and conductance are 2.3 ms,
0.45 ms, 14.17 ms and 1.92 nS, respectively. Individual synaptic conductance was estimated as
multiplying 1.92 nS (conductance of the unitary max IPSC) by the ratio of synaptic junctional area
of each synapse to the total area of the 4 somatic synaptic junctional area (0.950 μm2). The values
of synaptic conductance corresponding to contact sites, S1, S2, S3, S4, D1, SP1, SP2, SP3 are
given in Table 2.
The release probability for the simulation of IPSC variation was estimated with modified fitting line
of Figure 4H in Holderith et al., 2012), y = 3.271 * 0.68 + 0.018. We multiplied slope of the fitted line
by 0.68 to get the similar release probability with pair cell recording result (Figure 8—figure
supplement 1).
Single cell electrophysiology experimentExperiments were performed as described for the electrophysiological recording experiments previously
(Kubota et al., 2007). Briefly, whole-cell access was obtained in neurons using visual DIC optics and a 40x
water immersion objective. The pipette solution consisted of (in mM): potassium methylsulfate, 120; KCl,
5.0; EGTA, 0.5; MgCl2, 1.7; Na2ATP, 4.0; NaGTP, 0.3; HEPES, 8.5; and biocytin, 17. The recording was
usually performed for 10–20 min. After re-slicing at 50 μm thickness, each slice (a set of 50 μm sections
after resectioning) was further treated by one of the following two procedures.
(A) Some slices were incubated with avidin-biotin peroxidase complex (ABC) solution (Vector
Laboratory, Burlingame, CA) in Tris–HCl buffered saline (TBS) with or without 0.04% Triton X-100 (TX),
and reacted with 3,3-diaminobenzidine tetrahydrochloride (DAB) (0.05%) and H2O2 (0.003%) in 0.1 M
phosphate buffer (PB).
(B) Other slices were processed for fluorescence immunohistochemistry to identify neurochemical
markers, CRF and calretinin. The slices were incubated with the primary antibodies, CRF developed in
rabbit (1:1000, gift by Dr. Wylie Vale, #PBLrC70) and calretinin (1:1000, Swant, Bellinzona, Switzerland,
#6B3) in TBS containing 2% bovine serum albumin, 10% normal goat or horse serum and 0.04% TX.
The slices were incubated in fluorescent secondary antibodies, followed by incubation with Alexa
350 streptavidin (1:200, Molecular Probes, Eugene, OR, #S-11249) in TBS. After examination for
fluorescence, the slices were incubated with ABC, and reacted with DAB and H2O2.
Kubota et al. eLife 2015;4:e07919. DOI: 10.7554/eLife.07919 22 of 27
Research article Neuroscience

Slices were then post-fixed in 1%OsO4 in 0.1 M PB, dehydrated and flat embedded on silicon-coated
glass slides in plastic (Epon 812 resin kit, TAAB, Aldermaston, UK). Recovered neurons were drawn using
a drawing tube, or 3D reconstructed using the Neurolucida software (MBF Bioscience, Williston, VT)
attached to a NIKON ECLIPSE microscope equipped with a 60× objective lens (NIKON, Tokyo, Japan).
After light microscopic reconstruction, stained cells were serially sectioned into 90 nm thickness using
an ultramicrotome (Reichert Ultracut S). Ultrathin sections mounted on one-hole grids were stained
with lead citrate. Electron micrographs were taken with a Hitachi H-7000 electron microscope (EM),
using tilting of up to 60˚. EM images of the labeled terminals and associated structures were
captured using a CCD camera and reconstructed three-dimensionally (Visilog; Noesis, France).
StatisticsWe used Mann Whitney U test (non-parametric) to compare the junctional area of somatic and
dendritic/spine synapses (Figure 6F,G) and Kolmogorov–Smirnov test to compare electric charge
distributions from paired recordings experiment and the simulation of Figure 8N,P.
DatasetsThe datasets I can provide are Neurolucida reconstructed neuron to the “NeuroMorpho.Org”,
http://neuromorpho.org/neuroMorpho/index.jsp (Kubota, 2015a, 2015b, 2015c, 2015d), and
authentic model cell for ‘Neuron’ simulator to the ‘ModelDB’, https://senselab.med.yale.edu/
modeldb (Kubota, 2015e).
AcknowledgementsWe thank H Kita and C Shiozu for technical assistance and Dr M Ushimaru for helping to analyze the
physiological data. We thank Drs R Miles and JL Chen for comments on the manuscript. This study was
supported by the EM facility in National Institute for Physiological Sciences in Japan.
Additional information
Funding
Funder Grant reference Author
Ministry of Education, Culture,Sports, Science, andTechnology (MEXT)
Grant-in-Aid for ScientificResearch (B), 25290012
YoshiyukiKubota
National Institutes of NaturalSciences
The Imaging Science Project ofthe Center for Novel ScienceInitiatives (IS261004)
YoshiyukiKubota
Toyoaki Scholarship Foundation YoshiyukiKubota
Uehara Memorial Foundation YoshiyukiKubota
Ministry of Education, Culture,Sports, Science, andTechnology (MEXT)
Grant-in-Aid for ScientificResearch on Innovative Areas(No. 4103), 24120718
YoshiyukiKubota
Ministry of Education, Culture,Sports, Science, andTechnology (MEXT)
Grant-in-Aid for ScientificResearch on Innovative Areas-Adaptive circuit shift (No. 3603),26112006
YoshiyukiKubota
Ministry of Education, Culture,Sports, Science, andTechnology (MEXT)
Grant-in-Aid for YoungScientists (B) 22700321
Masaki Nomura
Ministry of Education, Culture,Sports, Science, andTechnology (MEXT)
Grant-in-Aid for ScientificResearch on Innovative Areas(No. 3603), 15H01456
YasuoKawaguchi
Ministry of Education, Culture,Sports, Science, andTechnology (MEXT)
Grant-in-Aid for ScientificResearch (A) 25250005
YasuoKawaguchi
Kubota et al. eLife 2015;4:e07919. DOI: 10.7554/eLife.07919 23 of 27
Research article Neuroscience

Funder Grant reference Author
Ministry of Education, Culture,Sports, Science, andTechnology (MEXT)
Grant-in-Aid for ScientificResearch 15K14324
YasuoKawaguchi
The funders had no role in study design, data collection and interpretation, or thedecision to submit the work for publication.
Author contributions
YK, Conception and design, Acquisition of data, Analysis and interpretation of data, Drafting or
revising the article, Contributed unpublished essential data or reagents; SK, Conception and design,
Acquisition of data, and Analysis of slice experiments including LM reconstruction and physiological
data analysis, Drafting the article; MN, Acquisition of simulation data, Drafting the article; SH, NY,
AAM, Acquisition of the EM data and reconstruction from serial EMGs; FK, Analysis of slice
physiology data and Neurolucida reconstruction, Drafting the article; JL, Acquisition of the EM data,
reconstruction from serial EMGs, Drafting the article; YK, Conception and design
Author ORCIDsYoshiyuki Kubota, http://orcid.org/0000-0002-0950-7460
Ethics
Animal experimentation: All surgical and animal care methods was performed in strict accordance
with the Guidelines for the Use of Animals of IBRO and our institutional Animal Care and Use
committee (National Institute for Physiological Sciences) with reference number 14A011. All surgery
was performed under ketamine and xylazine, or isoflurane anesthesia, and every effort was made to
minimize suffering.
Additional files
Major datasetsThe following datasets were generated:
Author(s) Year Dataset titleDataset IDand/or URL
Database, license, andaccessibility information
Kubota 2015 CS56-Pyramidal http://neuromorpho.org/neuroMorpho/index.jsp
Datasets will be available atNeuroMorpho.Org from 28February 2016. In the meantimethe datasets are also available athttp://www.nips.ac.jp/circuit/.
Kubota 2015 CS56-FS-basket http://neuromorpho.org/neuroMorpho/index.jsp
Datasets will be available atNeuroMorpho.Org from 28February 2016. In the meantimethe datasets are also available athttp://www.nips.ac.jp/circuit/.
Kubota 2015 CS55-Pyramidal http://neuromorpho.org/neuroMorpho/index.jsp
Datasets will be available atNeuroMorpho.Org from 28February 2016. In the meantimethe datasets are also available athttp://www.nips.ac.jp/circuit/.
Kubota 2015 CS55-FS-basket http://neuromorpho.org/neuroMorpho/index.jsp
Datasets will be available atNeuroMorpho.Org from 28February 2016. In the meantimethe datasets are also available athttp://www.nips.ac.jp/circuit/.
Kubota 2015 CS56-Pyramidal https://senselab.med.yale.edu/ModelDB/showModel.cshtml?model=183424
Publicly available at ModelDB(Accession no: 183424). Alsoavailable at http://www.nips.ac.jp/circuit/.
Kubota et al. eLife 2015;4:e07919. DOI: 10.7554/eLife.07919 24 of 27
Research article Neuroscience

ReferencesAraya R, Jiang J, Eisenthal KB, Yuste R. 2006. The spine neck filters membrane potentials. Proceedings of theNational Academy of Sciences of USA 103:17961–17966. doi: 10.1073/pnas.0608755103.
Bevan MD, Wilson CJ, Bolam JP, Magill PJ. 2000. Equilibrium potential of GABA(A) current and implications forrebound burst firing in rat subthalamic neurons in vitro. Journal of Neurophysiology 83:3169–3172.
Buhl EH, Halasy K, Somogyi P. 1994. Diverse sources of hippocampal unitary inhibitory postsynaptic potentials andthe number of synaptic release sites. Nature 368:823–828. doi: 10.1038/368823a0.
Chen JL, Villa KL, Cha JW, So PT, Kubota Y, Nedivi E. 2012. Clustered dynamics of inhibitory synapses anddendritic spines in the adult neocortex. Neuron 74:361–373. doi: 10.1016/j.neuron.2012.02.030.
Chen TW, Wardill TJ, Sun Y, Pulver SR, Renninger SL, Baohan A, Schreiter ER, Kerr RA, Orger MB, Jayaraman V,Looger LL, Svoboda K, Kim DS. 2013. Ultrasensitive fluorescent proteins for imaging neuronal activity. Nature499:295–300. doi: 10.1038/nature12354.
Chiu CQ, Lur G, Morse TM, Carnevale NT, Ellis-Davies GC, Higley MJ. 2013. Compartmentalization of GABAergicinhibition by dendritic spines. Science 340:759–762. doi: 10.1126/science.1234274.
Cossart R, Dinocourt C, Hirsch JC, Merchan-Perez A, De Felipe J, Ben-Ari Y, Esclapez M, Bernard C. 2001.Dendritic but not somatic GABAergic inhibition is decreased in experimental epilepsy. Nature Neuroscience 4:52–62. doi: 10.1038/82900.
Destexhe A, Mainen ZF, Sejnowski TJ. 1994. An Efficient Method for Computing Synaptic Conductances Based ona Kinetic Model of Receptor Binding. Neural Computation 6:14–18. doi: 10.1162/neco.1994.6.1.14.
Donato F, Rompani SB, Caroni P. 2013. Parvalbumin-expressing basket-cell network plasticity induced byexperience regulates adult learning. Nature 504:272–276. doi: 10.1038/nature12866.
Donato F, Chowdhury A, Lahr M, Caroni P. 2015. Early- and late-born parvalbumin basket cell subpopulationsexhibiting distinct regulation and roles in learning. Neuron 85:770–786. doi: 10.1016/j.neuron.2015.01.011.
Fiala JC. 2005. Reconstruct: a free editor for serial section microscopy. Journal of Microscopy 218:52–61. doi: 10.1111/j.1365-2818.2005.01466.x.
Fino E, Yuste R. 2011. Dense inhibitory connectivity in neocortex. Neuron 69:1188–1203. doi: 10.1016/j.neuron.2011.02.025.
Fleidervish IA, Libman L. 2008. How cesium dialysis affects the passive properties of pyramidal neurons:implications for voltage clamp studies of persistent sodium current. New Journal of Physics 10:035001. doi: 10.1088/1367-2630/10/3/035001.
Gibson JR, Beierlein M, Connors BW. 1999. Two networks of electrically coupled inhibitory neurons in neocortex.Nature 402:75–79. doi: 10.1038/47035.
Gidon A, Segev I. 2012. Principles governing the operation of synaptic inhibition in dendrites. Neuron 75:330–341.doi: 10.1016/j.neuron.2012.05.015.
Gonzalez-Burgos G, Hashimoto T, Lewis DA. 2010. Alterations of cortical GABA neurons and network oscillationsin schizophrenia. Current Psychiatry Reports 12:335–344. doi: 10.1007/s11920-010-0124-8.
Gulledge AT, Stuart GJ. 2003. Excitatory actions of GABA in the cortex. Neuron 37:299–309. doi: 10.1016/S0896-6273(02)01146-7.
Gulledge AT, Carnevale NT, Stuart GJ. 2012. Electrical advantages of dendritic spines. PLOS ONE 7:e36007.doi: 10.1371/journal.pone.0036007.
Hao J, Wang XD, Dan Y, Poo MM, Zhang XH. 2009. An arithmetic rule for spatial summation of excitatory andinhibitory inputs in pyramidal neurons. Proceedings of the National Academy of Sciences of USA 106:21906–21911. doi: 10.1073/pnas.0912022106.
Harnett MT, Makara JK, Spruston N, Kath WL, Magee JC. 2012. Synaptic amplification by dendritic spinesenhances input cooperativity. Nature 491:599–602. doi: 10.1038/nature11554.
Hensch TK. 2005. Critical period plasticity in local cortical circuits. Nature Reviews. Neuroscience 6:877–888.doi: 10.1038/nrn1787.
Hines ML, Carnevale NT. 1997. The NEURON simulation environment. Neural Computation 9:1179–1209. doi: 10.1162/neco.1997.9.6.1179.
Holderith N, Lorincz A, Katona G, Rozsa B, Kulik A, Watanabe M, Nusser Z. 2012. Release probability ofhippocampal glutamatergic terminals scales with the size of the active zone. Nature Neuroscience 15:988–997.doi: 10.1038/nn.3137.
Isomura Y, Harukuni R, Takekawa T, Aizawa H, Fukai T. 2009. Microcircuitry coordination of cortical motorinformation in self-initiation of voluntary movements. Nature Neuroscience 12:1586–1593. doi: 10.1038/nn.2431.
Jiang X, Wang G, Lee AJ, Stornetta RL, Zhu JJ. 2013. The organization of two new cortical interneuronal circuits.Nature Neuroscience 16:210–218. doi: 10.1038/nn.3305.
Karube F, Kubota Y, Kawaguchi Y. 2004. Axon branching and synaptic bouton phenotypes in GABAergicnonpyramidal cell subtypes. The Journal of Neuroscience 24:2853–2865. doi: 10.1523/JNEUROSCI.4814-03.2004.
Katz Y, Menon V, Nicholson DA, Geinisman Y, Kath WL, Spruston N. 2009. Synapse distribution suggests a two-stage model of dendritic integration in CA1 pyramidal neurons. Neuron 63:171–177. doi: 10.1016/j.neuron.2009.06.023.
Kawaguchi Y, Kubota Y. 1998. Neurochemical features and synaptic connections of large physiologically-identifiedGABAergic cells in the rat frontal cortex. Neuroscience 85:677–701. doi: 10.1016/S0306-4522(97)00685-4.
Kimura F, Itami C, Ikezoe K, Tamura H, Fujita I, Yanagawa Y, Obata K, Ohshima M. 2010. Fast activation offeedforward inhibitory neurons from thalamic input and its relevance to the regulation of spike sequences in thebarrel cortex. The Journal of Physiology 588:2769–2787. doi: 10.1113/jphysiol.2010.188177.
Kubota et al. eLife 2015;4:e07919. DOI: 10.7554/eLife.07919 25 of 27
Research article Neuroscience

Kisvarday ZF, Martin KA, Whitteridge D, Somogyi P. 1985. Synaptic connections of intracellularly filled clutch cells:a type of small basket cell in the visual cortex of the cat. The Journal of Comparative Neurology 241:111–137.doi: 10.1002/cne.902410202.
Klausberger T, Somogyi P. 2008. Neuronal diversity and temporal dynamics: the unity of hippocampal circuitoperations. Science 321:53–57. doi: 10.1126/science.1149381.
Knott GW, Quairiaux C, Genoud C, Welker E. 2002. Formation of dendritic spines with GABAergic synapsesinduced by whisker stimulation in adult mice. Neuron 34:265–273. doi: 10.1016/S0896-6273(02)00663-3.
Kubota Y, Kawaguchi Y. 2000. Dependence of GABAergic synaptic areas on the interneuron type and target size.The Journal of Neuroscience 20:375–386.
Kubota Y, Hatada S, Kondo S, Karube F, Kawaguchi Y. 2007. Neocortical inhibitory terminals innervate dendriticspines targeted by thalamocortical afferents. The Journal of Neuroscience 27:1139–1150. doi: 10.1523/JNEUROSCI.3846-06.2007.
Kubota Y, Karube F, Nomura M, Gulledge AT, Mochizuki A, Schertel A, Kawaguchi Y. 2011a. Conserved propertiesof dendritic trees in four cortical interneuron subtypes. Scientific Reports 1:89. doi: 10.1038/srep00089.
Kubota Y, Shigematsu N, Karube F, Sekigawa A, Kato S, Yamaguchi N, Hirai Y, Morishima M, Kawaguchi Y. 2011b.Selective coexpression of multiple chemical markers defines discrete populations of neocortical GABAergicneurons. Cerebral Cortex 21:1803–1817. doi: 10.1093/cercor/bhq252.
Kubota Y. 2014. Untangling GABAergic wiring in the cortical microcircuit. Current Opinion in Neurobiology 26:7–14. doi: 10.1016/j.conb.2013.10.003.
Kubota Y. 2015a. CS56-Pyramidal. NeuroMorpho.Org. http://neuromorpho.org/neuroMorpho/index.jsp.Kubota Y. 2015b. CS56-FS-basket. NeuroMorpho.Org. http://neuromorpho.org/neuroMorpho/index.jsp.Kubota Y. 2015c. CS55-Pyramidal. NeuroMorpho.Org. http://neuromorpho.org/neuroMorpho/index.jsp.Kubota Y. 2015d. CS55-FS-basket. NeuroMorpho.Org. http://neuromorpho.org/neuroMorpho/index.jsp.Kubota Y. 2015e. CS56-Pyramidal. ModelDB 183424. https://senselab.med.yale.edu/ModelDB/showModel.cshtml?model=183424.
Larkman A, Mason A. 1990. Correlations between morphology and electrophysiology of pyramidal neurons inslices of rat visual cortex. I. Establishment of cell classes. The Journal of Neuroscience 10:1407–1414.
Larkum ME, Nevian T, Sandler M, Polsky A, Schiller J. 2009. Synaptic integration in tuft dendrites of layer 5pyramidal neurons: a new unifying principle. Science 325:756–760. doi: 10.1126/science.1171958.
Lee SH, Kwan AC, Zhang S, Phoumthipphavong V, Flannery JG, Masmanidis SC, Taniguchi H, Huang ZJ, Zhang F,Boyden ES, Deisseroth K, Dan Y. 2012. Activation of specific interneurons improves V1 feature selectivity andvisual perception. Nature 488:379–383. doi: 10.1038/nature11312.
Lee SH, Marchionni I, Bezaire M, Varga C, Danielson N, Lovett-Barron M, Losonczy A, Soltesz I. 2014. Parvalbumin-positive basket cells Differentiate among hippocampal pyramidal cells. Neuron 82:1129–1144. doi: 10.1016/j.neuron.2014.03.034.
Liu G. 2004. Local structural balance and functional interaction of excitatory and inhibitory synapses inhippocampal dendrites. Nature Neuroscience 7:373–379. doi: 10.1038/nn1206.
Magee JC. 2000. Dendritic integration of excitatory synaptic input. Nature Reviews. Neuroscience 1:181–190.doi: 10.1038/35044552.
Marlin JJ, Carter AG. 2014. GABA-a receptor inhibition of local calcium signaling in spines and dendrites. TheJournal of Neuroscience 34:15898–15911. doi: 10.1523/JNEUROSCI.0869-13.2014.
Matsuzaki M, Honkura N, Ellis-Davies GC, Kasai H. 2004. Structural basis of long-term potentiation in singledendritic spines. Nature 429:761–766. doi: 10.1038/nature02617.
Meguro R, Hishida R, Tsukano H, Yoshitake K, Imamura R, Tohmi M, Kitsukawa T, Hirabayashi T, Yagi T,Takebayashi H, Shibuki K. 2015. Impaired clustered protocadherin-alpha leads to aggregated retinogeniculateterminals and impaired visual acuity in mice. Journal of Neurochemistry 133:66–72. doi: 10.1111/jnc.13053.
Miles R, Toth K, Gulyas AI, Hajos N, Freund TF. 1996. Differences between somatic and dendritic inhibition in thehippocampus. Neuron 16:815–823. doi: 10.1016/S0896-6273(00)80101-4.
Morishima M, Kawaguchi Y. 2006. Recurrent connection patterns of corticostriatal pyramidal cells in frontal cortex.The Journal of Neuroscience 26:4394–4405. doi: 10.1523/JNEUROSCI.0252-06.2006.
Morishima M, Morita K, Kubota Y, Kawaguchi Y. 2011. Highly differentiated projection-specific corticalsubnetworks. The Journal of Neuroscience 31:10380–10391. doi: 10.1523/JNEUROSCI.0772-11.2011.
Nakamura Y, Harada H, Kamasawa N, Matsui K, Rothman JS, Shigemoto R, Silver RA, DiGregorio DA, Takahashi T.2015. Nanoscale distribution of presynaptic Ca(2+) channels and its impact on vesicular release duringdevelopment. Neuron 85:145–158. doi: 10.1016/j.neuron.2014.11.019.
Nusser Z, Cull-Candy S, Farrant M. 1997. Differences in synaptic GABA(A) receptor number underlie variation inGABA mini amplitude. Neuron 19:697–709. doi: 10.1016/S0896-6273(00)80382-7.
Packer AM, Yuste R. 2011. Dense, unspecific connectivity of neocortical parvalbumin-positive interneurons:a canonical microcircuit for inhibition? The Journal of Neuroscience 31:13260–13271. doi: 10.1523/JNEUROSCI.3131-11.2011.
Packer AM, McConnell DJ, Fino E, Yuste R. 2013. Axo-dendritic overlap and laminar projection can explaininterneuron connectivity to pyramidal cells. Cerebral Cortex 23:2790–2802. doi: 10.1093/cercor/bhs210.
Puig MV, Ushimaru M, Kawaguchi Y. 2008. Two distinct activity patterns of fast-spiking interneurons duringneocortical UP states. Proceedings of the National Academy of Sciences of USA 105:8428–8433. doi: 10.1073/pnas.0712219105.
Pulido C, Trigo FF, Llano I, Marty A. 2015. Vesicular release statistics and unitary postsynaptic current at singleGABAergic synapses. Neuron 85:159–172. doi: 10.1016/j.neuron.2014.12.006.
Kubota et al. eLife 2015;4:e07919. DOI: 10.7554/eLife.07919 26 of 27
Research article Neuroscience

Rubenstein JL, Merzenich MM. 2003. Model of autism: increased ratio of excitation/inhibition in key neuralsystems. Genes, Brain, and Behavior 2:255–267. doi: 10.1034/j.1601-183X.2003.00037.x.
Sasaki T, Matsuki N, Ikegaya Y. 2012. Heterogeneity and independency of unitary synaptic outputs fromhippocampal CA3 pyramidal cells. The Journal of Physiology 590:4869–4880. doi: 10.1113/jphysiol.2012.237685.
Sauer JF, Struber M, Bartos M. 2015. Impaired fast-spiking interneuron function in a genetic mouse model ofdepression. eLife 4. doi: 10.7554/eLife.04979.
Silberberg G, Markram H. 2007. Disynaptic inhibition between neocortical pyramidal cells mediated by Martinotticells. Neuron 53:735–746. doi: 10.1016/j.neuron.2007.02.012.
Stuart GJ, Dodt HU, Sakmann B. 1993. Patch-clamp recordings from the soma and dendrites of neurons in brainslices using infrared video microscopy. Pflugers Archiv 423:511–518. doi: 10.1007/BF00374949.
Szabadics J, Varga C, Molnar G, Olah S, Barzo P, Tamas G. 2006. Excitatory effect of GABAergic axo-axonic cells incortical microcircuits. Science 311:233–235. doi: 10.1126/science.1121325.
Tanaka J, Matsuzaki M, Tarusawa E, Momiyama A, Molnar E, Kasai H, Shigemoto R. 2005. Number and density ofAMPA receptors in single synapses in immature cerebellum. The Journal of Neuroscience 25:799–807. doi: 10.1523/JNEUROSCI.4256-04.2005.
Verheugen JA, Fricker D, Miles R. 1999. Noninvasive measurements of the membrane potential and GABAergicaction in hippocampal interneurons. The Journal of Neuroscience 19:2546–2555.
Xue M, Atallah BV, Scanziani M. 2014. Equalizing excitation-inhibition ratios across visual cortical neurons. Nature511:596–600. doi: 10.1038/nature13321.
Yagi T. 2015. Protocadherins in mammalian neuronal individuality and connectivity. In: Pruszak J, editor. Neuralsurface antigens: from basic biology towards biomedical applications. Oxford, UK: Elsevier. p. 141–152.
Yee KT, Simon HH, Tessier-Lavigne M, O’Leary DM. 1999. Extension of long leading processes and neuronalmigration in the mammalian brain directed by the chemoattractant netrin-1. Neuron 24:607–622. doi: 10.1016/S0896-6273(00)81116-2.
Yoshimura Y, Dantzker JL, Callaway EM. 2005. Excitatory cortical neurons form fine-scale functional networks.Nature 433:868–873. doi: 10.1038/nature03252.
Kubota et al. eLife 2015;4:e07919. DOI: 10.7554/eLife.07919 27 of 27
Research article Neuroscience