title: a different approach to sensor networking for shm: remote
TRANSCRIPT

Cover page
Title: A Different Approach to Sensor Networking for SHM: Remote Powering and Interrogation with Unmanned Aerial Vehicles Authors: Michael Todd, David Mascarenas, Eric Flynn, Tajana Rosing, Ben Lee, Daniele Musiani, Sanjoy Dasgupta, Samori Kpotufe, Daniel Hsu, Rajesh Gupta, Gyuhae Park, Tim Overly, Matt Nothnagel, Chuck Farrar

ABSTRACT
Sensor networking is an important first-line component in any structural health
monitoring (SHM) application. We present how an interdisciplinary team of structural, mechanical, electrical, and computer engineers are tackling a large-scale civil infrastructure SHM application by proposing a new variant on sensor networking. Most sensor arrays are typically interrogated via conventional wired networks, which require centralized processing and powering. Conversely, recent technology advances in embedded architectures and power harvesting have allowed wireless networks to be developed, where each individual sensor is individually powered and communicates with neighboring sensors or substations via hopping protocols. This work will present a hybrid approach to sensor array interrogation, where both power and data interrogation commands are conveyed via an autonomous aerial vehicle that is sent (via remote piloting or GPS autopilot programming) to each sensor or node to perform the individual interrogation. Power does not have to reside at the sensor node, relaxing battery or other such powering requirements. This work will discuss such a prototype system, which will be used to interrogate impedance-based and capacitive-based preload sensors on a full-scale bridge.
INTRODUCTION
Post-event (e.g., after an earthquake) assessment of structural systems is a critical link in the path towards returning the system to safe and reliable service. Such an assessment may be particularly important if the system is itself a critical link in both the short-term emergency response and in the long-term economic viability of the community it serves. An example could be a bridge over which rescue vehicles must traverse for first response and people must traverse for safety (short term) and over
Michael Todd, David Mascarenas, Eric Flynn: Dept. Structural Engineering, University of California San Diego, La Jolla CA 92093-0085; Tajana Rosing, Ben Lee, Daniele Musiani, Sanjoy Dasgupta, Samori Kpotufe, Daniel Hsu, Rajesh Gupta: Dept. Computer Science and Engineering, University of California San Diego; Gyuhae Park, Tim Overley, Matt Nothnagel, Chuck Farrar: Engineering Institute, Los Alamos National Laboratory, Los Alamos NM 87545. Contact: Michael Todd, [email protected]

which significant commercial traffic must traverse (long term). The vast majority of these post-event assessments, particularly for civil infrastructure such as bridges, are currently done by human visual inspection. In many instances, however, human visual assessments cannot be made quickly or efficiently, either due to inspector unavailability or to life safety issues posed to the inspector(s). These aspects are further highlighted when the structure itself is expansive and/or has a number of areas that are not easily accessible.
Figure 1. SHM paradigm.
The field of structural health monitoring (SHM) is an integrated paradigm [1] of networked sensing and actuation, data interrogation (signal processing and feature extraction), and statistical assessment (classification of damage existence, location, and/or type) that attacks structural health assessments in a systematic way (Figure 1). In the last decade or so, particularly after the 1994 Northridge, California, earthquake, some automated post-event strategies that take advantage of this SHM paradigm and don’t rely upon direct human visual inspection have been developed. These techniques broadly fall into two general classes: (1) advanced data mining strategies from conventional sensor networks (e.g., extracting vibration properties from an accelerometer array) and (2) data mining strategies from remote sensing modes, such as satellite imagery or LiDAR, used in conjunction with geographic information systems (GIS). A recent literature review report considering a number of techniques for the former class (not necessarily only applied to civil infrastructure) may be found in [2], while a more specific report of some of the techniques’ applications to post-earthquake building assessment may be found in [3]. A recent article discussing the merging of digital photogrammetry with a GIS for post-earthquake infrastructural damage assessment may be found in [4]. In both classes of techniques, an appropriate sensor network is required as a first line of attack in observing the structural system behavior in such a way that suitable signal processing and damage-sensitive feature extraction on the measured data may be performed.

SENSOR NETWORKING PARADIGMS
Sensor networks, generally speaking, contain four main components: the sensing mechanism, computation, telemetry, and power management [5,6]. In many SHM applications, a fifth component—actuation—is also required. Such applications are known as “active sensing” applications because a user-prescribed excitation signal is applied to the system via the actuator and then detected by the sensor network after interaction with the system. The sensing component refers to the actual transduction mechanism that converts a physical field (such as acceleration) into a measurable form (usually electrical potential), or in the case of actuation, that converts an electrical signal into a physical field (usually displacement). The computation component refers to the relevant signal processing, analog-to-digital and/or digital-to-analog, and control processing that must be completed, and telemetry refers to how data are moved and managed throughout the network. Overarching all of these components is the very important concept of power management for the node’s tasks.
The most common general architecture that integrates these components is a conventional wired sensor network. Here, individual sensing components typically stand alone and are connected via conductive cabling to a centralized data processing and multiplexing unit. Each sensor is effectively independent of other sensors in the network—each sensor has its own cabling—and controlled synchronized interrogation of the entire network is achieved only through the central unit. This interrogation is typically only passive as well, meaning that the sensors individually provide information to the central unit, but the central unit cannot pass information back to an individual sensor. In applications demanding control or feedback, then actuator arrays (e.g., piezoelectric actuators) can take the place of some of the passive sensor arrays, but typically each node (sensor or actuator) is still individually wired and connected to a central unit. There are also some variations on this architecture, such as with Bragg grating fiber optic sensors [7]. In this case, the unique wavelength multiplexing of each individual sensor allows them to be arrayed into a single optical fiber (‘cable’) when illuminated by a broadband optical source, so that the total cabling budget is substantially reduced. The advantage of this wired architecture is the wide variety of commercial-off-the-shelf systems—both sensor modalities and data acquisition/signal processing units—available for deployment. Limitations of such systems are that they are difficult to deploy in a retrofit mode because they usually require AC power, which is not always available for in-situ structures. Also, these systems are one-point failure sensitive, as one wire may be as long as a few hundred meters. In addition, the deployment of such system can be challenging with potentially over 75% of the installation time attributed to the installation of system wires and cables for larger scale structures such as those used for long-span bridges [8].
While the majority of sensor networks in use today employ this wired architecture, development and deployment of wireless sensor networks has exploded in recent years. Wireless communication protocols are now standardized with such protocols as IEEE 802.11 through 802.16, and bandwidths are now approaching that of conventional wired networks. Furthermore, increases in chip real estate and processor production capability have reduced the power requirements for both computing and communication. In fact, sensing, telemetry, and computing can now be performed on a single chip, reducing the cost further and permitting economically viable high-density sensor networks. All of these advances have yielded wireless

sensor networks that increasingly meet the original visions for these networks: (1) a large number of individual sensor nodes, densely deployed in possibly random configurations in the sensing environment; (2) the capability for self-organization and near-neighbor awareness so that information exchange between an individual node and a user may be achieved via point-to-point hopping protocols; (3) cooperation between sensor nodes, where they use local processing capability to perform data fusion or other computational duties and then only transmit required or partially processed onward [9].
With these goals in mind, a general schematic of a wireless sensor network architecture is shown in Figure 2 [10]. Individual sensor nodes are deployed into the environment. These nodes communicate data back to a sink node via multi-hopping near neighbor communications. The sink node communicates with the overall task manager (where the user sits) through internet or satellite links. The individual sensor nodes themselves are composed of four basic modules: sensing, processing, communications, and power management. The sensing module consists of the actual sensor itself—usually derived from the microelectromechanical (MEMS) class of sensor—which creates an analog voltage signal from interaction with the environment and some sort of analog-to-digital converter. The processing module consists of a microprocessor (computer) and storage elements. Digitized data from the sensing module is fed here for computational reduction and fusion, and this module also controls the algorithms required to manage communication with the rest of the network. The communications module, through an antenna and associated hardware, directly connects the sensor node to the network. Finally, supporting all these
modules is the power management module, which must provide, regulate, and
sinknode
sensor nodesinternet/satellitecommunications
task manager node(user)
power management
sensing processing communications
Figure 1 Typical wireless network architecture (above) and node components (below).

maintain power demands (which are themselves dynamically evolving) to each module.
A variant on this wireless sensing architecture, specifically intended for active sensing applications, was presented by Farrar et al. [5] and substantially investigated in more detail by Dove et al. [11]. The variant advantageously combines wired and wireless features on different network levels. At the lowest level, several sensors are connected to a relay-based piece of hardware, which can serve as a multiplexer, sensor/actuator node signal manager, and general-purpose signal router. The device can also be expandable by means of daisy-chaining. At the second level, multiple components of this hardware are linked to a decentralized data control and processing station. This control station is equipped with data acquisition boards, on-board computing processors, and wireless telemetry similar to the architecture of the more typical decentralized wireless sensor nodes described above. This device serves as a hardware relay controller, local computer, and transmitter of processed data to the central monitoring station at the highest level. At the third and highest level, several of these second-level data processing stations are linked to a central monitoring station that delivers a system assessment to the user. The primary advantage of this very hierarchal network design is that it can efficiently interrogate large numbers of distributed sensors and actuators while maintaining an excellent sensor-cost ratio because only a small number of data acquisition and telemetry units are necessary. ALTERNATIVE SENSOR NETWORK PARADIGM: AUTONOMOUS VEHICLES AS MOBILE AGENTS FOR POWERING AND INTERROGATING SENSOR NODES Sensor Networking Demands and Challenges
Several technical challenges and requirements are presented by the applications intended for the wireless networks just described, because of bandwidth restrictions, uncertain and often harsh deployment environments, and dynamic configuration demands. For example, the networks must be autonomously reconfigurable, meaning that each node, after deployment, must be aware of, identify, and locate its neighbor nodes. Of course, planned networks eliminate this challenge, but such ad hoc networks are becoming the norm since they can update periodically as both the environment changes or as nodes fail. Since there is no planned connectivity in ad hoc networking, the software must provide this information as necessary. It must consider, autonomously, communications distance and energy for identifying the right routing. The network must know how to optimally determine collaborative computations, balancing energy, latency, and robustness. Processing data from many sensors results in better performance and robustness but at the cost of more network resources. Similarly, network losses are lower when information is communicated at an unprocessed level but at the expense of higher bandwidth. Furthermore, as individual nodes receive neighboring information, they must intelligently fuse it with local information. Data fusion algorithm must be able to identify, classify, and accept or reject data packets all within the constraints of limited energy resources. Finally, the network, depending on the application, may have to deal with issues such as data security and seamless communication between mobile and fixed platforms.

Some of the technical challenges presented above have been partially addressed with the use of mobile agents [12]. The architecture of Figure 2 indicates that data collected by individual nodes are processed locally before transmission to sink (or possibly local fusion) nodes. Because of bandwidth restrictions, such a sensor network’s communications requirements may exceed its capacity. With mobile agents, data stay unprocessed at each local node, and the integration, processing or fusion code is transported to the data. This will reduce bandwidth requirements if the agent is smaller in size than the data. Under this assumption the network scales more efficiently, since the performance of the network is not affected by an increase in the sensor count. The network can also adapt better to the load demand, and agents can be programmed to carry specific processes. Autonomous Vehicles As Mobile Agents
An entirely different mobile agent approach is possible by allowing the agent
itself to be the communications network. A number of applications exist where sensor nodes need to be queried as usual, but limitations prevent the sensor nodes from being traditional nodes with all the modules presented in Figure 2. Consider, for example, an array of passive sensors is deployed that is only capable of sensing physical phenomena but have no digitization, communications, or processing capability (e.g., a passive strain gage with no voltage potential applied). What if an external autonomous agent could, in turn, take all power, communications, and processing capability to each sensor? A multi-disciplinary research team from the Los Alamos National Laboratory (LANL)—University of California San Diego (UCSD) Engineering Institute, comprised of faculty and students from the Structural Engineering and Computer Science and Engineering Departments at the Jacobs School of Engineering and LANL staff and graduate research assistants, is considering such a scenario: an unmanned vehicle (UV), such as a robot or an unmanned aerial vehicle, could be used in this very way with an otherwise completely passive sensor network. This paradigm considers the advantages of coupling radio frequency (RF)-interrogated sensors with a UV that is either remotely-piloted or GPS-programmed to move to the sensor target field, identify and locate sensors, power and interrogate each sensor in turn, and perform necessary local computation and storage in accordance with overall task goals. In Figure 3, for example, the user communicates with an unmanned aerial vehicle that contains GPS-programmed autopilot, an RF communications system, and local processing/memory. Power is generated by the engines and bled for powering or sensor interrogation when required. UAVs (and other unmanned vehicles) are currently in use for surveillance and monitoring applications. These vehicles are either flown interactively with a ground pilot using visual cameras and a GPS locator or they are flown autonomously by programming an autopilot using a GPS locator and altimeter. In this application, the UAV will be flown by remote pilot to the deployed sensor network, power each node autonomously, query the node, and perform required processing before reporting to the user. The UAV deployed in this application is a Spectra-G radio-controlled helicopter from Miniature Aircraft USA, shown in the middle of Figure 3, which has a rotor diameter of 1.6 meters.

Very broadly speaking, the overall approach that the Engineering Institute team is taking is shown at the bottom of Figure 3. For a critical infrastructure system (such as a bridge), structural models are built and verified to a required degree of accuracy through traditional monitoring methods. An optimization routine (Figure 4) is performed with the model employing evolutionary programming (genetic algorithm-based) techniques: first, an initial array of sensor node configurations is each individually trained via a neural network to map to a response vector (which could be defined by high-level performance variables, health assessment features, “raw” structural response, combinations therein, etc.). Each configuration is ranked based on a fitness (cost-based) function, returned to the population of all sensor
Figure 4 Optimization scheme used to create sensor node deployment map.
Figure 3 Using a UAV as a mobile agent in sensor networking (top); Integration with the overall SHM paradigm (bottom).

configurations, and the process is iterated under genetic evolution principles until an optimum is found based on fitness. This optimum configuration is the deployment spatial map, and the individual sensor nodes are put on the structure for interrogation. Such an approach is quite effective for sensor node placement, even with an imperfect model, since the optimization is performed on the user-defined performance vector. Sensor Node Design
The sensor node architecture is shown in Figure 5. The initial sensor node (THINNER) utilizes a sensor package interface, an AD5933 impedance measurement chip, an ATmega128L microcontroller, a 2.4 GHz XBee radio for wireless communication, and an X-band horn antenna for transmission (although current updates to the node are using S-band radio components), and a microstrip patch antenna for reception. The ATmega128L is the low voltage (3.3 V) version of one of the larger microcontrollers in the AVR family. It features 128 KB of flash memory, 4 KB of static random access memory (SRAM), and it contains dual Universal Asynchronous Receivers/Transmitters (UARTs) and a two-wire interface (TWI). The UARTs and TWI are both essential for communicating with the telemetry system and the measurement chips. The UART also allows communication with the RS-232 port on a PC. The ATmega128L includes an 8 MHz internal oscillator for master timing control, eliminating the need for an external oscillator and hence reducing the size of the node.
Figure 5 Sensor node architecture.

The wireless telemetry system is based on the 2.4 GHz XBee radio from
Maxstream. The XBee radio comes in a variety of antenna configurations. The recently released radio (AT86RF230) can operates under low-power standards (3.3 V) and consumes between 16 to 17 mA for receive and transmit (Rx/Tx operations). Typical range for the radio is 90 m line-of-sight, and 30 m in an office setting. The integrability and ease of use of the Xbee radio were the main drivers for its selection for the node. The only requirements beside the power and ground lines are the connections to the UART Rx/Tx pins. A more detailed description of the sensor node layout and its components can be found in [13]-[15]. The sensor node also integrates several components, including multiplexers for managing up to seven piezoelectric transducers per node, energy harvesting and storage mediums, and a wireless triggering circuit into one package to truly realize a comprehensive, self-contained wireless active-sensor node for SHM applications. The impedance measurement chip may also be replaced in some node designs by a capacitance-to-digital conversion chip, suitable for passive peak-displacement or bolt preload measurement (discussed below).
It is important to note that the operation of these particular sensor nodes is very flexible. The microcontroller can be easily programmed to perform a number of different operations with the data. All of the integrated circuits used in the sensor node only come in surface mount packages, the total sensor board measures 5.5 x 3.7 cm (see blow-up of the upper right corner of Figure 5). The 4 KB of SRAM in the current design is sufficient for initial investigations. Most other SHM applications that require the memory intensive algorithms would probably call for additional memory. The possibility of adding additional SRAM, or even a USB mass storage device, is currently also being explored for more demanding SHM applications. Sensor Packages
Currently, three sensor modalities are being developed or deployed for use with this node. The first sensor modality, first tested in [13] and later expanded in [14] and [16], was a piezoelectric sensing element integrated with nuts and washers. With this element, electromechanical impedance was measured via an Analog Devices AD5933 impedance measurement chip. The impedance method takes advantage of the electromechanical coupling between the element and the structure such that damage-induced changes to the structure’s mechanical impedance correlate with measurable changes to the element’s electromechanical impedance; the method can also be used for sensor self-diagnostics [17]-[18].
A picture of such an impedance-measuring device is shown at the bottom left of Figure 5. This device was integrated into a bolted joint used in a beam structure, and the bolt was torqued with a calibrated wrench. At each level of tightening, an impedance measurement was made with both a National Instruments data acquisition system and the sensor node. The resulting measurements can be found in Figure 6. From the sensor node data shown, one can clearly see that the identified resonant frequencies show the same behavior the corresponding data obtained NI measurement system. The dominant peak at 87 kHz is very pronounced under no preload, and this peak disappears under load. Furthermore, the smaller peak slightly above 84 kHz is also captured by both impedance measurements. Clearly the main
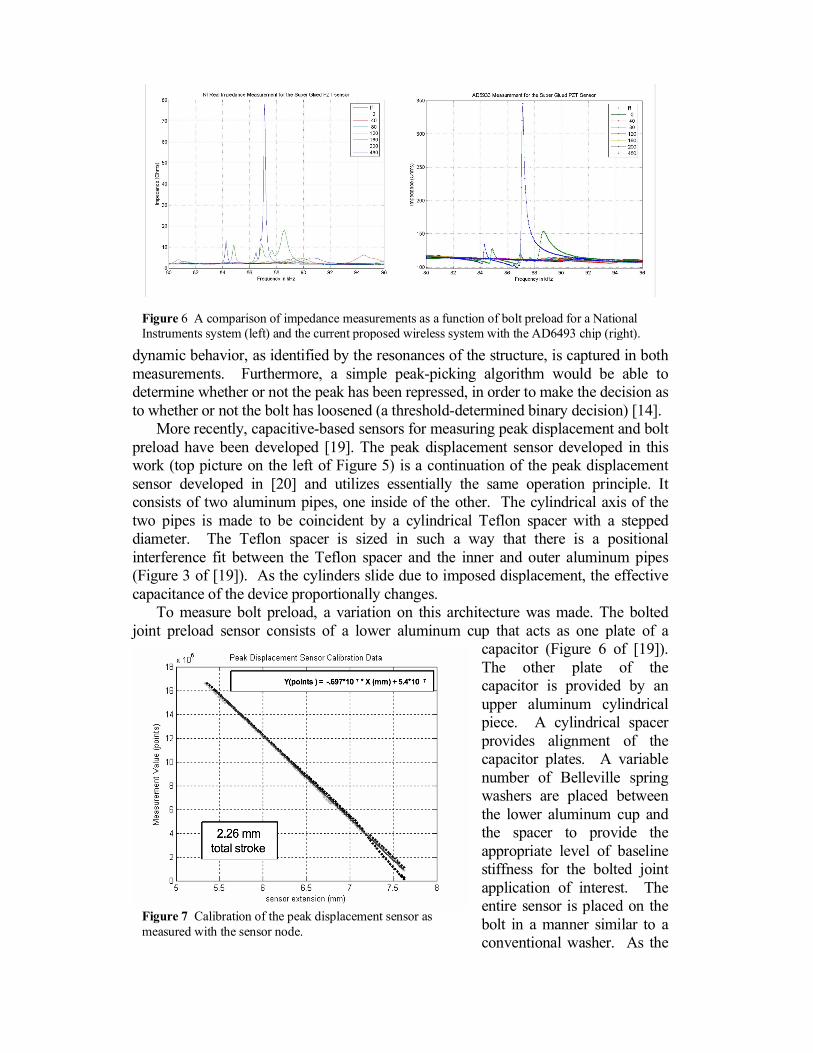
dynamic behavior, as identified by the resonances of the structure, is captured in both measurements. Furthermore, a simple peak-picking algorithm would be able to determine whether or not the peak has been repressed, in order to make the decision as to whether or not the bolt has loosened (a threshold-determined binary decision) [14].
More recently, capacitive-based sensors for measuring peak displacement and bolt preload have been developed [19]. The peak displacement sensor developed in this work (top picture on the left of Figure 5) is a continuation of the peak displacement sensor developed in [20] and utilizes essentially the same operation principle. It consists of two aluminum pipes, one inside of the other. The cylindrical axis of the two pipes is made to be coincident by a cylindrical Teflon spacer with a stepped diameter. The Teflon spacer is sized in such a way that there is a positional interference fit between the Teflon spacer and the inner and outer aluminum pipes (Figure 3 of [19]). As the cylinders slide due to imposed displacement, the effective capacitance of the device proportionally changes.
To measure bolt preload, a variation on this architecture was made. The bolted joint preload sensor consists of a lower aluminum cup that acts as one plate of a
capacitor (Figure 6 of [19]). The other plate of the capacitor is provided by an upper aluminum cylindrical piece. A cylindrical spacer provides alignment of the capacitor plates. A variable number of Belleville spring washers are placed between the lower aluminum cup and the spacer to provide the appropriate level of baseline stiffness for the bolted joint application of interest. The entire sensor is placed on the bolt in a manner similar to a conventional washer. As the
Figure 7 Calibration of the peak displacement sensor as measured with the sensor node.
Figure 6 A comparison of impedance measurements as a function of bolt preload for a National Instruments system (left) and the current proposed wireless system with the AD6493 chip (right).

bolt is tightened, the Belleville washers deflect, and the upper aluminum capacitor plate retracts into the lower aluminum cup, increasing the effective area of the capacitor.
Since both sensor architectures are capacitive, the impedance measurement chip is replaced with an AD7745 capacitive-to-digital chip. A calibration test using the sensor node was performed on the peak displacement sensor by imposing a known linear displacement and letting the node report the raw measurement value. The linearity for these devices is quite good, with a typical result shown in Figure 7. Resolution was determined in the experiment to be about 1.32 micron for the 3-byte capacitance measurement, with a dynamic range of 2.26 mm (stroke limited). Repeat tests revealed accuracy errors on the order of 25 micron, which is primarily due to the mechanical construction of the sensor. Current work is addressing such manufacturing issues for the sensor.
Node Power Requirements and Management
The fundamentally wireless operation of such sensor nodes mandates that the power requirements of the individual components be carefully considered, given limitations with current wireless transmission technology. Table 1 shows the power requirements for the various sensor node components during both normal operation and the power-down or sleep mode, where the AD5933 chip is used in the example (although the AD7745 chip is similar).
Normal Power
(mW) Power-Down Power (µW)
AD5933 33 2.31 XBee 60 3.3 ATmega128L, 8 MHZ CLK 31.35 16.5 Total Power 124.35 22.11
Table 1 Power requirements for both normal and power-down operations.
The table shows, not surprisingly, that the XBee radio is by far the largest single power consumer in node, accounting for nearly 50% of the total power. It is important to note, however, that the radio will have a very small duty cycle. In the SHM applications for which this node is designed, the radio only needs to transmit a few bytes of data to indicate binary or tertiary discrete health assessments, e.g., “healthy” and “unhealthy.” Typically, the power consumption of the sensor node during normal operation is around 64.35 mW. This operational-mode power demand is much smaller than other active-sensor nodes currently under development, e.g. [21, 22].
The conventional power supply for wireless sensor nodes is generally some form of battery. As sensor networks become more widespread and involve more active elements, the battery power supply quickly becomes unsuitable from both an operational and maintenance standpoint. The ideal solution would be to design sensor nodes with a power supply that does not need replacement over the entire projected lifetime of the sensor network. A possible solution to the problem of localized power generation is technologies that enable harvesting ambient energy, whether thermal, vibration, acoustic, or solar, to power the node. Although extensive research has been

conducted in energy harvesting, either inadequate conversion efficiency or inadequate ambient energy availability has made such approaches for most SHM applications infeasible. Therefore, methods of increasing the amount of energy generated by the power harvesting device or developing new and innovative methods of accumulating the energy are the key technologies that will allow energy harvesting to become a practical source of power for wireless SHM systems [23].
The power consumption in the power-down mode is also very important, especially if energy harvesting from ambient sources is to be employed. The energy harvesting device must supply more than the power-down power consumption in order to ensure a positive energy flow into the energy storage device [24]. The power-down requirements of this current wireless sensor node are rather high at 22.11 µW, and a large percentage of the power provided by the energy harvesting solution will be consumed just to keep the sensor node in power-down mode. This preliminary power analysis shows that, for example, ambient mechanical vibration energy harvesting may only be suitable for this sensor node in the power-down mode.
For this reason, alternative power supply schemes have been explored. The wireless energy transmission technology that has received the most attention in the last fifty years is that of microwave transmission [24,25]. Microwaves are readily transmitted through the atmosphere and detected by a rectifying antenna (rectennas). This design typically allows for much higher efficiencies, in the range of 50%-80% DC-to-DC power conversion. Significant testing of microwave energy delivery over long distances and high-power (kW) levels has been recently investigated for high-power actuator requirements [27], but the application of this technology to low-power electronics has not been substantially studied, and the application for SHM sensor nodes has never been considered in the literature.
In order to investigate the feasibility of wireless power transmission for sensor node operations, a feasibility experiment was established. The transmission frequency X-band at 10 GHz was chosen in order to facilitate the design of small antennas with high gain. Details of this experiment are described in [28], but a summary is provided here. In this setup, 1 W of X-band radiation was transmitted from a horn antenna over a distance of 0.6 m with aligned linear polarization. At the receiving end, a rectenna is constructed from a horn antenna and an eight-stage voltage multiplication circuit. The DC voltage from the recetenna is used to charge up a 0.1 F supercapacitor. Once a sufficient amount of voltage has built up in the supercapacitor, the stored energy is
0 1 2 3 4 5 6 70
0.5
1
1.5
2
2.5
3
3.5
4Discharge Characteristics of .1 F capacitor connected to an XBee radio
time (s)
.1 F capacitor Voltage
3.3 V initial
charge
XBee on
Energy usage for 8, 32 B Rx/ Tx
operations
XBee off
0 1 2 3 4 5 6 70
0.5
1
1.5
2
2.5
3
3.5
4Discharge Characteristics of .1 F capacitor connected to an XBee radio
time (s)
.1 F capacitor Voltage
3.3 V initial
charge
XBee on
Energy usage for 8, 32 B Rx/ Tx
operations
XBee off
3.3 V initial
charge
XBee on
Energy usage for 8, 32 B Rx/ Tx
operations
XBee off
Figure 8 Charging characteristics during the test (left) and discharging characteristics (right).

used to power the Xbee radio. Rectenna performance was evaluated based on how quickly the rectenna can supply the required voltage to charge the energy storage medium, in this study a 0.1 F super-capacitor, and on how many receive/transmit (Rx/Tx) operations can be successfully completed. Both the power and voltage requirements must be met in order for the wireless energy transmission to be a suitable substitute for conventional batteries in sensor node power supplies.
Figure 8 shows the results of this test as the supercapacitor charges from 0 to 5 V. The Xbee radio operates on 3.3V levels, so the voltage across the radio needs to be between 3.3 and 2.8 volts for proper operation. Clearly the X-band source is capable of delivering the required voltage levels. The average delivered power was estimated at 2.5 mW, while analytically estimated at 85 mW by the one-way radar equation for power incident on a target. Possible reasons for the discrepancy include errors in the efficiency estimate of the antennas, the efficiency of the circuit such as the voltage drops caused by the diodes, electromagnetic reflections off the walls causing destructive interference, and a possible impedance mismatch between the receiver and the transmitter.
Once the capacitor is charged to 3.3 V (0.54 J of energy stored), the XBee radio was allowed to perform Rx/Tx operations and the number of these operations was measured. The voltage across the capacitor was recorded during this process, and the resulting discharge characteristics are shown on the right of Figure 6, beginning at 3.3 V. Once the XBee radio is allowed to drain current from the capacitor, the voltage quickly drops down to a little less than 2V. While the capacitor is discharging, the radio is able to successfully receive and transmit 256 Bytes of data using the asynchronous RS-232 protocol over a distance of 5.2 m. This experiment has shown that RF power delivery can be used to successfully operate the largest power consumer (XBee radio) in the sensor node. Furthermore, the Xbee radio would generally have a very small duty cycle in comparison to the rest of the sensor node. A typical measurement would require transmitting only a couple of bytes of data in the case of the intended SHM applications.
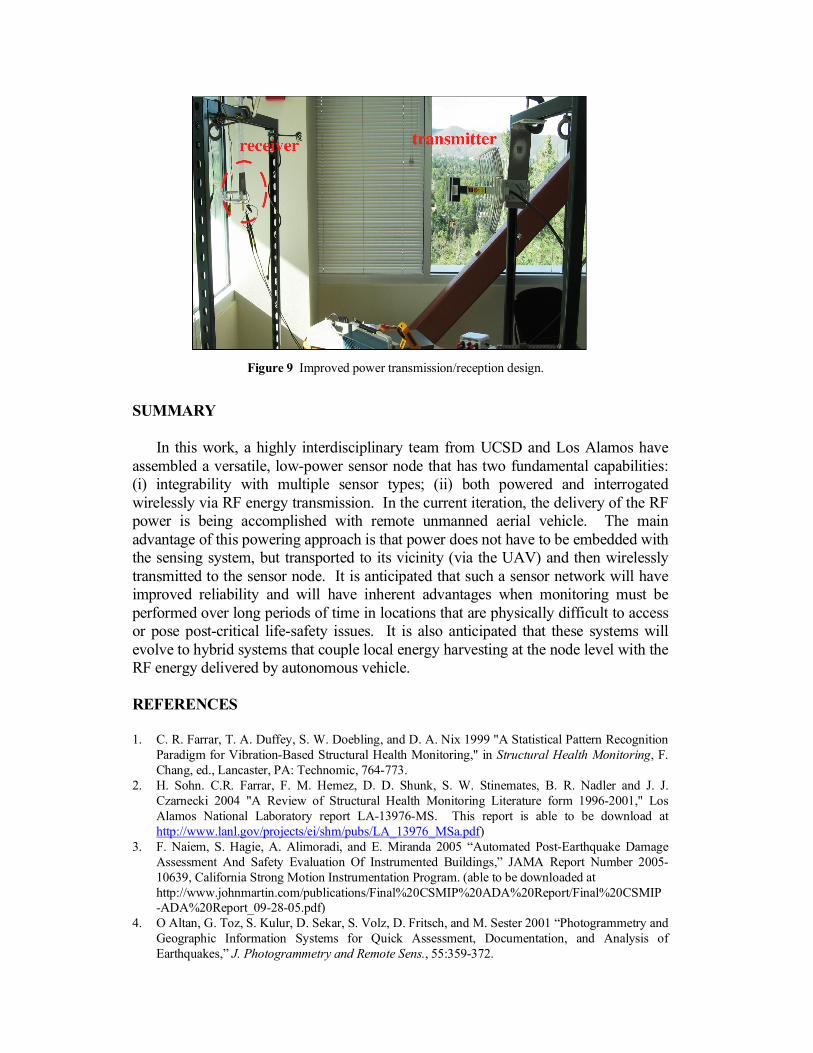
We are currently investigating an improved design for wireless energy transmission. The band selected for this system is the 2.4 GHz in order to stay within Industrial, Scientific, and Medicine band. The signal is broadcast by a grid-reflector antenna, with the transmitted power of 1 W, shown in Figure 9. With a microstrip patch receiving antenna, it was estimated that a slightly higher than 4 mW of instant power was delivered to the receiving component. With an array of 6 patches, the delivered power was increased to 13 mW. We are currently designing .3 x .3 m size antenna, which holds up to 18 patch antennas. With a new design, we anticipate that the instant power in the range of 25-30 mW can be delivered. This amount of power can charge the supercapacitor in tens of seconds, as opposed to a few minutes as demonstrated previously.
The method of energy transmission presented here need not be the only source of energy to a wireless sensor node. We are also investigating the use of focused visible or near-infrared light converted into DC power through a silicone based solar cell array. Furthermore, A hybrid system in which some ambient energy is collected through the use of piezoelectric or thermoelectric materials would reduce the charging time of a microwave energy system, leading to the possibility of more energetic measurements.
SUMMARY
In this work, a highly interdisciplinary team from UCSD and Los Alamos have
assembled a versatile, low-power sensor node that has two fundamental capabilities: (i) integrability with multiple sensor types; (ii) both powered and interrogated wirelessly via RF energy transmission. In the current iteration, the delivery of the RF power is being accomplished with remote unmanned aerial vehicle. The main advantage of this powering approach is that power does not have to be embedded with the sensing system, but transported to its vicinity (via the UAV) and then wirelessly transmitted to the sensor node. It is anticipated that such a sensor network will have improved reliability and will have inherent advantages when monitoring must be performed over long periods of time in locations that are physically difficult to access or pose post-critical life-safety issues. It is also anticipated that these systems will evolve to hybrid systems that couple local energy harvesting at the node level with the RF energy delivered by autonomous vehicle. REFERENCES
1. C. R. Farrar, T. A. Duffey, S. W. Doebling, and D. A. Nix 1999 "A Statistical Pattern Recognition
Paradigm for Vibration-Based Structural Health Monitoring," in Structural Health Monitoring, F. Chang, ed., Lancaster, PA: Technomic, 764-773.
2. H. Sohn. C.R. Farrar, F. M. Hemez, D. D. Shunk, S. W. Stinemates, B. R. Nadler and J. J. Czarnecki 2004 "A Review of Structural Health Monitoring Literature form 1996-2001," Los Alamos National Laboratory report LA-13976-MS. This report is able to be download at http://www.lanl.gov/projects/ei/shm/pubs/LA_13976_MSa.pdf)
3. F. Naiem, S. Hagie, A. Alimoradi, and E. Miranda 2005 “Automated Post-Earthquake Damage Assessment And Safety Evaluation Of Instrumented Buildings,” JAMA Report Number 2005-10639, California Strong Motion Instrumentation Program. (able to be downloaded at http://www.johnmartin.com/publications/Final%20CSMIP%20ADA%20Report/Final%20CSMIP -ADA%20Report_09-28-05.pdf)
4. O Altan, G. Toz, S. Kulur, D. Sekar, S. Volz, D. Fritsch, and M. Sester 2001 “Photogrammetry and Geographic Information Systems for Quick Assessment, Documentation, and Analysis of Earthquakes,” J. Photogrammetry and Remote Sens., 55:359-372.
Figure 9 Improved power transmission/reception design.

5. C. R. Farrar, G. Park, D. W. Allen, and M. Todd 2006 “Sensor Network Paradigms for Structural Health Monitoring,” Struc. Ctrl. Health Mon., 13:210-255.
6. C.-Y. Chong and S. P. Kumar 2003 “Sensor Networks: Evolution, Opportunities, and Challenges,” Proc. of the IEEE, 91(8):1247-1256.
7. A. D. Kersey, M. Davis, H. Patrick, M. LeBlanc, K. Koo, C. Askins, M. Putnam, and E. Friebele 1997 "Fiber Grating Sensors," J. Light. Technol., 15(8):1442-1463.
8. J. P. Lynch, A. Partridge, K. H. Law, T. W. Kenny, A. S. Kiremidjian, and E Carryer 2003 “Design of a Piezoresistive MEMS-Based Accelerometer for Integration with a Wireless Sensing Unit for Structural Monitoring,” ASCE J. Aero. Eng., 16:108-114.
9. B. F. Spencer, M. E. Ruiz-Sandoval, and N. Kurata 2004 “Smart Sensing Technology: Opportunities and Challenges,” Struc. Ctrl. Health Mon., 11(4):349-368.
10. I. Ajtukduzm, W. Su, Y. Sankarasubramaniam, and E. Cayirci, 2002 “A Survey on Sensor Networks,” IEEE Communications Magazine, August issue, 102-114.
11. J. R. Dove, G. Park, and C. R. Farrar 2006 “Hardware Design of Hierarchal Active-Sensing Networks for Structural Health Monitoring,” Sm. Mat. and Str. 15(1):139-146.
12. H. Qi, S. S. Iyengar, and K. Chakrabarty, 2001 “Multi-resolution data integration using mobile agents in distributed sensor networks,” IEEE Trans. Syst. Man. Cybern. 31:383–391.
13. D. L. Mascarenas 2006 “Development of an Impedance-based Wireless Sensor Node for Monitoring of Bolted Joint Preload,” M.S. Thesis, Dept. of Structural Engineering, University of California, San Diego.
14. D. Mascarenas, M. D. Todd, G. Park, and C. R. Farrar 2006 “A Miniaturized Electromechanical Impedance-Based Node for the Wireless Interrogation of Structural Health,” Proc. SPIE 6178, 129-136.
15. D. Mascarenas, M. D. Todd, G. Park, and C. R. Farrar 2007 “Development of an Impedance-Based Wireless Sensor Node for Structural Health Monitoring,” Sm. Mat. and Str. (In review).
16. T. G. Overly, G. Park, and C. R. Farrar, C.R. 2007 “Development of Impedance-based Wireless Active-Sensor Node for Structural Health Monitoring,” Proceedings of 6th International Workshop on Structural Health Monitoring, September 11-13, 2007, Stanford, CA, to appear.
17. G. Park, C. R. Farrar, A. C. Rutherford, and A. N. Robertson 2006, “Piezoelectric Active Sensor Self-diagnostics using Electrical Admittance Measurements,” ASME J. of Vib. and Acoust., 128(4): 469-476.
18. G. Park, C. R. Farrar, F. Lanza di Scalea, and S. Coccia, S. 2006 “Performance Assessment and Validation of Piezoelectric Active Sensors in Structural Health Monitoring, Sm. Mat. and Str., 15(6):1673-1683.
19. D. Mascarenas, M. D. Todd, G. Park, and C. R. Farrar 2007 “A Low-Power Wireless Sensor Node for Peak Displacement and Bolted Joint Preload Measurements,” in Structural Health Monitoring, F. Chang (ed)., Lancaster, PA: Technomic.
20. A. Mita, A. and S.Takhira, 2003 “A Smart Sensor Using a Mechanical Memory for Structural Health Monitoring of a Damaged Control Building,” Sm. Mat. and Str., 12(2), 204-209.
21. J. P. Lynch 2005 “Design of a Wireless Active Sensing Unit for Localized Structural Health Monitoring,” Struc. Ctrl. Health Mon, 12(3-4):405-423.
22. J. P. Lynch and K. J. Loh 2006 “A Summary Review of Wireless Sensors and Sensor Networks for Structural Health Monitoring,” Shock and Vib. Digest, 38(2):91–128.
23. G. Park, T. Rosing, M. D. Todd, C. R. Farrar, and W. Hodgkiss 2007 “Energy Harvesting for Structural Health Monitoring Sensor Networks,” ASCE J. Infrastruc. Sys., in press. An accompanying report may be downloaded at
http://www.lanl.gov/projects/ei/pdf_files/LA-14314-MS.pdf 24. B. Calhoun, D. Daly, N. Verma, D. Finchelstein, D. Wentzloff, A. Wang, S. H. Cho, and A.
Chandrakasan 2005 “Design Considerations For Ultra Low Energy Wireless Microsensor Nodes,” IEEE Trans. Comp., 54(6):727-740.
25. W. C. Brown 1996 “The History of Wireless Power Transmission,” Solar Energy, 56:3-21. 26. G. E. Maryniak 1996 “Status of International Experimentation in Wireless Power Transmission,”
Solar Energy, 56:87-91 27. S. Choi, K. Song, W. Golembiewskii, S. H. Chu, and G. King 2004 “Microwave Powers for Smart
Material Actuators,” Sm. Mat. and Str. 13:38-48. 28. D. Mascarenas, G. Park, M. D. Todd, and C. R. Farrar 2006 “X-band-based Electrical Energy
Delivery Systems for Wireless Embedded Sensor Nodes” in Structural Health Monitoring, A. Guemes, ed., Lancaster, PA: Technomic, 1356-1363.