title 3-7 evaluating the deformation and...
TRANSCRIPT

Title 3-7 Evaluating the Deformation and Atmospheric Signals in theInSAR of ALOS PALSAR data at Mt. Merapi
Author(s) Saepuloh, Asep; Urai, Minoru
Citation SAR研究の新時代に向けて (2013)
Issue Date 2013-02
URL http://hdl.handle.net/2433/173592
Right
Type Presentation
Textversion publisher
Kyoto University

Evaluating the Deformation and Atmospheric Signals in the InSAR of ALOS PALSAR data at Mt. Merapi
Asep Saepuloh, Minoru Urai (GSJ-AIST)
Abstract.
During the last century, Merapi eruptions characterized by effusive dome growth
and collapsed producing “Merapi Type” pyroclastic flows. The eruption of Mt.
Merapi in November 2010 was more explosive, a VEI 4 eruption, involving large
size dome and fountain collapse pyroclastic flows as well as ash falls. To obtain the
deformation precursor to the eruption, we applied a Differential Interferometric
Synthetic Aperture Radar (D-InSAR) with short-continuous baseline method using
ALOS PALSAR data. We collected 38 scenes single and dual polarization modes in
total. Among them, there are only 25 scenes plausible for D-InSAR analysis due to
low coherency and data quality. To reduce the atmospheric disturbance in the
interferograms, we combined the Pair-wise Logic (PWL) with Referenced Linear
Correlation (RLC) method. The Electronic Distance Measurement (EDM) and
Seismicity statistics prior to the eruption were used to know the correction
performance. This proposed method was proved effective to reduce the atmospheric
phase twice from deformation phase.
Time Series Interferogram after Atmospheric Correction
N
10 km
TowardsSatellite
図.Interferograms after PWL and RLC atmospheric corrections show uncorrelated
signal between Mt. Merbabu (North Triangle) and Mt. Merapi (South Triangle).
3-7

Evaluating the Deformation
and Atmospheric Signals in
the InSAR of ALOS
PALSAR data at Mt. Merapi
Asep Saepuloh* and Minoru Urai *Postdoctoral Research Fellow
Geological Survey of Japan (GSJ-AIST)
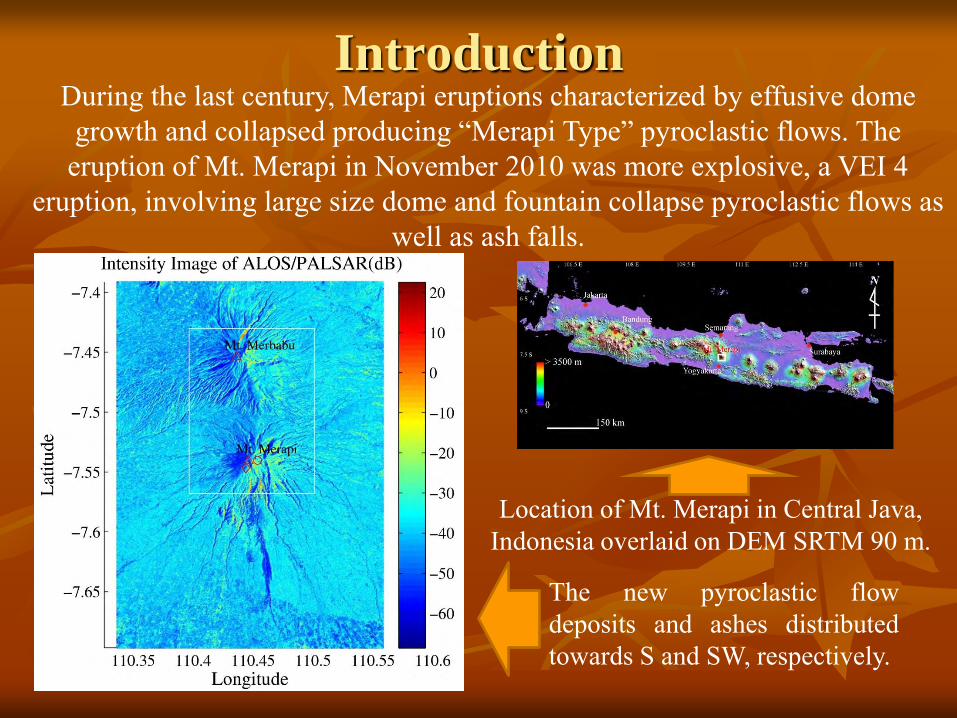
Introduction
Location of Mt. Merapi in Central Java, Indonesia overlaid on DEM SRTM 90 m.
During the last century, Merapi eruptions characterized by effusive dome growth and collapsed producing “Merapi Type” pyroclastic flows. The
eruption of Mt. Merapi in November 2010 was more explosive, a VEI 4 eruption, involving large size dome and fountain collapse pyroclastic flows as
well as ash falls.
The new pyroclastic flow deposits and ashes distributed towards S and SW, respectively.

Overview of Mt. Merapi Eruption in
2010 2010.11.09
The early pyroclastic flows
The damage on a village from the volcano
The eruption changed the surface dramatically
Photographs courtesy:
Bob Thompson, 2010
The effect of the hot pyroclastic flows
The effect of ash fall

ALOS PALSAR of Mt. Merapi 2006 -
2011
The quality of perpendicular baseline of ALOS PALSAR increased over time in
ascending mode.
• Since 2006, we collected 38 scenes single pol (asc: 28, des: 10) and 3 scenes PLR modes.
• Among them, only 25 scenes plausible for InSAR analysis.
• Significant orbital pattern appears in the interferogram until the beginning 2008.
• The shortest perpendicular baseline ~ 30 m was achieved in the end 2008 and 2010.

Time Series of Interferogram 2006 - 2011
Full scenes of ALOS PALSAR interferogram in ascending mode show the deformation signals still mixed with atmospheric signals event though after
elevation phase compensated.

Local Limitation of ALOS PALSAR
InSAR
Descending modes are limited; difficult to obtain three displacement component.
No GPS measurement since eruption 2006 to 2010; difficult for ground-truthing and atmospheric correction.
High tropospheric disturbance without meteorological measurement; large amount interferogram is required to reduce the atmospheric signals.
Deformation is not constant over time; statistical based method is difficult to be applied.

Atmospheric Corrections
1. Pair-wise Logic (PWL): Comparing interferograms spanning different time intervals that has a common image acquisition, assuming that the atmospheric signal contaminated the displacement signal in both interferograms (Massonet and Feigl, 1995).
2. Referenced Linear Correlation (RLC): A linear phase subtraction of the atmospheric signals coming from atmospheric-induced interferometric phase at stable elevations.

S-3
(A-C)
P-4
(B-C)
PWL Atmospheric Correction
P-3
(A-B)
= +
+ -
- +
+ -
The atmospheric disturbance can be seen as opposite signals presented in both interferograms which have common image
acquisition. Addition both interferogram reduced the atmospheric signal, but doubled the deformation signal.

Remaining Atmospheric Signals
P-16 P-17
(A-B) (B-C) (A-C)
+ - + - + + -
+ -
S-16
=
The PWL reduced the atmospheric signal in the common image acquisition, but the signal might be still remain especially at the high
elevation.
+ =

RLC Atmospheric Correction
Y=(5.6×10⁻⁵)X-0.08
13×143 px

Time Series Interferogram after Atmospheric Correction
N
10 km
Towards Satellite
Interferograms after PWL and RLC atmospheric corrections applied show uncorrelated signal between Mt. Merbabu (North Triangle) and Mt. Merapi
(South Triangle).

Eruption
Atmospheric Correction Performance
Tow
ard
Sate
llite
meter
C
• The interferogram S-18 (091214-100316) after PWL and RLC correction shows the signal supposed to be related with deformation.
• The red dot “C” indicated the LOS deformation measurement point.
• Time series LOS deformation before and after atmospheric correction applied.
• The deformation was fluctuated with maximum inflation in the early 2009 followed by depletion before increased in early 2010.
5 km

Electronic Distance Measurement
(EDM)
Sensor
Source
Illustration of LOS displacement and EDM change distance observing same
object at the summit of volcano.
• The length of a linear interval is determined by the use of equipment that sends out an electronic impulse of some sort and measures the time required for the impulse to travel the length of the interval.
• Since we used in ascending mode of the ALOS PALSAR, the look direction is in the same side with EDM observer with respect to the summit.
• Increasing EDM distance might be related with LOS inflation, except the local landslide acurred at the reflector position.
0.5 km
EDM Reflector

Conclusions
The atmospheric corrections in the InSAR at Torrid Zone are necessary due to high atmospheric disturbance.
Limited field measurement required more advanced method in case by case basis.
For the case Mt. Merapi, combination of the PWL and RLC is effective to reduce the atmospheric disturbance in the interferograms.