titeldia asset management @ por
TRANSCRIPT

Titeldia
AAPA 2019 Facility Engineering Seminar, Jacksonville (FL), April 25 th, 2019
Port of Rotterdam’s road to world-class asset management
ASSET MANAGEMENT @ PORDON’T PLAN REPAIRS. PREDICT THEM

Tekst + afbeelding (S)
Port of Rotterdam in figures
29 april 2019|2
Employment
Port of Rotterdam engine of the economy
• Total port area 12,643 ha (net 6,046 ha)
• Total employment 385,000 people*
• Total added value € 45 billion (6.2% GNP)*
• 3,000 companies
• Largest port in Europe, 10th port worldwide
• Throughput 2018: 469 mln tons;14.5 million TEU
• Depth up to 75 ft (= 24 m)
• Visits (2018): 29,475 sea-going vessels120,000 inland navigation

Custom (Wit)
Port and industrial area
29 april 2019|3
+

Afbeelding (3x) + Ondertitel
Dominated by fossil fuels and logistics
29 april 2019|4
Cargo ratios in 2016
48%
27%
19%
6%
Liquid bulk Containers
Dry bulk Breakbulk

Afbeelding (XL)
Water depth European ports
29 april 2019|5
-80
-70
-60
-50
-40
-30
-20
-10
0
1
Ro
tte
rda
m
Le H
avre
Am
ste
rdam
An
twerp
Bre
merh
aven
Ham
bu
rg
Vliss
ing
en
Wilh
elm
sh
aven
APM S-Class & HPL HAX-Class Malacca-max
Object (XL)
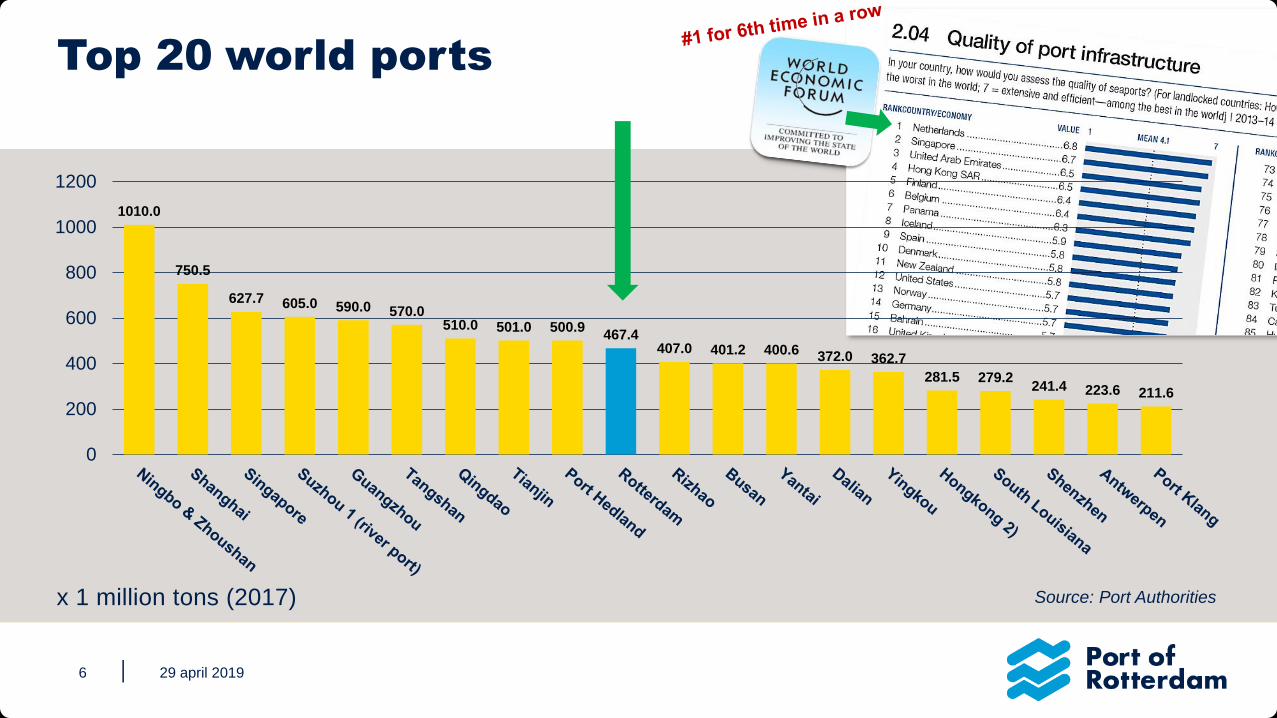
Top 20 world ports
29 april 2019|6
x 1 million tons (2017) Source: Port Authorities
1010.0
750.5
627.7 605.0 590.0 570.0510.0 501.0 500.9
467.4407.0 401.2 400.6 372.0 362.7
281.5 279.2241.4 223.6 211.6
0
200
400
600
800
1000
1200

7
Port of Rotterdam Authority Private Business
Landlord port model

Tekst + afbeelding (M)
The assets of PoR
Total of 32 asset types
• 70,5 km Quay walls
• 180 km Embankment
• 310 ha Roads
• 3.500 ha Sea bed
• Civil Structures, Buildings, Vessels etc.
Invested Capital € 3,66 Billion
Maintenance budget € 72 Million
Approx. 120 employees in AM
8

▪ Deferred maintenance costs
▪ Inadequate capital allocation
▪ Run-to-failure repair & maintenance
programs
▪ Inspections based on random
observations
▪ Loss of competitive edge and
productivity
▪ Safety/security concerns
Deterioration of Infrastructure Assets

Asset Management : A Strategic Imperative
Waterfront structures like quays, jetties and
wharves are the pivot of the business case
Income of the Port depends on the
availability of the asset
Loss of profit will decrease cash flow and
thus the opportunity to invest in the future
Disruption to the tenant’s business is the
most unwanted situation

More intensive use of assets Expansion for larger ships
Justification of maintenance plan to
board of directors Extension of tenant leases
Asset Management - More Challenges
But what do
we focus on
first?
AM

Objective in Asset Management Culture
29-4-2019

Custom (Geel)
Asset Management Program: Stepstones
Step 1 : Document the assets owned and managed
Step 2 : Understand the current condition of the assets
Step 3 : Understand what budget is needed to catch up, keep up and move forward
Step 4: Understand what endangers the functionality : risk analysis
Step 5 : Understand the business value, what the contribution of an asset to the business goals
Step 6 : Establish the level of service for an asset and calculate the cost of service
Step 7: Prioritize the needed budget based on risk and business value

Expert system: KMS
• Port of Rotterdam developed in partnership an asset management tool called KMS, which is the Dutch abbreviation of Quay wall Modeling System that:
−Uses the results of detoriation models for concrete and steel and compares it with the “end of contract” date
−Identifies and ranks the risks that endanger all the functionalities of the structure
−Uses the business value of a quay wall to clarify its maintenance priority

The KMS system
Inspection module
E master data & maintenance tasks
A integrity inspection tasks
KMSC integrity related risks & tasks B inspection results
D prioritized maintenance tasks Legacy systemen
F spatial related data
F spatial related data
Risk Analysis Module

Beerkanaal, Rotterdam
Asset Management on Quay Walls
• A quay wall’s remaining lifetime and system integrity is mainly determined by the quality of the sub and superstructure.
• When the quay wall’s integrity is in danger, it’s often due to:
−accelerated low water corrosion occurring at the substructure or
−concrete deterioration in the superstructure

STEP 1
23 25
Inspection Request
24
Concrete
Steel
Coring
Visual Inspection
Cathodic ProtectionCorrosion Measurements
Full AnalysisChemical Analysis
Inspection module

For each
Zone/Element
combination
Degradation Analysis
per Zone and Element
Evaluate Degradation
with STADIUM®
STEP 2
Schedule Next
Inspection
Close Monitoring
Required
Repair
Select the most critical
Zone/Element
combination
Critical Year
(Trigger/Intervention)
Maintenance
Proposal
Post Treatment Analysis
STADIUM® Expert System

STADIUM® Expert System

STADIUM® Expert System

Risk Management

Risk Strategy

Risk Analysis Expert System
Determine generic risk, effect, financial risk and probability (FMECA/RCM)
Combine asset & generic risk for a specific risk factor
One factor to express the economical added value of an asset
Prioritization of the maintenance plan based on the risk factor and business value
From Risk Analysis to Prioritization of the Maintenance Plan

Predicting
Simulating
Risk Analyzing
Prioritizing
Budget
Annual Maintenance Cycle
Q1
Q4
Q2
Q3
Planning

Long Term Asset Planning

KMS Benefits
▪ Short term:
•Transparency in annual budget for maintenance
▪ Mid - Long Term:
• Insight on residual service life and maintenance costs per structure
• Insight on total port concrete and steel costs
▪ “Just in time” inspections
▪ Proactive, prioritized and risk-based maintenance
▪ Save $$$

Return on Investment (ROI)
1400 - 1800
1800 - 1900
1929 – 1949
1948 - 1957
1960 - 1970
1970 – 2008
2008 - 2030
With More than 70 KM of Quay Walls…
An Estimated
2.1 Million Euros
in Savings
Between
Inspections

Improvements in modelling: Anode lifetime

Alleen tekst
Smart Infrastructure : Inspection vs sensoring
29 april 2019|29
“The inspector of the future is a sensor”

Custom (Wit)
Port of Rotterdam Transformation Digital Port of Rotterdam

Custom (Wit)
Container: PONU0408148
Shipment: 962354649
Origin: Maersk Line
Time: 47:16:55
Destination: Gdansk, PL
Container: YAKU0908852
Shipment: 762384641
Origin: MOL
Time: 11:36:28
Destination: Shanghai, CN
0.398 m/s
0.61 m/s
124 kN/m2
98 kN/m221,8m
19,8m
24,1m
18,1m
22,7m
25,6m
15,7m
Container: HYDA02257814
Shipment: 142933420
Origin: Hyundai
Time: 148:22:39
Destination: Rotterdam, NL
42 kN/m2
56m
48m
CMA CGM MOLIERE
Container Ship
HOLLANDIA
General Cargo
VITTORIA
Bulk Carrier
STATUS FAULT
DREDGE
PLANNED
DREDGE
PLANNED
ROUTE OK
37MW
AVAILABLE
INSPECTION
PROJECT
I.0201809
STATUS OKETD 14:42
!
ETA 12:31
PROJECT
I.0201854
COLLISION
RISK
!
UNAUTHORIZED
CONTAINER
!
NETWORK OK
CO2 956 ppm
Custom (Wit)
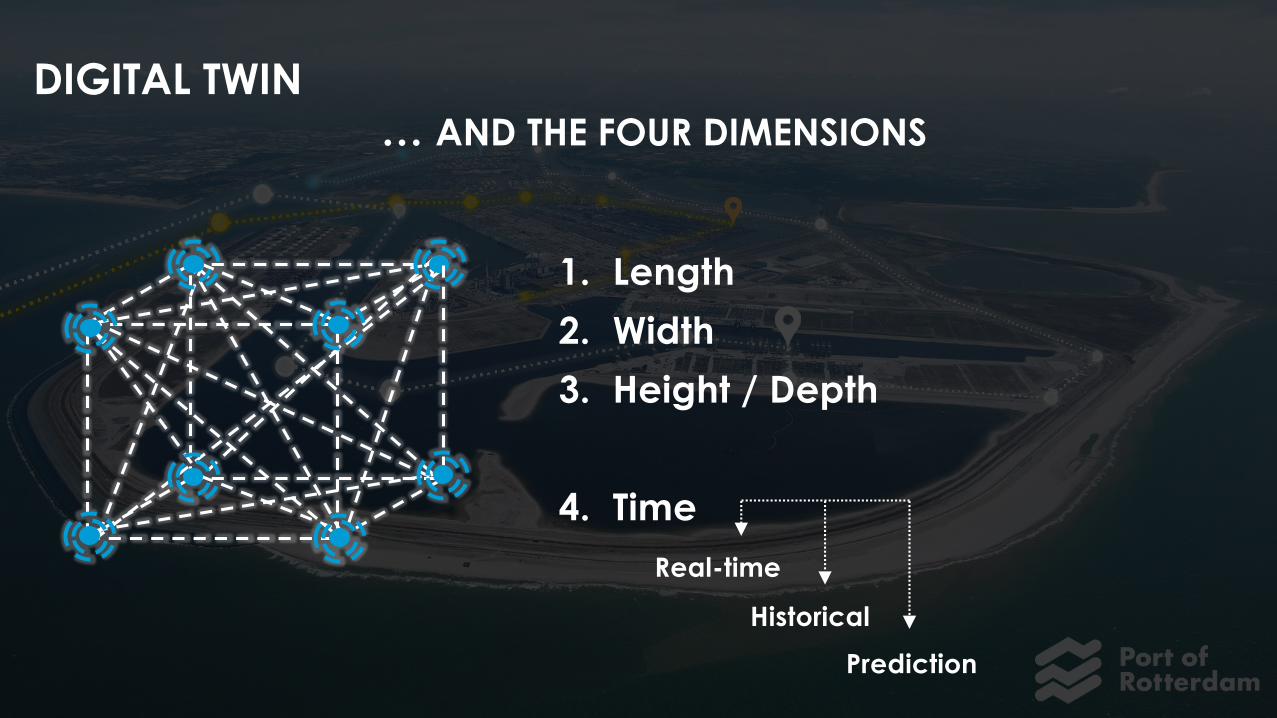
DIGITAL TWIN
… AND THE FOUR DIMENSIONS
1. Length
2. Width
3. Height / Depth
4. Time
Real-time
Historical
Prediction

Alleen tekst
Next step: stucture predicts its own maintenance
29 april 2019|33
Asset
Digital
Twin
Historical,
Real Time &
Predictive
data
Intelligence

Alleen tekst
Data Driven Asset Management
29 april 2019|34
Visualisatie3D - BIM
3D Design
Virtual Reality
Real Time AnalyticsSensoring
Image Recognition
Big Data
Data Science
Asset ManagementMobiele Apps
Workorder Management
Augmented Reality
Wearables
SAP
ESRI
PortMaps
IBM Watson
IoT Platform

Alleen tekst
29 april 2019|35
STATUS APS’S

Custom (Wit)
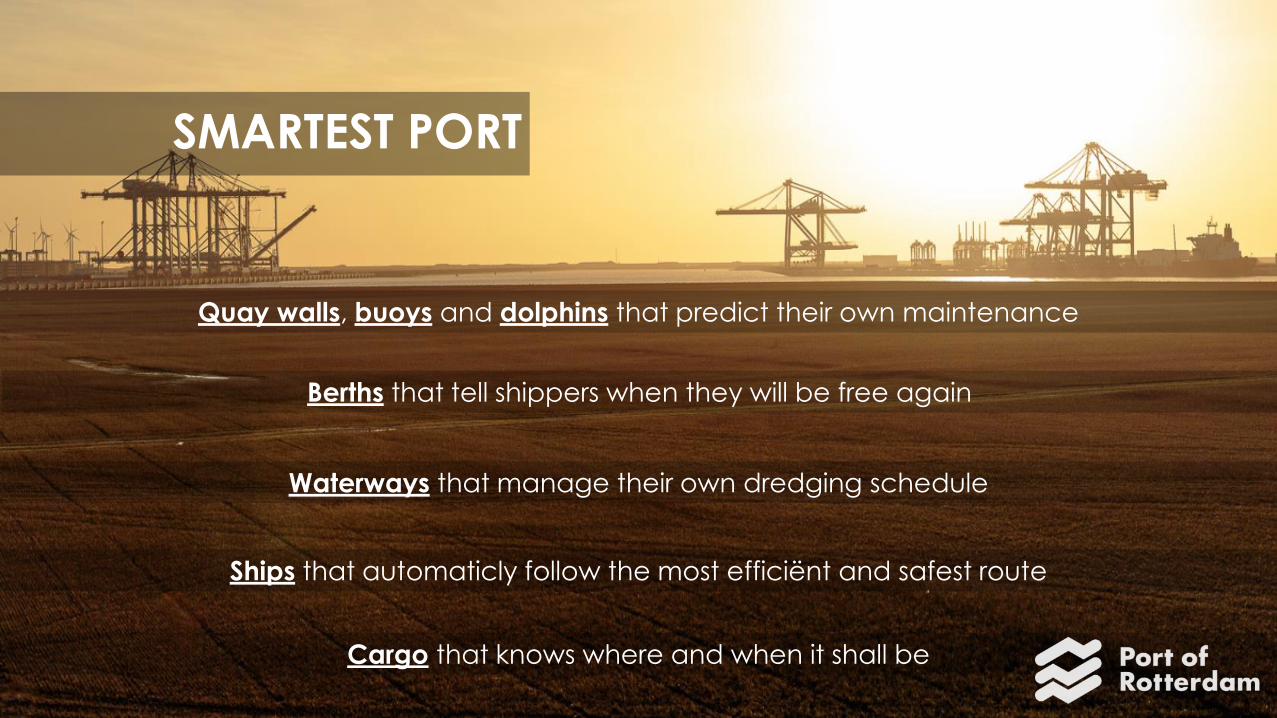
SMARTEST PORT
Quay walls, buoys and dolphins that predict their own maintenance
Berths that tell shippers when they will be free again
Waterways that manage their own dredging schedule
Ships that automaticly follow the most efficiënt and safest route
Cargo that knows where and when it shall be

Custom (Wit)
29 april 2019|38
Proactive, Predictive & Smart Waterfront Asset Management
A Strategic Imperative for the Port of Rotterdam
Contact:
Henk Voogt, [email protected]