titan company limited hosur · & accessories and tanishq in jewelry ... case manufacturing...
TRANSCRIPT

Titan Company Limited
Hosur
Green Manufacturing
10-Sep-18 1 Green Manufacturing
G

• Joint venture Promoted by TATAs & TIDCO.
• Year of Establishment - 1987
• Products - Quartz Analog Wrist Watches, Precious
Jewellery , Precision Components & Fashion
accessories .
• Brand – Titan, Sonata,Fast Track & Xylus in Watches
& Accessories and Tanishq in Jewelry
• Watch market share - 60 %
• Exports -More than 39 countries
Company profile
Watches & Accessories Division Titan Company Limited
783 918 946
1052
1309 1530
1676 1791
1921 1974 2028 2126
0
500
1000
1500
2000
2500
06-07 07-08 08-09 09-10 10-11 11-12 12-13 13-14 14-15 15-16 16-17 17-18
in R
s. C
rore
Year
2136 3041
3848 4703
6571
8970 10009
10916 11903
11179
12782
15742
0
2000
4000
6000
8000
10000
12000
14000
16000
18000
06-07 07-08 08-09 09-10 10-11 11-12 12-13 13-14 14-15 15-16 16-17 17-18
in R
s. C
rore
Year
10-Sep-18 2 Green Manufacturing
G

Manufacturing process
Case Manufacturing
Press Machining Plating Polishing
Movement Manufacturing
Turning Machining Treatment Press
Assembly
Movt.Assly Watch.Assly Strapping Testing
10-Sep-18 3 Green Manufacturing
G

Green Manufacturing - Approach
Pursue energy & water conservation initiatives • In-house experience • External expertise
Systems and procedures to sustain – QEMS , EnMS ISO 50001 & GreenCo
Maximize the renewable energy substitution • Wind energy • Solar energy
+
Conservation of natural resources Elimination of waste
Green Perspective in all our business
10-Sep-18 4 Green Manufacturing
G

Green Manufacturing - Focus areas
Renewable energy substitution
Energy & Fuel conservation
Water & Effluent management
Hazardous waste management
Cleaner manufacturing process
10-Sep-18 5 Green Manufacturing
G

Renewable Energy
10-Sep-18 6 Green Manufacturing
G
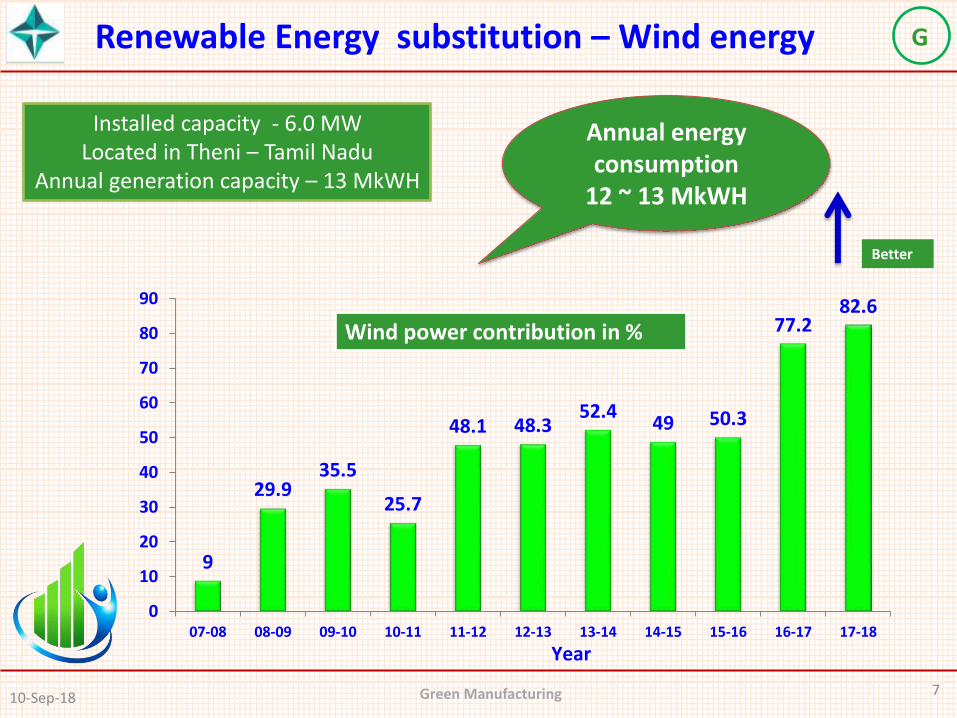
9
29.9 35.5
25.7
48.1 48.3 52.4
49 50.3
77.2 82.6
0
10
20
30
40
50
60
70
80
90
07-08 08-09 09-10 10-11 11-12 12-13 13-14 14-15 15-16 16-17 17-18
Year
Wind power contribution in %
Renewable Energy substitution – Wind energy
Installed capacity - 6.0 MW Located in Theni – Tamil Nadu
Annual generation capacity – 13 MkWH
Annual energy consumption
12 ~ 13 MkWH
Better
10-Sep-18 7 Green Manufacturing
G

Renewable Energy substitution – Rooftop solar System
Solar Power – Till 2017 -18
Capacity - 216 kW Installed during – May 2014 Investment – Rs 174 Lakh MNRE subsidy – Rs 55 Lakh
Plan 2018 -19 - To add 150 kW
As first phase , we have taken up the installation of rooftop solar system in
concrete roofing
Annual energy generation
System capacity - 3 LkWH/ annum
2.8 2.9
2.9
2.7
2.4
2.6
2.8
3.0
14-15 15-16 16-17 17-18
L.k
WH
r
Year
Better
10-Sep-18 8 Green Manufacturing
G

Application - Shop floor general lighting
Area covered - 50000 Sq ft
Investment – Rs 24 Lakh
Energy saving – 35000 kWH/ annum
Renewable Energy substitution – Solar light pipe
Solar light pipe
10-Sep-18 9 Green Manufacturing
G

2000
2300
1200 1035
200
0
500
1000
1500
2000
2500
13-14 14-15 15-16 16-17 17-18
Lite
rs
Year
• Installed during – May 2012 •No of dishes :15 •Solar system capacity : 75 kg/ Hour •Steam generation between 11.00 to 3.00 PM •Supplementing our Canteen steam requirement about 4 Hrs •Target diesel savings – 3000 Liters /Year •Investment - Rs 43 Lakh
Annual diesel saving
Renewable Energy substitution – Solar cooking system
Savings is less due to poor solar irradiation
10-Sep-18 10 Green Manufacturing
G

10-Sep-18 11 Green Manufacturing
G Resource conservation - Energy & Fuel conservation

Time Horizon (Years)
Imp
rove
me
nt
of
Ene
rgy
Effi
cie
ncy
System Optimization
System Redesign
System Innovation
Approach - Energy Efficiency Evolution
2000-2005 2005-2010 2015 ~
10-Sep-18 12 Green Manufacturing
G

Energy Conservation
Compressed Air system
Air conditioning system
Lighting system
Fuel Conservation
10-Sep-18 13 Green Manufacturing
G

No of project category
40
35
30
25
20
15
10
5
0
2000-2005
11 37 06
51
9 5
Energy
Fuel
Renewable
78%
ENCON Project summary
8%
14 %
11
2005-2010 2010-2015 2015~17
65 Categories
Individual projects > 400
Projects
10-Sep-18 14 Green Manufacturing
G

ENCON – Key Improvements so far ..
V Belt to Flat Belt conversion
Intermediate controllers
Screw air compressors
Refrigerant dryer
Transvector nozzle for clean air guns
SCADA system for battery of compressors
SYSTEM
10-Sep-18 15 Green Manufacturing
G

Lighting transformer
Induction lighting for high bay application
LED lighting for shop floors and street lights
ENCON – Key Improvements so far ..
Silver shield reflectors
Occupancy sensors for office area
Auto lighting control
10-Sep-18 16 Green Manufacturing
G

Recip chiller to Screw chiller – water cooled
Star delta Star convertors
Flat belt conversion for AHU’s
Energy efficient pumps
BMS for air conditioning
Aircon savers for smaller A/c units
VFD’s or AHU’s
Free cooling system
Thermal Energy storage system
ENCON – Key Improvements so far ..
IE 3 Motors for AHU’s
AHU’s with DC motors
Automatic Tube Cleaning System
2016-17
10-Sep-18 17 Green Manufacturing
G
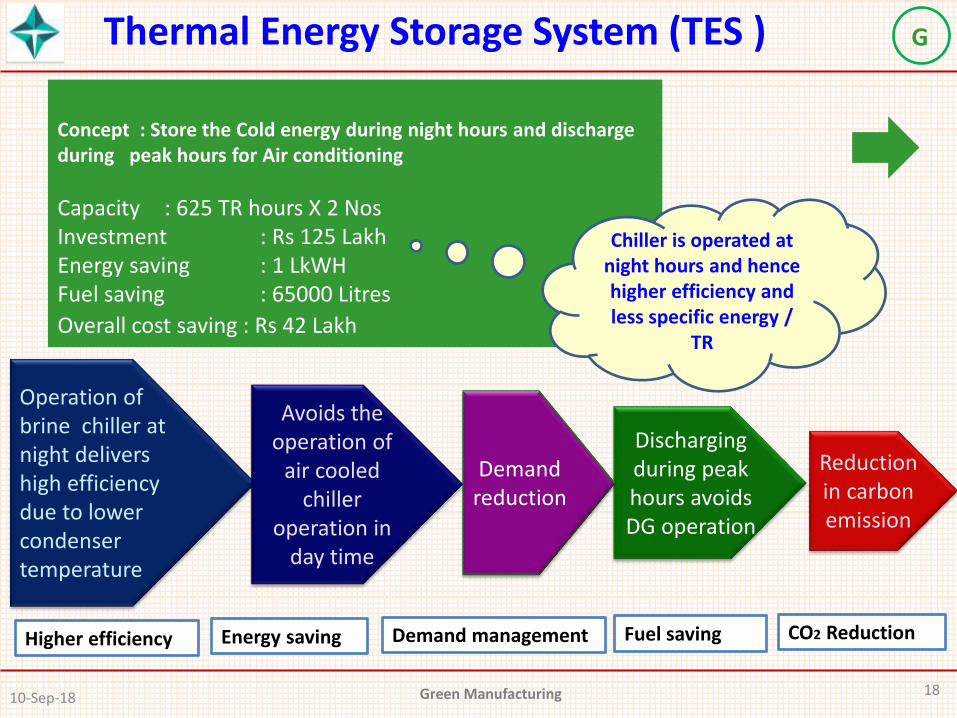
Concept : Store the Cold energy during night hours and discharge during peak hours for Air conditioning
Capacity : 625 TR hours X 2 Nos Investment : Rs 125 Lakh Energy saving : 1 LkWH Fuel saving : 65000 Litres
Overall cost saving : Rs 42 Lakh
Chiller is operated at night hours and hence higher efficiency and less specific energy /
TR
Operation of brine chiller at night delivers high efficiency due to lower condenser temperature
Avoids the operation of
air cooled chiller
operation in day time
Discharging during peak hours avoids DG operation
Higher efficiency Energy saving Fuel saving
Reduction in carbon emission
CO2 Reduction
Demand reduction
Demand management
Thermal Energy Storage System (TES )
10-Sep-18 18 Green Manufacturing
G

TES – Schematic
THERMAL
ENERGY STORAGE TANK
BRINE
CHILLER
BRINE PRIMARY PUMP
BRINE LOAD PUMP
CHILLED
WATER LOAD PUMP
PLATE TYPE
HEAT EXCHANGER
Brine chiller
Leverage on dual tariff system from TNEB
(Lower tariff of TNEB power during night
hours)
Night hours
Storage tank
Peak hours
10-Sep-18 19 Green Manufacturing
G

LED Retrofitting Conversion of 36 W fluorescent tube fittings with 18 W LED lighting No of fittings converted - 3000 Energy saving / annum – 1.80 LkWH Investment – Rs 30 Lakh
Retrofitting of LED fixtures for street light fitting No of fittings converted – 60
Installation of Variable Frequency Drives for Air handling Units No of AHU’s retrofitted - 11 Energy saving / annum – 0.80 LkWH Investment – Rs 4.40 Lakh
VFD’s For AHU’s
10-Sep-18 20 Green Manufacturing
G

IE3 Motors Retrofitting
Installation of IE3 energy efficient motors for AHU ‘s No of AHU’s retrofitted - 10 Energy saving /annum – 0.50 LkWH Investment - Rs 3.50 Lakh
Brushless DC motor for AHU
Installation of Brushless DC motor for the AHU Induction motor - Pilot study Capacity of the AHU Motor - 11 kW Energy saving /annum – 7200 kWH Investment - Rs 5.00 Lakh
10-Sep-18 21 Green Manufacturing
G

• ATCS - Efficient and reliable automatic on line solution for keeping shell and tube heat exchangers in a good / clean condition . • It cleans condensers by pushing a soft balls through the tubes and so that it cleans the fine scale deposits inside the condenser tubes . • Automated process and controlled by a PLC .
Automatic Tube Cleaning System (ATCS)
Investment - Rs 7 Lakh Annual Energy savings – 1.20 LkWH Cost saving – Rs 10.80 Lakh
Installed one number during April’16 and two more systems have been installed during April’17 as horizontal deployment .
12 % Energy reduction
10-Sep-18 22 Green Manufacturing
G

Energy Valve for AHU’s
Why Energy valve ? •To maintain the temperature with required delta “T” across the AHU coil with flow control - •This valve operates based on the set temperature and controls the flow with the set delta “ T” of the AHU .
Vendor - M/s Belimo Our Experience - We have installed in two of our AHU’s ( 50 TR capacity ) as trial and under observation
It ‘s a two way valve with –
• Multiple operation Modes / Control Algorithms – ∆T manager – Flexibility in Controls
• Accurate measurement of Flow, Temp with in-built Flow meter and temperature sensor
10-Sep-18 23 Green Manufacturing
G

Flow Sensor & housing
Smart Actuator
Characterized Control Valve
Temperature Sensor
Energy Valve for AHU’s
Position control – Works as two way valve Flow control - Control the flow for the required temp setting Delta T manager – Maintains AHU coil Delta T with flow
10-Sep-18 24 Green Manufacturing
G

Energy loss reduction
Power factor correction – Improved power factor maintenance ( 0.99 ) with APFC panels
Harmonic study - To understand the harmonic presence and to take appropriate measures in Electrical distribution system
Thermo graphic study - to find out the electrical hot spots and addressing the route causes
10-Sep-18 25 Green Manufacturing
G

Energy monitoring
SLD Daily reporting ON line trend
History
ON line monitoring system connected across load centres - 72 Multi function energy meters Real time monitoring Demand management Energy consumption reports – Customized Data analysis / history
Energy monitoring for top energy consuming equipment – Chillers / Air
compressors / presses and PVD Equipment
10-Sep-18 26 Green Manufacturing
G

ENCON - Reviews
Initiative review Monthly - With the SMT
Review of the projects with metrics
Monthly reports Reports covering all aspects of energy consumption / conservation
Weekly production meeting New projects progress
Monthly - Unit head and to Plant head
Monthly - Sharing to plant head / unit heads
Daily review Project progress / Energy consumption
Department meeting
Sharing of information to operating team
Mid course correction based on
the review outcome

Awareness and Training
Awareness training Creating awareness on ENCON for the employees - In house training & through external agencies
Awareness posters and displays on ENCON
Participating external seminars / programmes
Nominating people for the external seminars/ programmes on ENCON
Energy conservation Day celebration Awareness messages to employees from SMT /
Display of energy efficient gadgets through vendors
Employee suggestion scheme Idea + , Inviting suggestions / SGA ‘s and Emails from individuals

4.88 4.69
4.22
3.71
3.27 3.07
2.88 2.57
2.72
2.10 1.88
2.01 2.21
2.35 2.07 2.00
2.21 2.51
2.28 2.39
2.72
2.28
0
1
2
3
4
5
6
Energy Conservation - Specific energy consumption
53 % Reduction
Better
10-Sep-18 29 Green Manufacturing
G

Fuel Reduction Initiatives
10-Sep-18 30 Green Manufacturing
G

Dedicated power feeder - Optimizing DG set utilization
Key challenges
Grid availability Power & demand restrictions
Higher DG set operation
Un utilized wind power
Reduce the fuel consumption Increase the grid availability
Initiated during 2013-14
Commissioned during - Feb’15
Investment - Rs 60 L
10-Sep-18 31 Green Manufacturing
G

18.15
11.05
6.36
2.73 1.51 1.30
2.05
0
2
4
6
8
10
12
14
16
18
20
12-13 13-14 14-15 15-16 16-17 17-18 Plan 18-19
Die
sel C
on
sum
pti
on
In L
akh
.Lit
ers
Key outcome- diesel consumption
Key results – DFS
92 % Reduction
Power availability
0.0
20.0
40.0
60.0
80.0
100.0
13-14 14-15 15-16 16-17 17-18
55.1
69.1
98.3 97.9 98.3
10-Sep-18 32 Green Manufacturing
G

33
MVR – Mechanical Vapor Recompressor
• MVR is the evolving technology to evaporate effluent in an optimal way .
• Evaporation process in a vacuumised chamber (200 mm/hg ). • Effluent evaporates at 63 Deg C .
• Polymer heat exchanger
Four Stage RO system
MES – Mechanical evaporator
Salt
60 to 70 KLD @ 2000 PPM
Reject 10 % @ 20000 PPM
Permeate - back to process @ 90 % recovery rate
6 to7 KLD
Effluent
KL/day
Op.
Cost/KL,
Rs
Op.
Cost/day,
Rs
Total Op.
Cost/annum
With MES 6.0 3500 21000 Rs 63.00
Lakh
ETP Existing Process with – Mechanical Evaporator System (MES)
System Capacity – 25 KL First of its kind in an Engineering Industry
10-Sep-18 Green Manufacturing
G
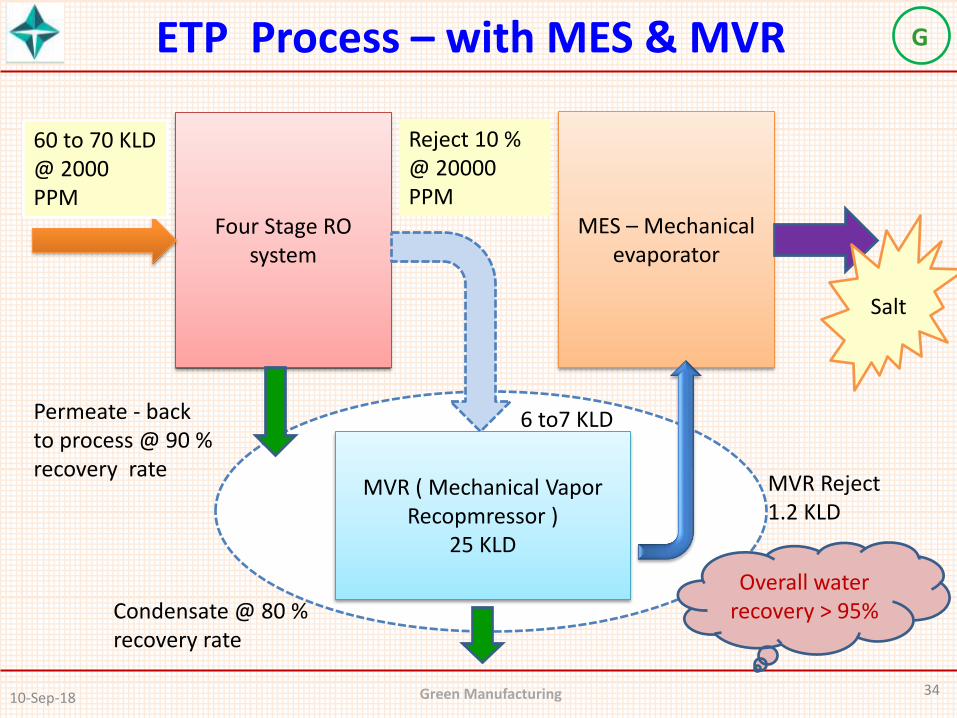
Four Stage RO system
MES – Mechanical evaporator
Salt
Reject 10 % @ 20000 PPM
ETP Process – with MES & MVR
60 to 70 KLD @ 2000 PPM
Permeate - back to process @ 90 % recovery rate
MVR Reject 1.2 KLD
MVR ( Mechanical Vapor Recopmressor )
25 KLD
Condensate @ 80 % recovery rate
6 to7 KLD
Overall water recovery > 95%
10-Sep-18 34 Green Manufacturing
G

Mechanical Vapor Recompressor
Pellet reactor
MVR vessel 10-Sep-18 35 Green Manufacturing
G

Operation principle
36
COMPRESSED VAPORSHAFT SEALINGIMPELLER VACUUM VESSEL
LOW SPEED VAPOR COMPRESSION FAN
LIQUID
DISTRIBUTION
CONDENSATION INNER SURFACE
FALLING FILM EVAPORATION
OUTER SURFACE
VACUUM
PUMPCONDENSATE
COLLECTION
CONDENSATE TANK
CIRCULATION WATER
CLEAN WATER
FEED SOLUTION
CONCENTRATE
VAPOR INLET
10-Sep-18 Green Manufacturing
G
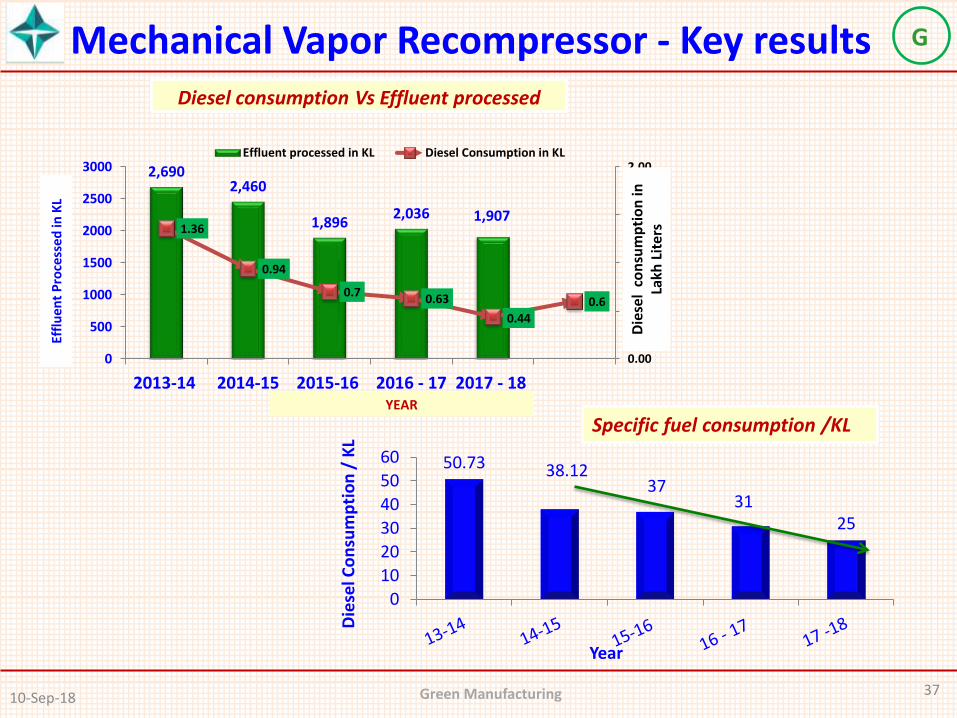
2,690 2,460
1,896 2,036 1,907
1.36
0.94
0.7 0.63
0.44
0.6
0.00
0.50
1.00
1.50
2.00
0
500
1000
1500
2000
2500
3000
2013-14 2014-15 2015-16 2016 - 17 2017 - 18
Effluent processed in KL Diesel Consumption in KL
Effl
ue
nt
Pro
cess
ed
in K
L
YEAR
50.73 38.12 37
31 25
0
10
20
30
40
50
60
Die
sel C
on
sum
pti
on
/ K
L
Year
Mechanical Vapor Recompressor - Key results
Specific fuel consumption /KL
Diesel consumption Vs Effluent processed
Die
sel
con
sum
pti
on
in
Lakh
Lit
ers
10-Sep-18 37 Green Manufacturing
G

Beyond the fence - Energy audit for vendor sites
Educate the vendor community on ENCON
Share our best practices &Expertise
Optimize their energy cost
Support them for ( technical & financial ) the implementation
No of vendors covered 23
Saving potential identified Rs 60 Lakh
With out investment Rs 17 Lakh
With investment Rs 43 Lakh
10-Sep-18 38 Green Manufacturing
G

ENCON - Energy /Fuel Management System
10-Sep-18 39 Green Manufacturing
G

Water & Effluent /Waste management
10-Sep-18 40 Green Manufacturing
G

Water management
Conservation initiatives
• Installation of auto valve in plating line rinsing tanks with timer controls.
• Foam spray type filter for the water taps to reduce the water consumption .
• Accumulation of components to increase the Batch Sizes to reduce water consumption.
• Diffused Aeration system to improve the STP performance
• Recycling of domestic effluent for cooling tower, wash room flushing & other general
cleaning.
• Rain Water Harvesting
Electronic faucets for hand wash at shop floors
Dish washer for cleaning of Canteen utensils
Wash down and Clean up solutions for the Vessels & floor cleaning at
Canteen
Zero Discharge Compliance Plant – Since 2006
10-Sep-18 41 Green Manufacturing
G

Water management
15.76 16.48 16.45 14.20
15.80 13.20
2
5
8
11
14
17
12-13 13-14 14-15 15-16 16-17 17-18
Specific Water Consumption
252 223 227 217 210 204
0
50
100
150
200
250
300
12-13 13-14 14-15 15-16 16-17 17-18Year
Daily water consumption in KLD
in K
LD
Better
10-Sep-18 42 Green Manufacturing
G

Rain water harvesting & Recharging of ground water
• Recharge well created near
Assembly
• Open wall behind Ebauche
department
• Open Pond behind Service building
Storage capacity of 1 Lac Liter
during heavy down pour
10-Sep-18 43 Green Manufacturing
G

10-Sep-18
Recycling 100% of domestic effluent for Landscaping, A/C cooling tower, Wash room flushing's
Water management
44 Green Manufacturing
G

Waste Management - Overview
Waste
Liquid waste
Solid waste
Hazardous
Non Hazardous
Trade effluent
Domestic effluent
Recycled and sent back to process
Recycled – Used for Gardening / Cooling towers / Wash room flushing
Land fill
Incineration
Recycling
Scrap yard
Bio Medical waste Segregated and sent to
authorized agency
“E” Waste Sent to authorized
recycler

Waste Management System- Structure
Waste management Team Engineering services
Civil Engineering Stores
Concerned departments
Waste management manual
Operational controls/ Work instructions
Operating team

Input Effluent
TDS – 1500 ~ 1800 PPM
Pre-treatment
- Clarifier
- Pressure
Sand Filter
- Activated
Carbon Filter
-Softener
Micro Filtration RO – Stage 1
Good water – TDS < 100
PPM
RO – Stage 2
Rejection – 5000 PPM
Combined
Permeate
Storage Tank
Rejection – 9900 PPM
Good water –
TDS < 100 PPM
RO – Stage 4
Input – 14000 PPM
Input - Reject
20000 PPM
RO – Stage 3
Permeate from RO
IV
TDS < 500 PPM
Effluent treatment - flow diagram
MVR
Evaporation
System
Mechanical
Evaporation
System Input
Reject
Condensate
from MVR &
MES
Process
High conc
sludge
140 Kgs / day
To Storage
78 % recovery
Input – HCT
30000 PPM
Pellet
Reactor
Waste Management – Trade effluent
We are zero discharge compliance since 2006
Recycling of trade effluent
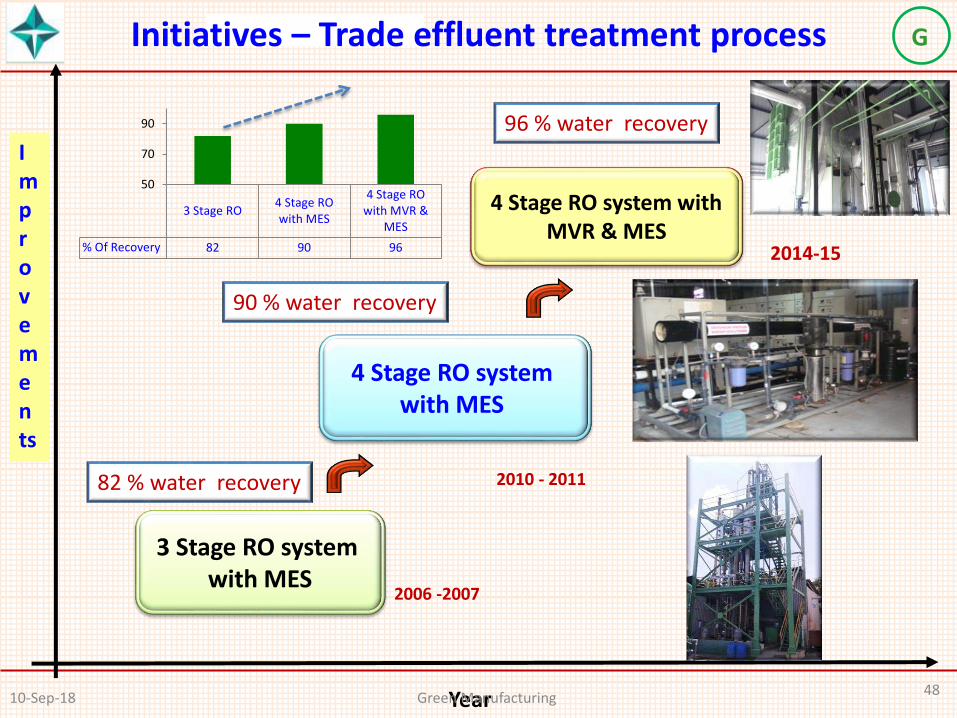
2010 - 2011
Year
Improvements
2006 -2007
3 Stage RO system with MES
4 Stage RO system with MES
4 Stage RO system with
MVR & MES 2014-15
Initiatives – Trade effluent treatment process
82 % water recovery
90 % water recovery
96 % water recovery
3 Stage RO4 Stage ROwith MES
4 Stage ROwith MVR &
MES
% Of Recovery 82 90 96
50
70
90
10-Sep-18 48 Green Manufacturing
G

Effluent from domestic wastes /wash rooms
Waste water from Canteen
Bar screen chamber
Anaerobic tank
Collection tank
UASBR
Aeration tank Primary
clarifier Secondary
clarifier Collection
sump
Filtration system – ACF
/PSF
Domestic treatment flow
Grit chamber
We are Zero discharge compliance
unit since 2006
pH – 6.97
TDS – 1500 ppm
BOD – 440 ppm COD – 1400ppm
pH – 7.2
TDS – 1490 ppm BOD – 5 ppm
COD – 35 ppm
Waste management - Domestic effluent treatment
10-Sep-18 49 Green Manufacturing
G

2005 - 2006
2015 -16
Year
Improvements
1998 - 2000
STP with surface aeration
Up gradation of STP with diffused aeration system
Full fledged UASBR -Anaerobic digestion system
(Up flow Anaerobic sludge blanket reactor)
Anaerobic digestion system
pilot 2013-14
Initiatives – Domestic effluent treatment process
Overall water recovery - 90 %
2014 - 2015 2015 - 2016 2016- 2017
Dom Effluent(In KL)Generated
40560 53370 56390
Domestic Effluent(InKL) Recycled
36910 45487 50485
0
20000
40000
60000
Qty
in K
L
10-Sep-18 50 Green Manufacturing
G

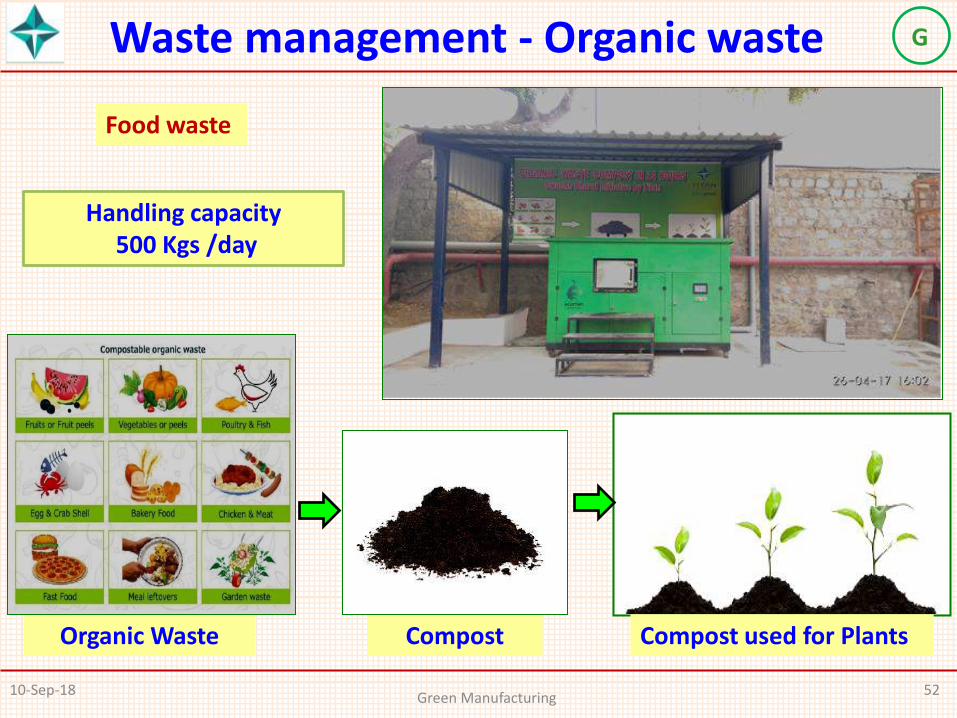
Waste Management – Organic waste
Vegetable peels / dry leaves collected from Canteen / Gardens
Dumped in to Composting yard
7 Stage process
Converted as vermi
manure after 30 days
Vermi Composting
18.0 18.5 18.0 18.0 18.0 18.0
10
11
12
13
14
15
16
17
18
19
20
11-12 12-13 13-14 14-15 15-16 16-17
Year
Vermicomposting in Tons
in T
on
s
•Used for gardening •Distributed to our employees during WED
10-Sep-18 51 Green Manufacturing
G
Organic Waste Compost Compost used for Plants
Waste management - Organic waste
Handling capacity 500 Kgs /day
Food waste
10-Sep-18 52 Green Manufacturing
G
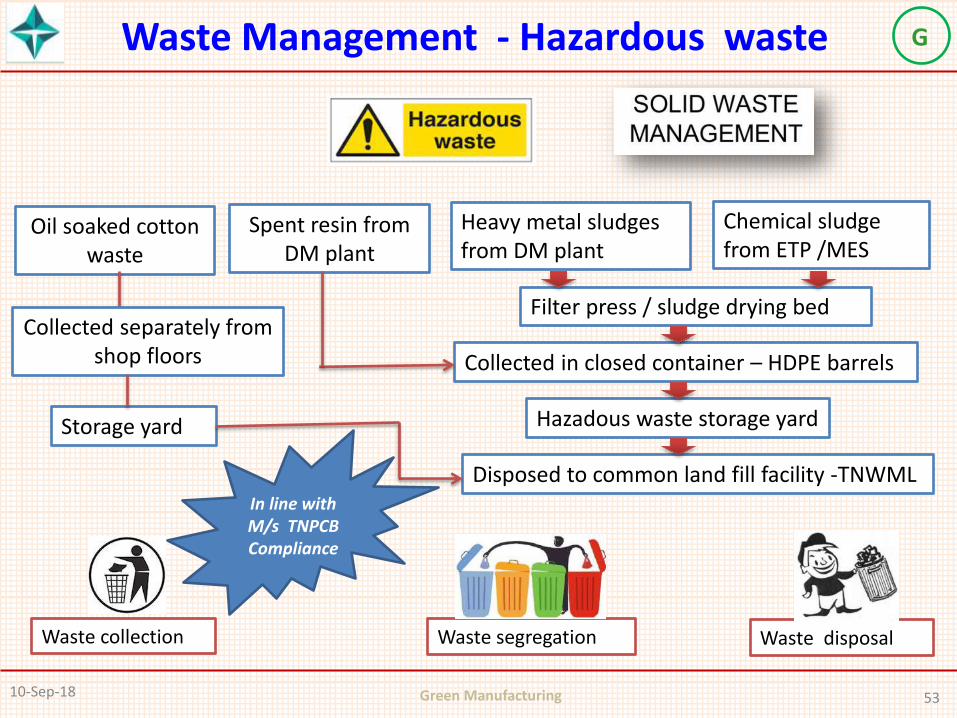
Waste Management - Hazardous waste
Waste collection Waste segregation Waste disposal
Heavy metal sludges from DM plant
Filter press / sludge drying bed
Collected in closed container – HDPE barrels
Hazadous waste storage yard
Chemical sludge from ETP /MES
Disposed to common land fill facility -TNWML
Spent resin from DM plant
Oil soaked cotton waste
Collected separately from shop floors
Storage yard
In line with M/s TNPCB Compliance
10-Sep-18 53 Green Manufacturing
G

Waste collection Waste segregation Waste disposal
Used solvent
MS /HDPE containers - Collected from shop floors
Storage yard
Disposed to authorized recyclers
Used oil
In line with M/s TNPCB Compliance
Waste Management - Hazardous waste
10-Sep-18 54 Green Manufacturing
G

Waste management -E waste
Disposed to authorized recyclers
Collected across shop floors / office area
10-Sep-18 55 Green Manufacturing
G
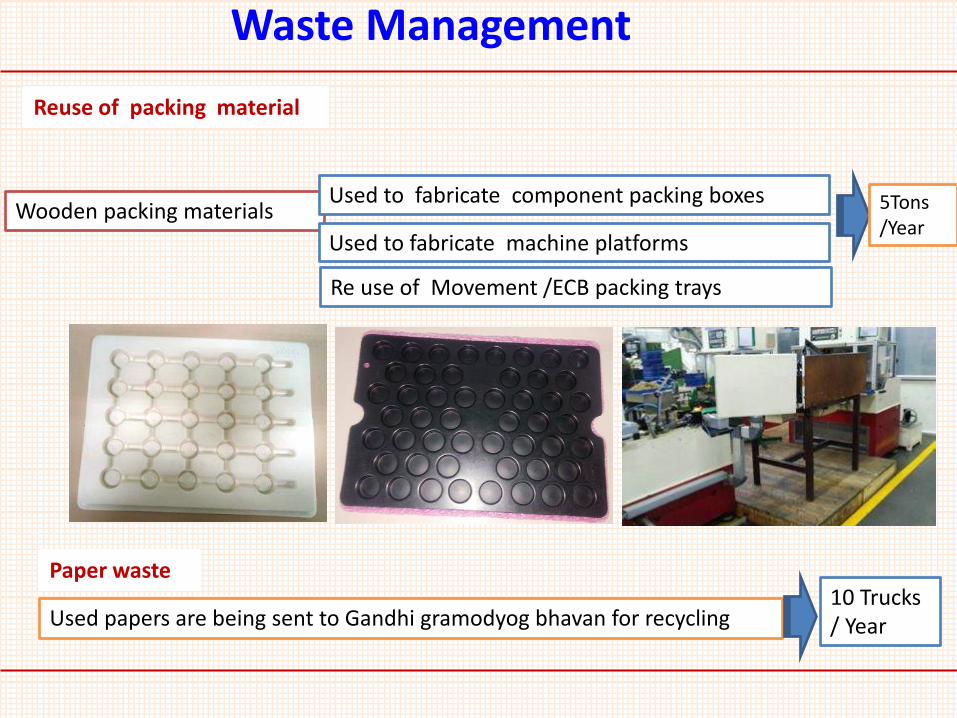
Waste Management
Reuse of packing material
Wooden packing materials Used to fabricate component packing boxes
Re use of Movement /ECB packing trays
Paper waste
Used papers are being sent to Gandhi gramodyog bhavan for recycling 10 Trucks / Year
5Tons /Year
Used to fabricate machine platforms
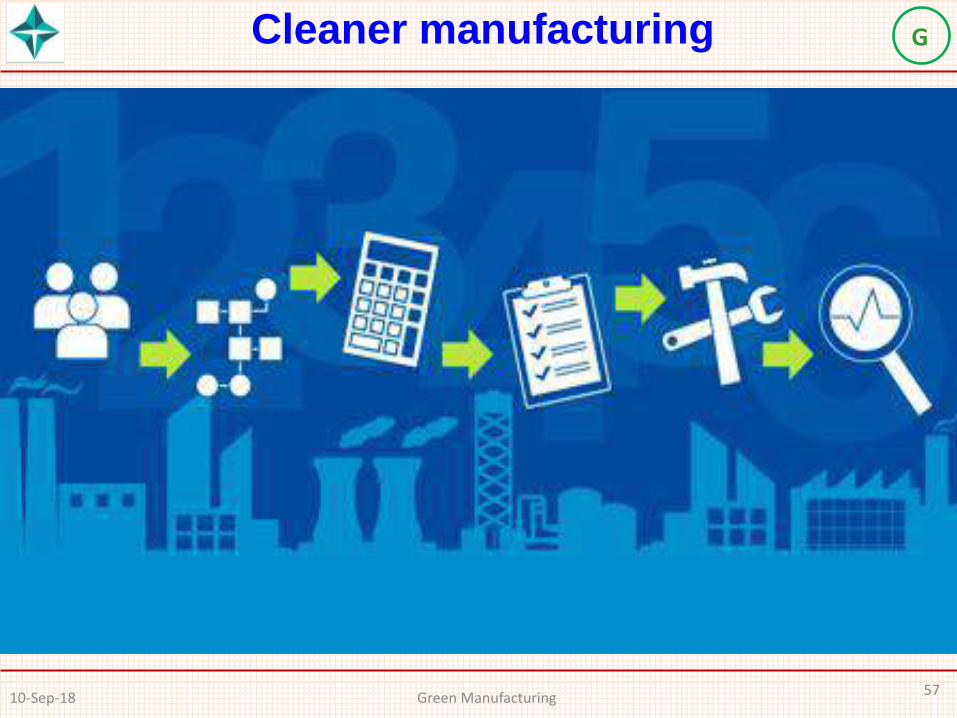
Cleaner manufacturing
10-Sep-18 57 Green Manufacturing
G

Dry Plating process ( PVD ) – Cleaner mfg Processes
• Ion Plating Process in place of conventional electro plating - PVD technique for gold plating
• Elimination of TCE – Substitution with ISOPAR –H solvent and ON line recycling system -
Reduction in Solvent consumption
• Process Optimization & Automation
• Resource Conservation –Raw material Optimization & Recycling of Brass Scrap
• Pro Active Pollution Control Measures – WPC & APC measures
• Hazardous Waste Management Processes
Advantages of PVD process
• Precious metal conservation • There is no water consumption in the process • No effluent generation • There is no emission/ fumes
• Adopting Physical Vapor Deposition (PVD) technique for gold plating instead of conventional Electroplating (Wet Plating ).
• We are the first people to establish PVD Process for Brass cases and bracelets.
Year 2012-13 2013-14 2014-15 2015-16 2016-17 2017-18 Gold Consumption in "g" 65,309 86,424 83,571 70,519 64,964 69,862 Gold Recovered in "g" 34,219 44,552 46,663 35,033 30,633 30,050 % Recovery 52% 52% 56% 50% 47% 43%
PVD Equipment
10-Sep-18 58 Green Manufacturing
G

Solvent reduction
On line solvent recycling using Durr cleaning equipment and which reduces the fresh solvent consumption Annual consumption has been brought down to 35 Tons
Isopar –H is the solvent used for component cleaning
Annual consumption was around 120 Tons
ON line recycling of solvent •We have invested around Rs 3 Cr for the recycling equipment – Durr cleaning equipment •This equipment will recycle the solvent ON line and the fresh ISOPAR consumption has been reduced drastically
10-Sep-18 59 Green Manufacturing
G

Brass recycling
Horological brass is used as raw material for making watch cases
600 Tons of raw material is used / annum
420 Tons of brass material is from conversion route
180 Tons of virgin brass is purchased through fresh route
05-06 06-07 07-08 08-09 09-10 10-11 11-12 12-13 13-14 14-15 15-16 16-17 17 - 18
Series1 222 316 336 376 372 449 424 397 377 500 507 540 619
Series3 210 301 303 336 362 418 422 394 377 496 494 532 565
Series2 94 96 90 90 97 93 100 99 100 99 97 99 91
94 96 90 90
97 93
100 99 100 99 97 99
91
30
40
50
60
70
80
90
100
0
100
200
300
400
500
600
700
% R
ecyc
ling
Ton
s /
Yr
Year
Brass Recycling
10-Sep-18 60 Green Manufacturing
G

Cyanide reduction / elimination
Cyanide is used for
• Rust removal / cleaning process • Gold stripping process
Leading to operational risk in storage , handling and treatment
Target to eliminate cyanide from our manufacturing process
Hand holded with M/s CSIR –NML Jamshedpur to develop alternate process
Identify the potential opportunity to eliminate cyanide from the following activities:
• Surface treatment
• Rust removal form steel module components
• Stripping of rejected gold plated brass main plates & wheels
• MED
• Stripping of market return components
• Ion Plating
• Stripping of SS straps
• Stripping of bicolor brass cases
10-Sep-18 61 Green Manufacturing
G
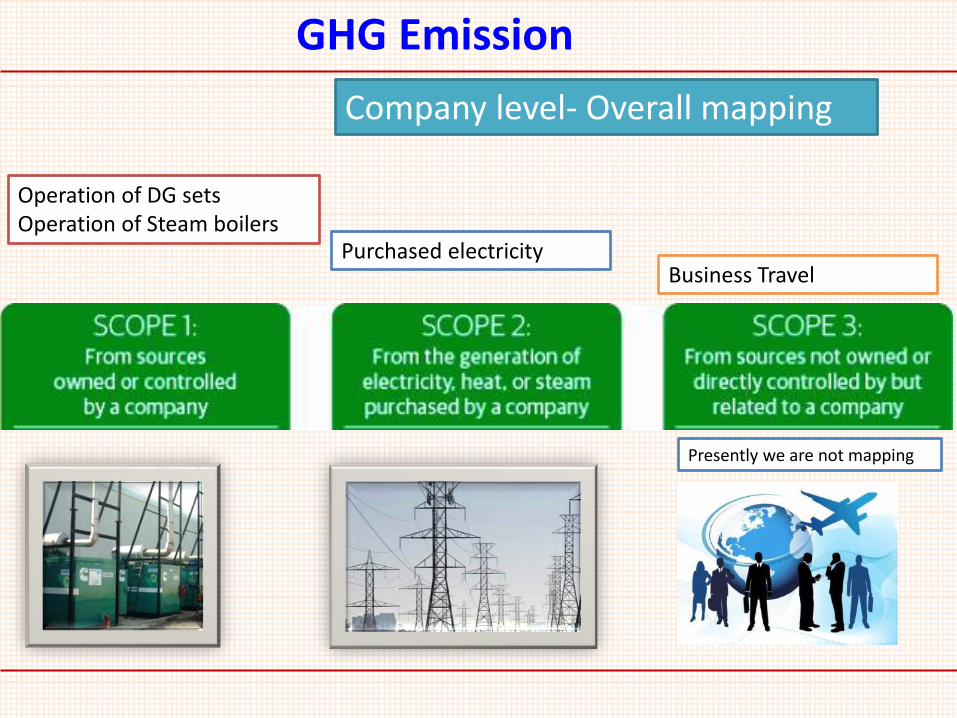
GHG Emission
Operation of DG sets Operation of Steam boilers
Purchased electricity Business Travel
Company level- Overall mapping
Presently we are not mapping

Sapling Distribution To promote green belt, tree saplings are distributed to employees on World Environment Day and general public through out year.
Tree Plantations
2540 2500 3350
4500 5425
9000 9400
7000
10500 11500
6500
2500
6890 6550
0
2000
4000
6000
8000
10000
12000
14000
03-04 04-05 05-06 06-07 07-08 08-09 09-10 10-11 11-12 12-13 13-14 14-15 15-16 16-17
Number of trees planted
10-Sep-18 63 Green Manufacturing
G
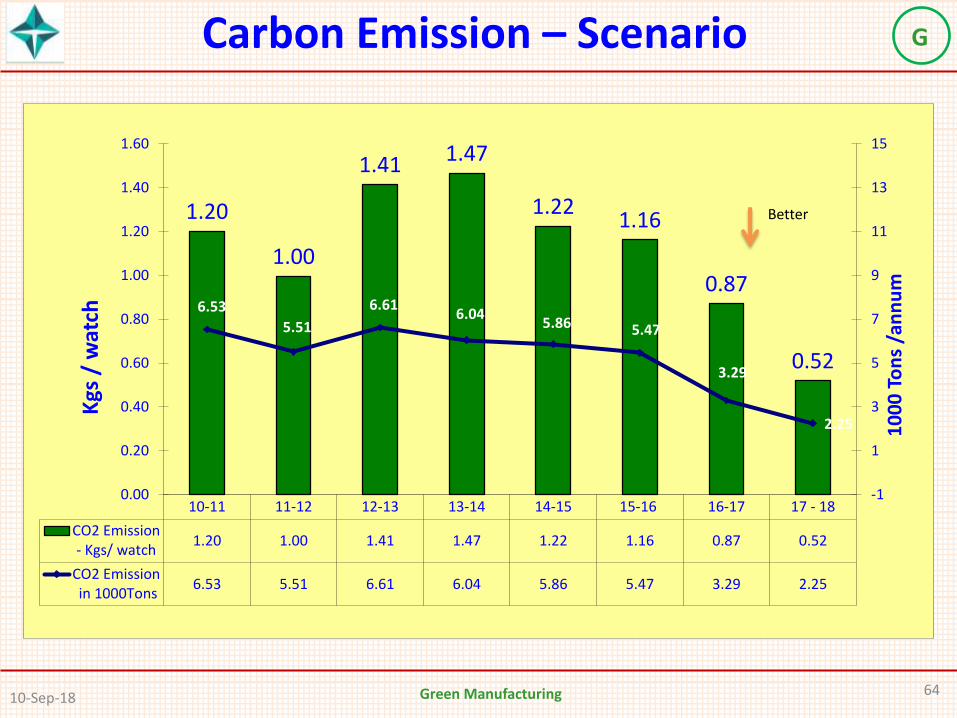
Carbon Emission – Scenario
10-11 11-12 12-13 13-14 14-15 15-16 16-17 17 - 18
CO2 Emission- Kgs/ watch
1.20 1.00 1.41 1.47 1.22 1.16 0.87 0.52
CO2 Emission in 1000Tons
6.53 5.51 6.61 6.04 5.86 5.47 3.29 2.25
1.20
1.00
1.41 1.47
1.22 1.16
0.87
0.52
6.53
5.51
6.61 6.04
5.86 5.47
3.29
2.25
-1
1
3
5
7
9
11
13
15
0.00
0.20
0.40
0.60
0.80
1.00
1.20
1.40
1.60
10
00
To
ns
/an
nu
m
Kgs
/ w
atch
Better
10-Sep-18 64 Green Manufacturing
G

“SRISHTI “ good green governance award for the
year 2006 for practicing better EMS .
“Golden Peacock Eco Innovation Award” for the year
2007 for innovating alternate solvent for TCE .
“Golden Peacock Environment Management Award”
for the years 2003, 2006 & 2008 for practicing better
Environmental Management System.
“Greentech Environment Excellence award 2008”
for the outstanding achievement in the
Environmental Management.
“Golden Peacock Eco Innovation Award 2008 “for
design and Process Innovating – KLOTZ micro
precision plastic component development.
Awards & Accolades
10-Sep-18 65 Green Manufacturing
G

Awards & Accolades
CII - National Award for excellence in energy management for the year 2013 .
CII – National energy management award under excellent energy efficient category for
year 2015
Greentech Environment award under Gold category for the year 2015 , 2016 & 2018
Green Co certification by M/s CII - during 2017 – Silver category
10-Sep-18 66 Green Manufacturing
G

GreenCo ..Our Journey
Application submitted during April’17 Awareness training by M/s CII Team - May ’17 Submission of PPT’s - July & August ’17 Site assessment - Nov’17
Certified 350 – 449 Points - Level 1
Bronze 450 – 549 Points – Level 2
Silver 550 – 649 Points – Level 3
Gold 650 – 749 Points – Level 4
Platinum ≥ 750 Points – Level 5
Our Score band
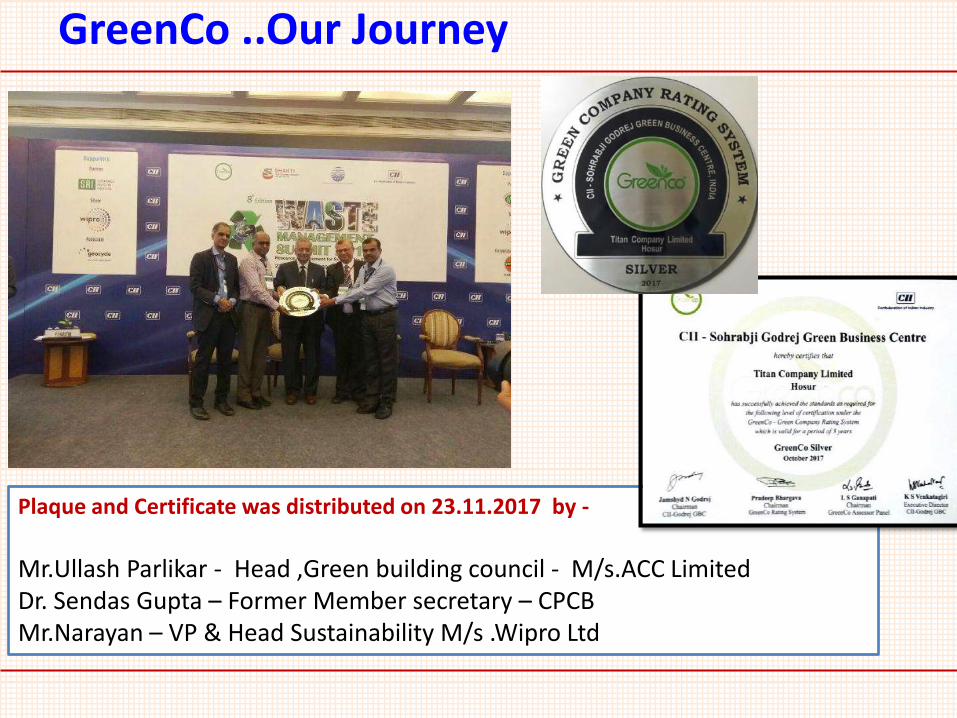
GreenCo ..Our Journey
Plaque and Certificate was distributed on 23.11.2017 by -
Mr.Ullash Parlikar - Head ,Green building council - M/s.ACC Limited Dr. Sendas Gupta – Former Member secretary – CPCB Mr.Narayan – VP & Head Sustainability M/s .Wipro Ltd

10-Sep-18 69 Green Manufacturing
G