tirzepatide for type 2 diabetes: effectiveness and value
TRANSCRIPT

©Institute for Clinical and Economic Review, 2021
Tirzepatide for Type 2 Diabetes:
Effectiveness and Value
Modeling Analysis Plan
September 23, 2021
Institute for Clinical and Economic Review
©Institute for Clinical and Economic Review, 2021 Page i Tirzepatide for Type 2 Diabetes – Modeling Analysis Plan 09/23/2021 Return to Table of Contents
Table of Contents
1. Approach ............................................................................................................................................ 1
2. Methods ............................................................................................................................................. 2
2.1 Overview and Model Structure .................................................................................................... 2
2.2 Key Model Choices and Assumptions .......................................................................................... 4
2.3 Populations .................................................................................................................................. 5
2.4 Interventions ................................................................................................................................ 7
2.5 Input Parameters ......................................................................................................................... 7
2.6 Model Outcomes........................................................................................................................ 13
2.7 Model Analysis ........................................................................................................................... 13
3. Methods: Potential Budget Impact .................................................................................................. 15
3.1 Overview .................................................................................................................................... 15
3.2 Methods ..................................................................................................................................... 15
3.3 Analyses ..................................................................................................................................... 16
References ........................................................................................................................................... 17
©Institute for Clinical and Economic Review, 2021 Page 1 Tirzepatide for Type 2 Diabetes – Modeling Analysis Plan 09/23/2021 Return to Table of Contents
1. Approach
This analysis plan details our modeling approach and outcomes to be assessed for the economic
evaluation of tirzepatide added to current antihyperglycemic treatment for type 2 diabetes mellitus
(T2D). Elements of this model analysis plan are subject to change as the project progresses. Refer
to the Research Protocol for details on the systematic review of the clinical evidence on this topic.
The primary aim of this analysis will be to estimate the lifetime cost-effectiveness of tirzepatide
added to current antihyperglycemic treatment for T2D using a decision analytic model. Tirzepatide
added to current antihyperglycemic treatment will be separately compared to three modeled
comparators including: (1) injectable semaglutide, (2) empagliflozin, and (3) ongoing background
antihyperglycemic treatment (e.g., metformin with or without sulfonylureas); semaglutide and
empagliflozin are also assumed to be added to current antihyperglycemic treatment. The base-case
analysis will take a health care sector perspective (i.e., focus on direct medical care costs only), and
a lifetime horizon. Productivity impacts and other indirect costs will be considered in a scenario
analysis using a societal perspective if data allow. The model will be developed in Microsoft® Excel®
for Office 365 (Version 2108).

©Institute for Clinical and Economic Review, 2021 Page 2 Tirzepatide for Type 2 Diabetes – Modeling Analysis Plan 09/23/2021 Return to Table of Contents
2. Methods
2.1 Overview and Model Structure
We will develop a patient-level microsimulation using the Building, Relating, Assessing and
Validating Outcomes (BRAVO) risk equations for this evaluation,1 informed by clinical trials, a
network meta-analysis (NMA) of relevant clinical trials, quality of life literature, and validation
versus other prior economic models.2-4 The base case analysis will take a health care sector
perspective and thus focus on direct medical care costs only. Costs and outcomes will be discounted
at 3% per year.5 This review will differ from the 2019 T2D review in that no long-term cardiovascular
outcomes trial data exist for the primary intervention under examination in this review –
tirzepatide. Notions of cardiovascular and renal benefit will instead be informed by intermediate
outcomes such as hemoglobin A1c (HbA1c) and body weight derived from the NMA that are
predictors that feed into the BRAVO risk engine, an exercise for which there is evidence in published
literature.6 Modeled cardiovascular outcomes (CVO) for therapies with existing long-run CVO trials
will be compared against the trial data and calibration exercises will be considered if necessary.
The model (Figure 2.1) will be an individual patient-level, Monte Carlo-based microsimulation of
costs, quality of life, clinical events, and mortality associated with T2D among United States (US)
adults with the disease. Two modeling steps will be used: (1) event microsimulation and (2)
calculation of mean results from the pool of simulated patients’ lifetime outcomes. Patients, with
data from multiple National Health and Nutrition Examination Survey (NHANES) surveys, will be run
through the modeling steps for each comparator versus tirzepatide that are both added to current
ongoing background antihyperglycemic treatment. The two model steps are explained below:
(1) Event microsimulation. Each NHANES patient will be sequentially run through the event
microsimulation. Each model cycle will be one year in duration. The BRAVO risk equations will
be used to calculate the incidence of any clinical event(s) and/or mortality in each year until the
simulated patient dies. Effects of each included therapy, such as change in HbA1c after the first
cycle, will be included depending on data availability from the NMA. All event and/or mortality
associated costs and health state utility weights will be applied concurrently. The BRAVO risk
equations account for patient history upon entering the model as well as new clinical events
that occur during the microsimulation; for example, a patient who experiences a first
myocardial infarction (MI) in a given year of the microsimulation will have the history of MI
covariate turned on in each subsequent year.
(2) Calculation of mean results. After each simulated patient dies, the model will record the
patient’s lifetime cost, quality-adjusted life years (QALYs), equal-value of life years (evLYs), life
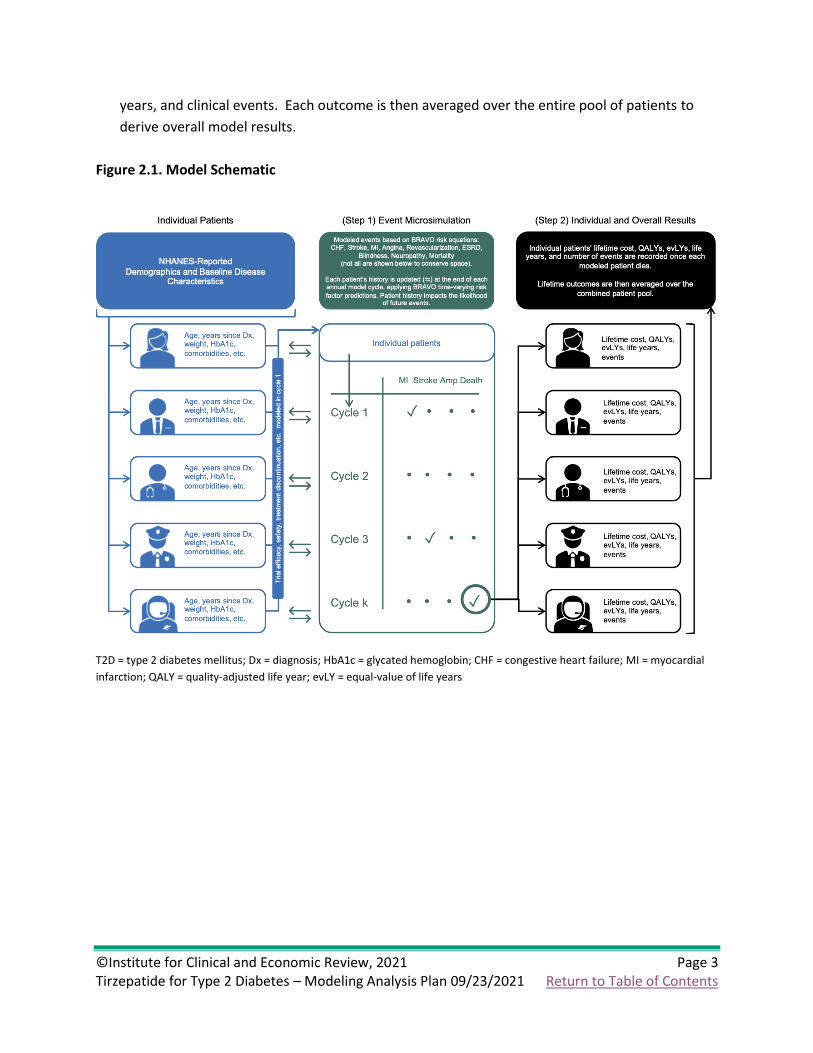
©Institute for Clinical and Economic Review, 2021 Page 3 Tirzepatide for Type 2 Diabetes – Modeling Analysis Plan 09/23/2021 Return to Table of Contents
years, and clinical events. Each outcome is then averaged over the entire pool of patients to
derive overall model results.
Figure 2.1. Model Schematic
T2D = type 2 diabetes mellitus; Dx = diagnosis; HbA1c = glycated hemoglobin; CHF = congestive heart failure; MI = myocardial
infarction; QALY = quality-adjusted life year; evLY = equal-value of life years

©Institute for Clinical and Economic Review, 2021 Page 4 Tirzepatide for Type 2 Diabetes – Modeling Analysis Plan 09/23/2021 Return to Table of Contents
2.2 Key Model Choices and Assumptions
Below is a list of key model choices:
• Long-term survival and the incidence of diabetes-related clinical events will be modeled
using an adaptation of the BRAVO risk equations.1
• Survival will be weighted by disutilities for each diabetes-related complication to model
quality of life.1 If available, we will also employ disutilities for individual adverse events.
• The model will include all treatment costs associated with each individual drug regimen,
including drug acquisition costs and supportive care costs (e.g., clinician visits and self-
monitoring).
• All model outcomes will be calculated over a lifetime time horizon.5
• Life-years, QALYs, evLYs, and health care cost outcomes will be discounted at 3% per year.5
Our model includes several assumptions stated below.
Table 2.1. Key Model Assumptions
Assumption Rationale
HbA1c treatment effect remains stable after end of
trial and throughout patient lifetime for patients who
remain on treatment.
Long-term effectiveness is currently unknown. We
will consider modeling changes in long-term HbA1c in
scenario analyses.
Weight/BMI remains stable after end of trial and
throughout lifetime for patients who remain on
treatment.
Long-term effectiveness is currently unknown. We
will consider modeling changes in long-term BMI in
scenario analyses.
Any calibration of BRAVO for CV and renal outcomes
for active comparators with CVO trial data will be
maintained over patient lifetime.
Active treatment comparators (injectable semaglutide
and empagliflozin) have trial data with CVOs. We will
consider model calibration depending on how the
BRAVO risk equations compare to those trial
outcomes, either in the main analysis or as a scenario
analysis.
Any calibration of BRAVO for CV and renal outcomes
for tirzepatide will be maintained over patient
lifetime.
Long-term effectiveness of tirzepatide is currently
unknown. We will potentially model relative changes
in long-term CV and renal outcome effectiveness in
scenario analyses.
Ongoing background antihyperglycemic medications
are assumed the same for all comparators.
The goal is to evaluate direct comparisons among the
treatments of interest and not multiple possible
treatment sequences.
©Institute for Clinical and Economic Review, 2021 Page 5 Tirzepatide for Type 2 Diabetes – Modeling Analysis Plan 09/23/2021 Return to Table of Contents
2.3 Populations
The population of interest for this review is adults with T2D with inadequate glycemic control
despite current treatment with antihyperglycemic agent(s). A cohort of individual patients who are
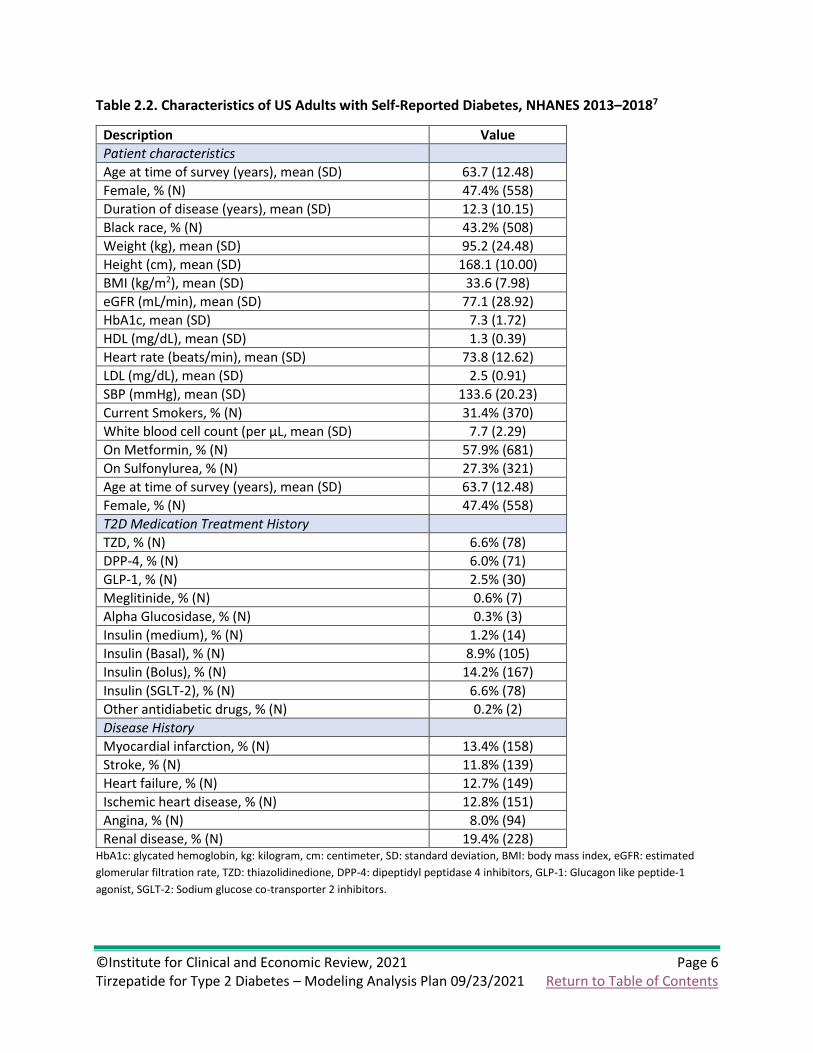
U.S. adults with self-reported diabetes will be drawn from NHANES (Table 2.2).
©Institute for Clinical and Economic Review, 2021 Page 6 Tirzepatide for Type 2 Diabetes – Modeling Analysis Plan 09/23/2021 Return to Table of Contents
Table 2.2. Characteristics of US Adults with Self-Reported Diabetes, NHANES 2013–20187
Description Value
Patient characteristics Age at time of survey (years), mean (SD) 63.7 (12.48)
Female, % (N) 47.4% (558)
Duration of disease (years), mean (SD) 12.3 (10.15)
Black race, % (N) 43.2% (508)
Weight (kg), mean (SD) 95.2 (24.48)
Height (cm), mean (SD) 168.1 (10.00)
BMI (kg/m2), mean (SD) 33.6 (7.98)
eGFR (mL/min), mean (SD) 77.1 (28.92)
HbA1c, mean (SD) 7.3 (1.72)
HDL (mg/dL), mean (SD) 1.3 (0.39)
Heart rate (beats/min), mean (SD) 73.8 (12.62)
LDL (mg/dL), mean (SD) 2.5 (0.91)
SBP (mmHg), mean (SD) 133.6 (20.23)
Current Smokers, % (N) 31.4% (370)
White blood cell count (per µL, mean (SD) 7.7 (2.29)
On Metformin, % (N) 57.9% (681)
On Sulfonylurea, % (N) 27.3% (321)
Age at time of survey (years), mean (SD) 63.7 (12.48)
Female, % (N) 47.4% (558)
T2D Medication Treatment History TZD, % (N) 6.6% (78)
DPP-4, % (N) 6.0% (71)
GLP-1, % (N) 2.5% (30)
Meglitinide, % (N) 0.6% (7)
Alpha Glucosidase, % (N) 0.3% (3)
Insulin (medium), % (N) 1.2% (14)
Insulin (Basal), % (N) 8.9% (105)
Insulin (Bolus), % (N) 14.2% (167)
Insulin (SGLT-2), % (N) 6.6% (78)
Other antidiabetic drugs, % (N) 0.2% (2)
Disease History Myocardial infarction, % (N) 13.4% (158)
Stroke, % (N) 11.8% (139)
Heart failure, % (N) 12.7% (149)
Ischemic heart disease, % (N) 12.8% (151)
Angina, % (N) 8.0% (94)
Renal disease, % (N) 19.4% (228) HbA1c: glycated hemoglobin, kg: kilogram, cm: centimeter, SD: standard deviation, BMI: body mass index, eGFR: estimated
glomerular filtration rate, TZD: thiazolidinedione, DPP-4: dipeptidyl peptidase 4 inhibitors, GLP-1: Glucagon like peptide-1
agonist, SGLT-2: Sodium glucose co-transporter 2 inhibitors.

©Institute for Clinical and Economic Review, 2021 Page 7 Tirzepatide for Type 2 Diabetes – Modeling Analysis Plan 09/23/2021 Return to Table of Contents
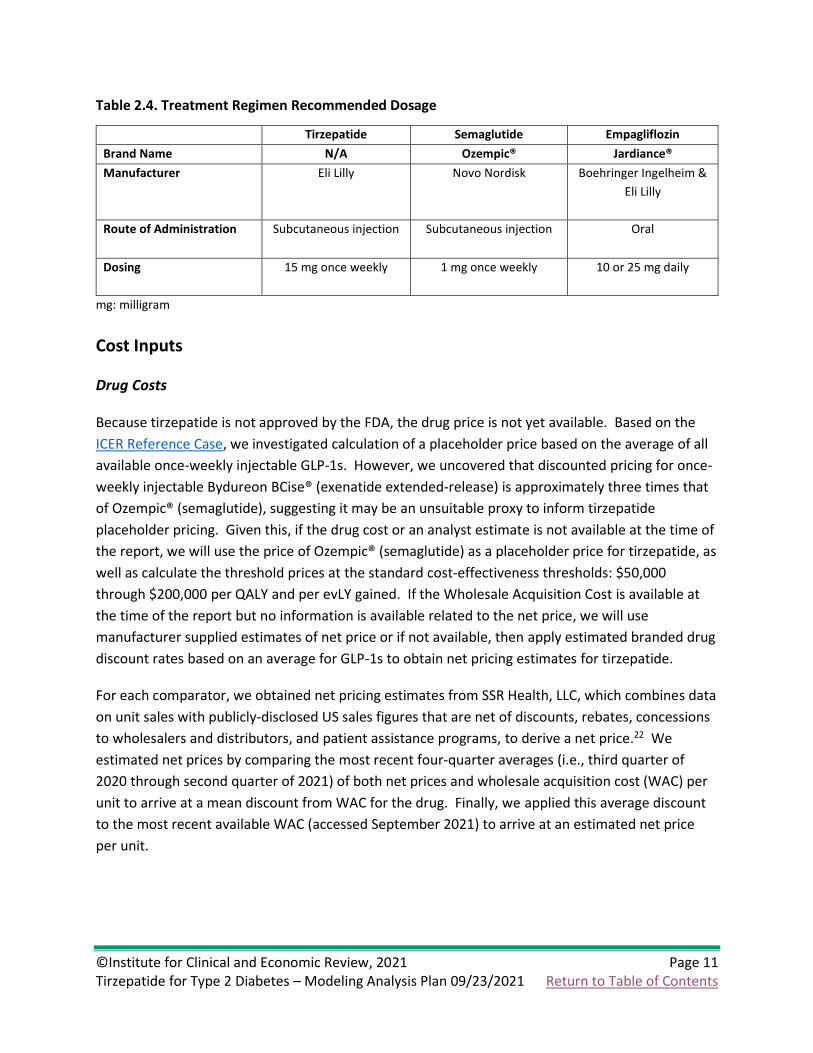
2.4 Interventions
Our intervention of interest for this review is tirzepatide (Eli Lilly) added to current ongoing
background antihyperglycemic treatment.
Comparators
We plan to compare to each of the following treatments:
• Semaglutide (Ozempic®, Novo Nordisk), a GLP-1 agonist, added to ongoing background
treatment
• Empagliflozin (Jardiance®, Boehringer Ingelheim and Eli Lilly), a SGLT-2 inhibitor, added to
ongoing background treatment
• Ongoing background antihyperglycemic treatment alone
The two add-on agents were chosen in part because: they are common existing add-on treatments;
they are representative of the two main classes recommended by guidelines for similar populations
to those studied with tirzepatide, and semaglutide shares one of two mechanisms with tirzepatide.
2.5 Input Parameters
Clinical Inputs
Clinical inputs regarding the efficacy of tirzepatide compared to injectable semaglutide and
empagliflozin on intermediate outcomes such as changes in HbA1c, lipid levels, blood pressure, and
body weight will be derived from trials used in the NMA, tentatively including SURPASS-2, SUSTAIN-
2, PIONEER-2, and PIONEER-3.8-11 Other intermediate or surrogate outcomes that may be captured
in the NMA and economic model include those listed within the Diabetes-Related Complication and
Mortality Probabilities section below. While oral semaglutide and sitagliptin are not currently
planned to be a part of this modeling exercise, the corresponding SUSTAIN-2, PIONEER-2, and
PIONEER-3 trials may be included to facilitate potential network meta-analytic comparison between
tirzepatide and empagliflozin, and injectable semaglutide and empagliflozin.12-14 Given that this
network does not include background therapy alone, separate clinical trials will tentatively be used
to inform benefits of these therapies on intermediate outcomes.

©Institute for Clinical and Economic Review, 2021 Page 8 Tirzepatide for Type 2 Diabetes – Modeling Analysis Plan 09/23/2021 Return to Table of Contents
Diabetes-Related Complication and Mortality Probabilities
We will model diabetes-related complications and mortality based on risk equations from the
BRAVO risk engine.1 The BRAVO risk equations were developed based on the ACCORD trials to
predict the onset of diabetes complications over an individual’s life span, have been externally
validated against over 18 international trials, and have been used in recent economic modeling as
alternative to prior diabetes risk models.6,15
The BRAVO risk engine accounts for time-varying risk factors (7 risk equations), including HbA1c,
systolic blood pressure (SBP), low-density lipids (LDL), weight, severe and symptomatic
hypoglycemia, and smoking. The risk engine also predicts diabetes complications (8 risk equations),
which include congestive heart failure (CHF), stroke, myocardial infarction (MI), angina,
revascularization, end-stage renal disease (ESRD), blindness, and neuropathy.1 Patients will be able
to experience multiple and concurrent complications during each modeled year.
The effect of included add-on therapies on intermediate outcomes, including several of the time-
varying risk factors mentioned above, will be applied to the patient cohort after an initial cycle and
the treatment effect will be assumed to persist until patient death or therapy discontinuation. We
plan to estimate the effect of included add-on therapies on cardiovascular and renal outcomes in
the base-case via the BRAVO risk equations, assuming changes in intermediate outcomes will
predict lifetime cardiovascular and renal outcomes. Modeled outcomes will be compared against
available cardiovascular and renal outcome data for injectable semaglutide and empagliflozin, and
model calibration may be considered to ensure reasonable estimates. Standard errors of model
coefficients will also be increased to reflect the much higher uncertainty around cardiovascular and
renal outcomes for tirzepatide than for the other active comparators given the novelty of
tirzepatide’s dual mechanisms of action and their unknown long-term effects when combined.16,17
Discontinuation
We will apply pooled estimates of treatment discontinuation for any reason, along with
assumptions for long-term treatment discontinuation, as applicable for tirzepatide and each
comparator. Discontinuation rates will be derived from extension trials for patients who
successfully completed the first year of therapy. In addition, patients whose HbA1c levels reach 8.5
or above will be assumed to discontinue therapy. Patients discontinuing their primary modeled
treatment will be assumed to transition to insulin therapy. This choice was made to be able to
evaluate the three medications head-to-head as opposed to evaluating differences in different
medication treatment pathways. Therefore, all patients who discontinue will be assumed to use
insulin treatment for the remainder of the model time horizon. Insulin treatment costs will be
modeled using mean doses from a literature review, applied to unit costs similar to the model
comparators.18 Clinical characteristics for patients on insulin will be modeled using the BRAVO
equations, which will then drive the event risk equations for those patients.18

©Institute for Clinical and Economic Review, 2021 Page 9 Tirzepatide for Type 2 Diabetes – Modeling Analysis Plan 09/23/2021 Return to Table of Contents
Mortality
The BRAVO risk equations predict mortality in two equations: all-cause and cardiovascular-related.
Cardiovascular-related death risk derives from hemoglobin levels, blood pressure, body mass index
(BMI), and cardiovascular disease history. All-cause mortality factors in gender, education level,
and smoking status in addition to disease history, hemoglobin level, blood pressure and BMI.
Stroke or congestive heart failure both substantially increase mortality risk the year in which they
occur.1
Health State Utilities
We will use consistent health state utility values across treatments evaluated in the model.
Separate utilities will be used for the year in which a complication occurs and for patient history of
each complication, if applicable. Health state utilities will be derived from publicly available
literature and/or manufacturer-submitted data and applied to the modeled events. We plan to
utilize estimates for T2D complications primarily from Shao et al. and Neuwahl et al.19,20 In Shao et
al., the Health Utilities Index Mark 3 (HUI-3) was used to measure heath utility in a sample of 8,713
patients from the Action to Control Cardiovascular Risk in Diabetes (ACCORD) trial of high
cardiovascular disease risk T2D patients.20 Neuwahl et al. also used the HUI-3 to measure health
utility in 15,252 patients from the ACCORD trial and the Look AHEAD (Action for Health in Diabetes)
model of patients with T2D.19 Lastly, we will model an annual disutility for daily injection of insulin
(for patients who discontinue treatment) based on Boye et al., who used standard gamble
interviews of T2D patients in Scotland to estimate the utility values for injection-related
attributes.21

©Institute for Clinical and Economic Review, 2021 Page 10 Tirzepatide for Type 2 Diabetes – Modeling Analysis Plan 09/23/2021 Return to Table of Contents
Table 2.3. Health State Utilities/Disutilities
Estimate SE Source
Baseline Utility 0.800 0.023 Shao20
Macrovascular Complications
Congestive heart failure event -0.089 0.022 Shao20
Congestive heart failure history -0.041 0.010 Shao20
Ischemic heart disease history* -0.016 0.005 Shao20
Myocardial infarction event -0.042 0.016 Shao20, Neuwahl19
Myocardial infarction history -0.011 0.006 Shao20, Neuwahl19
Stroke event -0.204 0.035 Shao20, Neuwahl19
Stroke history -0.101 0.008 Shao20, Neuwahl19
Microvascular Complications
Blindness history -0.057 0.009 Shao20
Renal disease history -0.024 0.016 Shao20
Hypoglycemia Event -0.036 0.010 Shao20, Neuwahl19
Hypoglycemia History -0.033 0.011 Shao20
Patient Characteristics
Current smoker -0.054 0.006 Shao20, Neuwahl19
BMI (per unit ≥32) -0.007 0.000 Shao20, Neuwahl19
Diabetes duration (per year) -0.005 0.000 Shao20, Neuwahl19
SE: standard error
*Disutility for ischemic heart disease is based on “revascularization history” from Shao et al.1
Drug Utilization
The following inputs will be used to model drug utilization and associated costs:
• Duration of treatment
• Schedule of doses for each drug in each add-on regimen
• Protocol dosage for the indication
• Treatment adherence (base case assumption = 100% since modeling treatment efficacy and
safety based on randomized controlled trial data)
©Institute for Clinical and Economic Review, 2021 Page 11 Tirzepatide for Type 2 Diabetes – Modeling Analysis Plan 09/23/2021 Return to Table of Contents
Table 2.4. Treatment Regimen Recommended Dosage
Tirzepatide Semaglutide Empagliflozin
Brand Name N/A Ozempic® Jardiance®
Manufacturer Eli Lilly Novo Nordisk Boehringer Ingelheim &
Eli Lilly
Route of Administration Subcutaneous injection Subcutaneous injection Oral
Dosing 15 mg once weekly 1 mg once weekly 10 or 25 mg daily
mg: milligram
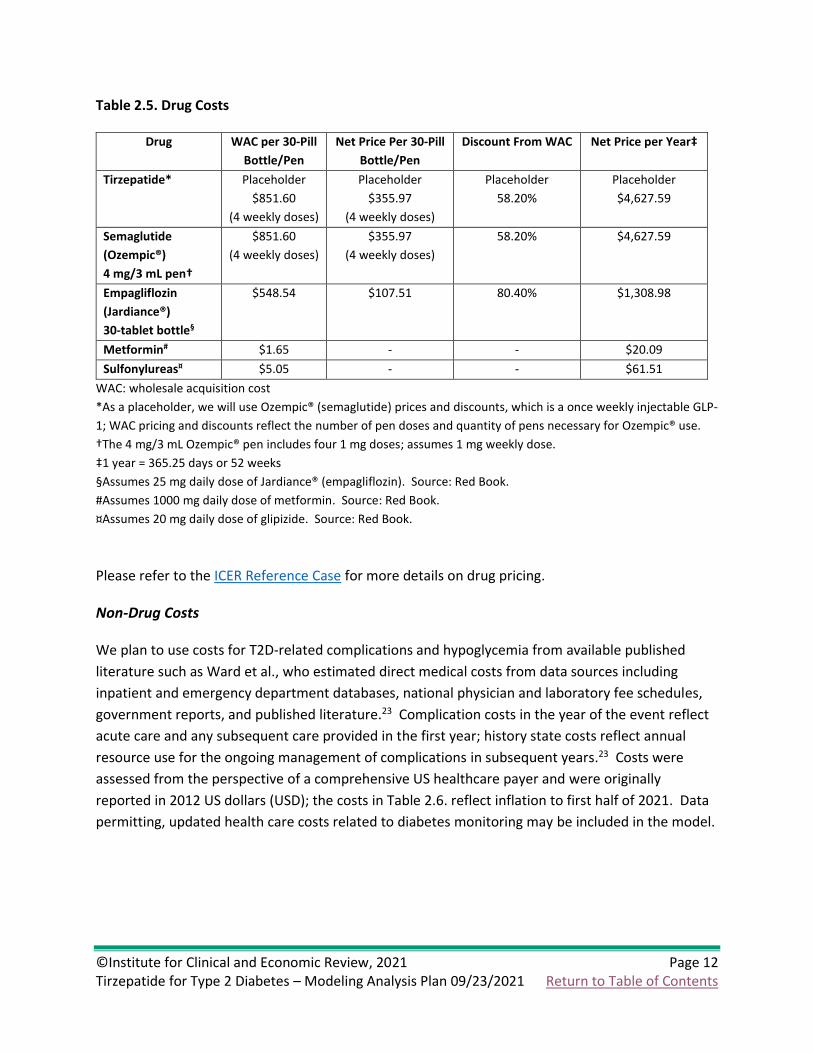
Cost Inputs
Drug Costs
Because tirzepatide is not approved by the FDA, the drug price is not yet available. Based on the
ICER Reference Case, we investigated calculation of a placeholder price based on the average of all
available once-weekly injectable GLP-1s. However, we uncovered that discounted pricing for once-
weekly injectable Bydureon BCise® (exenatide extended-release) is approximately three times that
of Ozempic® (semaglutide), suggesting it may be an unsuitable proxy to inform tirzepatide
placeholder pricing. Given this, if the drug cost or an analyst estimate is not available at the time of
the report, we will use the price of Ozempic® (semaglutide) as a placeholder price for tirzepatide, as
well as calculate the threshold prices at the standard cost-effectiveness thresholds: $50,000
through $200,000 per QALY and per evLY gained. If the Wholesale Acquisition Cost is available at
the time of the report but no information is available related to the net price, we will use
manufacturer supplied estimates of net price or if not available, then apply estimated branded drug
discount rates based on an average for GLP-1s to obtain net pricing estimates for tirzepatide.
For each comparator, we obtained net pricing estimates from SSR Health, LLC, which combines data
on unit sales with publicly-disclosed US sales figures that are net of discounts, rebates, concessions
to wholesalers and distributors, and patient assistance programs, to derive a net price.22 We
estimated net prices by comparing the most recent four-quarter averages (i.e., third quarter of
2020 through second quarter of 2021) of both net prices and wholesale acquisition cost (WAC) per
unit to arrive at a mean discount from WAC for the drug. Finally, we applied this average discount
to the most recent available WAC (accessed September 2021) to arrive at an estimated net price
per unit.
©Institute for Clinical and Economic Review, 2021 Page 12 Tirzepatide for Type 2 Diabetes – Modeling Analysis Plan 09/23/2021 Return to Table of Contents
Table 2.5. Drug Costs
Drug WAC per 30-Pill
Bottle/Pen
Net Price Per 30-Pill
Bottle/Pen
Discount From WAC Net Price per Year‡
Tirzepatide* Placeholder
$851.60
(4 weekly doses)
Placeholder
$355.97
(4 weekly doses)
Placeholder
58.20%
Placeholder
$4,627.59
Semaglutide
(Ozempic®)
4 mg/3 mL pen†
$851.60
(4 weekly doses)
$355.97
(4 weekly doses)
58.20% $4,627.59
Empagliflozin
(Jardiance®)
30-tablet bottle§
$548.54 $107.51 80.40% $1,308.98
Metformin# $1.65 - - $20.09
Sulfonylureas¤ $5.05 - - $61.51
WAC: wholesale acquisition cost
*As a placeholder, we will use Ozempic® (semaglutide) prices and discounts, which is a once weekly injectable GLP-
1; WAC pricing and discounts reflect the number of pen doses and quantity of pens necessary for Ozempic® use.
†The 4 mg/3 mL Ozempic® pen includes four 1 mg doses; assumes 1 mg weekly dose.
‡1 year = 365.25 days or 52 weeks
§Assumes 25 mg daily dose of Jardiance® (empagliflozin). Source: Red Book.
#Assumes 1000 mg daily dose of metformin. Source: Red Book.
¤Assumes 20 mg daily dose of glipizide. Source: Red Book.
Please refer to the ICER Reference Case for more details on drug pricing.
Non-Drug Costs
We plan to use costs for T2D-related complications and hypoglycemia from available published
literature such as Ward et al., who estimated direct medical costs from data sources including
inpatient and emergency department databases, national physician and laboratory fee schedules,
government reports, and published literature.23 Complication costs in the year of the event reflect
acute care and any subsequent care provided in the first year; history state costs reflect annual
resource use for the ongoing management of complications in subsequent years.23 Costs were
assessed from the perspective of a comprehensive US healthcare payer and were originally
reported in 2012 US dollars (USD); the costs in Table 2.6. reflect inflation to first half of 2021. Data
permitting, updated health care costs related to diabetes monitoring may be included in the model.

©Institute for Clinical and Economic Review, 2021 Page 13 Tirzepatide for Type 2 Diabetes – Modeling Analysis Plan 09/23/2021 Return to Table of Contents
Table 2.6. Cost per T2D-Related Complication and per Hypoglycemic Event
Estimate (2021 USD)
Incremental Cost in the Year of Event/Diagnosis (per event)23,24
Heart Failure $29,774
Ischemic Heart Disease $26,827
Myocardial Infarction $70,738
Stroke $52,785
Hypoglycemia
Episode Requiring Hospitalization $20,651
Episode Requiring ED visit $1,643
Episode Requiring Glucagon Injection $221
Incremental Cost of Living with History of Complication (per year)23,24
Heart Failure* $2,386
Ischemic Heart Disease* $2,386
Myocardial Infarction* $2,386
Stroke $19,475
Blindness $3,587
Renal Disease $89,874
*Annual state costs for cardiovascular complications were obtained from a Medical Expenditure Panel Survey
report on heart condition-associated office visits and medications.
2.6 Model Outcomes
Model outcomes will include life years (LYs) gained, equal value life years (evLYs) gained, QALYs
gained, clinical events, and total costs for each intervention over a lifetime time horizon. Costs will
also be reported by the clinical event in order to understand the contribution of different cost
elements. All costs and outcomes will be reported as discounted values, using a discount rate of 3%
per annum.5
2.7 Model Analysis
Cost-effectiveness will be estimated using the incremental cost-effectiveness ratios, with
incremental analyses comparing tirzepatide to each comparator, from a health care sector
perspective in the base case analyses. Additionally, we will present a cost per consequence
outcomes including cost per MACE avoided and cost per renal disease avoided.
Sensitivity Analyses
We will conduct one-way sensitivity analyses to identify the impact of parameter uncertainty and
key drivers of model outcomes. Probabilistic sensitivity analyses will also be performed by jointly
varying all model parameters and BRAVO risk engine equation coefficients over 1,000 simulations
(or the minimum number necessary to achieve statistical convergence), then calculating 95%
credible range estimates for each model outcome based on the results. This probabilistic analysis
©Institute for Clinical and Economic Review, 2021 Page 14 Tirzepatide for Type 2 Diabetes – Modeling Analysis Plan 09/23/2021 Return to Table of Contents
incorporates uncertainty in the model input parameters and BRAVO risk engine patient-level
predictions simultaneously. When modeling the BRAVO equation uncertainty for tirzepatide, we
plan to double the uncertainty estimates due to a lack of long-term cardiovascular outcomes data
against which to calibrate. For any of the BRAVO equation coefficients with unavailable uncertainty
estimates, we plan to use a 10% parameter uncertainty for the comparators and 20% parameter
uncertainty for tirzepatide. We will also perform threshold analyses for drug costs across a range of
incremental cost-effectiveness ratios (from $50,000 to $150,000 per QALY).
Scenario Analyses
If data allow, we will consider conducting scenario analyses that include:
1) Modified societal perspective that includes components such as productivity impacts or
other indirect costs as applicable
2) Modified time horizon (e.g., 10 years)
3) Sub-groups by cardiovascular event risk and renal impairment as data allow
Model Validation
We will use several approaches to validate the model. First, we will provide preliminary methods
and results to manufacturers, patient groups, and clinical experts. Based on feedback from these
groups, we will refine data inputs used in the model, as needed. Second, we will vary model input
parameters to evaluate face validity of changes in results. We will perform model verification for
model calculations using internal reviewers. As part of ICER’s efforts in acknowledging modeling
transparency, we will also share the model with the manufacturers for external verification around
the time of publishing the draft report for this review. Finally, we will compare results to other T2D
cost-effectiveness models. The outputs from the model will be validated against the available trial
data of the interventions and also any relevant observational datasets.

©Institute for Clinical and Economic Review, 2021 Page 15 Tirzepatide for Type 2 Diabetes – Modeling Analysis Plan 09/23/2021 Return to Table of Contents
3. Methods: Potential Budget Impact
3.1 Overview
ICER will use results from the cost-effectiveness model to estimate the potential total budgetary
impact of tirzepatide in adults with T2D with inadequate glycemic control despite current treatment
with antihyperglycemic agent(s). We will use a placeholder estimate, and the three benchmark
prices (at $50,000, $100,000, and $150,000 per QALY) for tirzepatide in our estimates of budget
impact. The pricing estimates will align with those used in the cost-effectiveness model.
The aim of the potential budgetary impact analysis is to document the percentage of patients who
could be treated at selected prices without crossing a potential budget impact threshold that is
aligned with overall growth in the US economy. For 2021-2022, the five-year annualized potential
budget impact threshold that should trigger policy actions to manage access and affordability is
calculated to be approximately $734 million per year for new drugs.
3.2 Methods
We will use results from the same model employed for the cost-effectiveness analyses to estimate
total potential budget impact. Potential budget impact is defined as the total differential cost of
using each new therapy rather than relevant existing therapy for the treated population, calculated
as differential health care costs (including drug costs) minus any offsets in these costs from averted
health care events or decreased healthcare utilization. All costs will be undiscounted with regard to
time and estimated over a five-year time horizon.
This potential budget impact analysis will include the estimated number of individuals in the US
who would be eligible for treatment. To estimate the size of the potential candidate population for
treatment, we used inputs for the total US adult population size (~265 million) 25, overall T2D
prevalence (14.6%) 26, proportion of patients with diagnosed T2D (76.7%) 26, and the proportion of
patients having failed background therapy and thus eligible for treatment (47.2%) 20. Applying
these sources results in estimates of 14,006,143 eligible patients in the US. For the purposes of this
analysis, we will assume that 20% of these patients would initiate tirzepatide treatment in each of
the five years, or approximately 2,801,229 patients per year. Market shares in the model will be
aligned with those comparators selected within the cost-effectiveness analysis. Any market shares
attributed to therapies outside the scope of this review will instead be attributed to background
therapy. We will evaluate whether tirzepatide would take market share from one or more existing
treatments and calculate the blended budget impact associated with displacing use of existing
therapies. The analysis will use clinical expert opinion regarding the treatments likely to be
displaced and to what extent they are displaced by use of tirzepatide within the eligible population.
©Institute for Clinical and Economic Review, 2021 Page 16 Tirzepatide for Type 2 Diabetes – Modeling Analysis Plan 09/23/2021 Return to Table of Contents
3.3 Analyses
The analysis will indicate when the potential budget impact threshold is reached at each
combination of price and percent uptake among eligible patients at five years. The goal is to
estimate the net cost per patient treated with new interventions so that decisionmakers can use
their own assumptions about uptake and pricing to determine estimates of potential budget
impact. Results of the analysis will be presented as cumulative per-patient potential budget impact
for each year over the five-year time horizon, with results being presented graphically for
tirzepatide, and numerical data presented in tabular format in an appendix. The graph will show
the average potential budget impact for a single patient over various time horizons from one to five
years, and the estimated average net cost of treating a patient with the intervention relative to
comparator(s) over the five years of the potential budget impact analysis.
If the potential budget impact threshold is reached, a figure will be presented showing the
approximate proportion of eligible patients that could be treated in a given year without crossing
the threshold at each price, indicating when the potential budget impact threshold is reached at
each combination of price and percent uptake among eligible patients at 5 years. If the potential
budget impact threshold is not reached, a table for each treatment and population of interest will
present the annual potential budgetary impact of treating the entire eligible populations across all
prices (placeholder price, and the three cost-effectiveness threshold prices for $50,000, $100,000,
and $150,000 per QALY), and the percent of the potential budget impact threshold that this
represents.
Access and Affordability
In the final evidence report, ICER will include an “affordability and access alert” if discussion among
clinical experts at the public meeting of ICER’s independent appraisal committees suggests that full,
“clinically optimal” utilization at estimated net pricing (or at the $150,000 per QALY threshold price
if estimated net price is not available) would exceed the ICER annual potential budget impact
threshold, without active intervention by insurers and others to manage access to the treatment.

©Institute for Clinical and Economic Review, 2021 Page 17 Tirzepatide for Type 2 Diabetes – Modeling Analysis Plan 09/23/2021 Return to Table of Contents
References
1. Shao H, Fonseca V, Stoecker C, Liu S, Shi L. Novel Risk Engine for Diabetes Progression and Mortality in USA: Building, Relating, Assessing, and Validating Outcomes (BRAVO). Pharmacoeconomics. 2018;36(9):1125-1134.
2. Guzauskas GF, Rind DM, Fazioli K, Chapman RH, Pearson SD, Hansen RN. Cost-effectiveness of oral semaglutide added to current antihyperglycemic treatment for type 2 diabetes. Journal of Managed Care & Specialty Pharmacy. 2021;27(4):455-468.
3. Hong D, Si L, Jiang M, et al. Cost effectiveness of sodium-glucose cotransporter-2 (SGLT2) inhibitors, glucagon-like peptide-1 (GLP-1) receptor agonists, and dipeptidyl peptidase-4 (DPP-4) inhibitors: a systematic review. Pharmacoeconomics. 2019;37(6):777-818.
4. Reifsnider OS, Kansal AR, Gandhi PK, et al. Cost-effectiveness of empagliflozin versus canagliflozin, dapagliflozin, or standard of care in patients with type 2 diabetes and established cardiovascular disease. BMJ Open Diabetes Research and Care. 2021;9(1):e001313.
5. Neumann PJ, Sanders GD, Russell LB, Siegel JE, Ganiats TG. Cost-effectiveness in health and medicine. Oxford University Press; 2016.
6. Shao H, Shi L, Fonseca VA. Using the BRAVO Risk Engine to Predict Cardiovascular Outcomes in Clinical Trials With Sodium–Glucose Transporter 2 Inhibitors. Diabetes care. 2020;43(7):1530-1536.
7. National Health and Nutrition Examination Survey. In: Prevention CfDCa, ed. 8. Frías JP, Davies MJ, Rosenstock J, et al. Tirzepatide versus Semaglutide Once Weekly in Patients
with Type 2 Diabetes. N Engl J Med. 2021;385(6):503-515. 9. Ahrén B, Masmiquel L, Kumar H, et al. Efficacy and safety of once-weekly semaglutide versus
once-daily sitagliptin as an add-on to metformin, thiazolidinediones, or both, in patients with type 2 diabetes (SUSTAIN 2): a 56-week, double-blind, phase 3a, randomised trial. Lancet Diabetes Endocrinol. 2017;5(5):341-354.
10. Rosenstock J, Allison D, Birkenfeld AL, et al. Effect of Additional Oral Semaglutide vs Sitagliptin on Glycated Hemoglobin in Adults With Type 2 Diabetes Uncontrolled With Metformin Alone or With Sulfonylurea: The PIONEER 3 Randomized Clinical Trial. JAMA. 2019;321(15):1466-1480.
11. Rodbard HW, Rosenstock J, Canani LH, et al. Oral Semaglutide versus Empagliflozin in Patients with Type 2 Diabetes Uncontrolled on Metformin: The PIONEER 2 Trial. Diabetes Care. 2019:dc190883.
12. Häring HU, Merker L, Seewaldt-Becker E, et al. Empagliflozin as add-on to metformin in patients with type 2 diabetes: a 24-week, randomized, double-blind, placebo-controlled trial. Diabetes Care. 2014;37(6):1650-1659.
13. Davies M, Pieber TR, Hartoft-Nielsen M-L, Hansen OKH, Jabbour S, Rosenstock J. Effect of Oral Semaglutide Compared With Placebo and Subcutaneous Semaglutide on Glycemic Control in Patients With Type 2 Diabetes: A Randomized Clinical Trial. JAMA. 2017;318(15):1460-1470.
14. Frias JP, Nauck MA, Van J, et al. Efficacy and safety of LY3298176, a novel dual GIP and GLP-1 receptor agonist, in patients with type 2 diabetes: a randomised, placebo-controlled and active comparator-controlled phase 2 trial. Lancet. 2018;392(10160):2180-2193.
15. Buse JB, Group AS. Action to Control Cardiovascular Risk in Diabetes (ACCORD) trial: design and methods. The American journal of cardiology. 2007;99(12):S21-S33.
16. Greenwell AA, Chahade JJ, Ussher JR. Cardiovascular biology of the GIP receptor. Peptides. 2020;125:170228.

©Institute for Clinical and Economic Review, 2021 Page 18 Tirzepatide for Type 2 Diabetes – Modeling Analysis Plan 09/23/2021 Return to Table of Contents
17. Jujić A, Atabaki-Pasdar N, Nilsson PM, et al. Glucose-dependent insulinotropic peptide and risk of cardiovascular events and mortality: a prospective study. Diabetologia. 2020:1-12.
18. Willis M, Asseburg C, Nilsson A, Johnsson K, Kartman B. Multivariate Prediction Equations for HbA1c Lowering, Weight Change, and Hypoglycemic Events Associated with Insulin Rescue Medication in Type 2 Diabetes Mellitus: Informing Economic Modeling. Value Health. 2017;20(3):357-371.
19. Neuwahl SJ, Zhang P, Chen H, et al. Patient Health Utility Equations for a Type 2 Diabetes Model. Diabetes Care. 2021;44(2):381-389.
20. Shao H, Yang S, Fonseca V, Stoecker C, Shi L. Estimating quality of life decrements due to diabetes complications in the United States: the Health Utility Index (HUI) diabetes complication equation. Pharmacoeconomics. 2019;37(7):921-929.
21. Boye KS, Matza LS, Walter KN, Van Brunt K, Palsgrove AC, Tynan A. Utilities and disutilities for attributes of injectable treatments for type 2 diabetes. The European Journal of Health Economics. 2011;12(3):219-230.
22. SSR Health L. https://www.ssrhealth.com/. Published 2018. Accessed. 23. Ward A, Alvarez P, Vo L, Martin S. Direct medical costs of complications of diabetes in the United
States: estimates for event-year and annual state costs (USD 2012). J Med Econ. 2014;17(3):176-183.
24. Bureau of Labor Statistics. Medical care in U.S. city average, all urban consumers, not seasonally adjusted. https://data.bls.gov/timeseries/CUUR0000SAM. Published 2019. Accessed 7/15/2019, 2019.
25. US Census Bureau. 2017 National Population Projections Datasets. Projected Population by Single Year of Age, Sex, Race, and Hispanic Origin for the United States: 2016 to 2060. 2017.
26. Wang L, Li X, Wang Z, et al. Trends in Prevalence of Diabetes and Control of Risk Factors in Diabetes Among US Adults, 1999-2018. JAMA. 2021;326(8):704-716.