timor-lestepdf.usaid.gov/pdf_docs/pnadl723.pdfincreasing population density in rural areas. gender...
TRANSCRIPT
Timor-Leste Economic Recovery Assessment
May 2008
This publication was produced by Nathan Associates Inc. for review by the United States Agency for International Development.


Timor-Leste Economic Recovery Assessment
DISCLAIMER
The authors’ views expressed in this publication do not necessarily reflect the views of the United States Agency for International Development or the United States Government.

Sponsored by the Economic Growth office of USAID’s Bureau of Economic Growth, Agriculture and Trade (EGAT), under Contract No. PCE-I-00-00-00013-00, Task Order 004, the Country Analytical Support (CAS) Project, 2004–2006, Nathan Associates Inc. developed a standard methodology for producing analytical reports to provide a clear and concise evaluation of economic growth performance in designated countries receiving USAID assistance. The reports are tailored to meet the needs of USAID missions and regional bureaus for country-specific analysis. Each report contains:
⎯ A synthesis of key data indicators drawn from numerous sources, including the World Bank, the International Monetary Fund, the Millennium Challenge Corporation, the United Nations, other international data sets, and host-country documents and data sources;
⎯ International benchmarking to assess country performance in comparison to similar countries, groups of countries, and predicted values based on international data;
⎯ An easy-to-read analytic narrative that highlights areas in which a country’s performance is particularly strong or weak, to assist in the identification of future programming priorities.
⎯ A convenient summary of the main findings, in the form of a Highlights Table and a Performance Scorecard (in lieu of an Executive Summary)
Under Contract No. GEG-I-00-04-00002-00, Task Order 004, 2006-2008, Nathan has developed a special Economic Recovery template for countries emerging from crisis. This report is a pilot for the new template.
The authors of the present report are Roger Manring, Alexander Greenbaum, and Pooja Pokhrel from Nathan Associates and Pauline Baker and Krista Hendry from the Fund for Peace. Peter Miller of Nathan Associates assisted with data management.
The CTO for this project is Yoon Lee and the Activity Manager at USAID/EGAT/EG is Phillip Palmer. USAID missions and bureaus may seek assistance and funding for country analytical studies or in-depth follow-on studies by contacting Mr. Palmer at [email protected].
Subject to EGAT consent, electronic copies of reports and materials relating to the CAS project are available at www.nathaninc.com. For further information or hard copies of CAS publications, please contact:
Rose Mary Garcia. Chief of Party, CAS Project. Nathan Associates Inc. [email protected]
Contents Highlights of Timor-Leste’s performance v
Timor-Leste: Notable Strengths and Weaknesses—Selected Indicators vii
Timor-Leste: Potential postconflict recovery priorities and Summary of core issues ix
1. Introduction 1
Methodology 1
Data Quality 3
2. Economy and Conflict Recovery Overview 5
Profile of Conflict and Recovery 5
Postconflict Economic growth 9
Poverty and Inequality 13
Economic Structure 15
Demography and Environment 18
Gender and Children 20
3. Private Sector Enabling Environment 23
Economic Stabilization and Government Capacity 23
Business Environment 27
Financial Sector 30
External Sector 33
Economic Infrastructure 36
4. Pro-Poor Growth Environment 41
Health 41
Education 45
Employment and Workforce 47
Agriculture 48
Appendix A. CAS Methodology
Appendix B. Data Supplement
I V C O N T E N T S
Illustrations
Figures Figure 2-1. Pressure on the State and Capacity to Cope Timor-Leste and other
Postconflict Comparators 8 Figure 2-2. Real (Nonpetroleum) GDP Growth 10 Figure 2-3. Gross Fixed Investment as a Percentage of Nonpetroleum GDP 12 Figure 2-4. Human Poverty Index 14 Figure 2-5. Structure of Timor-Leste’s Output and Employment for
Nonpetroleum GDP, Most Recent Year 17 Figure 2-6. Population Growth Rate 18 Figure 2-7. Youth Dependency Rate 19 Figure 2-8. Male and Female Gross Enrollment Rates, All Levels 22 Figure 3-1. Government Revenue, as a Percentage of (Nonpetroleum) GDP 24 Figure 3-2. Government Effectiveness Index 26 Figure 3-3. Rule of Law Index 28 Figure 3-4. Ease of Doing Business Ranking 29 Figure 3-5. Money Supply, as a Percentage of GDP 31 Figure 3-6. Nonpetroleum Merchandise Trade, as a Percentage of Nonpetroleum
GDP 33 Figure 3-7. Current Account Balance, as a Percentage of Nonpetroleum GDP 35 Figure 3-8. Overall Infrastructure Quality Index 37 Figure 4-1. Maternal Mortality Rate 42 Figure 4-2. Prevalence of Child Malnutrition (Weight for Age) 43 Figure 4-3. Total Net Primary Enrollment Rate 46 Figure 4-4. Youth Unemployment Rate, 47 Figure 4-5. Agriculture Value Added Per Worker 50
Tables Table 1-1. Topic Coverage 3 Table 2-1. Timor-Leste’s Ranking on Failed States Index, by Indicator, 2007
and Change from 2002, Points 7
Exhibits Exhibit 1-1. Chronology of Timor-Leste’s Long-Term Political Strife and
Conflict 6 Exhibit 2-2. Conflict and Economic Growth 9 Exhibit 2-3. Petroleum Fund 11

HIGHLIGHTS OF TIMOR-LESTE’S PERFORMANCE Profile of Conflict and Recovery
Timor-Leste has suffered from serious outbreaks of violence since it gained independence in 2002. Although the Failed States Index shows some improvement in human flight (emigration) and group grievances in the past five years, scores for legitimacy of the state, security apparatus, fractionalized elites, uneven economic development, and the numbers of refugees and displaced persons have deteriorated seriously.
Post-conflict Economic Growth
Timor-Leste’s economy has struggled to recover since independence. Between 2002 and 2006, real nonpetroleum GDP contracted by more than 5 percent. Though 2007 should see economic growth, declining capital investment is constraining economic prospects.
Poverty and Inequality
Widespread poverty and inequality pose continuing threats to political and economic stability and complicate postconflict recovery. An estimated 42 percent of the population lives below the national poverty line, and the poorest 40 percent of the population account for less than 20 percent of total consumer expenditure.
Economic Structure
Evolving trends in Timor-Leste’s nonpetroleum economy appear to be contrary to the rapid economic acceleration and transformation needed for postconflict recovery. Industry’s and services’ shares of nonpetroleum GDP have been declining, and the economy relies too strongly on low-productivity agriculture for sustenance.
Demography and Environment
Mounting demographic pressures are threatening political and economic stability. Of particular concern are a high population growth rate, a large youth bulge, and increasing population density in rural areas.
Gender and Children
Timor-Leste performs fairly well on most basic indicators of gender equity, apart from labor force participation, where a significant gender gap exists.
Economic Stabilization and Government Capacity
The government has maintained fairly low inflation levels. Because of oil and gas revenues (172 percent of nonpetroleum GDP) the fiscal surplus is huge (111 percent of nonpetroleum GDP). Public sector expenditure levels, especially capital expenditure, are low, and more expenditure is needed for postconflict recovery. Government’s capacity to execute is very poor, and its limited effectiveness undermines its credibility.
Business Environment
The institutional framework for private sector growth is very weak, and the country’s Doing Business ranking is 168 out of 178. Contract enforcement and business start-up are excessively burdensome, and several key procedures (land titling, property and land registration) absent. Poor showing on indices of corruption, rule of law, voice and accountability point to poor governance. The establishment of the Office of Provedor (ombudsman) is, however, a sign of progress.
Financial Sector The economy is poorly monetized (money supply as a share of the nonpetroleum GDP is only 32 percent). Credit to the private sector is growing (although it slumped with the 2006 conflict). The financial sector enabling environment is weak, and there is significant unmet demand for microfinance. There is potential and need for savings mobilization to modernize and monetize the rural sector.

V I
External Sector Except for petroleum, Timor-Leste is poorly integrated into the world trading system (nonpetroleum exports and imports are equal to only 42 percent of nonpetroleum GDP), but thanks to oil and gas income, Timor-Leste has a huge current account surplus and no debt. Nevertheless, foreign aid is still high. FDI outside oil is nonexistent. Imports are declining, including imports of capital goods. Nonpetroleum exports are minimal.
Economic Infrastructure
Infrastructure systems and services are poor—among the world’s weakest—especially roads, which are crucial to recovery and the growth of the agriculture-based rural sector, and power. Major investments to upgrade infrastructure are planned, including MCA Compact-funded projects.
Health Despite progress in reestablishing some basic health infrastructure since independence, the disrupted or short supply of drugs and skilled health professionals has resulted in poor health outcomes. Maternal mortality and child malnutrition are high; communicable diseases such as TB and malaria are widespread; the supply of basic facilities such as improved water source and sanitation remain weak; and public education on health is needed.
Education Although the youth literacy rate is the best in the country’s history, retention rates—especially at the primary level—remain a cause for concern. There is also an urgent need to expand educational services and infrastructure to accommodate a rapidly growing youth population, including new infrastructure and extensive recruitment, and capacity development of teachers.
Employment and Workforce
An estimated 43 percent of youth in Timor-Leste are unemployed. As demographic pressures mount, this number will likely deteriorate further as more youth try to enter an already saturated labor market.
Agriculture Agricultural productivity is low in Timor-Leste, and food security is a serious problem in rural areas. Rapid productivity gains are needed to sustain the more than 80 percent of the population who rely on agriculture for employment and to promote peace and prosperity. The expansion and diversification of cash-cropping are also essential.
Note: The methodology used for diagnostic benchmarking is explained in the Appendix.

TIMOR-LESTE: NOTABLE STRENGTHS AND WEAKNESSES—SELECTED INDICATORS
Selected Indicators, by Topic Notable
Strengths Notable
Weaknesses
Profile of Conflict and Recovery
Failed States Index X
Postconflict Economic Growth
Real (nonpetroleum) GDP growth X
Gross fixed investment, percentage of GDP X
Poverty and Inequality
Human Poverty Index X
Population living below the national poverty line X
Economic Structure
Industry value added X
Demography and Environment
Adult literacy rate X
Youth dependency rate X
Youth bulge X
Population growth rate X
Rural population density X
Gender and Children
Male and female gross enrollment rate X
Economic Stabilization and Government Capacity
Institutional capacity X
Inflation rate X
Government revenue, percentage of GDP X
Overall government budget balance, percentage of GDP X
Business Environment
Control of Corruption Index X
Voice and Accountability Index X
Rule of Law Index X
Ease of Doing Business ranking X
Financial Sector
Money supply, percentage of GDP X
Banking sector default rates X
External Sector
Trade in goods and services, percentage of GDP X

V I I I T I M O R - L E S T E E C O N O M I C R E C O V E R Y A S S E S S M E N T
Notable Notable Selected Indicators, by Topic Strengths Weaknesses
Export growth of goods and services X
Current account balance, percentage of GNP X
Debt service ratio, percentage of exports X
Gross international reserves, months of imports X
Concentration of exports X
Trade Logistics Performance Index—Customs X
Country Credit Ranking X
Economic Infrastructure
Overall infrastructure quality X
Air Transport Infrastructure Index X
Port Infrastructure Quality Index X
Rail Development Index X
Quality of Electricity Supply Index X
Logistics Performance Index - Infrastructure X
Households with access to electricity, percentage of total X
Internet users X
Health
Prevalence of child malnutrition X
Maternal mortality rate X
Access to improved sanitation X
Access to improved water source X
Education
Gross secondary enrollment rate X
Persistence in school to grade 5 X
Employment and Workforce
Youth unemployment rate X
Rigidity of Employment Index X
Informal sector employment, percentage labor force X
Agriculture
Agriculture valued added per worker X
Crop Production Index X
Note: The chart identifies selective indicators for which Timor-Leste’s performance is particularly strong or weak relative to benchmark standards, as explained in the Appendix. Details are discussed in the text. The separate Data Supplement presents a full tabulation of the data and international benchmarks examined for this report, along with technical notes on the data sources and definitions. The supplement is available at http://www.nathaninc.com/projects/projectdetails.asp?pid=138&pfid=0&rpid=4&rid=9

TIMOR-LESTE: POTENTIAL POSTCONFLICT RECOVERY PRIORITIES AND SUMMARY OF CORE ISSUES
Potential Priorities and Core Issues
Postconflict economic growth—Raise investment ratio in nonpetroleum GDP
1. Organization and execution of large-scale public sector-led capital programs
2. Reform of business enabling environment
Poverty and inequality—Employ oil and gas wealth for effective poverty reduction
1. Design and implementation of targeted pro-poor public investments/services (infrastructure, cash transfers)
Economic structure—Expand industry and services sectors (nonpetroleum economy)
1. Design and implementation of economywide reconstruction and public service delivery
2. Productivity-enhancing linkages between agriculture and industry and services (value chains)
Demography and environment—Address youth needs and reduce population growth
1. Education, training and job creation targeted to unemployed youth
2. Rural productivity enhancement and environmental resource management systems
3. Reduction of female fertility rates
Gender and children—Promote gender equity and protect vulnerable populations
1. Job creation and employment promotion for women
2. Female enrollment and retention in education and training
3. Economic assistance and social and legal protection for poorest women and families
Economic stabilization and government capacity—Enhance execution capabilities
1. Increased capacity of government to execute budget priorities
2. Introduction and implementation of transparent procurement procedures (infrastructure and other projects)
3. Tax reform for private sector development
Business environment—Reform institutional framework for private sector growth
1. Improvement of governance oversight institutions and mechanisms (judiciary, administrative oversight)
2. Legal and regulatory reform framework for private sector development (regulations, supporting institutions)
Financial sector—Deepen and broaden financial services
1. Reform of the legal and regulatory framework of financial services (judiciary, contract enforcement, property rights)
2. Microfinance development (institutions, services, technology applications)
3. Savings mobilization for rural households and small savers
External sector—Provide trade capacity-building for recovery and development
1. Import of capital goods for reconstruction and expansion of infrastructure, plant and equipment
2. Export market linkages to expand rural sector cash cropping opportunities
3. Promotion of FDI to energize domestic private sector
Economic infrastructure—Develop and rehabilitate systems and services
1. Design and execution of large-scale infrastructure system development programs

X T I M O R - L E S T E E C O N O M I C R E C O V E R Y A S S E S S M E N T
Potential Priorities and Core Issues
2. Adoption of labor-intensive techniques for infrastructure construction and maintenance
3. Integration of private sector participation approaches in infrastructure system and service development
Health—Reestablish health systems and develop capacity of health professionals
1. Improving service delivery and health infrastructure systems
2. Public awareness campaigns on basic health standards and available health services
3. Training and scholarships to fill gap in supply of health care professionals
Education—Accommodate growing youth population in educational systems
1. Restoration of damaged or destroyed educational systems
2. Pupil retention approaches and programs (primary and secondary)
3. Expansion of educational services and infrastructure
4. Extensive recruitment and training of teachers to improve the quality of education
Employment and workforce—Create jobs for youth and unemployed/underemployed
1. Expansion of formal sector jobs (near-term emergency public employment for reconstruction)
2. Job creation in the rural sector (job training and investment and market development for agriculture)
Agriculture—Raise agricultural productivity
1. Improved inputs (seed varieties, fertilizer and pesticides, farming practices) for staple crops and coffee
2. Investment in rural infrastructure (storage facilities, irrigation, transport, market buildings)
3. Market information systems and services (marketing organization and value chains)
4. Institutional framework for agriculture (agricultural credit and finance, extension, land registration)

1. Introduction This report on Timor-Leste is one of a series of economic recovery assessments prepared for the EGAT Bureau to provide USAID missions and regional bureaus with a concise evaluation of key indicators covering a broad range of issues relating to economic recovery in designated host countries. The report draws on a variety of international data sources1 and uses international benchmarking against reference group averages, notably low-income countries in Asia as a group (designated as “LI-Asia”) and all low-income countries (designated as “LI”). This study also uses three other lower-middle-income countries—Fiji, Cape Verde, and Vanuatu—as comparators. A former Portuguese colony with an MCA compact, Cape Verde in many respects represents an aspiration for Timor-Leste’s longer-term prospects; Vanuatu is in the same geographic region as Timor-Leste and is also an MCA compact country; and Fiji is considered to be a more successful higher-income Pacific island.
METHODOLOGY The methodology used here is analogous to examining an automobile dashboard to see which gauges are signaling problems. Sometimes a blinking light has obvious implications—such as the need to fill the fuel tank. In other cases, it may be necessary to have a mechanic probe more deeply to assess the source of the trouble and determine the best course of action.2 Similarly, an Economic Recovery Assessment is based on an examination of key economic, conflict, and social indicators, to see which ones are signaling problems. Some “blinking” indicators have clear implications, while others may require further study to investigate the problems more fully and identify appropriate courses for programmatic action.
The analysis is organized around two mutually supportive goals: sustainable growth and poverty reduction.3 It is based on an approach and template similar to the one developed for the Country Analytical Template (April 2005) but is adapted to the circumstances of postconflict recovery settings.
1 Sources include the World Bank, the International Monetary Fund, the Millennium Challenge Corporation, the United Nations (including the Millennium Development Goals database), the World Economic Forum, and host-country documents and data sources. This report reflects data available as of early January 2008.
2 Sometimes, too, the problem is faulty wiring to the indicator—analogous here to faulty data. 3 In USAID’s white paper U.S. Foreign Aid: Meeting the Challenges of the Twenty-first Century (January
2004), transformational growth is a central strategic objective, both for its innate importance as a development goal and because growth is the most powerful engine for poverty reduction.
2 T I M O R - L E S T E E C O N O M I C R E C O V E R Y A S S E S S M E N T
Realizing peace, reducing poverty, and achieving sustained economic growth are goals that are influenced by human development outcomes where many elements are involved, including: population growth, public provision of education and health services; job creation and workforce development (especially among youth); demographic composition, agricultural development; and progress toward gender equity. Countries affected by conflict are generally characterized by a lack of government capacity, minimal private sector activity, weak or damaged infrastructure, and a population that lives under uncertainty, possibly fleeing war-torn regions.
Transformational growth requires a high level of investment and rising productivity, which are achieved by establishing a strong enabling environment for private sector development, involving several elements: macroeconomic stability; a sound legal and regulatory system, including secure contract and property rights; effective control of corruption; a sound and efficient financial system; openness to trade and investment; sustainable debt management; investment in education, health, and workforce skills; infrastructure development; and sustainable use of natural resources.
In turn, the impact of growth on poverty depends on policies and programs that create opportunities and build capabilities for the poor. We call this the pro-poor growth environment. Here, too, many elements are involved, including effective education and health systems, policies facilitating job creation, agricultural development (in countries where the poor depend predominantly on farming), dismantling barriers to micro and small enterprise development, and progress toward gender equity.
In countries such as Timor-Leste that have experienced ongoing conflict, the interaction between security conditions and economic performance must also be taken into consideration. Overt conflict, or even the risk of serious conflict, can adversely affect growth; conversely, an end to conflict can deliver a peace dividend and a boost to economic growth and development. Not only can conflict affect the economy, economic conditions can exacerbate or ameliorate security problems.
The present evaluation must be interpreted with care. A concise analysis of selected indicators cannot provide a definitive diagnosis of economic performance problems or simple answers to questions about programmatic priorities. Instead, the aim of the analysis is to spot signs of serious problems affecting economic growth (subject to the limits of data availability and quality), provide insight into potential paths for USAID intervention, complement on-the-ground knowledge, and point the way toward further in-depth studies.
Three summary tables preceding the main report text highlight the essential findings of the analysis. The first presents an overview of Timor-Leste’s performance in each of a number of key sectors or technical areas, and a second identifies Timor-Leste’s strengths and weaknesses in these sectors and technical areas. And a third table outlines priorities and core issues for Timor-Leste’s immediate economic recovery and longer-term development, again for each sector or technical area. In this context, “priorities” are meant to be the broad themes of Timor-Leste’s recovery and development, while “core issues” are the fundamental technical questions that must be resolved to achieve the priorities. The main text features more detailed explanations of both priorities and core issues.

The remainder of the report presents the most important results of the diagnostic analysis, in three sections: Economic and Conflict Recovery; Private Sector Enabling Environment; and Pro-Poor Growth Environment. Table 1-1 summarizes the topical coverage. The appendix provides a brief explanation of the criteria used for selecting indicators, the benchmarking methodology used, and a table showing the full set of indicators examined for this report.
Table 1-1 Topic Coverage
Economy and Conflict Recovery
Private Sector Enabling Environment
Pro-Poor Growth Environment
• Profile of Conflict and Recovery
• Postconflict Economic Growth
• Poverty and Inequality
• Economic Structure
• Demography and Environment
• Gender and Children
• Economic Stabilization and Government Capacity
• Business Environment
• Financial Sector
• External Sector
• Economic Infrastructure
• Health
• Education
• Employment and Workforce
• Agriculture
DATA QUALITY The breadth and quality of economic data collected for Timor-Leste are poor. The World Bank gave Timor-Leste a score of 36 percent on its 2007 Statistical Capacity Indicator Index, up from a score of 30 percent in 2006, yet well below all benchmarks (the LI-Asia median of 69.5 percent, Cape-Verde’s score of 58 percent, Fiji’s 52 percent, and Vanuatu’s 46 percent). The biggest problem in Timor-Leste is that of poor statistical practice. In 2006, Timor-Leste received a score of 10 percent, because it had a multitude of problems, including not subscribing to the IMF’s Special Data Dissemination Standard, using an old balance-of-payments system and old base year for calculating inflation, failing to consolidate government accounts, and failing to report to UNESCO in a timely fashion. Though data availability was somewhat better, at 40 percent, it remains low in absolute terms and reflects the fact that no recent poverty or agriculture survey has been conducted.
These data problems complicate the analysis in several places. Nevertheless, we have strived to identify and incorporate as many updated sources of information as practical in our analysis. In the end, the data set was adequate for evaluating and highlighting a broad range of trends and issues in Timor-Leste’s postconflict recovery.


2. Economy and Conflict Recovery Overview This section reviews basic indicators and information on Timor-Leste’s economic status: macroeconomic performance, poverty and inequality, economic structure, demographic and environmental conditions, and gender equity. Because conflict and the need to recover from conflict are integral to Timor-Leste’s economic growth and development, this review begins with a broad profile of conflict conditions and trends in postconflict recovery, and when conflict or postconflict recovery factors play an explicit role in defining the economic circumstances or economic challenges that Timor-Leste faces, these conflict-related impacts are highlighted.
PROFILE OF CONFLICT AND RECOVERY One of the world’s youngest countries, Timor-Leste was born in conflict and has suffered from outbreaks of violence and civil unrest throughout its brief history (see Exhibit 2-1). Timor-Leste’s economy and society still feel the effects of the month of bloody rampage that followed the independence referendum of August 1999, in which armed Timorese anti-independence militias supported by the Indonesian military wreaked death and destruction throughout East Timor. The post-referendum mayhem caused enormous damage. More than 1,000 people were killed, and about 300,000 people were displaced, many forced to flee as refugees to West Timor in Indonesia. The violence laid waste to the capital, Dili, and destroyed the bulk of the new nation’s infrastructure—homes and schools, water supply and irrigation systems, and virtually the entire national power grid. By some estimates, 70 percent of the nation’s capital stock was destroyed.4
A UN mission –UN Integrated Mission in Timor-Leste (UNMIT)—has been deployed to assist in policing and democratic institution-building. UNMIT’s mandate lasts until February 2008 but may be extended. In any event, the burden of recovery is daunting: reconstruction and upgrade of infrastructure devastated in past violence is a high priority, and jumpstarting the economy to give Timor-Leste’s population concrete evidence of development progress is imperative. And, although Timor-Leste has had a successful and relatively peaceful round of elections in 2007, sporadic violence still flares up, making security precarious and a lingering drag on recovery. Moreover, the February 2008 attacks on the president and prime minister, which fortunately have not sparked violence, are a harsh reminder that Timor-Leste has tremendous strides still to make in securing peace and stability.
4 International Monetary Fund, Democratic Republic of Timor-Leste: Selected Issues and Statistical Appendix, IMF Country Report 07/86, February 2007, 3.

6 T I M O R - L E S T E E C O N O M I C R E C O V E R Y A S S E S S M E N T
Exhibit 1-1 Chronology of Timor-Leste’s Long-Term Political Strife and Conflict
1974. Portugal’s antifascist revolution leads to promise to free colonies and grant of freedom to form political parties. Timorese Democratic Union (UDT) and Revolutionary Front for an Independent East Timor (FRETILIN) are founded and join in coalition to prepare for independence.
August–November 1975. Supported by Indonesian government, UDT stages coup. Portuguese flee, but FRETILIN defeats UDT and declares Republica Democrática de Timor-Leste (RDTL) independent from Portugal.
December 1975. Indonesian army invades and annexes East Timor, killing an estimated 60,000 people.
1976–1999. Indonesia occupies East Timor. East Timorese strongly oppose Indonesian rule. These years are characterized by armed Timorese guerilla resistance and brutal Indonesian repression. As many as 200,000 people die in the conflict. Instability reinforces persistent and widespread poverty.
May 1999.Indonesia agrees to allow a referendum on independence from Indonesia under UN auspices. Anti-independence groups begin acts of intimidation.
August 30, 1999. An estimated 99 percent of the electorate of 450,000 Timorese participates in the referendum; nearly 79 percent favor independence.
September 1999. Anti-independence militias backed by the Indonesian military carry out a campaign of terror in retribution for the vote for independence, causing the death of over 1,400 people, the flight of an estimated 300,000 refugees to West Timor, the devastation of homes and farms, and demolition of infrastructure throughout East Timor. Australian-led international peacekeepers—International Force for East Timor—arrive, quelling violence and reestablishing order.
October 1999–May 2002. UN Transitional Administration in East Timor (UNTAET), with military, police, and civilian development and humanitarian experts, maintains peace and administers the country in preparation for independence. Elections are held for Parliament (August 2001) and president (April 2002). FRETILIN Secretary General Mari Alkatiri is elected prime minister, and rival and former guerilla chief Xanana Gusmão is elected president.
May 20, 2002. Democratic Republic of Timor-Leste is declared an independent nation, and UNTAET relinquishes authority. Timor-Leste’s leaders agree to presence of UN Mission in Support of East Timor (UNMISET) to help the new government and civil service.
May 2002–May 2005. UNMISET military, police, and civilian technical personnel support Timor-Leste’s government and administration. Local elections are held throughout Timor-Leste. Sporadic protests and riots and occasional incursions by anti-independence militias from Indonesian West Timor demonstrate continuing disaffection and unresolved political disputes. Although government institutions remain weak, UNMISET mandate ends and peacekeepers depart.
May 2005–August 2006. UN Office in Timor-Leste (UNOTIL), a small political mission, remains, providing modest numbers of police and military advisers.
February–August 2006. Allegations in the Timor-Leste army of discrimination by senior officers from eastern districts against personnel from western districts lead to the dismissal of nearly half of soldiers. Violent protests and full-scale conflict pit dissident military, national police, and civilians against the army. Property destruction, 37 deaths, and displacement of 150,000 people to internal refugee camps result. Prime Minister Alkatiri is forced out and is replaced by Nobel laureate José Ramos-Horta. Government-requested Australian peacekeepers restore order. An insurgency, led by former police major Alfredo Reinado, continues.
August 2006–Present. UNOTIL is rolled into new UN Integrated Mission in Timor-Leste (UNMIT) with mandate until February 2008 to police; provide institution-building to national police, army, and civil administration; and support elections for president and Parliament in May and June 2007. Ramos-Horta wins presidency and Gusmão becomes prime minister. Ruling coalition excludes FRETILIN despite its plurality of seats. Security continues to be precarious, with occasional gang and factional violence. An estimated 100,000 remain in internally displaced person camps.
February 2008. Dissident forces attempt to assassinate President Ramos-Horta and Prime Minister Gusmão. Gusmão is unhurt, but Ramos-Horta is injured, and rebel leader Reinado is killed. A state of emergency is declared.
P R I V A T E S E C T O R E N A B L I N G E N V I R O N M E N T 7
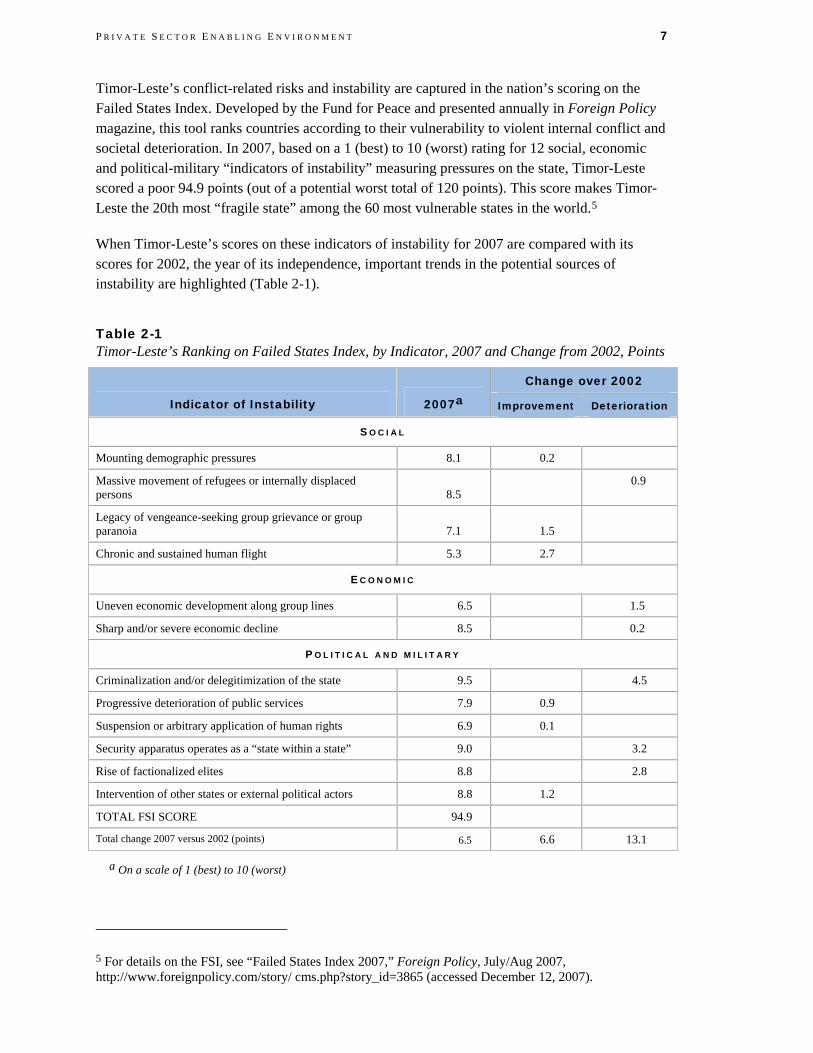
Timor-Leste’s conflict-related risks and instability are captured in the nation’s scoring on the Failed States Index. Developed by the Fund for Peace and presented annually in Foreign Policy magazine, this tool ranks countries according to their vulnerability to violent internal conflict and societal deterioration. In 2007, based on a 1 (best) to 10 (worst) rating for 12 social, economic and political-military “indicators of instability” measuring pressures on the state, Timor-Leste scored a poor 94.9 points (out of a potential worst total of 120 points). This score makes Timor-Leste the 20th most “fragile state” among the 60 most vulnerable states in the world.5
When Timor-Leste’s scores on these indicators of instability for 2007 are compared with its scores for 2002, the year of its independence, important trends in the potential sources of instability are highlighted (Table 2-1).
Table 2-1 Timor-Leste’s Ranking on Failed States Index, by Indicator, 2007 and Change from 2002, Points
Change over 2002
Indicator of Instability 2007a Improvement Deterioration
S O C I A L
Mounting demographic pressures 8.1 0.2
Massive movement of refugees or internally displaced persons 8.5
0.9
Legacy of vengeance-seeking group grievance or group paranoia 7.1 1.5
Chronic and sustained human flight 5.3 2.7
E C O N O M I C
Uneven economic development along group lines 6.5 1.5
Sharp and/or severe economic decline 8.5 0.2
P O L I T I C A L A N D M I L I T A R Y
Criminalization and/or delegitimization of the state 9.5 4.5
Progressive deterioration of public services 7.9 0.9
Suspension or arbitrary application of human rights 6.9 0.1
Security apparatus operates as a “state within a state” 9.0 3.2
Rise of factionalized elites 8.8 2.8
Intervention of other states or external political actors 8.8 1.2
TOTAL FSI SCORE 94.9
Total change 2007 versus 2002 (points) 6.5 6.6 13.1
a On a scale of 1 (best) to 10 (worst)
5 For details on the FSI, see “Failed States Index 2007,” Foreign Policy, July/Aug 2007, http://www.foreignpolicy.com/story/ cms.php?story_id=3865 (accessed December 12, 2007).

8 T I M O R - L E S T E E C O N O M I C R E C O V E R Y A S S E S S M E N T
In the past five years, for 6 of the 12 instability indicators, pressures have intensified for Timor-Leste, and quite seriously so for 5 of the indicators—legitimacy of the state, security apparatus, fractionalized elites, uneven development and refugees and displaced persons. On the positive side, human flight (emigration), external influence, group grievances, and public services have diminished as potential sources of instability. Nevertheless, on the 1-to-10 scale, on which higher scores signify greater pressure and instability, Timor-Leste still earns relatively poor rankings of 7 or above for three-quarters of the instability indicators. This underlines the urgency of the need for intensive action on institutional and economic issues to accelerate recovery.
To give further insight into Timor-Leste’s Failed States Index ratings, pressure on the state can be measured against institutional capacity to respond. The latter is estimated in an index of the strength of core institutions.6 Timor-Leste received 5 points for core institutions in 2002 and 6 points in 2007. This relationship is depicted for Timor-Leste and four other conflict or postconflict comparator countries (Haiti, Sri Lanka, Liberia and Sierra Leone) in Figure 2-1.
Figure 2-1 Pressure on the State and Capacity to Cope—Timor-Leste and other Postconflict Comparators
The risk of renewed violence in Timor-Leste is high.
2007
2002
2002
2007
2002
20072007
20022002
2007
75
80
85
90
95
100
105
110
115
120
0 5 10 15 20 25
Capacity to Cope (State Institutions)
Pres
sure
on
the
Stat
e (F
SI In
dex)
Timor-Leste Haiti Sri Lanka Liberia Sierra Leone
Source: Fund for Peace, Failed States Index CAS code: C11P1
Here, pressure on the state (Failed States Index) is plotted on the X axis, with a higher score indicating greater instability, and strength of institutions is plotted on the Y axis, with higher scores indicating stronger core institutions and capacity to respond. Because scores are computed for 2002 and 2007, relative levels and trends can be simultaneously defined for Timor-Leste and
6 Fund for Peace computes this index by analyzing leadership, police, military, civil service and judiciary capacity, applying a rating to each element on a 1(worst) to 5 (best) scale and summing the result. Timor-Leste received a total of 5 points for core institutions in 2002 and 6 points in 2007.

P R I V A T E S E C T O R E N A B L I N G E N V I R O N M E N T 9
the comparator countries. Positions in and/or movement toward the northwest quadrant of the figure—meaning increasing instability and deteriorating institutional capacity to respond—suggest elevated or rising risk of state failure.
On this basis, Timor-Leste appears a bit less prone to fail as a state than Haiti, but more prone than the other three comparators. Timor-Leste gains from modest improvement in state institutions, notably represented by an elected government initially taking over from the transitional UN administration, and by peaceful completion of 2007’s election cycle. But pressures on the state have at the same time clearly increased, and contrary to the ideal for a postconflict country, Timor-Leste’s ability to cope may be deteriorating. State institutions are still too weak to function without extensive outside support. Institutional capacity appears to be developing less rapidly than the rise in social, economic, and political pressures facing the country. All of this creates a difficult and uncertain environment for growth and development.
POSTCONFLICT ECONOMIC GROWTH
Performance Review Timor-Leste’s fragility and volatile security situation has directly and adversely affected economic growth (Exhibit 2-2). This is evident in the movement in nonpetroleum GDP in the past decade (Figure 2-2).
Exhibit 2-2 Conflict and Economic Growth
Conflict has a profound impact on economic performance. According to one influential study, civil war reduces a country’s level of GDP per capita at a rate of 2.2 percent per annum relative to a projected without-conflict baseline trend.7 Such per capita income impacts are most pronounced in regions directly affected by instability.8 Of course, by destroying lives and property, conflict directly reduces productivity and performance.
It also dampens economic growth by diverting resources to nonproductive military activities, impeding investment in physical and human capital, and impairing fiscal capacity for other essential government expenditures, often also creating a debt burden to encumber future budgets.9 Moreover, the reverse is also true: research shows that low income levels and slow economic growth also make countries prone to conflict.10
In the wake of post-referendum violence, real nonpetroleum GDP plummeted, dropping by more than 30 percent for 1999. But in the next two years, with an enormous build-up of donor spending
7 Paul Collier, On the Economic Consequences of Civil War, Oxford Economic Papers 51 (1999), 168–83. http://www.worldbank.org/research /conflict/papers/cw-consq.pdf.
8 2Alberto Abadie and Javier Gardeazabal, The Economic Costs of Conflict: A Case Study of the Basque Country, July 2002. http://ksghome.harvard.edu/~aabadie/ecc.pdf
9 Daniel Mejia, Conflict and Economic Growth: A Survey of the Theoretical Links, Webpondo, September 2004. http://www.webpondo.org/filesoctdic2004/conflict_growth.pdf
10 Paul Collier, The Bottom Billion, Why the Poorest Countries are Failing and What Can Be Done About It, London: Oxford University Press, 2007, 32–36.

10 T I M O R - L E S T E E C O N O M I C R E C O V E R Y A S S E S S M E N T
in the run-up to Timor-Leste’s independence—operations for UNTAET cost $477 million—real nonpetroleum GDP recovered rapidly and posted two annual gains of more than15 percent. After independence, as the UN and donors scaled down activities, real nonpetroleum GDP again slumped sharply, contracting by more than 6 percent in both 2002 and 2003. Macroeconomic conditions then began to improve again, and the security situation stabilized somewhat, so that nonpetroleum activity in Timor-Leste’s agriculture and public sector started picking up. In 2004 and 2005 a modest recovery was underway, with expansion in real nonpetroleum GDP.
Figure 2-2 Real (Nonpetroleum) GDP Growth
Real nonpetroleum GDP growth has been stagnant at best. Time Series Comparison to Other Countries, Most Recent Year Global Standing
-8.0
-6.0
-4.0
-2.0
0.0
2.0
4.0
2002 2003 2004 2005 2006
Growth Index Year Value
2002 -6.7 2003 -6.2 2004 0.3 2005 2.3 2006 -2.9
Summary for 2001–2005 Five-year growth average
-2.6
Trend growth rate .
8.2 6.0 6.5 3.6 5.5-2.9
-4
-2
0
2
4
6
8
10
Timor-Leste LI-Asia LI Cape Verde Fiji Vanuatu
Per
cent
Cha
nge
Highest-five average
18.9
-2.5TLS
Lowest-five average
Source: IMF World Economic Outlook Database CAS code: C11P6
This recovery, however, was short-lived. With the return to conflict in early and mid-2006 and a period of severe droughts, economic activity throughout Timor-Leste ground once more to a halt, both in Dili and in the countryside, where agriculture and transportation were severely disrupted (e.g., coffee production, the main nonpetroleum export commodity, declined by 20 percent11) and real nonpetroleum GDP dropped by 2.9 percent for the year. This meant that between 2002 and 2006, the nonpetroleum economy declined by more than 5 percent in real terms. The trend is fortunately likely to reverse again in 2007: assuming that widespread violence has come to an end, and that sound macroeconomic policies will prevail, the IMF projects significant recovery of nonpetroleum output for the year. Even so, at best, Timor-Leste’s economic growth record since independence will remain one of stagnation.
11 Much of this decline can also be attributed to the 2006 drought. With better weather conditions, coffee and other agricultural production is expected to grow substantially this year, having a significant economic impact. Data source: IMF, Democratic Republic of Timor-Leste: 2006 Article IV Consultation – Staff Report, February 2007, 5.

P R I V A T E S E C T O R E N A B L I N G E N V I R O N M E N T 11
Timor-Leste’s no-growth performance for nonpetroleum GDP is in stark contrast to the experience of comparators. In 2006, for example, the median annual real GDP growth rate was 8.2 percent for low-income Asian countries (LI-Asia) and 6 percent for low-income countries as a group (LI). Timor-Leste’s growth rate was also significantly below that of Cape Verde (6.5 percent), Fiji (3.6 percent), and Vanuatu (5.5 percent) in the same year. As a result, Timor-Leste remains one of the poorest nations in the world, with a per capita GDP of only $1,670 (in purchasing power parity terms [PPP]) in 2006.12 At this level, Timor-Leste’s per capita income is also lower than the PPP medians for LI ($1,752) and LI-Asia ($2,741) and is considerably below the PPP per capita incomes of Cape Verde ($7,344), Fiji ($6,120), and Vanuatu ($3,514).
Although the above discussion focuses on nonpetroleum GDP growth, Timor-Leste is now a petroleum-producing country (see Economic Structure, p. 15). As of 2004, pumping of natural gas began in the Timor Sea, with substantial revenues derived from the operation flowing to Timor-Leste in an income stream now amounting to about $100 million per month. These moneys are deposited in a Petroleum Fund (Exhibit 2-3), whose total assets in a little over a year (September 2006) had reached 240 percent of nonpetroleum GDP.13 Although such revenues are critical to Timor-Leste’s economic future, the petroleum sector is still unlikely to generate employment or business opportunities for the bulk of Timor-Leste’s workforce or private enterprise. Hence, continued emphasis on the nonpetroleum economy, where the near totality of Timor-Leste’s households work and live, is essential to a sustainable long-term rise in living standards.
Exhibit 2-3 Petroleum Fund
Timor-Leste established a Petroleum Fund in 2005. The fund’s operational management is the responsibility of the Banking and Payments Authority. All oil and gas revenue—transfer of tax revenues and royalty income from petroleum production—flows into the fund, the assets of which are conservatively invested in global financial markets to ensure intergenerational equity and
fiscal sustainability. In just over a year, the Petroleum Fund savings expanded to $847 million, or 240 percent of Nonpetroleum GDP. The revenue stream will probably continue to increase. Fund resources ensure a “sustainable” (in perpetuity) budget spending of more than $300 million per year.14
In the nonpetroleum economy, the fundamental economic performance issue is lack of investment. Despite postconflict recovery requirements for large-scale infrastructure
12 In current U.S. dollar terms, non-petroleum per capita GDP is estimated at $351 for 2006. With the impact of oil and gas revenues, per capita gross national income (GNI) was about $835 in 2006. International Finance Corporation/Asian Development Bank, Economic and Social Development Brief, August 2007, 17. 13 IMF, Timor-Leste 2006 Article IV Consultation – Staff Report, 9.
14 IMF, Democratic Republic of Timor-Leste: 2006 Article IV Consultation—Staff Report, February 2007, 9.
World Bank Group and Asian Development Bank, Economic and Social Development Brief, August 2007, 15.

12 T I M O R - L E S T E E C O N O M I C R E C O V E R Y A S S E S S M E N T
reconstruction and intensive human capital development, Timor-Leste’s investment performance has been inadequate (Figure 2-3). First, present levels of capital formation are very low. For 2006, Timor-Leste’s gross fixed investment was equivalent to only about 17.1 percent of nonpetroleum GDP. This is quite modest against international benchmark ratios: the present medians for LI-Asia (28.8 percent) and LI (20.1 percent), or Cape Verde’s 2005 level of 37.9 percent. (Recent data for other comparators are lacking.) Second, contrary to postconflict recovery needs, investment is trending down. Gross fixed investment for Timor-Leste has been in steady decline since 2002, when it was 28 percent of nonpetroleum GDP—and the fact that the nonpetroleum GDP computation base was higher in 2002 than in 2006 makes the deterioration of this ratio even more severe.
Figure 2-3 Gross Fixed Investment as a Percentage of Nonpetroleum GDP
Low and declining levels of capital formation hamper economic growth. Time Series Comparison to Other Countries, Most Recent Year Global Standing
0.05.0
10.015.020.025.030.0
2002 2003 2004 2005 2006
Year Value 2002 28.0 2003 23.1 2004 17.3 2005 17.2 2006 17.1 Summary for 2001–2005
Five year average 20.6 Trend growth rate -12.8
17.1 28.8 20.1 37.9 11.5 20.20
5
10
15
20
25
30
35
40
Timor-Leste LI-Asia LI Cape Verde Fiji Vanuatu
Per
cent
GD
P
Highest-five average
49.7
7.9
TLS
Lowest-five average
Source: IMF Article IV Statistical Appendix CAS code: C11S1
Potential Conflict Recovery Priorities Reversing Timor-Leste’s weak investment performance appears to be the key to postconflict economic recovery and growth. Significantly increased capital formation will jumpstart the expansion of economic activity generally and upgrade infrastructure, plant, and equipment and workforce development, yielding important improvements in productivity to raise incomes and living standards. IMF and Government of Timor-Leste analysts suggest that investment must approximately double to between 30 percent and 40 percent of nonpetroleum GDP. At such standards, and with reasonable assumptions about the productivity of future investment, growth

P R I V A T E S E C T O R E N A B L I N G E N V I R O N M E N T 13
rates of nonpetroleum GDP of 7–8 percent per year could be possible, the target pace that the government believes necessary to dramatically reduce poverty.15
For the near to medium term, the overwhelming bulk of such increases in investment will have to come from the public sector. Timor-Leste’s private sector—whose gross fixed investment now amounts to less than 3 percent of nonpetroleum GDP—is too small and too weak to play a leading role.16 Public investment would take the form of capital expenditures for basic infrastructure (power, water, roads), schools, and hospitals. Unlike in most postconflict situations, Timor-Leste, with its sizable and dependable flow of petroleum revenues, possesses the resources to finance the kind of public investment program required. Hence, to meet investment priorities for postconflict recovery and growth, the first core issue is not availability of financing, but rather ability of the public sector to execute its capital programs effectively (see Economic Stabilization and Government Capacity, p. 23). Over time, as the private economy grows and develops, the private sector might be expected to take on an increasing share of the nation’s gross fixed investment. But for this to happen, Timor-Leste’s business-enabling environment—one of the least favorable in the world—must be radically reformed (see Business Environment, p. 27). A second core issue in pursuing investment priorities for postconflict recovery and growth is therefore rapid implementation of reforms to encourage investment and entrepreneurship.
POVERTY AND INEQUALITY
Performance Review Widespread poverty and income inequality are multidimensional conditions linked to a lack of security, education, health, income, and employment opportunities. Moreover, high levels of poverty and extreme income inequality can be prime motivators in popular grievances, political unrest, and outright civil strife.17 For Timor-Leste, one of the world’s poorest nations, widespread poverty and inequality pose continuing threats to political and economic stability and complicate postconflict recovery.
In 2004, the latest year for which data are available, an estimated 41.5 percent of the population was living under the national poverty line.18 This figure is not only extremely high in absolute terms but represents an increase in poverty of more than 2 percentage points in just three years. This trend no doubt reflects the decline in real nonpetroleum GDP that was occurring in those years and underlines the importance of growth in the nonpetroleum economy to achieve poverty reduction. Also worrisome is the persistent income inequality. According to the UN Human Development Report (2006), “the poorest two-fifths of the population account for less than 18%
15 IMF, Democratic Republic of Timor-Leste: Selected Issues and Statistical Appendix, IMF Country Report 07/86, February 2007, 2-12.
16 Ibid, 4. 17 Paul Collier, The Bottom Billion Why The Poorest Countries Are Failing And What Can be Done
About It, London: Oxford University Press, 2007, 19. 18 UNDP, Timor-Leste Human Development Report, 2006, 2. Notes that the income poverty line is set at
$0.55 per capita per day.

14 T I M O R - L E S T E E C O N O M I C R E C O V E R Y A S S E S S M E N T
of total expenditure while the richest two-fifths account for 66%.”19 Regional disparities in poverty are also significant; for example, income poverty in rural areas is acute, at about 46 percent, while income poverty in urban areas is 26 percent. The fact that more than 100,000 people still in Timor-Leste’s IDP camps intensify these challenges of poverty. And Timor-Leste’s high rates of population increase (see Demography and Environment, p. 18) each year add to the scale and urgency of the problem.
More than 80 percent of the population is employed in agriculture (see Economic Structure, p. 15), mostly in rural areas where subsistence farming is the foundation of economic activity. This makes the rural population highly susceptible to external shocks, such as drought, flooding, and political unrest (all of which obstruct the transportation of critical agriculture and food supplies). Not surprisingly then, food poverty is also a significant problem. The UN estimates that 64 percent of the population suffers from moderate to severe food insecurity (see Agriculture, p. 48).
On the UNDP Human Poverty Index (HPI), a composite measure of deprivation in three basic dimensions of human development—life expectancy, adult literacy and access to basic health services—Timor-Leste ranked 95 out of 108 developing countries, scoring 41.8 on a scale of 0 (no deprivation) to 100 (high incidence of deprivation). This score is better than the median for LI-Asia (65.0) and LI (75.5), but is far below the HPI scores of comparator economies Cape Verde, at 15.8; Fiji, at 21.2; or Vanuatu, at 24.6 (Figure 2-4).
Figure 2-4 Human Poverty Index
Despite huge oil wealth, Timor-Leste’s poverty situation remains grim. Comparison to Other Countries, Most Recent Year
24.6
75.5
15.8
21.2
65.0
41.8
0 10 20 30 40 50 60 70 80
Timor-Leste
LI-Asia
LI
Cape Verde
Fiji
Vanuatu
0 (no deprivation) - 100 (high deprivation)
Source: UNDP Human Development Report CAS code: C12P4
19 Ibid, 14.

P R I V A T E S E C T O R E N A B L I N G E N V I R O N M E N T 15
Potential Conflict Recovery Priorities Given the breadth and depth of poverty in Timor-Leste—especially in contrast to the nation’s rising oil and gas wealth—concerted and sustained efforts to reduce poverty are central to postconflict recovery. The government of Timor-Leste’s poverty reduction strategy, presented in its National Development Plan (2002) and Road Map and Stability Program (2003), focuses on poverty reduction through enhanced governance (state administrative structures, judiciary and security services), delivery of services targeted to the poor (health, education, food security, and market access), and job creation, particularly in agriculture and the private sector. Timor-Leste’s enormous oil and natural gas wealth provides resources to put this poverty reduction strategy in action. The core issue will be to design and implement investments and programs—particularly in basic services—that are truly pro-poor and reach marginalized and vulnerable groups. A range of approaches, possibly including emergency cash grants for refugees and the poorest households, may be part of the mix.
ECONOMIC STRUCTURE
Performance Review Timor-Leste is two economies operating alongside each other: the one a new, wealthy and rapidly expanding petroleum-based sector; and the other a very traditional, low-productivity, nonpetroleum rural sector. Structurally there is no linkage between them, but harnessing oil revenues to help transform the traditional economy is at the heart of postconflict recovery.
The petroleum sector is made up of offshore natural gas production by foreign operators in the Timor Sea. In 2006, income from this sector—royalties and transfers of tax revenues on oil and gas production—made up an estimated 58 percent of Timor-Leste’s gross national income (GNI)—$492 million of $847 million. Significant petroleum production began only in 2004, but the income it generates already exceeds the traditional economy’s total value of output ($356 million in 2006), and by 2011 is projected to account for nearly two-thirds of Timor-Leste’s GNI.20 Moreover, these petroleum sector numbers are based on projected activity from the one natural gas field currently in production (Bayu Undan). Exploitation of a new, larger field (Greater Sunrise) in which Timor-Leste shares revenue rights stands to increase Timor-Leste’s oil and gas revenues and hence GNI even more.
Quite distant from the petroleum sector, Timor-Leste’s traditional nonpetroleum economy broadly displays the structure typical of a low-income, rural sector-based developing country. Agriculture (including forestry and fisheries), which employs the bulk of the workforce, generates almost one-third of nonpetroleum economic activity. In 2006, Timor-Leste’s agriculture accounted for 32.2 percent of nonpetroleum GDP, a bit below but still in range of the LI median share for this sector (34.9 percent), but well above the median share of agriculture for LI-Asia (27.7 percent), or the proportion of GDP originating in agriculture for Cape Verde (6.8 percent), Fiji (15.8 percent), or Vanuatu (14.8 percent). Moreover, in Timor-Leste, agriculture’s share of nonpetroleum GDP has been increasing over time—by almost five points since 2002.
20 IMF, Timor-Leste 2006 Article IV Consultation – Staff Report, Tables 2 and 7.
16 T I M O R - L E S T E E C O N O M I C R E C O V E R Y A S S E S S M E N T
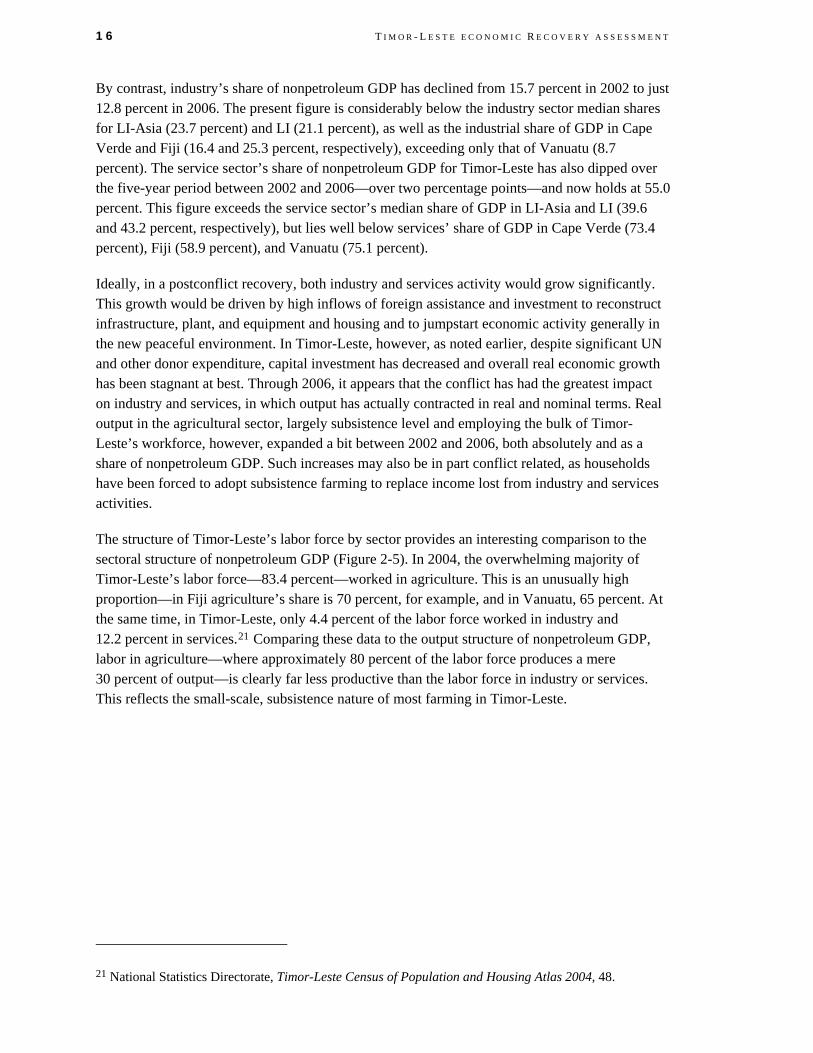
By contrast, industry’s share of nonpetroleum GDP has declined from 15.7 percent in 2002 to just 12.8 percent in 2006. The present figure is considerably below the industry sector median shares for LI-Asia (23.7 percent) and LI (21.1 percent), as well as the industrial share of GDP in Cape Verde and Fiji (16.4 and 25.3 percent, respectively), exceeding only that of Vanuatu (8.7 percent). The service sector’s share of nonpetroleum GDP for Timor-Leste has also dipped over the five-year period between 2002 and 2006—over two percentage points—and now holds at 55.0 percent. This figure exceeds the service sector’s median share of GDP in LI-Asia and LI (39.6 and 43.2 percent, respectively), but lies well below services’ share of GDP in Cape Verde (73.4 percent), Fiji (58.9 percent), and Vanuatu (75.1 percent).
Ideally, in a postconflict recovery, both industry and services activity would grow significantly. This growth would be driven by high inflows of foreign assistance and investment to reconstruct infrastructure, plant, and equipment and housing and to jumpstart economic activity generally in the new peaceful environment. In Timor-Leste, however, as noted earlier, despite significant UN and other donor expenditure, capital investment has decreased and overall real economic growth has been stagnant at best. Through 2006, it appears that the conflict has had the greatest impact on industry and services, in which output has actually contracted in real and nominal terms. Real output in the agricultural sector, largely subsistence level and employing the bulk of Timor-Leste’s workforce, however, expanded a bit between 2002 and 2006, both absolutely and as a share of nonpetroleum GDP. Such increases may also be in part conflict related, as households have been forced to adopt subsistence farming to replace income lost from industry and services activities.
The structure of Timor-Leste’s labor force by sector provides an interesting comparison to the sectoral structure of nonpetroleum GDP (Figure 2-5). In 2004, the overwhelming majority of Timor-Leste’s labor force—83.4 percent—worked in agriculture. This is an unusually high proportion—in Fiji agriculture’s share is 70 percent, for example, and in Vanuatu, 65 percent. At the same time, in Timor-Leste, only 4.4 percent of the labor force worked in industry and 12.2 percent in services.21 Comparing these data to the output structure of nonpetroleum GDP, labor in agriculture—where approximately 80 percent of the labor force produces a mere 30 percent of output—is clearly far less productive than the labor force in industry or services. This reflects the small-scale, subsistence nature of most farming in Timor-Leste.
21 National Statistics Directorate, Timor-Leste Census of Population and Housing Atlas 2004, 48.

P R I V A T E S E C T O R E N A B L I N G E N V I R O N M E N T 17
Figure 2-5 Structure of Timor-Leste’s Output and Employment for Nonpetroleum GDP, Most Recent Year
Agriculture employs the bulk of Timor-Leste’s workers, but productivity in this sector is much lower than in industry or services.
83.4
4.4
12.2
32.2
12.8
55.0
0
10
20
30
40
50
60
70
80
90
100
Agriculture Industry Services, etc.
Per
cent
of G
DP
Employment Output
Source: World Development Indicators CAS code: C13P1a-c, C13P2a-c
Potential Conflict Recovery Priorities Evolving sectoral trends in Timor-Leste’s economy appear to be contrary to what is needed for recovery, and indeed, for the nation’s long-term development. Large-scale reconstruction of infrastructure and housing and expansion of public services should be sharply increasing employment and output in the industry and services sectors. Such improved infrastructure and public services should also begin to enhance productivity in agriculture, so that output rises even while increasing numbers of farm workers shift to new jobs in industry and services. This transformation of the economy essentially represents the nation’s future development process. In this model of Timor-Leste’s postconflict recovery, growth, and development, the petroleum sector has a strategic role to play. It will not serve as a major source of demand for local labor, goods or services but will generate financing for the programs of reconstruction and public services that will begin to drive the desired economic transformation. The core issue—again—will be the government’s design and delivery of effective reconstruction initiatives and public services expansion. In the long term, equally important will be a second core issue of promoting strong linkages between Timor-Leste’s agricultural producers and its growing services and industry activities, so that a modern, integrated private sector can emerge as the engine of national economic development.

18 T I M O R - L E S T E E C O N O M I C R E C O V E R Y A S S E S S M E N T
DEMOGRAPHY AND ENVIRONMENT
Performance Review Demographic factors have major effects on security, poverty, growth potential, and labor markets, and comparative advantages in international trade and the quality of public services. Population pressures can also be related to heightened conflict and deteriorating environmental conditions.
Timor-Leste’s population numbers about one million people.22 Since independence the nation has faced especially strong demographic pressures. In 2006, the population was estimated to be growing at a rate of 3.3 percent. Although this figure is well below the peak of a 5.3 percent average annual growth experienced over the previous four years—the period of independence that encouraged the return of exiles and an expansion of families—it is still very high compared to benchmarks (Figure 2-6). For example, the median rates of population growth in 2005 for LI-Asia and LI were 2.0 percent and 2.2 percent, respectively. For Fiji, population growth in 2005 was as low as 0.8 percent. Underlying Timor-Leste’s rapid population growth is the nation’s total fertility rate—7.8 children per woman—the highest in the world.23
Figure 2-6 Population Growth Rate
Timor-Leste’s high population growth rate creates extreme demographic pressures.
Time Series Comparison to Other Countries, Most Recent Year Global Standing
0.02.04.06.08.0
10.012.014.0
2002 2003 2004 2005 2006
Year Value 2002 12.6 2003 2.0 2004 2.3 2005 6.3 2006 3.3 Summary for 2001–2005
Five year average 5.3 Trend growth rate -15.3
3.3 2.0 2.2 2.3 0.8 1.90.0
0.5
1.0
1.5
2.0
2.5
3.0
3.5
Timor-Leste LI-Asia LI Cape Verde Fiji Vanuatu
Per
cent
cha
nge
Highest-five average
4.4
-0.7
TLS
Lowest-five average
Source: World Development Indicators CAS code: C14P5
Because of high fertility and high growth rates, Timor-Leste’s population is young, and this creates relentless demographic challenges. First, relative to the size of its workforce, Timor-Leste
22 International Finance Corporation/Asian Development Bank, Economic and Social Development Brief, August 2007, 19. 23 UNICEF. Timor-Leste: At-a-glance Statistics (2005). http://www.unicef.org/infobycountry/Timorleste_statistics.html

P R I V A T E S E C T O R E N A B L I N G E N V I R O N M E N T 19
has large, rapidly increasing numbers of young people below working age (Figure 2-7). In 2004 (the latest year for which data are available), this youth dependency rate for Timor-Leste was 82, meaning that on average every 100 persons of working age (15–64 years old) were supporting 82 young people below the age of 15. This ratio was far above the LI-Asia and LI medians of about 38 and 43, respectively, or the rate for Fiji (49), and also exceeded the relatively high numbers for Cape Verde and Vanuatu (both about 70). The result is that unless general workforce productivity rises—contrary to Timor-Leste’s present situation (see Economic Structure, p. 15)—the burden on the working population of providing for its dependents at the household level and through tax-supported schools and health care becomes more difficult. Second, the youth bulge, or share of the total population aged between 15 and 24, is also worryingly high. It is estimated that in 2004, about 43.2 percent of the population was aged between 15 and 24.24 Because the youth bulge represents the nation’s future workforce entrants, unless opportunities for employment and training are available, Timor-Leste faces a growing pool of disenfranchised youth, ready candidates for renewed conflict.
Figure 2-7 Youth Dependency Rate
The working-age population has a large burden of youth dependents. Comparison to Other Countries, Most Recent Year Global Standing
81.6 37.7 42.6 70.4 49.2 70.40
10
20
30
40
50
60
70
80
90
Timor-Leste LI-Asia LI Cape Verde Fiji Vanuatu
Rat
io, Y
outh
: Wor
king
Age
Pop
ulat
ion
Highest-five average
81.6
48.5
TLS
Lowest-five average
Source: World Development Indicators CAS code: C14P2
The pressure to educate and employ Timor-Leste’s population is all the more urgent against the background of the nation’s literacy levels. Timor-Leste’s adult literacy rate, a proxy for adult education levels and an insight into productivity issues, was just 45.8 percent in 2004, well below the LI-Asia median of 61.0 percent, not to mention Cape Verde’s 75.7 percent.
24 Nathan Associates, based on National Census Directorate. General Population Census of Timor-Leste 2004, Population Projections 2004 – 2050: Analysis of Census Results, 19.

20 T I M O R - L E S T E E C O N O M I C R E C O V E R Y A S S E S S M E N T
Because of continued safety concerns and the lack of economic opportunity in urban areas, rural migrants have not flooded to the cities, as is often the case in postconflict countries. In 2005, 26.5 percent of Timor-Leste’s population lived in urban areas, on par with median urbanization rates for LI-Asia (25.1 percent) and LI (30.6 percent), and with Vanuatu’s urbanization (23.5 percent), but well below rates for Cape Verde (57.3 percent) and Fiji (50.8 percent). As a result, demographic pressures are growing more rapidly in rural areas and are increasingly straining Timor-Leste’s weak agricultural economy (see Agriculture, p. 48). Timor-Leste’s rural population density in 2003 was 534 persons per sq. km. of arable land, much above the median densities for LI-Asia (475) and LI (421). This rural population density was also higher than those of Cape Verde (465) and Fiji (209), but much lower than Vanuatu’s rate (785).
With nearly three-quarters of Timor-Leste’s population living in rural areas, and with high population growth rates, rural population densities can only increase. This puts immense pressure on environmental resources. For example, as a result of slash-and-burn agriculture and harvesting of fuel wood, it is estimated that Timor-Leste is losing 1.2 percent of its forest cover per annum, one of the highest rates of deforestation in the region.25 This contributes to general environmental destruction by causing severe soil erosion and degradation of water bodies. Such environmental impacts also lead to landslides and flash flooding, which damage Timor-Leste’s already fragile road infrastructure (see Economic Infrastructure, p. 36).
Potential Conflict Recovery Priorities Demographic pressures emanating from Timor-Leste’s very young and rapidly growing population pose enormous challenges. In the short run, for postconflict recovery, the first core issue must be addressing the needs of the youth for education, training, and jobs to connect young people with the new society and economy. A lack of action means risking a rise in youth involvement in crime and politicized gang violence of the kind that characterized the events of April–May 2006. Male youth are particularly at risk. In view of the pressure of rural population on land and forest resources as a possible source of continuing social tension and conflict, a second core issue is to raise productivity in the rural sector and devise systems for effective management of the environment. Finally, the overarching long-term core demographic issue is the urgent need to find ways to reduce female fertility dramatically and curtail population growth. Increasing economic growth and improving gender equity will be key in this regard.
GENDER AND CHILDREN
Performance Review Gender equity promotes economic growth by ensuring that all citizens have the opportunity to develop and apply their full productive capacities. Timor-Leste performs fairly well on most basic indicators of gender equity, with the notable exception of female labor force participation.
25 International Finance Corporation/Asian Development Bank, Economic and Social Development Brief, August 2007, 23.

P R I V A T E S E C T O R E N A B L I N G E N V I R O N M E N T 21
Life expectancy at birth is a fundamental indicator of health conditions. In Timor-Leste, life expectancy is relatively low for both males and females—average life expectancy at birth (2005) is calculated at 57.8 years for women and 55.6 years for men. Although these rates are somewhat better than LI median rates of female and male life expectancy at birth (56.8 and 53.6 years, respectively), they are still well below median female and male life expectancy rates at birth in LI-Asia (64.2 and 62.2 years, respectively) and all other comparators. Such low numbers are a reflection of the poor living and health status conditions generally in Timor-Leste (see Health, p. 41).
In general, women outlive men, and in Timor-Leste, females outlive males by about 2.2 years on average. This spread is consistent with the median differential between female and male life expectancy for LI-Asia (2.0 years) and for LI (3.2 years). Nonetheless, it is significantly below the larger differentials in Cape Verde (6.2 years), Fiji (4.5 years), and Vanuatu (3.7 years).
Relative gross enrollment rates are another mark of gender equity (Figure 2-8). In Timor-Leste, gross enrollment rates at all levels of schooling are 100 percent for males and 97 percent for females (2005). This 3 percentage point differential is much smaller than the median equivalent measure in LI-Asia (8.5 points) or in LI in general (6.0 points). Moreover, the country’s absolute performance in gross enrollment for both males and females is encouraging—an indicator of child welfare. In Timor-Leste, current gross enrollment rates are nearly double the LI medians (52.5 percent and 46.5 percent, respectively) and much superior to the medians for LI-Asia (63.5 percent and 55.0 percent respectively) and the rates for Cape Verde (67.0 percent for both genders), Fiji (74.0 and 76.0 percent, respectively), and Vanuatu (66.0 and 61.0 percent, respectively).
The relatively high present gross enrollment rate for females is clearly an achievement for Timor-Leste. Current patterns of female gross enrollment in Timor-Leste represent a reversal of past disadvantages and disparities in the availability of education for women relative to men—in the 2004 census, the female illiteracy rate (58.2 percent) exceeded the male illiteracy rate (50.8 percent) by 8 points.26 Of course, to be effective, positive gross female enrollment numbers must also be matched by strong female persistence-in-school rates as well.
Finally, as in most developing countries, in Timor-Leste, a significant gender disparity exists in labor force participation. In 2004, 69.0 percent of working-age males and just 52.0 percent of working-age females were actively engaged in the labor force—a 17 percentage point differential. Interestingly, this gender differential is much smaller than the LI-Asia median (26.8 percentage points), and the differentials for Cape Verde (41.4 points) and Fiji (28.4 points). Nonetheless, a 17 percentage points gender differential in Timor-Leste in labor force participation signifies a serious constraint to realizing the country’s productive potential.
26 National Statistics Directorate, Timor-Leste Census of Population and Housing Atlas 2004, 72.

22 T I M O R - L E S T E E C O N O M I C R E C O V E R Y A S S E S S M E N T
Figure 2-8 Male and Female Gross Enrollment Rates, All Levels
The gender gap in education is small in Timor-Leste. Comparison to Other Countries, Most Recent Year
100.0 63.5 52.5 67.0 74.0 66.097.0 55.0 46.5 67.0 76.0 61.00
20
40
60
80
100
120
Timor-Leste LI-Asia LI Cape Verde Fiji Vanuatu
Per
cent
Gross Enrollment Rate, All Levels of Education, MaleGross Enrollment Rate, All Levels of Education, Female
Source: IFC and ADB Economic and Social Development Brief, 2007 CAS code: C15P3a-b
Potential Conflict Recovery Priorities On a national average basis, Timor-Leste scores fairly well on most of the principal international standards of gender equity, at least relative to median performance for comparator LI-Asia and LI country groupings. There is no doubt, however, that significant progress remains to be achieved to strengthen the status of women and the protection of children. For example, observers emphasize that gender-based violence is the most reported crime in Timor-Leste, but is often treated as a domestic matter and is not prosecuted. Furthermore, teenage fertility, a sign of low female status in society and a source of gender inequality, is rather high—59.2 live births per 1,000 females in the 15–19 year age group. This national average is below the highest levels globally—Venezuela (88) and El Salvador (108)—but is still troubling, and includes areas (i.e., subdistricts in Covalima or Manatuto districts) that have teenage fertility equivalent to the global peaks. And in postconflict recovery, Timor-Leste also faces unique problems: in the upheavals that have created masses of IDPs, women and children are particularly vulnerable to abuse, violence, and impoverishment from loss of livelihood. For all these reasons, core issues in postconflict recovery for gender and children are likely to revolve around targeted assistance in livelihood development and protection for the poorest women; enrolling—and retaining—girls at all school levels; and vastly expanding female workforce training and job creation.

3. Private Sector Enabling Environment The state of a country’s enabling environment is an important determinant of private sector development, which in turn is essential for achieving rapid and sustained economic growth. This section reviews key indicators of the status and health of the enabling environment for Timor-Leste, including macroeconomic stability and related fiscal and monetary policy execution, institutional environment for doing business, the state of financial sector development, external sector integration with the global economy, and economic infrastructure. International experience shows that in conflict and postconflict economies, enabling environments generally tend to be weak and are characterized by rigid and outdated institutions, policies, and practices. Enabling environment reform is therefore often in order for economic expansion to take hold and recovery to advance.
ECONOMIC STABILIZATION AND GOVERNMENT CAPACITY
Performance Review Governments’ fiscal and monetary policies are key instruments for achieving macroeconomic stability. One of the main concerns for postconflict economies is to ensure capacity in the government to maintain low and stable inflation and establish a sustainable fiscal balance. Since independence, Timor-Leste has fairly consistently managed to attain macroeconomic stability. This can be attributed to the country’s growing oil revenues that provide a fiscal cushion and to adoption of the U.S. dollar as Timor-Leste’s official currency, an arrangement that provides a solid monetary and exchange rate foundation for the economy. Nevertheless, the government still lacks the capacity to harness Timor-Leste’s newfound wealth to deliver critical services to support nonpetroleum economic growth that reduces poverty and stimulates the private sector.
The clearest sign of macroeconomic stability is a consistent, low rate of inflation. Following the advice of international donors, Timor-Leste decided to forego opportunities for a sovereign currency and the exercise of an independent monetary policy, instead embracing the U.S. dollar as legal tender. The decision appears to have paid off. From an average annual rate of price increase of more than 60 percent in 2000, inflation has remained in the single digits in the past six years, and Timor-Leste has managed to avert the problem of rapidly rising price levels that often plagues postconflict economies. In 2006, inflation in Timor-Leste was just 3.9 percent, well below the LI-Asia median of 6.3 percent, the LI median of 7.7 percent, and Cape Verde’s rate of

24 T I M O R - L E S T E E C O N O M I C R E C O V E R Y A S S E S S M E N T
5.4 percent. Inflation was still somewhat higher than in Fiji (2.5 percent) or Vanuatu (1.6 percent).
Timor-Leste’s healthy fiscal position also has contributed to the relative macroeconomic stability of the economy. In 2006, the overall budget surplus, including grants, reached a remarkable 111.0 percent of nonpetroleum GDP. This was in sharp contrast to the deficits that prevailed in LI-Asia (-2.4 percent), Cape Verde (-5.1 percent in 2005) and Fiji (-3.6 percent in 2005). High fiscal surpluses are a direct result of Timor-Leste’s oil revenue windfall. With this oil income, government revenues have skyrocketed since 2004, reaching a level equivalent to 172.0 percent of nonpetroleum GDP in 2006. Moreover, revenues are likely to expand even more when the new Greater Sunrise oil field comes on tap in 2013 (see Economic Infrastructure, p. 36). These revenue streams are central to economic recovery in Timor-Leste, allowing the government to invest in sizable infrastructure and employment-generation programs, even as foreign aid declines.
Figure 3-1 Government Revenue, as a Percentage of (Nonpetroleum) GDP
Government revenue has shot up extraordinarily due to inflows of oil income and is expected to increase further in the near future.
Time Series Comparison to Other Countries, Most Recent Year Global Standing
0.0
50.0
100.0
150.0
200.0
2002 2003 2004 2005 2006
Year Value 2002 24.0 2003 31.0 2004 98.0 2005 137.0 2006 172.0 Summary for 2001–2005 Five year average 92.4 Trend growth rate 54.2
172.0 24.1 19.80
20
40
60
80
100
120
140
160
180
200
Timor-Leste Cape Verde Vanuatu
Per
cent
of G
DP
Highest-five average
46.4
8.7
TLS
Lowest-five average
Source: IMF Article IV Staff Consultation Report, 2006 CAS code: C21P
Moreover, the existence of petroleum revenues, managed in a way to guarantee fiscal sustainability, gives Timor-Leste latitude in its fiscal policy. In particular, on the revenue side, the government can begin to think about growth-inducing tax reform for the private sector, featuring an appropriate widening of the tax base and a significant lowering of tax rates. Such tax policy reforms could be useful tools for upgrading business conditions in Timor-Leste and promoting private sector development.
Although government expenditures have been increasing, they have yet to reach—on a sustained basis—levels needed to jumpstart strong macroeconomic growth and stimulate large-scale job creation. This is troubling in Timor-Leste’s postconflict, low-income setting, where the

P R I V A T E S E C T O R E N A B L I N G E N V I R O N M E N T 25
government dominates the economy and the private sector is still too small and weak to play a major role in initiating and supporting recovery (see Business Environment, p. 27). Setting aside the high levels of public sector spending reached in 2006, which included emergency assistance and damage repair triggered by the crisis at midyear, in 2005 government expenditure was just 26.0 percent of nonpetroleum GDP, and was even 5 or 6 points lower still in all other post-independence years. This 2005 ratio of government expenditure to nonpetroleum GDP is on par with the performance of comparator Fiji and exceeds the median LI ratio, but it is still below the ratio for Cape Verde (36.3 percent).
Moreover, despite general postconflict recovery requirements, investment was a fairly modest proportion of total expenditure: Government’s capital expenditures accounted for an estimated 7 percent of nonpetroleum GDP, or 27 percent of total government expenditures in 2005.27 As pointed out earlier, for Timor-Leste to achieve recovery and poverty-reducing growth, the economy’s total gross capital formation should increase to approximately 30 to 40 percent of nonpetroleum GDP, with public sector capital spending—government and autonomous public agencies—accounting for the largest share of the total (see Postconflict Economic Growth, p. 9). Hence, government capital investment will need to rise substantially above current levels. The government must also spend its petroleum revenues in a prudent fashion to limit inflationary pressures.
These low spending levels, especially on capital projects, are simply a function of the government’s poor capacity for budget execution, particularly for capital budgets. Poor procurement capacity and overly centralized procedures have created budget execution bottlenecks, notably in infrastructure projects. As a result, disbursement has been extremely slow: for instance, by the end of the third quarter of fiscal 2006/07, less than 3 percent of the fiscal year’s budgeted capital expenditure had been disbursed.28
The government’s difficulties in delivering on its proposed capital budget commitments are symptomatic of the more general problem of the poor credibility and weakness of Timor-Leste’s public sector. The Government Effectiveness Index of the World Bank Institute (WBI)29 measures quality of public and civil services, degree of public sector independence from political pressures, quality of policy formulation and implementation, and credibility of government commitment to such policies. In 2006, Timor-Leste received a score of only -0.71 on this index. This score is well below those achieved by several comparators: Cape Verde (0.17), Fiji (-0.10), and Vanuatu (-0.39), although it is marginally better than the LI-Asia median (-0.86) and LI median (-0.89). According to this index, Timor-Leste has made progress on government effectiveness since independence—an improvement of about 0.2 points—but much more is required.
27 IMF, Timor-Leste 2006 Article IV Consultation – Staff Report, Table 2, 26. 28 World Bank Group and Asian Development Bank, Economic and Social Development Brief (August
2007), 16. 29 Ranging from -2.5 for poor to +2.5 for excellent, with 0 being the global mean.

26 T I M O R - L E S T E E C O N O M I C R E C O V E R Y A S S E S S M E N T
Effective public sector management also calls for a sound capacity for statistical management and analysis. As noted in the introduction, under the Statistical Capacity Indicator, Timor-Leste received a very unsatisfactory score of 36, with particularly poor statistical practices. By contrast, all comparators, including LI-Asia and LI, received scores of at least 45 on this indicator.
Figure 3-2 Government Effectiveness Index
Government capacity constraints remain a major problem.
Comparison to Other Countries, Most Recent Year Global Standing
-0.39
-0.89
0.17
-0.10
-0.86
-0.71
-1.0 -0.8 -0.6 -0.4 -0.2 0.0 0.2 0.4
Timor-Leste
LI-Asia
LI
Cape Verde
Fiji
Vanuatu
-2.5 (Very poor performance) - +2.5 (Excellent performance)Highest-five average
2.17
-1.78
TLS
Lowest-five average
Source: World Bank Institute CAS code: C21P1
Potential Conflict Recovery Priorities Achieving macroeconomic stability through low inflation and sound fiscal policy is the government’s overarching task. With this framework of stability well in place—a condition critical to Timor-Leste’s economic recovery—the core issue then becomes improvement of budget execution capacity, which is the major obstacle to harnessing the country’s large oil revenues for reconstruction and economic revitalization. The government urgently needs assistance to develop its capabilities to budget, manage, and disburse funds efficiently. In the near term, executing large capital expenditures in infrastructure systems and services should be emphasized, because these projects can provide work for unemployed or underemployed youth and at the same time help upgrade the operating environment for business. This effort will include streamlining procurement and other procedures for disbursement of funds and making them more transparent. In the medium term, another core issue may be tax reform for private sector development. Such reform could improve Timor-Leste’s investment climate, one of the worst in the world (see Business Environment, below).

P R I V A T E S E C T O R E N A B L I N G E N V I R O N M E N T 27
BUSINESS ENVIRONMENT
Performance Review A primary institutional impediment to growth in most postconflict countries is poor governance, including rampant corruption, weak private sector infrastructure, and an ineffective judicial framework. In Timor-Leste, where the government is likely to dominate the economy for the immediate recovery period, the nation’s prospects for long-term sustainable growth and job generation still hinge upon development of the broad nonpetroleum private sector. In effect, this means that Timor-Leste’s regulatory and institutional foundations for private sector development are crucial to economic performance in the medium to long term. At present, these elements of governance are among the worst in the world, so that fostering a more favorable institutional environment for business must be a clear and consistent objective for Timor-Leste.
The magnitude of the institutional problem that Timor-Leste faces is captured in a series of indices compiled by the WBI. For example, the Rule of Law Index measures the extent to which all players have confidence in and abide by the rules of society, and grades countries on these qualities on a scale ranging from -2.5 for very poor performance to +2.5 for excellent performance, with 0 the median. After independence, Timor-Leste’s score improved, from -1.17 in 2002 to -0.58 in 2005, which is better than the LI-Asia median of -0.87 and the LI median of -0.93. With the resurgence of conflict, however, this score plummeted to -1.16, making Timor-Leste one of the worst performers in the world (Figure 3-3). Similarly, according to the WBI’s Control of Corruption Index—an aggregate measure of the extent to which public power is used for private gain and of the “capture” of the state by elites and private interests—corruption is severe in Timor-Leste.30 By this index, corruption worsened at an average pace of 14.8 percent per year in the five years to 2006, from a score of -0.53 to -0.89. Though this position is still marginally better than the LI-Asia median of -0.98 and the LI median of -0.91, it is well below the scores of comparators such as Cape Verde (0.66) and Vanuatu (0.20). Furthermore, its deteriorating trend must be reversed promptly to seriously promote private sector development.
Other indicators of governance also paint a bleak picture. Of particular concern in the past few years is the growing marginalization of the private sector in issues of national importance. In 2002, Timor-Leste scored 0.19 on the WBI’s Voice and Accountability Index, significantly above the zero-value world mean. But by 2006, the nation’s position on this index had declined to -0.33. While this figure is significantly better than the LI-Asia and LI medians for 2006 (-0.99 and -0.97, respectively), it is much below the rank of Cape Verde (0.85) or Vanuatu (0.50). The downward trend in scores under the index is ominous, but may be halted by the impact of successful and relatively peaceful elections in 2007.
30 Although Timor-Leste passed the MCC threshold standard for control of corruption in 2007, it failed to pass in 2008.
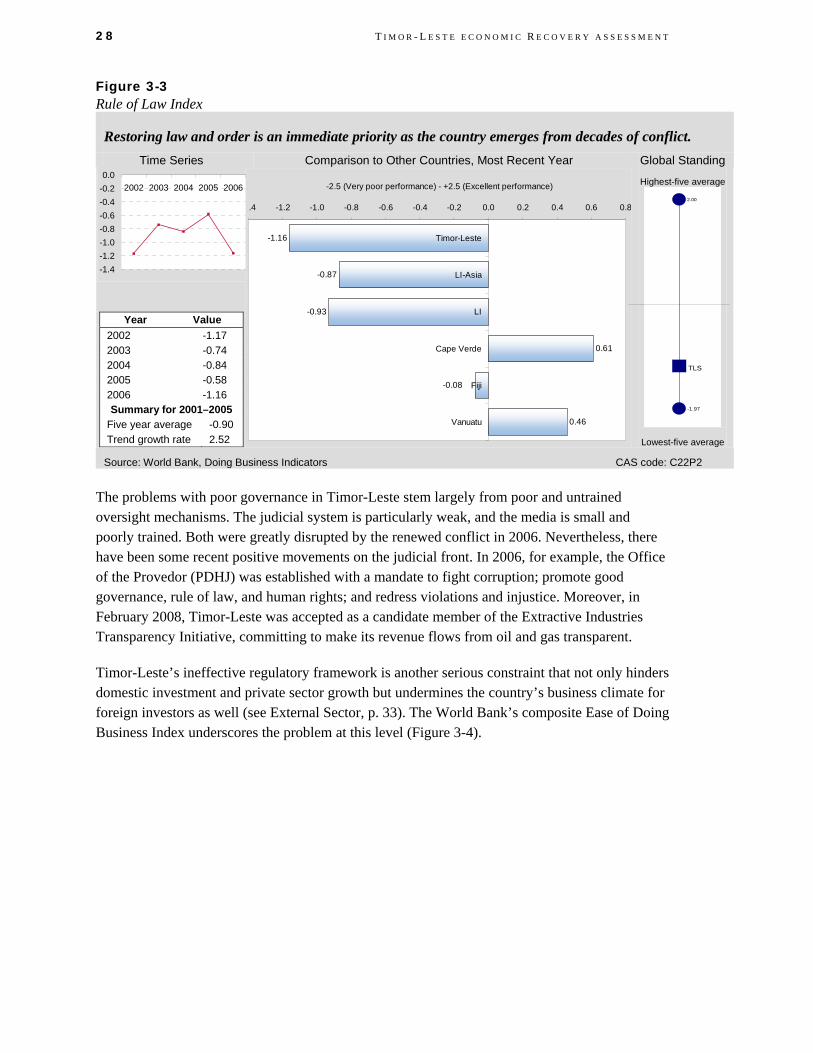
28 T I M O R - L E S T E E C O N O M I C R E C O V E R Y A S S E S S M E N T
Figure 3-3 Rule of Law Index
Restoring law and order is an immediate priority as the country emerges from decades of conflict. Time Series Comparison to Other Countries, Most Recent Year Global Standing
-1.4-1.2-1.0-0.8-0.6-0.4-0.20.0
2002 2003 2004 2005 2006
Year Value 2002 -1.17 2003 -0.74 2004 -0.84 2005 -0.58 2006 -1.16 Summary for 2001–2005
Five year average -0.90 Trend growth rate 2.52
0.46
-0.93
0.61
-0.08
-0.87
-1.16
.4 -1.2 -1.0 -0.8 -0.6 -0.4 -0.2 0.0 0.2 0.4 0.6 0.8
Timor-Leste
LI-Asia
LI
Cape Verde
Fiji
Vanuatu
-2.5 (Very poor performance) - +2.5 (Excellent performance)
Highest-five average
2.00
-1.97
TLS
Lowest-five average
Source: World Bank, Doing Business Indicators CAS code: C22P2
The problems with poor governance in Timor-Leste stem largely from poor and untrained oversight mechanisms. The judicial system is particularly weak, and the media is small and poorly trained. Both were greatly disrupted by the renewed conflict in 2006. Nevertheless, there have been some recent positive movements on the judicial front. In 2006, for example, the Office of the Provedor (PDHJ) was established with a mandate to fight corruption; promote good governance, rule of law, and human rights; and redress violations and injustice. Moreover, in February 2008, Timor-Leste was accepted as a candidate member of the Extractive Industries Transparency Initiative, committing to make its revenue flows from oil and gas transparent.
Timor-Leste’s ineffective regulatory framework is another serious constraint that not only hinders domestic investment and private sector growth but undermines the country’s business climate for foreign investors as well (see External Sector, p. 33). The World Bank’s composite Ease of Doing Business Index underscores the problem at this level (Figure 3-4).
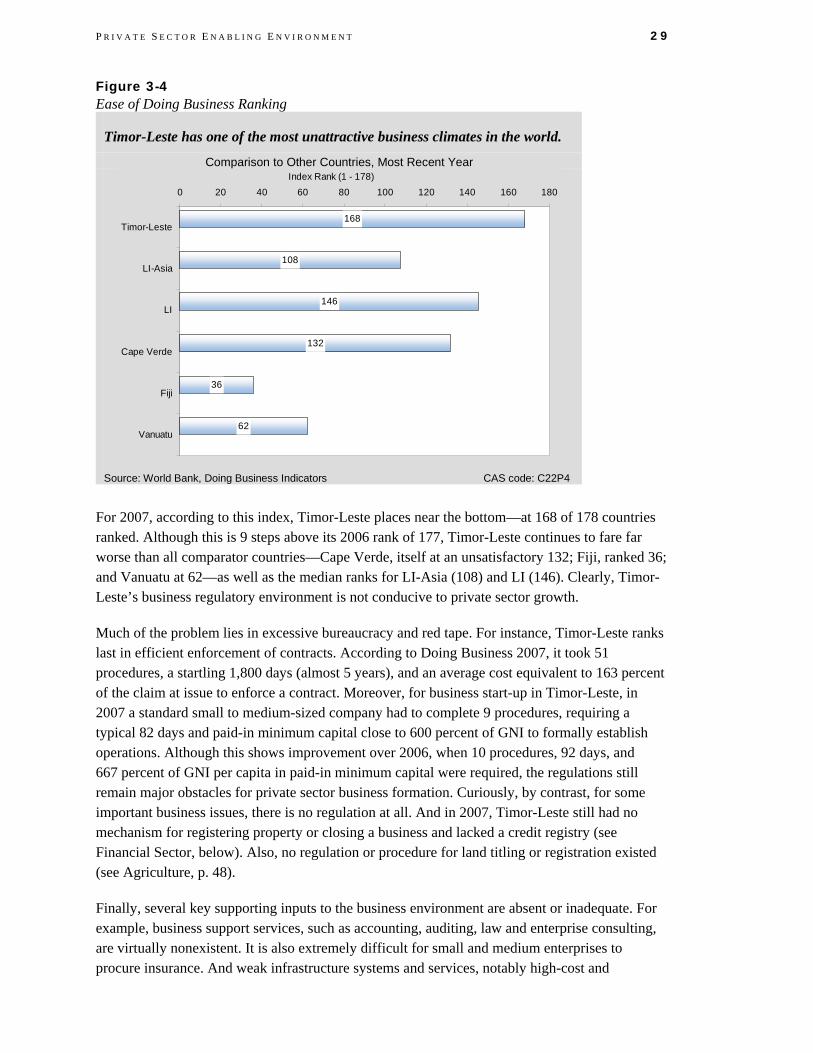
P R I V A T E S E C T O R E N A B L I N G E N V I R O N M E N T 29
Figure 3-4 Ease of Doing Business Ranking
Timor-Leste has one of the most unattractive business climates in the world.
Comparison to Other Countries, Most Recent Year
62
168
108
36
132
146
0 20 40 60 80 100 120 140 160 180
Timor-Leste
LI-Asia
LI
Cape Verde
Fiji
Vanuatu
Index Rank (1 - 178)
Source: World Bank, Doing Business Indicators CAS code: C22P4
For 2007, according to this index, Timor-Leste places near the bottom—at 168 of 178 countries ranked. Although this is 9 steps above its 2006 rank of 177, Timor-Leste continues to fare far worse than all comparator countries—Cape Verde, itself at an unsatisfactory 132; Fiji, ranked 36; and Vanuatu at 62—as well as the median ranks for LI-Asia (108) and LI (146). Clearly, Timor-Leste’s business regulatory environment is not conducive to private sector growth.
Much of the problem lies in excessive bureaucracy and red tape. For instance, Timor-Leste ranks last in efficient enforcement of contracts. According to Doing Business 2007, it took 51 procedures, a startling 1,800 days (almost 5 years), and an average cost equivalent to 163 percent of the claim at issue to enforce a contract. Moreover, for business start-up in Timor-Leste, in 2007 a standard small to medium-sized company had to complete 9 procedures, requiring a typical 82 days and paid-in minimum capital close to 600 percent of GNI to formally establish operations. Although this shows improvement over 2006, when 10 procedures, 92 days, and 667 percent of GNI per capita in paid-in minimum capital were required, the regulations still remain major obstacles for private sector business formation. Curiously, by contrast, for some important business issues, there is no regulation at all. And in 2007, Timor-Leste still had no mechanism for registering property or closing a business and lacked a credit registry (see Financial Sector, below). Also, no regulation or procedure for land titling or registration existed (see Agriculture, p. 48).
Finally, several key supporting inputs to the business environment are absent or inadequate. For example, business support services, such as accounting, auditing, law and enterprise consulting, are virtually nonexistent. It is also extremely difficult for small and medium enterprises to procure insurance. And weak infrastructure systems and services, notably high-cost and
30 T I M O R - L E S T E E C O N O M I C R E C O V E R Y A S S E S S M E N T
unreliable electricity and inadequate road networks (see Economic Infrastructure, p. 36), add to the administrative burden and expense of doing business in Timor-Leste.
Potential Conflict Recovery Priorities Maintaining law and order, improving governance, and reforming the regulatory framework will be keys to promoting development of a robust private sector in Timor-Leste and reducing the tension that can lead to violence. Core issues include immediate attention to improving the legal and institutional environment for fostering private sector growth. They will also involve provision of training and support to the country’s oversight bodies to increase transparency in the government and the private sector. Particular attention must be paid to business start-up regulation and availability of credit, as well as reform for land and property registration. By encouraging stability, security, and private sector expansion, such programs should have a significant and visible impact on business confidence and markets in postconflict Timor-Leste.
FINANCIAL SECTOR
Performance Review The financial sector is crucial for the resumption of normal economic activities in postconflict environments. The depth, stability, and quality of financial institutions are fundamental for the processes of mobilizing savings, allocating financial resources, fostering entrepreneurship and improving risk management, all of which promote economic efficiency, growth, and poverty reduction. Although all banks were destroyed in Timor-Leste in the 1999 post-referendum period, a small financial sector has evolved since. It has considerable potential to expand and diversify to encourage the development of small and microenterprise and the transformation of subsistence farms to small-scale commercial agriculture, while achieving greater monetization of Timor-Leste’s economy in the process.
Timor-Leste’s financial sector is composed of a handful of banks, a few microfinance institutions, and various savings and loans cooperatives. A simple indicator of the development of the banking sector and monetization of the economy is the degree of financial deepening, measured by the ratio of broad money (currency plus bank deposits) to nonpetroleum GDP (Figure 3-5). In Timor-Leste, this ratio of money supply to nonpetroleum GDP stood at 32.0 percent in 2006, a fairly large jump from its independence-era (2002) figure of 15.9 percent. Although this movement suggests a relatively rapid expansion of banking activity in recent years, and indeed Timor-Leste’s current level of financial deepening lies above the median for LI (25.1 percent), the ratio is still significantly below the LI-Asia median (39.6 percent) and the standards for the key comparators: Cape Verde, 75.7 percent; Fiji, 50.4 percent; and Vanuatu, 108.8 percent.

P R I V A T E S E C T O R E N A B L I N G E N V I R O N M E N T 31
Figure 3-5 Money Supply, as a Percentage of GDP
Although increasing, the degree of monetization is relatively low.
Time Series Comparison to Other Countries, Most Recent Year Global Standing
0.05.0
10.015.020.025.030.035.0
2002 2003 2004 2005 2006
Year Value 2002 15.9 2003 21.5 2004 24.8 2005 27.8 2006 32.0 Summary for 2001–2005 Five year average 24.4 Trend growth rate 16.6
32.0 39.6 25.1 75.7 50.4 108.80
20
40
60
80
100
120
Timor-Leste LI-Asia LI Cape Verde Fiji Vanuatu
Per
cent
GD
P
Highest-five average 194.8
8.2
TLS
Lowest-five average
Source: IMF Article IV Staff Consultation Report, 2006 CAS code: C23P3
Timor-Leste’s ratio of domestic credit to the private sector as a proportion of nonpetroleum GDP increased from a mere 6.5 percent in 2003 to 29.8 percent in 2005, falling off somewhat in 2006 to 20.7 percent. This rise and fall of credit to the private sector clearly tracks the increase and decrease in nonpetroleum GDP in these years, and the contraction in private sector credit in 2006 no doubt reflects the unrest and disruption to Timor-Leste’s economy caused by that year’s conflict. In any event, the current level of private sector credit to GDP is still above the LI-Asia median (18.8 percent) and the LI median (12.3 percent). It remains, however, well below the equivalent ratios for Cape Verde (39.0 percent), Fiji (42.2 percent), and Vanuatu (50.2 percent). Despite this apparent improvement in access to credit, Timor-Leste’s financial sector is mired by demand and supply constraints. First, the lack of property rights on land excludes its use as collateral; second, a culture of nonperforming loans—which evidently increased sharply during the 2006 turmoil—deters loan expansion; and third, catering to potential demand for small farmer agricultural lending is virtually nonexistent. Prudent expansion in private sector credit in Timor-Leste will require a combination of solid borrowers with bankable credit needs, good credit assessment policies and practices by banks, and continuing stable macroeconomic conditions for business. 31
For Timor-Leste’s financial sector to reinforce economic recovery and accelerate and sustain development, three major issues must be addressed. First, a facilitating legal and regulatory framework for financial services must be put in place. As noted earlier, the lack of a modern
31 Prudence is important. Timor-Leste’s Banking and Payments Authority data show that nonperforming loans as a proportion of total loans climbed sharply along with renewed turmoil and violence in 2006: Nonperforming loans increased from just 6.3 percent of loans in Q4 2003 to almost 30 percent of loans in Q3 2006. September 2007. IMF, Timor-Leste 2006 Article IV Consultation – Staff Report, 18.

32 T I M O R - L E S T E E C O N O M I C R E C O V E R Y A S S E S S M E N T
legal-regulatory foundation for business deters private sector development (see Business Environment, p. 27). In the financial sector, key requirements include more effective and timely judicial procedures and practices to resolve commercial disputes; legislation and regulations to clarify and strengthen creditor rights, including reasonable bankruptcy procedures; and, in particular, regulations to govern registration of property, including land titling and registration. Such reforms are critical to modernizing the role and use of collateral by lenders and borrowers.
Second, microfinance institutions (MFIs) and microfinance services need to be strengthened and expanded—beginning with Instituicão Microfinacas de Timor-Leste (IMfTL), the nation’s regulated microfinance banking institution with a poverty-lending mission, but also smaller non-deposit-taking MFIs as well. The demand for microfinance is believed to be substantial: for example, in 2004, various surveys estimated the market for microfinance services to be between 275,000 and 435,000 persons. 32 But in the past two years, the number of microfinance institutions has shrunk from nine to four, only two of the remaining entities are considered active, and even the active operations engage mostly in salary-based lending. The weak financial culture of Timor-Leste seems to have contributed greatly to this contraction in microfinance. Finding ways to increase microfinance lending in Timor-Leste will be essential for reducing poverty and unemployment and hence relieving some of the tension that contributed to the resurgence of violence in 2006. Microfinance should supply credit to urban microentrepreneurs, especially to subsistence farmers who move to commercial transactions, and to small traders who provide small manufactured goods and various services to rural areas.
Finally, with improved legal-regulatory frameworks and sound banking sector supervision to build confidence in the banking system, effort should also be made to increase the mobilization of savings, especially in rural areas. Efforts should combine expanded coverage by deposit-taking institutions, use of new technologies—e.g., mobile phone banking—and public education to increase financial literacy in the general population. Enhanced savings mobilization will help monetize and modernize the rural sector and encourage market-oriented attitudes.
Potential Conflict Recovery Priorities The need for financial sector deepening and for expanding credit to the private sector may be somewhat less critical in Timor-Leste’s recovery than the highest priorities of large-scale reconstruction and rapid job creation. But soon after the most pressing reconstruction needs are met, strengthening and broadening access to financial services can begin to help energize the rural sector, promoting market-based development and alleviating poverty. Core issues in the process will be reforming the legal-regulatory framework for financial services, developing microfinance institutions and programs, and promoting savings mobilization. All three of these core issues are inter-related and mutually reinforcing, and indeed, all will contribute to Timor-Leste’s progress in modernizing and monetizing the private sector and the overall economy.
32 John Conroy, Timor-Leste Access to Finance for Investment and Working Capital, World Bank and the Government of Timor-Leste (2005), 28.

P R I V A T E S E C T O R E N A B L I N G E N V I R O N M E N T 33
EXTERNAL SECTOR
Performance Review Fundamental changes in international commerce and finance, including reduced transport costs, advances in telecommunications technology, and liberalized policy regimes have fueled a rapid increase in global integration in the past 25 years. For postconflict countries, reestablishing and building up linkages to international markets for exports, imports, and capital often play an important part in economic recovery.
In Timor-Leste’s case, the linkages between the domestic economy and the global marketplace are relatively weak—with the notable exception of the gas exports flowing from the country’s offshore natural gas fields, essentially enclave operations. The weakness of these linkages is particularly evident in the most recent ratio of the value of the nation’s nonpetroleum merchandise trade—exports plus imports—to the value of its nonpetroleum GDP (Figure 3-6). Trade in nonpetroleum merchandise accounted for just 41.9 percent of nonpetroleum GDP in 2006, compared to the more highly globalized LI-Asia (median of 99.5 percent), Fiji (84.7 percent), or other comparators: Vanuatu (55.2 percent) or Cape Verde (46.4 percent). In part, this low ratio for Timor-Leste is due to the conflict of 2006, which severely upset economic activity, but even with reconstruction and independence activity in 2002, the ratio stood at no more than 66 percent and has declined steadily since.
Figure 3-6 Nonpetroleum Merchandise Trade, as a Percentage of Nonpetroleum GDP
Although open in its trade policies, Timor-Leste is poorly linked to the global trading system. Time Series Comparison to Other Countries, Most Recent Year
0.010.020.030.040.050.060.070.0
2002 2003 2004 2005 2006
Year Value
2002 65.3 2003 60.1 2004 50.6 2005 41.7 2006 41.9 Summary for 2001–2005
Five year average 51.9 Trend growth rate -12.5
41.9 99.5 52.6 46.4 84.7 55.20
20
40
60
80
100
120
Timor-Leste LI-Asia LI Cape Verde Fiji Vanuatu
Per
cent
Cha
nge
Source: IMF Article IV Staff Consultation Report, 2006 CAS code: Not a standard indicator
Policy barriers play no role in the weak trade linkages between Timor-Leste’s nonpetroleum economy and the world. Since 2003, an open trade regime prevails, with no quota restrictions and a uniform 6 percent import tariff. Rather, the weakness reflects Timor-Leste’s limited production base and poor institutional capacity for trade operations and customs administration. On the

34 T I M O R - L E S T E E C O N O M I C R E C O V E R Y A S S E S S M E N T
export side, in 2006, nonpetroleum merchandise exports amounted to a mere $8 million, three-quarters of which can be attributed to the export of one crop, green coffee. Moreover, nonpetroleum export growth—i.e., coffee exports—has remained flat over the past five years. Even though a fairly large share of rural households cultivates coffee, average rural household productivity is very low, and their collective export production capability is very modest (see Agriculture, p. 48). Other export potentials—such as vanilla and groundnuts—have developed even less.
On the import side, with postconflict reconstruction, a sharply increasing flow of capital goods imports might be expected. But Timor-Leste’s merchandise imports have declined in recent years, falling from $218 million in 2002 to $141 million in 2006. And more than a quarter of the value of imports in 2005 (the latest year for which data are available) seems attributable to fuel imports, while only less than 10 percent is made up of capital items needed for rebuilding infrastructure, plant and equipment and the general recovery of the economy.33 Constraints on importing may be two-fold. First, the government’s operational capacity to mount large-scale reconstruction is limited, which depresses the volume of capital imports (see Economic Stabilization and Government Capacity, p. 23). Second, as in many postconflict and developing countries, customs administration is inefficient and slows down the incoming flows of goods. In fact, measured by the World Bank’s Trade Logistics Performance Index for customs, Timor-Leste does very poorly. In 2007, its customs performance received a score of 1.6 (on a scale of 1 to 5, worst to best), well below the LI-Asia median of 2.0, and places Timor-Leste at 147 of 150 countries ranked.
Although these modest trade flows are cause for concern, Timor-Leste faces few of the other external sector issues that often inhibit the recovery process in postconflict countries. This is due to its new status as a petroleum producer and its recent independence. For example, in 2006, because of its considerable oil and gas royalties and oil tax revenue transfers, Timor-Leste posted a current account surplus of 116 percent of nonpetroleum GDP (Figure 3-7). This contrasts sharply with recent annual current account deficits for LI-Asia (median of -0.1 percent of GDP) and for LI (median of -4.2 percent), and for comparators Cape Verde (-3.5 percent) and Vanuatu (-18.8 percent). Without oil and gas tax transfers and royalty income, however, and with its near-total absence of export earnings, Timor-Leste would have a current account deficit equal to -23 percent of GDP, deeper than any comparator’s deficit.
33 Nathan Associates’ estimates based on data from the ADB Key Indicators of Developing Asian and Pacific Countries and IMF, Democratic Republic of Timor-Leste Article IV Consultation-Staff Report data.

P R I V A T E S E C T O R E N A B L I N G E N V I R O N M E N T 35
Figure 3-7 Current Account Balance, as a Percentage of Nonpetroleum GDP
High oil revenues are now sheltering Timor-Leste from current account and various other external sector problems.
Time Series Comparison to Other Countries, Most Recent Year
-50.0
0.0
50.0
100.0
150.0
2002 2003 2004 2005 2006
Year Value 2002 -37.0 2003 -25.0 2004 30.0 2005 84.0 2006 116.0 Summary for 2001–2005
Five-year average 33.6 Trend growth rate .
-18.8
-0.1
-4.2 -3.5
0.7116.0
-40
-20
0
20
40
60
80
100
120
140
Timor-Leste LI-Asia LI Cape Verde Fiji Vanuatu
Per
cent
GD
P
Source: IMF Article IV Staff Consultation Report, 2006 CAS code: C24P2
Similarly, many postconflict countries are debilitated by high debt and are extremely vulnerable to external shocks and debt crises as a result of their weak currencies and low foreign reserves. Timor-Leste, however, is completely debt free, and with its high and fairly dependable petroleum income stream, is in a position to avoid large-scale external borrowing.34 Furthermore, with its oil and gas revenues, it has accumulated large foreign reserves to mitigate external shocks. By tend of 2006, these reserves stood at a level of 85.4 months worth of imports—compared to the LI-Asia median of 2.8 months, Cape Verde’s 3.0 months (2005) and Vanuatu’s 3.1 months (2005). And, finally, with its adoption of the U.S. dollar as the official currency, its exchange rate policy is set. (The government of course must continue to control domestic inflation to try to maintain a competitive real effective exchange rate [REER]). With the fall of the dollar, the REER has generally declined.)
he
As in many postconflict situations, foreign direct investment (FDI)—outside the offshore petroleum sector—has shown little to no interest in Timor-Leste. This no doubt reflects foreign investors’ perception of the high risk of return to conflict, as well the disincentives of the nation’s poor business-enabling environment (see Business Environment, p. 27). In September 2007, Timor-Leste was ranked near the bottom (153 of 174 countries) in Institutional Investor’s country credit rankings, well below Cape Verde (112) and Vanuatu (129). Unlike most other postconflict countries, with its oil wealth, failing to attract FDI is not necessarily a financial constraint for
34 Quite to the contrary, with the need to manage its Petroleum Fund assets, Timor-Leste will be a lender – including the purchase of short and medium term US Government bonds.

36 T I M O R - L E S T E E C O N O M I C R E C O V E R Y A S S E S S M E N T
Timor-Leste, but it still means foregoing the substantial technical spillover and market linkages that FDI brings.
In the period immediately up to and after independence, Timor-Leste depended on significant assistance from the international community to finance reconstruction and recovery and activities launching the new state and its administration. In 2002, the year of independence, foreign aid inflows were at a peak, equivalent to 60.3 percent of GNI. Since then, they have declined, to 33.5 percent of GNI in 2005 (the most recent year for which data are available). This reduction reflects in part some drawing down of UN and international community involvement in Timor-Leste after independence, particularly given the nation’s ability to call on its oil and gas resources to fund recovery and development. Nevertheless, at present, aid as a percentage of GNI is still extremely high compared to all benchmarks: the LI-Asia and LI medians of 10.1 percent and 12.5 percent, respectively; Cape Verde, 16.9 percent; Vanuatu, 12.0 percent; and Fiji, 2.4 percent. With Timor-Leste’s build-up of petroleum revenues, further decline in foreign aid flows might be anticipated.
Potential Conflict Recovery Priorities Because of its oil revenues, Timor-Leste is insulated from many of the external sector pressure that postconflict economies face. Nevertheless, the country has to manage the external sector in ways that continue to reinforce macroeconomic stability, cushion the economy from future external shocks, and accelerate growth and development. The core issue at present is to expand trade flows, both imports and exports. For imports, this will mean increasing the incoming flow of capital goods to aid in reconstruction and significantly upgrading the efficiency of customs administration. The latter will make public sector reconstruction programs more cost-effective and private business more competitive. For exports, the key objective is to build nonpetroleum export production—coffee—not primarily for the foreign exchange it earns, but to generate cash for the rural sector by tapping into lucrative overseas markets. Diversification of exports—e.g., tourism, light manufacturing—and export value addition—e.g., agroprocessing—will likely be part of longer-term export development. Finally, with progress on improving the business-enabling environment, promoting FDI will also be important for attracting capital, markets, technology, and management expertise to energize the domestic private sector.
ECONOMIC INFRASTRUCTURE
Performance Review Efficiently operating physical infrastructure systems—transportation, power and ICT—is a critical determinant of success in both postconflict recovery and sustained economic growth. A lack of reliable infrastructure services raises cost, diminishes productivity, and undermines competitiveness, impeding immediate efforts in postconflict reconstruction and retarding advances in economic and social development.
By international standards, Timor-Leste’s transportation, electricity, and telecommunications infrastructure are extremely poor and are perceived by the private sector to be getting worse. In 2007, the World Economic Forum (WEF), compiling an annual global index of infrastructure quality based on surveys of executive opinion in each country examined, scored Timor-Leste 1.68
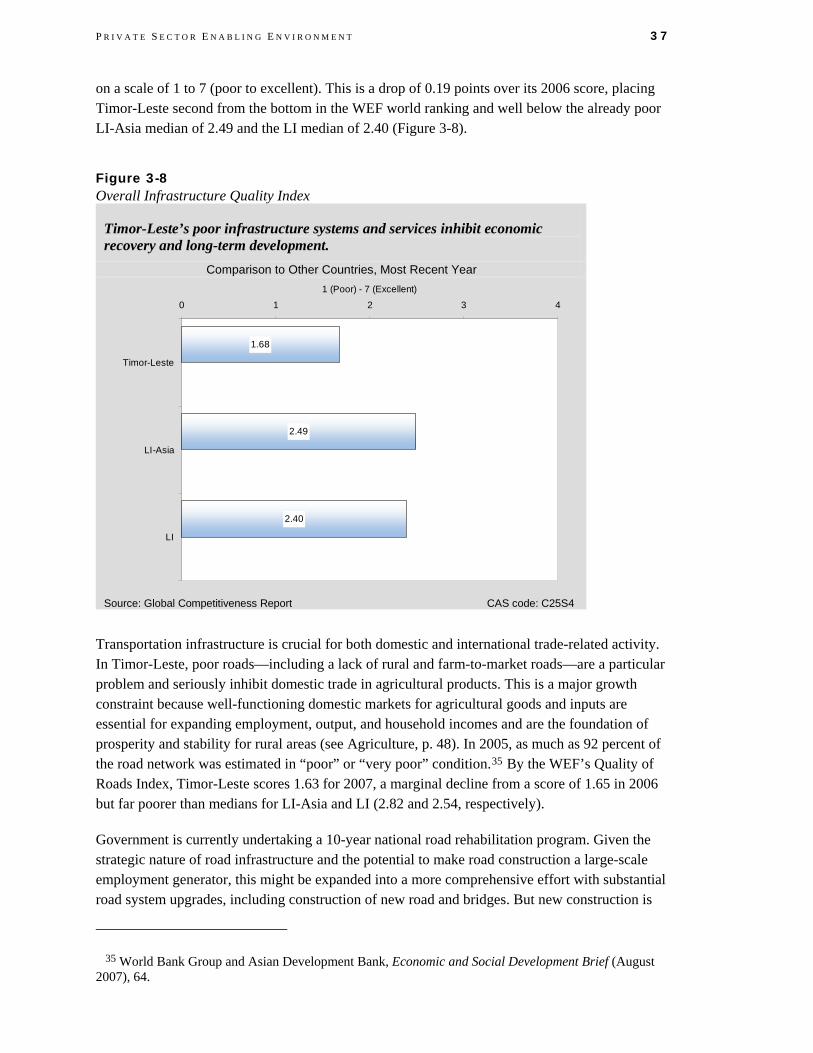
P R I V A T E S E C T O R E N A B L I N G E N V I R O N M E N T 37
on a scale of 1 to 7 (poor to excellent). This is a drop of 0.19 points over its 2006 score, placing Timor-Leste second from the bottom in the WEF world ranking and well below the already poor LI-Asia median of 2.49 and the LI median of 2.40 (Figure 3-8).
Figure 3-8 Overall Infrastructure Quality Index
Timor-Leste’s poor infrastructure systems and services inhibit economic recovery and long-term development.
Comparison to Other Countries, Most Recent Year
2.40
2.49
1.68
0 1 2 3 4
Timor-Leste
LI-Asia
LI
1 (Poor) - 7 (Excellent)
Source: Global Competitiveness Report CAS code: C25S4
Transportation infrastructure is crucial for both domestic and international trade-related activity. In Timor-Leste, poor roads—including a lack of rural and farm-to-market roads—are a particular problem and seriously inhibit domestic trade in agricultural products. This is a major growth constraint because well-functioning domestic markets for agricultural goods and inputs are essential for expanding employment, output, and household incomes and are the foundation of prosperity and stability for rural areas (see Agriculture, p. 48). In 2005, as much as 92 percent of the road network was estimated in “poor” or “very poor” condition.35 By the WEF’s Quality of Roads Index, Timor-Leste scores 1.63 for 2007, a marginal decline from a score of 1.65 in 2006 but far poorer than medians for LI-Asia and LI (2.82 and 2.54, respectively).
Government is currently undertaking a 10-year national road rehabilitation program. Given the strategic nature of road infrastructure and the potential to make road construction a large-scale employment generator, this might be expanded into a more comprehensive effort with substantial road system upgrades, including construction of new road and bridges. But new construction is
35 World Bank Group and Asian Development Bank, Economic and Social Development Brief (August 2007), 64.

38 T I M O R - L E S T E E C O N O M I C R E C O V E R Y A S S E S S M E N T
only half the formula for improving road infrastructure. With mountainous terrain in some regions, and especially with Timor-Leste’s climate, heavy rain and mudslides regularly deteriorate road networks. Continuous and effective maintenance is thus a necessity.
Other key transportation infrastructure systems—seaports and airports—are also in poor condition and are perceived to have deteriorated since the 2006 resurgence in violence. Timor-Leste’s scores on the WEF Port Infrastructure Quality Index and Air Transport Infrastructure Index declined between 2006 and 2007. The former fell from 2.19 in 2006 to 1.85 in 2007, well below the LI-Asia median of 2.57. The latter dropped slightly less, from 2.44 in 2006 to 2.29 in 2007, but still 1.33 points below the LI-Asia median of 3.62.
A lack of electricity and the high cost of power services where it is available further stifle growth and development. In 2007, an estimated 22 percent of all households—and only 5 percent of rural households—had access to electricity.36 Much of the generation capacity destroyed in the 1999 conflict has been restored, but damage to distribution networks remains. Moreover, according to the WEF’s Quality of Electricity Supply Index, the quality of electricity supply has fallen since the resurgence of violence in 2006 because operations and field maintenance of the power system operator have been disrupted. In 2007, Timor-Leste scored 1.69 on this index—on a scale of 1 to 7, worst to best—compared to 1.84 a year earlier. Its present position is 1.06 points below the 2.76 LI-Asia median. Electricity is also very high cost as a result of the use of expensive imported diesel fuel in power generation, as well as widespread illegal tap-ins that raise distribution losses and increase the cost of operation.
ICT infrastructure is also critically underdeveloped and contributes to the poor enabling environment for private sector development in Timor-Leste. In 2006, the telephone density for both fixed and mobile lines was 64.3 per 1,000 people, significantly better than the LI-Asia median of 34.6, though much worse than the 302.2 in Cape Verde, 254.2 in Fiji, and 83.3 in Vanuatu, and very poor in absolute terms. Internet penetration is even worse. The same year, Timor-Leste had just one user per 1,000 people, below the already low LI-Asia median of 4, Cape Verde’s 49, Fiji’s 77, and Vanuatu’s 38. Internet connections are nonexistent in rural areas.
Potential Conflict Recovery Priorities For Timor-Leste, the infrastructure challenge is not only to rehabilitate assets severely damaged in the conflict events of 1999 and 2006 but also to greatly expand and upgrade a set of infrastructure systems and services that were already woefully inadequate in the preconflict world. With petroleum revenue Timor-Leste has the resources to undertake the programs on a scale that addresses immediate recovery needs—electricity distribution network rehabilitation, for example—and long-term infrastructure development requirements. Fortunately, with labor-intensive construction and maintenance techniques, such programs also hold enormous potential for job generation in the process. In the infrastructure sector, the first core issue will be improving public sector capacity to execute construction and maintenance programs in an efficient fashion, and to do so for maximum employment impact. Given the government’s limitations for execution, a second core issue might be defining a role and proper legal-regulatory framework for
36 Ibid. 44.

P R I V A T E S E C T O R E N A B L I N G E N V I R O N M E N T 39
the private sector—foreign and domestic—to participate in infrastructure development. The experience of engaging foreign companies (in Timor-Leste’s telecommunications and electricity) for infrastructure rehabilitation and operation has been mixed, but private sector participation holds great promise for improving systems and services rapidly. Donor technical assistance could help define and plan appropriate private sector participation approaches in all sectors—ports, airports, water, even road maintenance.


4. Pro-Poor Growth Environment This section reviews conditions and performance in certain sectors critical to poverty reduction in Timor-Leste’s postconflict recovery and long-term development. Rapid growth can be one of the most powerful and dependable instruments for reducing poverty and preventing a relapse into conflict. Growth without development intensifies inequalities and breeds hostilities; thus pro-poor growth is critical for Timor-Leste’s postconflict transformation. A pro-poor growth environment stems from policies and institutions that improve opportunities and capabilities for the poor while reducing their vulnerabilities by improving livelihoods, building assets, and enhancing mechanisms to cope with shocks. In fragile states and postconflict countries, however, these policies and institutions are often weak or nonexistent. Sustainable economic development hinges on the implementation of programs to improve primary health and education; on job creation, labor market skills and income opportunities; and on agricultural development, especially important given Timor-Leste’s large and poor rural population.
HEALTH
Performance Review The provision of basic health service is a major form of human capital investment and a significant determinant of economic growth and poverty reduction. Conflict adds to the complexities of coordination and provision of basic healthcare facilities by interrupting the supply of drugs and services or by damaging existing health infrastructure. More than 70 percent of the health facilities in Timor-Leste were destroyed or badly damaged by violence after the 1999 independence referendum, and all but a handful of health professional have fled the country.37 The mid-2006 outbreak of violence in Timor-Leste caused the internal displacement of some 150,000 persons (see Profile of Conflict and Recovery, p. 5), and more damage, including the disruption of basic health care supplies and services. Although Timor-Leste has been successful in reestablishing some of its basic health care infrastructure since independence, sporadic violence and insecurity and a scarcity of skilled personnel have undermined sustainable development of the health sector. Consequently, some of the basic health outcomes of the population remain poor.
37 World Bank, Rebuilding Timor-Leste’s Health System. http://go.worldbank.org/9TNJZD1F50. Accessed: January 11, 2008.

42 T I M O R - L E S T E E C O N O M I C R E C O V E R Y A S S E S S M E N T
Life expectancy at birth is commonly regarded as the best overall indicator of the health status of a population. Plausibly as a result of prolonged conflict, life expectancy at birth in Timor-Leste stood at 59.7 years in 2005.38 This falls short of the median life expectancy in LI-Asia estimated at 63.2 years but is better than the LI median life expectancy of 55.0 years. Health conditions by this measure appear to be better in comparator countries: life expectancy (2004) is estimated for Cape Verde at 70.4 years, Fiji at 68.0 years, and Vanuatu at 69.0 years.
Another commonly used health indicator is the maternal mortality rate (MMR), which provides insight into the quality of health care services available. For Timor-Leste, the MMR, although high in absolute terms—estimated at about 660 per 100,000 live births39—is marginally better than the LI median of 690, although still short of the standard for comparators Cape Verde and Fiji (both at 210 maternal deaths per live birth) as well as the LI-Asia median of 420 (Figure 4-1).
Figure 4-1 Maternal Mortality Rate
Maternal mortality is relatively high due to poor health conditions and high fertility. Comparison to Other Countries, Most Recent Year Global Standing
660.0 420.0 690.0 210.0 210.0 32.00
100
200
300
400
500
600
700
800
Timor-Leste LI-Asia LI Cape Verde Fiji Vanuatu
Dea
ths
per
100,
000
live
birt
hs
Highest-five average 1800.0
2.6
TLS
Lowest-five average
Source: UNICEF, UN Millennium Indicators Database CAS code: C31P2
The reasons for the high MMR in Timor-Leste is apparent: high fertility rates coupled with a lack of and/or poor quality of health care services. Timor-Leste has the highest fertility rates in the world—around 7.8 children per woman—and a very high incidence of teenage fertility—59.2 live
38 UNDP, Human Development Report, 2007/2008. Estimates for the years 2000-2005. 39 Data on Health and Education, for a number of indicators, differ from source to source and must be
interpreted with care. For instance, the UNDP’s Human Development Report statistics for Timor-Leste 2007/08 (http://hdrstats.undp.org/countries/data_sheets/cty_ds_TMP.html) reports maternal mortality rate at 380 per 100,000 live births whereas UNICEF states this number at 660 per 100,000 live births (http://www.unicef.org/infobycountry/Timorleste_statistics.html).

P R I V A T E S E C T O R E N A B L I N G E N V I R O N M E N T 43
births per 1,000 females in the 15–19 year age group (See Gender and Children, p. 20). Yet, only 18.4 percent of births were estimated to be attended by skilled health personnel in 2003.40 The extremely low rate of assisted childbirth suggests either that the coverage of health care facilities is not adequate or that health services are not being used optimally. A reduction of fertility rates lies at the core not only of improving the health conditions of the country but also of managing the risks associated with a bulging and largely unemployed youth population (See Demography and Environment, p. 18).
With a large youth population, the health of Timor-Leste’s youth has a direct impact on the future security and overall productivity of the economy. Timor-Leste has a relatively high child mortality rate; approximately 83 per 1,000 children in a given year die before reaching the age of five. Although this is somewhat comparable to the LI-Asia median of 74 children and much better than the alarming LI median of 120.0 children, it is far worse than the child mortality rate of 35.0 in Cape Verde, 17.9 in Fiji, and 38.0 in Vanuatu. The relatively high child mortality rate is directly linked to the prevalence of child malnutrition. Approximately 50.3 percent of Timorese children under five are underweight. By comparison, both LI-Asia and LI outperform Timor-Leste, the former with a median of 37.9 percent underweight children, and the latter with 27.2 percent (Figure 4-2). Although Timor-Leste’s rate of child malnutrition is startlingly high, the level is not surprising given the large percentage of population that is rural and depends on subsistence farming. This makes households highly vulnerable to agricultural and other external shocks and severely increases food insecurity (See Agriculture, p. 48).
Figure 4-2 Prevalence of Child Malnutrition (Weight for Age)
High levels of child malnutrition contribute to a high child mortality rate. Comparison to Other Countries, Most Recent Year Global Standing
37.950.3 27.20
10
20
30
40
50
60
Timor-Leste LI-Asia LI
Per
cent
Highest-five average
45.3
2.9
TLS
Lowest-five average
Source: World Development Indicators CAS code: C31S4
40 Data on fertility rates and births attended by skilled health personnel were obtained from the World Development Indicators Database, December 2007.

44 T I M O R - L E S T E E C O N O M I C R E C O V E R Y A S S E S S M E N T
Timor-Leste’s performance is mediocre on certain other indicators of health status, such as access to improved sanitation and water source. In 2007, only about 64.7 percent of the population had access to an improved water source. In rural areas, just over half the population had access to drinkable water in 2001/02.41 By comparison, a median of 70.0 percent of the population in LI-Asia and 61.5 percent of the LI population had access to an improved water source. Similarly, only 48.5 percent of Timor-Leste’s population had access to improved sanitation—slightly better than the LI median of 35.5 percent and comparable to the LI-Asia median of 39.0 percent. Even so, these figures represent gross inadequacies in the provision of basic facilities and have contributed to the prevalence of many communicable diseases, such as diarrhea, tuberculosis (TB), and malaria. For instance, Timor-Leste registered 713 cases of TB per 100,000 people in 2005, which on a global basis is better than only the prevalence rates in Togo (753), Sierra Leone (905), Kenya (936), Djibouti (1,161) and Swaziland (1,211).42
To tackle the dire health situation, the government has steadily increased public expenditure on health from 6.2 percent of nonpetroleum GDP in 2000 to 8.8 percent of nonpetroleum GDP in 2004. This is better than all comparable benchmarks, the highest of which, for Cape Verde, stood at 3.9 percent of GDP in 2004. However, despite its reputation as one of the most effective public agencies in terms of budget execution, excessive centralization of procedures in Timor-Leste’s Ministry of Health may still dampen the reach and efficiency of service delivery.43
Potential Conflict Recovery Priorities Improving the health status of the Timorese population in the aftermath of conflict will require a three-pronged approach: systems and service upgrades, public education for health, and training for health professionals. Among these concerns, the first and the most immediate core issue features not only resumption of health services and reestablishment of infrastructure (initiatives already underway in Timor-Leste), but also general sectorwide reform to improve the efficiency of public investments in health. Particularly pressing needs remain in maternal care, child nutrition, and communicable diseases. The second core issue, for the medium term, is the initiation of national campaigns to increase awareness about health standards—e.g., the use and benefits of family planning and healthy sanitary practices—and about existing public health services. The third core issue, for the medium to long term, is remedying shortfalls in the supply of health care professionals through improved educational systems. Significant scope for donor assistance exists in the health sector, from helping improve the efficiency of public health expenditure to reinforcing efforts to address the most serious health problems (e.g., maternal health, child nutrition, and communicable diseases).
41 The World Bank Group and the Asian Development Bank, Economic and Social Development Brief, August 2007, 37.
42 UNDP, Human Development Report, 2007/2008. http://hdrstats.undp.org/countries/data_sheets/cty_ds_TMP.html. Accessed: January 11, 2008.
43 World Bank Group and Asian Development Bank, Economic and Social Development Brief, August 2007, 36.

P R I V A T E S E C T O R E N A B L I N G E N V I R O N M E N T 45
EDUCATION
Performance Review Like health, education is a fundamental investment in human capital and a basic input for transformational growth and poverty reduction. Education is strongly associated with better family health and nutrition, greater economic opportunities, smaller family size, and other profound socioeconomic changes. In addition, in conflict and postconflict societies, education can diminish grievances by eliminating historic inequities in educational access and fostering equal economic opportunities. In the case of Timor-Leste, a well-founded and broad-based educational system can also help steer the increasing youth population away from violence into more productive economic activities.
With a youth bulge of over 40 percent (See Demography and Environment, p. 18), Timor-Leste faces an urgent need to expand and improve educational services. About 77.0 percent of youth are literate, the most literate youth generation in Timor-Leste’s history. This is on par with or better than the LI-Asia and LI medians (77.4 percent and 70.4 percent respectively) and reflects Timor-Leste’s high gross primary enrolment rates. But Timor-Leste experiences a troublingly high drop-out rate: of those entering primary education, less than half (47 percent) were estimated to have reached grade 6 (2001 data). In LI-Asia and LI, corresponding persistence rates are 67.8 percent and 69.2 percent, respectively, and in the comparators, primary persistence rates exceed those of Timor-Leste by 30 to 50 points. In 2003, the net secondary enrolment rate in Timor-Leste was 26.0 percent, much lower than the LI-Asia median of 36.5 percent and the comparators—Cape Verde has a rate of 57.5 percent—but significantly above the LI median of 19.7 percent. Of Timor-Leste’s enrolled secondary students, only 34 percent completed junior secondary and 27 percent senior secondary school.44 Timor-Leste fared much better in gross tertiary enrollment, which in 2002 stood at 10.2 percent. This compares to median net tertiary enrollment rates of 6.3 percent in LI-Asia and just 2.6 percent for LI.
The most direct impact of Timor-Leste’s conflict on education may be the steep decrease in net primary enrolment rates, which dropped from 74.1 percent in 2004/05 to 64.3 percent in the next year after the resurgence of violence in mid-2006.45 Nevertheless, even the higher pre-2006 rate of net primary enrollment is significantly lower than the LI-Asia median of 87.4 percent and the rates of all the comparators, which are all above 90 percent. Timor-Leste’s performance is, however, still better than the LI median of 62.2 percent (Figure 4-3).
44 Ibid, 73. 45 Timor-Leste Survey of Living Standards, Interim Statistical Abstract (September 2007)

46 T I M O R - L E S T E E C O N O M I C R E C O V E R Y A S S E S S M E N T
Figure 4-3 Total Net Primary Enrollment Rate, Comparison to Other Countries, Most Recent Year
Net primary enrollment rates must be improved to provide economic prospects for Timorese youth.
93.996.290.187.464.3 62.20
10
20
30
40
50
60
70
80
90
100
110
Timor-Leste LI-Asia LI Cape Verde Fiji Vanuatu
Per
cent
Source: Timor-Leste Standards of Living Survey: Interim Statistical Abstract, Sept. 2007 & UNESCO
Institute for Statistics CAS code: C32P1a
Educational enrollment statistics provide insight into the coverage of educational services but do not measure the quality of education, which is not easily quantifiable. A common but crude indicator of education quality is the pupil-teacher ratio. In 2005/06, the pupil-teacher ratio in primary schools was about 37.0 percent.46 This is slightly better than the LI-Asia median (37.2 percent) and the LI median (41.0 percent) but remains high in absolute terms. Public expenditure on education is still another very rough quality-of-education indicator. For Timor-Leste, public educational expenditure (2005/06) was 2 percent of the GDP, in line with most comparators. In addition, the government started a School Grants Scheme at the end of 2006 and has disbursed about US$900,000 to schools.47
Potential Conflict Recovery Priorities For postconflict recovery in Timor-Leste, the most immediate core issue facing education is similar to that in the health sector—reestablishment of education systems that may have been damaged or destroyed in the course of the conflict. Timor-Leste, however, faces even more fundamental challenges than the restoration of existing services. The first of these is expanding educational services and infrastructure, including classrooms and learning materials, to accommodate a rapidly growing youth population. The second is extensive recruitment, training, and capacity development to improve teacher competency and ensure the quality of education.
46 World Bank Group and Asian Development Bank, Economic and Social Development Brief, August 2007, 36. 47 IFC and Asian Development Bank, Economic and Social Development Brief, August 2007, 19.

P R I V A T E S E C T O R E N A B L I N G E N V I R O N M E N T 47
Part of this effort, from immediate recovery to long-term development, must be to raise educational retention rates, especially at the primary level, but also in secondary school.
EMPLOYMENT AND WORKFORCE
Current Situation The most important mechanism for delivering the benefits of growth to postconflict economies is to provide increased and enhanced earning opportunities, whether in informal activities, self-employment, or formal jobs. In Timor-Leste, the lack of employment opportunities, particularly for youth, fuels civil unrest and may have been partly to blame for the resurgence of violence in 2006. More generally, unemployment and underemployment depress incomes, which limit effective demand, and in a vicious cycle, in turn reduce economic activity. Job creation is thus paramount for Timor-Leste’s short-term stability and long-term development.
Open unemployment for Timor-Leste is reported at about 7 percent of the workforce, but this is probably an underestimate and in any event masks substantial underemployment throughout the country.48 Most critically, youth unemployment in Timor-Leste is estimated at a staggering 43 percent, including 59 percent in Dili and Baucau and about 15 percent in rural areas. 49 By contrast, both LI-Asia and LI reported youth unemployment at less than one-quarter Timor-Leste’s rates (Figure 4-4).
Figure 4-4 Youth Unemployment Rate
Youth unemployment is worryingly high and threatens Timor-Leste’s social stability. Comparison to Other Countries, Most Recent Year
43.0 11.1 11.70
5
10
15
20
25
30
35
40
45
50
Timor-Leste LI-Asia LI
Per
cent
Source: IFC and ADB Economic and Social Development Brief, 2007 CAS code: Not a standard indicator
48 Democratic Republic of Timor-Leste, Combating Poverty as a National Cause, March 2006, 27. 49 IFC and Asian Development Bank, Economic and Social Development Brief, August 2007, 75.

48 T I M O R - L E S T E E C O N O M I C R E C O V E R Y A S S E S S M E N T
Unemployment and underemployment—for youth or otherwise—derive from a stagnant economy hard pressed to absorb an ever-increasing number of workers. First, total labor force participation in Timor-Leste is rising, moving from 69.3 percent of the working age population in 2001 to 72.3 percent in 2005. This is in line with the LI-Asia median of 71.6 percent and Fiji’s 70.7 percent, but well below Vanuatu’s 88.9 percent (albeit significantly higher than Cape Verde’s 57.8 percent). Second, the number of youthful entrants to the labor force is increasing sharply and will continue to do so—as the youth bulge makes plain (see Demography and Environment, p. 18). Finally, the conflict has exacerbated unemployment and underemployment pressures. A fairly large number of jobs disappeared throughout the economy with the withdrawal of the Indonesians, and a significant proportion of the population is still displaced, having lost livelihood in the unrest and unable to find employment since.
It is notable that unemployment is due more to economic factors than to rigidity in the labor market. According to the World Bank’s Rigidity of Employment Index (where 0 equates to minimum rigidity and 100 to maximum rigidity) Timor-Leste received a score of 34 in 2007. This is on par with the LI-Asia median of 31 and better than Cape Verde’s score of 44 but somewhat worse than Fiji’s score of 14 and Vanuatu’s score of 24.
Potential Conflict Recovery Priorities Immediately addressing the mounting demographic pressures by creating jobs for disenfranchised youth and IDPs is essential. A core issue will be creation of jobs in the formal sector. As of 2004 (the latest year for which data are available) 93 percent of Timor-Leste’s workforce worked in the informal sector.50 In the short term, the government and donor agencies might establish emergency employment programs to ease civil unrest and accelerate reconstruction. For instance, the World Bank estimates that a public works program initially employing 50,000 workers for 50 days and increasing to 100,000 workers for 75 days would cost only about $25 million per year. Another core issue will be to create good income-generating opportunities for youth in rural areas. by energizing and modernizing the agricultural economy. Resolving such issues involves formal job training programs, private sector investment in agriculture and agribusiness, and initiatives to create rural-urban value chains linked to domestic markets and overseas markets.
AGRICULTURE
Performance Review For a largely rural society in which over 80 percent of the workforce is employed in farming and related activities, postconflict economic recovery for Timor-Leste in large part means raising output and incomes in the agricultural sector. Achieving progress in agriculture will be difficult: constraints in the rural sector are longstanding and have been reinforced by the turmoil of the past few years. This includes the disappearance of the pre-independence government of Indonesia system that regulated the agricultural economy heavily—centralized structures of collection, distribution, and logistics and agricultural credit operated by the national agency BULOG and the
50 Asian Development Bank, Gender and Nation Building in Timor-Leste: Country Gender Assessment. November 2005.

P R I V A T E S E C T O R E N A B L I N G E N V I R O N M E N T 49
local provincial agency DOLOG—and the liberalization of food imports. Farmers have faced painful adjustments, and a new fully-functioning and integrated market-based system has only begun to emerge to help. The rapid modernization of Timor-Leste’s agriculture is essential, and some near-term successes in this regard will go far toward promoting stability. as well as accelerating long-term economic growth and development.
Agriculture in Timor-Leste is based on low-input, low-output subsistence farming systems. Households typically farm maize, cassava, rice—the main staple crops—plus garden crops and livestock (chickens, pigs, goats, and cattle). Coffee for export is the main cash crop and engages over one-quarter of Timor-Leste farming households. Like other crops, coffee is grown with limited inputs and modern techniques. Agricultural sector output has been increasing very slowly. The overall index of crop production (1999/2001 = 100) for Timor-Leste stood at 106.7 in 2004, indicating an expansion of output averaging only 1.9 percent per year over the previous five years. The rate is below the median for LI-Asia and LI, both at about 2 percent per year. Coffee production declined in 2006, and exports amounted to only about $6 million, as the conflict coincided with the picking cycle.51
The rate of growth in Timor-Leste’s agricultural output is well below the nation’s rate of population increase (see Demography and Environment, p. 18). This fact, together with frequent adverse weather events such as severe drought and flooding, and the disruptions of social and political unrest, has meant that Timor-Leste suffers from serious deficits of staple cereals (maize and rice) that form the basis of household diets. Food insecurity is therefore widespread, with only 36 percent of the population estimated to be food secure and 43 percent food insecure or highly vulnerable.52Timor-Leste imports rice and other cereal—on average about 55,000 MT per year. Availability of such low-cost imported rice and other cereals, which helps Timor-Leste’s urban sector, little benefits the rural population, however, because it puts downward pressure on prices of local farm output and depresses rural incomes, with the result that rural subsistence households frequently lack the means to make purchases in lean times.
Raising productivity is the principal challenge for developing Timor-Leste’s agricultural sector. Yields for all crops are very low. For example, average yields for paddy in Timor-Leste are estimated at 1.4 MT per ha, versus 4.6 MT in Thailand and 4.5 MT in Indonesia; and for maize at 1.2 MT per ha, versus an Asia region average of 1.2 MT per ha. Coffee yields in Timor-Leste average between 150 and 200 kg per ha, versus 2 MT per ha in New Guinea.53 Postharvest losses of up to 25 percent or more contribute to such low yields. With these low yields and a rapidly rising rural population, the real productivity of agricultural labor in Timor-Leste has been stagnant or declining (Figure 4-5). In 2004, the latest year for which data are available, value-added per worker in agriculture was $284, essentially unchanged from five years before, but slightly below the LI median ($288) and well below the median for LI-Asia ($318). With stagnant
51 Only 1,800 MT of green coffee was exported in 2006, compared to a potential for 5,000 to 8,000 MT in good production years. FAO/World Food Program, Special Report FAO/WFP, Crop and Food Supply Assessment Mission to Timor-Leste, June 21, 2007. 52 Ibid. Table 5. 53 WFP, Timor-Leste: Market Profile for Emergency Food Security Assessments, April 2006, 15 and. 27.
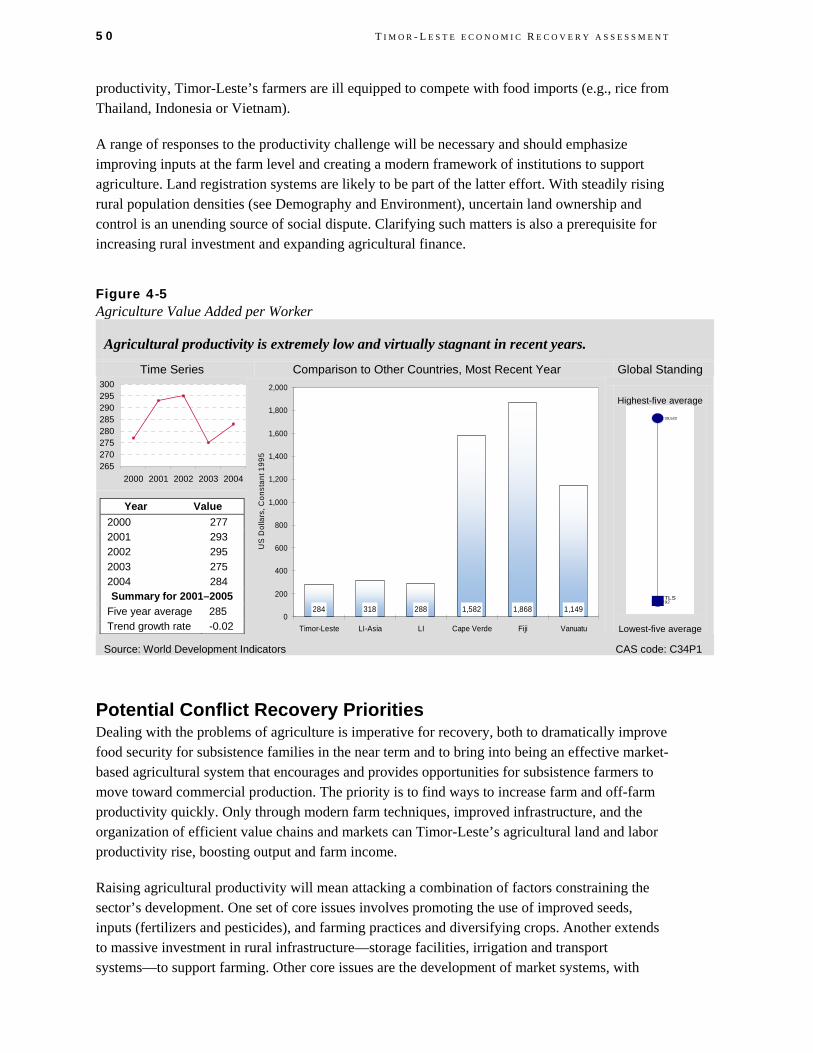
50 T I M O R - L E S T E E C O N O M I C R E C O V E R Y A S S E S S M E N T
productivity, Timor-Leste’s farmers are ill equipped to compete with food imports (e.g., rice from Thailand, Indonesia or Vietnam).
A range of responses to the productivity challenge will be necessary and should emphasize improving inputs at the farm level and creating a modern framework of institutions to support agriculture. Land registration systems are likely to be part of the latter effort. With steadily rising rural population densities (see Demography and Environment), uncertain land ownership and control is an unending source of social dispute. Clarifying such matters is also a prerequisite for increasing rural investment and expanding agricultural finance.
Figure 4-5 Agriculture Value Added per Worker
Agricultural productivity is extremely low and virtually stagnant in recent years.
Time Series Comparison to Other Countries, Most Recent Year Global Standing
265270275280285290295300
2000 2001 2002 2003 2004
Year Value 2000 277 2001 293 2002 295 2003 275 2004 284 Summary for 2001–2005
Five year average 285 Trend growth rate -0.02
284 318 288 1,582 1,868 1,1490
200
400
600
800
1,000
1,200
1,400
1,600
1,800
2,000
Timor-Leste LI-Asia LI Cape Verde Fiji Vanuatu
US
Dol
lars
, Con
stan
t 199
5
Highest-five average
39,522
92TLS
Lowest-five average
Source: World Development Indicators CAS code: C34P1
Potential Conflict Recovery Priorities Dealing with the problems of agriculture is imperative for recovery, both to dramatically improve food security for subsistence families in the near term and to bring into being an effective market-based agricultural system that encourages and provides opportunities for subsistence farmers to move toward commercial production. The priority is to find ways to increase farm and off-farm productivity quickly. Only through modern farm techniques, improved infrastructure, and the organization of efficient value chains and markets can Timor-Leste’s agricultural land and labor productivity rise, boosting output and farm income.
Raising agricultural productivity will mean attacking a combination of factors constraining the sector’s development. One set of core issues involves promoting the use of improved seeds, inputs (fertilizers and pesticides), and farming practices and diversifying crops. Another extends to massive investment in rural infrastructure—storage facilities, irrigation and transport systems—to support farming. Other core issues are the development of market systems, with

P R I V A T E S E C T O R E N A B L I N G E N V I R O N M E N T 51
better information flows to farmers and traders, and reliable logistics and marketing channels that tie the countryside to domestic markets for crops, livestock, and inputs, and to export markets for coffee and other future diversified agroexport items. And a final core issue revolves around the creation of a modern institutional framework to serve agriculture, both in the private sector—financial institutions to supply credit, as well as private firms to act as embedded suppliers of seeds and other inputs and services54—and in the public sector, in the form of effective extension and plant and animal health services, and land registration. Public sector investment in infrastructure and service delivery, coupled with donor assistance and technical expertise focusing on specialized problems (e.g., food security systems, postharvest handling technologies, and value chain linkage building and marketing information development) will be called for in addressing the agricultural productivity priority.
54 In Timor-Leste’s important coffee sector, cooperatives have played and will continue to be a key institution for supplying value-adding services and inputs to producers.


Appendix. CAS Methodology CRITERIA FOR SELECTING INDICATORS The economic recovery evaluation in this report is designed to balance the need for broad coverage and diagnostic value, on the one hand, and the requirement of brevity and clarity, on the other. The analysis covers 15 economic growth–related topics, and approximately 100 variables. For the sake of brevity, the write-up in the text highlights issues for which the “dashboard lights” appear to be signaling problems, which suggest possible priorities for USAID intervention. The accompanying table provides a full list of indicators examined for this report. The separate Data Supplement contains the complete data set for Timor-Leste, including data for the benchmark comparisons, and technical notes for every indicator.55
The first level identifies critical constraints by examining a limited number of primary indicators that address the questions: What are the conflict-related obstacles to economic growth? What are the economic performance obstacles to peace? How intense is or was the conflict episode? How delicate is the situation? In addition, some of the level I indicators are descriptive variables such as per capita income, the structure of the labor force, and the occurrence of youth bulge. The second level of analysis examines supporting indicators that shed light on why performance is strong or weak.
When Level I indicators suggest weak performance, we review a limited set of diagnostic supporting indicators. Level II indicators reflect constraints or determinants of performance outcomes, or provide additional detail to help diagnose the problems.56
The indicators have been selected on the basis of the following criteria. Each must be accessible through USAID’s Economic and Social Database or convenient public sources, particularly on the Internet. They should be available for a large number of countries, including most USAID client states, to support the benchmarking analysis. The data should be sufficiently timely to support an assessment of country performance that is suitable for strategic planning purposes. Data quality is another consideration. For example, subjective survey responses are used only when actual measurements are not available. Aside from a few descriptive variables, the indicators must also be useful for diagnostic purposes. Preference is given to measures that are widely used, such as Millennium Development Goal indicators, or evaluation data used by the
55 The Data Supplement is available on line at http://www.nathaninc.com/projects/projectdetails.asp?pid=138&pfid=0&rpid=4&rid=9 .
56 The distinction between Level I and Level II indicators is not always clear-cut. In many cases, it is difficult to find readily available discerning and broadly applicable diagnostic indicators.

A - 2 A P P E N D I X
Millennium Challenge Corporation. Finally, an effort has been made to minimize redundancy. If two indicators provide similar information, preference is given to one that is simplest to understand, or most widely used. For example, both the Gini coefficient and the share of income accruing to the poorest 20 percent of households can be used to gauge income inequality. We use the income share because it is simpler and more sensitive to changes.
For some indicators that are particularly important, we apply these criteria loosely because of a lack of data in conflict and postconflict countries.
BENCHMARKING METHODOLOGY Comparative benchmarking is the main tool used to evaluate each indicator. The benchmarking analysis draws on several criteria, all related to conflict and neighboring situations.
• Income-Region: Variables are also examined against the median of low-income Asia.
• Three comparator countries. When pertinent, the indicator values are compared to values of three comparator countries—Cape Verde, Fiji, and Vanuatu—where so designated by the USAID mission in the target country or by USAID/EGAT/EG.
When possible, time-series data for the past five years will be examined to get the values and the five-year average growth rate. In interpreting the indicators, one can examine the most recent value, the multiyear average, or growth rates. In most cases, however, this time analysis will not be possible because of data limitations.
Finally, when relevant, Timor-Leste’s performance is weighed against absolute standards. For example, a double-digit inflation rate is a sign of macroeconomic problems, regardless of the regional comparisons or other benchmark results.

A - 3 C A S M E T H O D O L O G Y
POSTCONFLICT CAS INDICATORS Indicator Level a MDG, MCA, EcGov, CAS std b
Economic Growth and Postconflict Recovery
Failed State Index score I
Episode of significant violence, highest magnitude in previous 10 years I
Type of conflict, highest magnitude in previous 10 years I
Magnitude of societal-systemic impact, highest magnitude in previous 10 years I
Per capita GDP, $PPP I CAS std, I;
Real GDP growth (non-oil) I CAS std, I;
Gross fixed investment, % GDP II CAS std, II;
Disarmament, Demobilization and Reintegration II
Human Rights Index II
Refugees and IDPs per capita II
Poverty and Inequality
Income share, poorest 20% I CAS std, I;
Population living on less than $1 PPP per day I MDG; CAS std, I;
Population living below national poverty line I MDG; CAS std, I;
Human Poverty Index I
Population below minimum dietary energy consumption II MDG; CAS std, II;
Economic Structure
Output structure I CAS std, I;
Labor force structure I CAS std, I;
Adjusted savings: energy depletion, % GNI II
Adjusted savings: mineral depletion, % GNI II
Demography and Environment
Adult literacy rate I CAS std, I;
Youth dependency rate I CAS std, I;
Youth bulge I
Environmental performance index I CAS std, I;
Population growth rate I CAS std, I;
Rural population density I
Percentage of population living in urban areas I CAS std, I;
Frequency and scope of natural disasters II
Net migration rate II
Gender and Children
Gender empowerment measure I
Girls’ primary completion rate I MCA; CAS std, I;
Gross enrollment rate, all levels of education, male and female I MDG; CAS std, I;
Life expectancy, male and female I CAS std, I;

A - 4 A P P E N D I X
Indicator Level a MDG, MCA, EcGov, CAS std b
Labor force participation rate, male and female I CAS std, I;
Internally displaced females, per capita II
Use of child soldiers, government and political groups II
Economic Stabilization and Government Capacity
Govt. Effectiveness Index I
Govt. expenditure, % non-oil GDP I EcGov; CAS std, I;
Govt. revenue, % non-oil GDP I EcGov; CAS std, I;
Money supply growth I EcGov; CAS std, I;
Inflation rate I MCA; CAS std, I;
Overall govt. budget balance, including grants, % non-oil GDP II MCA, EcGov; CAS std, I;
Interest payments and total govt. expenditure II CAS std, II;
Subsidies and other current transfers and total govt. expenditure II CAS std, II;
Institutional capacity II
Business Environment
Control of corruption index I CAS std, I;
Rule of law index I MCA, EcGov; CAS std, I;
Voice and accountability I
Ease of doing business index I EcGov; CAS std, I;
Time to start a business II MCA; EcGov; CAS std, II;
Procedures to start a business II EcGov; CAS std, II;
Cost of starting a business II MCA; EcGov; CAS std, II;
Time to enforce a contract II EcGov; CAS std, II;
Procedures to enforce a contract II EcGov; CAS std, II;
Cost to enforce a contract, % claim II
Time to register property II EcGov; CAS std, II;
Financial Sector
Domestic credit to private sector, % GDP I CAS std, I;
Interest rate spread I CAS std, I;
Money supply, % GDP I CAS std, I;
Real Interest rate II CAS std, II;
Banking sector default rates II
External Sector
Aid , % GNI I CAS std, I;
Current account balance, % GDP I CAS std, I;
Debt service ratio, % exports I MDG; CAS std, I;
Export growth of (non-oil) goods and services I CAS std, I;
Foreign direct investment, % GDP I CAS std, I;
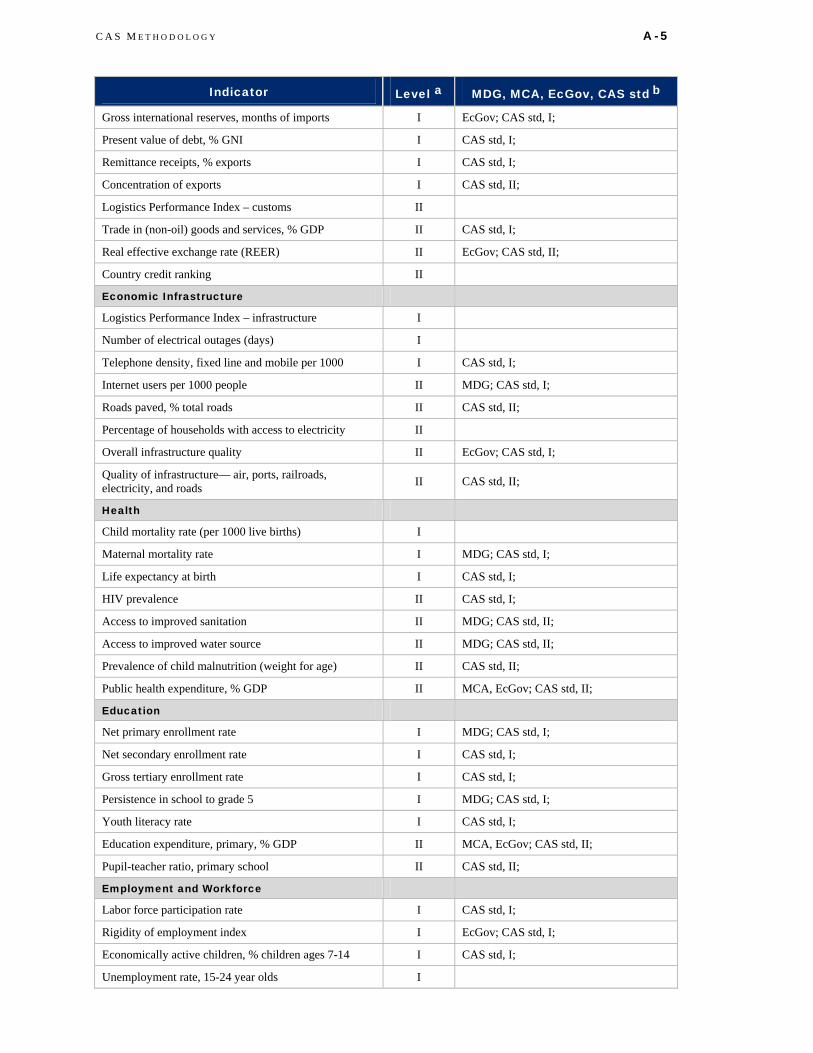
A - 5 C A S M E T H O D O L O G Y
Indicator Level a MDG, MCA, EcGov, CAS std b
Gross international reserves, months of imports I EcGov; CAS std, I;
Present value of debt, % GNI I CAS std, I;
Remittance receipts, % exports I CAS std, I;
Concentration of exports I CAS std, II;
Logistics Performance Index – customs II
Trade in (non-oil) goods and services, % GDP II CAS std, I;
Real effective exchange rate (REER) II EcGov; CAS std, II;
Country credit ranking II
Economic Infrastructure
Logistics Performance Index – infrastructure I
Number of electrical outages (days) I
Telephone density, fixed line and mobile per 1000 I CAS std, I;
Internet users per 1000 people II MDG; CAS std, I;
Roads paved, % total roads II CAS std, II;
Percentage of households with access to electricity II
Overall infrastructure quality II EcGov; CAS std, I;
Quality of infrastructure— air, ports, railroads, electricity, and roads II CAS std, II;
Health
Child mortality rate (per 1000 live births) I
Maternal mortality rate I MDG; CAS std, I;
Life expectancy at birth I CAS std, I;
HIV prevalence II CAS std, I;
Access to improved sanitation II MDG; CAS std, II;
Access to improved water source II MDG; CAS std, II;
Prevalence of child malnutrition (weight for age) II CAS std, II;
Public health expenditure, % GDP II MCA, EcGov; CAS std, II;
Education
Net primary enrollment rate I MDG; CAS std, I;
Net secondary enrollment rate I CAS std, I;
Gross tertiary enrollment rate I CAS std, I;
Persistence in school to grade 5 I MDG; CAS std, I;
Youth literacy rate I CAS std, I;
Education expenditure, primary, % GDP II MCA, EcGov; CAS std, II;
Pupil-teacher ratio, primary school II CAS std, II;
Employment and Workforce
Labor force participation rate I CAS std, I;
Rigidity of employment index I EcGov; CAS std, I;
Economically active children, % children ages 7-14 I CAS std, I;
Unemployment rate, 15-24 year olds I

A - 6 A P P E N D I X
Indicator Level a MDG, MCA, EcGov, CAS std b
Informal sector employment, % labor force II
Agriculture
Agriculture value added per worker I CAS std, I;
Crop production index II EcGov; CAS, std, II;
Agricultural export growth II CAS, std, II;
a Level I = primary performance indicators, Level II = supporting diagnostic indicators
b MDG—Millennium Development Goal indicator; MCA—Millennium Challenge Account indicator; EcGov—Major indicators of economic governance, which is defined in USAID’s Strategic Management Interim Guidance to include “microeconomic and macroeconomic policy and institutional frameworks and operations for economic stability, efficiency, and growth.” The term therefore encompasses indicators of fiscal and monetary management, trade and exchange rate policy, legal and regulatory systems affecting the business environment, infrastructure quality, and budget allocations; CAS std –Standard CAS template indicator for template version, December 2006.

Appendix B. Data Supplement This supplement presents a full tabulation of the data and international benchmarks examined for this report, along with technical notes on the data sources and definitions.


Economic Growth and Post Conflict Recovery
Statistical Capacity Indicator
Failed State Index Score
Episode of significant
violence, highest magnitude in
previous 10 years
Type of conflict, highest magnitude
in previous 10 years
Magnitude of societal-systemic impact, highest magnitude in
previous 10 yearsPer Capita GDP,
$PPPReal GDP Growth
(non-oil)
Gross Fixed Investment, % non-
oil GDP
Disarmament, Demobilization and
ReintegrationHuman Rights
IndexRefugee and IDP's
per Capita
Indicator Number C01P1 C11P1 C11P2 C11P3 C11P4 C11P5 C11P6 C11S1 C11S2 C11S3 C11S4Timor-Leste Data
Latest Year (T) 2007 2007 . . . 2006 2006 2006 . 2006 2006Value Year T 36.0 94.9 1976-1992 CW 5.0 1,670 -2.9 17.1 0 3.5 0.2Value Year T-1 30.0 . 1999-* CV 2.0 1,714 2.3 17.2 . 2.0 .Value Year T-2 32.0 . . . . 1,675 0.3 17.3 . 2.5 .Value Year T-3 . . . . . 1,679 -6.2 23.1 . 2.0 .Value Year T-4 . . . . . 1,820 -6.7 28.0 . 2.0 .Average Value, 5 year . . . . . 1,712 -2.6 20.6 . 2.4 .Growth Trend . . . . . -1.5 . -12.8 . 11.2 .
Benchmark Data Latest Year Cape Verde 2007 2007 . . . 2006 2006 2005 . 2006 .Cape Verde Value Latest Year 58.0 81.1 . . . 7,344 6.5 37.9 0 0.5 . Latest Year Fiji 2007 2007 . . . 2006 2006 2000 . 2006 .Fiji Value Latest Year 52.0 75.7 . . . 6,120 3.6 11.5 0 1.0 . Latest Year Vanuatu 2007 . . . . 2006 2006 1999 . 2006 .Vanuatu Latest Year 46.0 . . . . 3,514 5.5 20.2 0 0.5 .LI-Asia Median 69.5 90.4 . . . 2,741 8.2 28.8 0 3.0 .Low Income Median 56.5 90.9 . . . 1,752 6.0 20.1 0 3.0 .High Five Avg. . 111.0 . . . 50,834 18.9 49.7 . 4.9 .Low Five Avg. . 18.9 . . . 759 -2.5 7.9 . 0.5 .
* = ongoing
B-1

Poverty and Inequality
Incomes-share, Poorest 20%
Population living on less than $1
PPP per day
Population living below national
poverty line
Human Poverty Index (0 for
excellent to 100 for poor)
Population below minimum dietary
energy consumption
Indicator Number C12P1 C12P2 C12P3 C12P4 C12S1Timor-Leste Data
Latest Year (T) . 2004 2004 2004 2002Value Year T . 21.5 41.5 41.8 8.0Value Year T-1 . . . . .Value Year T-2 . . . . .Value Year T-3 . 20.0 39.5 . .Value Year T-4 . . . . .Average Value, 5 year . . . . .Growth Trend . . . . .
Benchmark Data Latest Year Cape Verde . . . 2004 .Cape Verde Value Latest Year . . . 15.8 . Latest Year Fiji 2004 . 2004 2004 2002Fiji Value Latest Year 2.4 . 35.2 21.2 4.0 Latest Year Vanuatu . . . 2004 2002Vanuatu Latest Year . . . 24.6 12.0LI-Asia Median . . . 65.0 20.0Low Income Median . . . 75.5 28.0High Five Avg. . . . 55.7 67.0Low Five Avg. . . . 3.7 2.5
B-2
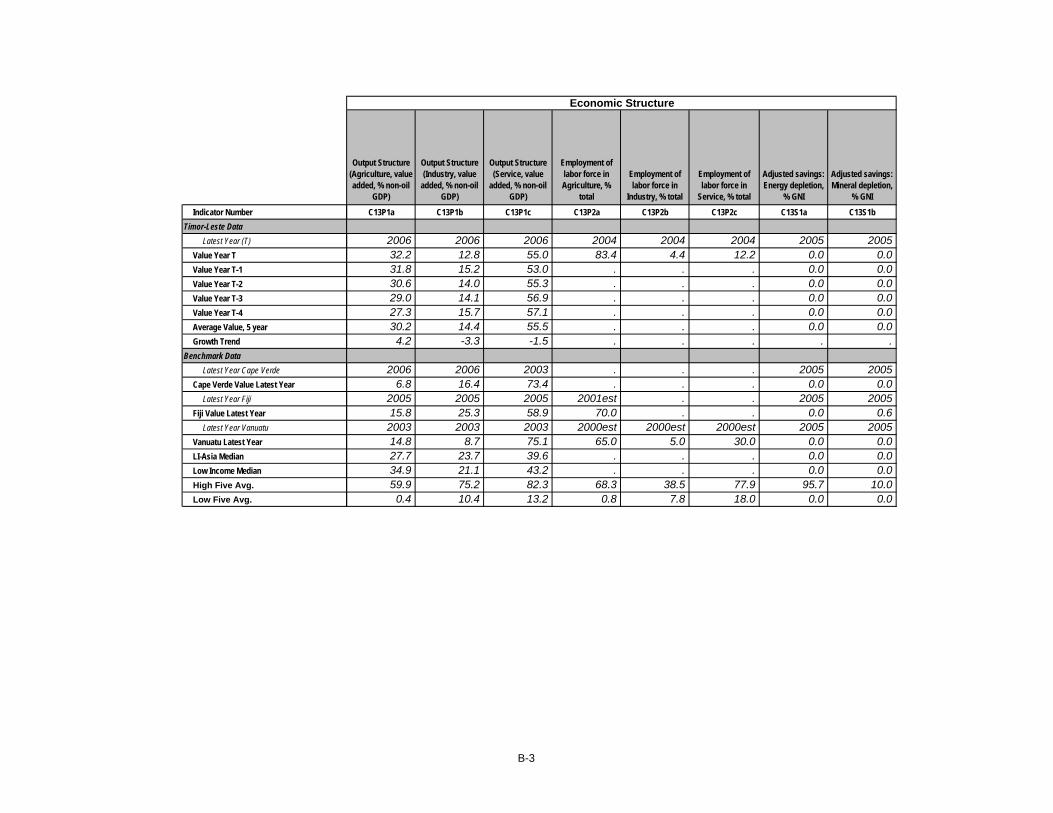
Economic Structure
Output Structure (Agriculture, value added, % non-oil
GDP)
Output Structure (Industry, value
added, % non-oil GDP)
Output Structure (Service, value
added, % non-oil GDP)
Employment of labor force in Agriculture, %
total
Employment of labor force in
Industry, % total
Employment of labor force in
Service, % total
Adjusted savings: Energy depletion,
% GNI
Adjusted savings: Mineral depletion,
% GNI
Indicator Number C13P1a C13P1b C13P1c C13P2a C13P2b C13P2c C13S1a C13S1bTimor-Leste Data
Latest Year (T) 2006 2006 2006 2004 2004 2004 2005 2005Value Year T 32.2 12.8 55.0 83.4 4.4 12.2 0.0 0.0Value Year T-1 31.8 15.2 53.0 . . . 0.0 0.0Value Year T-2 30.6 14.0 55.3 . . . 0.0 0.0Value Year T-3 29.0 14.1 56.9 . . . 0.0 0.0Value Year T-4 27.3 15.7 57.1 . . . 0.0 0.0Average Value, 5 year 30.2 14.4 55.5 . . . 0.0 0.0Growth Trend 4.2 -3.3 -1.5 . . . . .
Benchmark Data Latest Year Cape Verde 2006 2006 2003 . . . 2005 2005Cape Verde Value Latest Year 6.8 16.4 73.4 . . . 0.0 0.0 Latest Year Fiji 2005 2005 2005 2001est . . 2005 2005Fiji Value Latest Year 15.8 25.3 58.9 70.0 . . 0.0 0.6 Latest Year Vanuatu 2003 2003 2003 2000est 2000est 2000est 2005 2005Vanuatu Latest Year 14.8 8.7 75.1 65.0 5.0 30.0 0.0 0.0LI-Asia Median 27.7 23.7 39.6 . . . 0.0 0.0Low Income Median 34.9 21.1 43.2 . . . 0.0 0.0High Five Avg. 59.9 75.2 82.3 68.3 38.5 77.9 95.7 10.0Low Five Avg. 0.4 10.4 13.2 0.8 7.8 18.0 0.0 0.0
B-3

Demography and Environment
Environmental
Adult literacy rateYouth dependency
rate Youth BulgePerformance Index
(1 to 100)Population growth
rateRural population
density Urbanization rateFrequency of
natural disastersScope of natural
disasters Net migration rate
Indicator Number C14P1 C14P2 C14P3 C14P4 C14P5 C14P6 C14P7 C14S1a C14S1b C14S2Timor-Leste Data
Latest Year (T) 2004 2004 2004 . 2006 2003 2005 2007 2006 2007Value Year T 45.8 81.6 43.2 . 3.3 533.7 26.5 1.0 0.0 0.0Value Year T-1 . . . . 6.3 508.6 26.1 0.0 0.0 .Value Year T-2 . . . . 2.3 484.7 25.7 0.0 0.0 .Value Year T-3 . . . . 2.0 493.0 25.3 0.0 0.0 .Value Year T-4 . . . . 12.6 493.1 24.9 0.0 0.0 .Average Value, 5 year . . . . 5.3 502.6 25.7 0.2 0.0 .Growth Trend . . . . -15.3 1.9 1.6 . . .
Benchmark Data Latest Year Cape Verde 2002 2005 . . 2005 2003 2005 2007 2006 2007Cape Verde Value Latest Year 75.7 70.4 . . 2.3 465.4 57.3 0.0 0.0 -11.8 Latest Year Fiji . 2005 . . 2005 2003 2005 2007 2006 2007Fiji Value Latest Year . 49.2 . . 0.8 209.3 50.8 0.0 45.9 -2.8 Latest Year Vanuatu 2006 2005 . . 2005 2003 2005 2007 2006 2007Vanuatu Latest Year 74.0 70.4 . . 1.9 784.9 23.5 0.0 0.0 0.0LI-Asia Median 61.0 37.7 . 51.3 2.0 474.6 25.1 1.7 135.1 0.0Low Income Median 59.4 42.6 . 51.0 2.2 421.2 30.6 1.7 110.0 0.0High Five Avg. 99.7 48.5 . 86.9 4.4 5,510.8 98.6 7.2 25,659.4 18.4Low Five Avg. 24.7 14.0 . 31.8 -0.7 10.7 11.9 0.0 0.0 -10.4
B-4

Gender and Children
Gender Empowerment Measure (0 for poor to 1 for
excellent)Girls' Primary
completion rateMale Gross
enrollment rateFemale Gross
enrollment rateMale Life
expectancy at birthFemale Life
expectancy at birthMale Labor force participation rate
Female Labor force participation
rate
Internally displaced females
per capita
Use of Child Soldiers -
GovernmentUse of Child
Soldiers - Political
Indicator Number C15P1 C15P2 C15P3a C15P3b C15P4a C15P4b C15P5a C15P5b C15S1 C15S2a C15S2bTimor-Leste Data
Latest Year (T) . . 2005 2005 2005 2005 2004 2004 . 2004 2004Value Year T . . 100.0 97.0 55.6 57.8 69.0 52.0 . N NValue Year T-1 . . . . . . . . . . .Value Year T-2 . . . . . . . . . . .Value Year T-3 . . . . 54.1 56.3 . . . . .Value Year T-4 . . . . . . . . . . .Average Value, 5 year . . . . . . . . . . .Growth Trend . . . . . . . . . . .
Benchmark Data Latest Year Cape Verde . 2006/07 2004 2004 2005 2005 2005 2005 . 2004 2004Cape Verde Value Latest Year . 83.3 67.0 67.0 67.7 73.9 78.0 36.6 . P N Latest Year Fiji 2005 2006/07 2004 2004 2005 2005 2005 2005 . 2004 2004Fiji Value Latest Year 0.4 101.4 74.0 76.0 66.1 70.6 83.4 55.0 . N N Latest Year Vanuatu . 2006/07 2004 2004 2005 2005 2005 2005 . 2004 2004Vanuatu Latest Year . 85.9 66.0 61.0 67.7 71.4 89.2 80.3 . N NLI-Asia Median . 76.0 63.5 55.0 62.2 64.2 82.7 55.9 . . .Low Income Median . 52.5 52.5 46.5 53.6 56.8 85.2 60.3 . . .High Five Avg. 0.9 119.8 101.2 106.8 78.9 84.4 94.4 87.0 . 2.0 2.00Low Five Avg. 0.2 21.0 28.0 21.8 40.5 41.7 64.9 19.8 . 0.0 0.00
B-5

Economic Stabilization and Government Capacity
Govt. effectiveness
index (-2.5 for poor to 2.5 for excellent)
Govt. expenditure, % non-oil GDP
Govt. revenue, % non-oil GDP
Money Supply Growth Inflation rate
Overall govt. budget balance, including grants,
% non-oil GDP
Interest payments/total
govt. expenditure
Subsidies and other current transfers/total
govt. expenditureInstitutional
Capacity
Indicator Number C21P1 C21P2 C21P3 C21P4 C21P5 C21S1 C21S2 C21S3 C21S4Timor-Leste Data
Latest Year (T) 2006 2006 2006 2006 2006 2005/06 2005/06 2005/06 2007Value Year T -0.71 40.0 172.0 17.1 3.9 111.0 0.0 8.6 6.00Value Year T-1 -0.92 26.0 137.0 17.1 1.8 77.1 0.0 7.5 .Value Year T-2 -0.77 21.0 98.0 14.8 3.2 11.0 . . .Value Year T-3 -0.96 20.0 31.0 32.4 7.0 3.8 . . .Value Year T-4 -0.92 20.0 24.0 6.8 4.7 . . . .Average Value, 5 year -0.86 25.4 92.4 17.6 4.1 50.7 . . .Growth Trend 5.68 16.5 54.2 12.0 -17.3 . . . .
Benchmark Data Latest Year Cape Verde 2006 2005 2005 2005 2006 2005 2005 2005 .Cape Verde Value Latest Year 0.17 36.3 24.1 14.5 5.4 -5.1 1.6 9.8 . Latest Year Fiji 2006 2005 . 2005 2006 2005 . . .Fiji Value Latest Year -0.10 27.0 . 15.1 2.5 -3.6 . . . Latest Year Vanuatu 2006 2005 2005 2005 2006 1999 . . .Vanuatu Latest Year -0.39 19.8 19.8 11.4 1.6 -0.8 . . .LI-Asia Median -0.86 15.9 . 16.8 6.3 -2.4 . . .Low Income Median -0.89 . . 17.6 7.7 . . . .High Five Avg. 2.17 48.8 46.4 135.0 223.8 6.9 . . .Low Five Avg. -1.78 10.1 8.7 -21.3 0.0 -11.3 . . .
B-6

Business Environment
Control of Voice and Cost to Start a Corruption Index (-2.5 for poor to 2.5
for excellent)
Rule of law index (-2.5 for poor to 2.5
for excellent)
Accountability (-2.5 for poor to 2.5
for excellent)
Ease of Doing Business Ranking
(1 to 178)Time to Start a
Business (days)Procedures to
Start a Business
Business (Min. capital,% of
income per capita)Time to Enforce a Contract (days)
Procedures to Enforce a Contract
Cost to Enforce a Contract (% of
debt)Time to Register Property (days)
Indicator Number C22P1 C22P2 C22P3 C22P4 C22S1 C22S2 C22S3 C22S4 C22S5 C22S6 C22S7Timor-Leste Data
Latest Year (T) 2006 2006 2006 2007 2007 2007 2007 2007 2007 2007 2007Value Year T -0.89 -1.16 -0.33 168 82 9 595 1,800 51 163.2 no practiceValue Year T-1 -0.79 -0.58 -0.20 177 92 10 667 1,800 51 163.2 .Value Year T-2 -0.52 -0.84 0.05 . 92 10 909 1,800 51 163.2 .Value Year T-3 -0.51 -0.74 0.16 . . . . . . .Value Year T-4 -0.53 -1.17 0.19 . . . . . . .Average Value, 5 year -0.65 -0.90 -0.03 . . . . . . .Growth Trend -14.8 2.52 . . . . . . . .
Benchmark Data Latest Year Cape Verde 2006 2006 2006 2007 2007 2007 2007 2007 2007 2007 2007Cape Verde Value Latest Year 0.66 0.61 0.85 132 52 12 53 465 37 24 83.0 Latest Year Fiji 2006 2006 2006 2007 2007 2007 2007 2007 2007 2007 2007Fiji Value Latest Year -0.35 -0.08 -0.38 36 46 8 0 397 34 39 48.0 Latest Year Vanuatu 2006 2006 2006 2007 2007 2007 2007 2007 2007 2007 2007Vanuatu Latest Year 0.20 0.46 0.50 62 39 8 0 430 30 75 188.0LI-Asia Median -0.98 -0.87 -0.99 108 56 . . . . . 69.5Low Income Median -0.91 -0.93 -0.97 146 43 . . . . . 77.7High Five Avg. 2.42 2.00 1.68 176 287 . . . . . 421.0Low Five Avg. -1.63 -1.97 -2.09 3 4 . . . . . 2.
.
.
.
.
4
B-7

Financial Sector
Domestic credit to private sector, %
GDPInterest rate
spreadMoney supply, %
GDP Real Interest rateBanking sector
default rates
Indicator Number C23P1 C23P2 C23P3 C23S1 C23S2Timor-Leste Data
Latest Year (T) 2006 . 2006 . 2007Value Year T 20.7 . 32.0 . 30.4Value Year T-1 29.8 . 27.8 . 24.8Value Year T-2 25.0 . 24.8 . 9.4Value Year T-3 6.5 . 21.5 . 3.2Value Year T-4 . . 15.9 . .Average Value, 5 year 20.5 . 24.4 . 17.0Growth Trend . . 16.6 . .
Benchmark Data Latest Year Cape Verde 2005 2005 2005 2005 .Cape Verde Value Latest Year 39.0 8.9 75.7 11.9 . Latest Year Fiji 2005 2005 2005 2005 .Fiji Value Latest Year 42.2 6.4 50.4 4.2 . Latest Year Vanuatu 2005 2005 2005 2005 .Vanuatu Latest Year 50.2 9.1 108.8 5.1 .LI-Asia Median 18.8 10.0 39.6 6.3 .Low Income Median 12.3 13.6 25.1 11.5 .High Five Avg. 178.4 38.9 194.8 35.3 .Low Five Avg. 2.1 1.4 8.2 -41.2 .
B-8

External Sector
Gross
Aid , % GNICurrent Account Balance, % GDP
Debt service ratio, % exports
Export growth of goods and services
Foreign direct investment, %
GDP
international reserves, months
of imports
Indicator Number C24P1 C24P2 C24P3 C24P4 C24P5 C24P6Timor-Leste Data
Latest Year (T) 2005 2006 2006 . . 2006Value Year T 33.5 116.0 0.0 . . 85.4Value Year T-1 31.8 84.0 0.0 . . 46.0Value Year T-2 41.8 30.0 0.0 . . 13.4Value Year T-3 60.3 -25.0 0.0 . . 3.8Value Year T-4 51.1 -37.0 0.0 . . 2.4Average Value, 5 year 43.7 33.6 0.0 . . 30.2Growth Trend -14.9 . . . . 96.4
Benchmark Data Latest Year Cape Verde 2005 2005 2005 . . 2005Cape Verde Value Latest Year 16.9 -3.5 6.4 . 5.5 3.0 Latest Year Fiji 2005 1999 2003 . . .Fiji Value Latest Year 2.4 0.7 1.7 . -0.1 . Latest Year Vanuatu 2005 2005 2005 . . 2005Vanuatu Latest Year 12.0 -18.8 1.3 . 3.9 3.1LI-Asia Median 10.1 -0.1 8.1 . 1.0 2.8Low Income Median 12.5 -4.2 9.3 . 1.6 3.1High Five Avg. 54.5 . 1,907.6 . 103.7 15.3Low Five Avg. 0.0 . 1.0 . -1.3 0.3
B-9

External Sector (Cont'd)
Present value of debt, % GNI
Remittance receipts, %
exportsConcentration of
exports
Trade Logistics Performance Index
- Customs (1 for poor to 5 for
excellent)
Trade in Non-oil goods and
services, % non-oil GDP
Trade in Non-oil merchandise
goods, % non-oil GDP
Real effective exchange rate
(REER)
Country Credit Ranking (1 for best, 174 for
worst)
Indicator Number C24P7 C24P8 C24P9 C24S1 C24S2 C24S3 C24S4 C24S5Timor-Leste Data
Latest Year (T) 2006 . 2006 2007 . 2006 2007 2007Value Year T 0.0 . 97 1.6 . 41.9 73 153.0Value Year T-1 0.0 . . . . 41.7 74 .Value Year T-2 0.0 . . . . 50.6 81 .Value Year T-3 0.0 . . . . 60.1 81 .Value Year T-4 0.0 . . . . 65.3 81 .Average Value, 5 year 0.0 . . . . 51.9 78 .Growth Trend . . . . . -12.5 -3 .
Benchmark Data Latest Year Cape Verde 2005 2005 . . 2003 2005 . 2007Cape Verde Value Latest Year 43.4 37.3 . . 98 46.4 . 112.0 Latest Year Fiji 2005 2004 . . 2001 2005 . .Fiji Value Latest Year 9.3 8.3 . . 141.2 84.7 . . Latest Year Vanuatu 2005 2005 . . . 2005 . 2007Vanuatu Latest Year 20.7 0.0 . . . 55.2 . 129.0LI-Asia Median 50.3 20.2 . 2.0 75.1 99.5 . .Low Income Median 38.0 7.5 . 2.1 66.5 52.6 . .High Five Avg. 375.9 102.3 . 3.9 267.5 . . .Low Five Avg. 11.0 0.0 . 1.6 24.3 . . .
B-10

Economic Infrastructure
Logistics Performance Index - Infrastructure (1 for poor to 5 for
excellent)
Number of electrical outages
(days)
Telephone Density, fixed line
and mobile per 1000
Internet users per 1000 people
Roads paved, % total roads
Households with access to
electricity (%)
Overall Infrastructure
Quality
Quality of Infrastructure - Air
Transport Infrastructure
Index (1 for poor to 7 for excellent)
Quality of Infrastructure -
Port Infrastructure Quality Index (1 for
poor to 7 for excellent)
Quality of Infrastructure -
Rail Development Index (1 for poor to 7 for excellent)
Quality of Infrastructure -
Quality of Electricity Supply Index (1 for poor to 7 for excellent) Quality of Roads
Indicator Number C25P1 C25P2 C25P3 C25S1 C25S2 C25S3 C25S4 C25S5a C25S5b C25S5c C25S5d C25S5eTimor-Leste Data
Latest Year (T) 2007 . 2006 2006 . 2007 2007 2007 2007 2007 2007 2007Value Year T 1.7 . 64.3 1.2 . 22.00 1.68 2.29 1.85 1.4 1.7 1.6Value Year T-1 . . . . . . 1.87 2.44 2.19 1.5 1.8 1.6Value Year T-2 . . . . . 26.0 . . . . . .Value Year T-3 . . . . . . . . . . . .Value Year T-4 . . . . . 26.1 . . . . . .Average Value, 5 year . . . . . . . . . . . .Growth Trend . . . . . . . . . . . .
Benchmark Data Latest Year Cape Verde . 2006 2005 2005 2000 . . . . . . .Cape Verde Value Latest Year . 18.4 302.2 49.3 69.0 . . . . . . . Latest Year Fiji . . 2003 2005 1999 . . . . . . .Fiji Value Latest Year . . 254.2 76.7 49.2 . . . . . . . Latest Year Vanuatu . . 2004 2005 1999 . . . . . . .Vanuatu Latest Year . . 83.3 37.8 23.9 . . . . . . .LI-Asia Median 2.0 . 34.6 4.1 13.30 . 2.49 3.62 2.57 2.3 2.8 2.8Low Income Median 2.1 . 22.8 2.4 15.53 . 2.40 3.33 2.66 1.8 2.6 2.5High Five Avg. 4.2 . 1,414.0 525.7 100.0 . . . . . . .Low Five Avg. 1.5 . 1.6 0.2 9.6 . . . . . . .
B-11

Health
Access to Access to Prevalence of Public health Child mortality
rateMaternal mortality
rateLife expectancy at
birth HIV prevalenceimproved sanitation
improved water source
child malnutrition (weight for age)
expenditure, % GDP
Indicator Number C31P1 C31P2 C31P3 C31S1 C31S2 C31S3 C31S4 C31S5Timor-Leste Data
Latest Year (T) 2003 2000 2005 2001/02 2007 2007 2007 2004Value Year T 83.0 660.0 59.7 0.4 48.5 64.7 50.3 8.8Value Year T-1 . . . . . . . 7.2Value Year T-2 . . . . . . . 5.7Value Year T-3 . . 55.2 . . . . 5.6Value Year T-4 . . . . . . 45.8 6.2Average Value, 5 year . . . . . . . 6.7Growth Trend . . . . . . . 9.5
Benchmark Data Latest Year Cape Verde 2005 2000 2004 . 2004 2004 . 2004Cape Verde Value Latest Year 35.0 210.0 70.4 . 43.0 80.0 . 3.9 Latest Year Fiji 2005 2000 2004 2005 2004 2004 . 2004Fiji Value Latest Year 17.9 210.0 68.0 0.1 72.0 47.0 . 2.9 Latest Year Vanuatu 2005 2000 2004 . 2004 2004 . 2004Vanuatu Latest Year 38.0 32.0 69.0 . 50.0 60.0 . 3.1LI-Asia Median 74.0 420.0 63.2 0.3 39.0 70.0 37.9 1.5Low Income Median 120.0 690.0 55.0 1.7 35.5 61.5 27.2 2.0High Five Avg. 251.6 1,800.0 . 24.1 100.0 100.0 45.3 10.9Low Five Avg. 3.6 2.6 . 0.1 11.4 34.0 2.9 0.6
B-12

Education
Net primary enrollment rate -
Total
Net primary enrollment rate -
Female
Net primary enrollment rate -
MaleNet secondary enrollment rate
Gross tertiary enrollment rate
Indicator Number C32P1a C32P1b C32P1c C32P2 C32P3Timor-Leste Data
Latest Year (T) 2006/07 2006/07 2006/07 2003 2002Value Year T 64.3 66.0 62.5 26.0 10Value Year T-1 . . . . .Value Year T-2 74.1 73.9 74.3 21.0 .Value Year T-3 . . . . .Value Year T-4 . . . 27.0 .Average Value, 5 year . . . . .Growth Trend . . . . .
Benchmark Data Latest Year Cape Verde 2005 2005 2005 2005 2005Cape Verde Value Latest Year 90.1 89.4 90.8 57.5 7 Latest Year Fiji 2005 2005 2005 2005 2004Fiji Value Latest Year 96.2 95.8 96.7 82.7 15 Latest Year Vanuatu 2005 2005 2005 2004 2004Vanuatu Latest Year 93.9 93.0 94.7 39.3 5LI-Asia Median 87.4 81.4 85.4 36.5 6Low Income Median 62.2 57.0 65.2 19.7 3High Five Avg. . . . 97.6 84Low Five Avg. . . . 8.4 1
B-13

Education (Cont'd)
Persistence in Persistence in Persistence in Education school to grade 5 -
Totalschool to grade 5 -
Femaleschool to grade 5 -
Male Youth literacy rateexpenditure,
primary, % GDPPupil-teacher ratio,
primary school
Indicator Number C32P4a C32P4b C32P4c C32P5 C32S1 C32S2Timor-Leste Data
Latest Year (T) 2001 . . 2007 2006/07 2005/06Value Year T 47.0 . . 77.0 2.0 37.0Value Year T-1 . . . . . 33.0Value Year T-2 . . . . . 36.0Value Year T-3 . . . . . .Value Year T-4 . . . . . .Average Value, 5 year . . . . . .Growth Trend . . . . . .
Benchmark Data Latest Year Cape Verde 2004 2003 2003 . 2007 2005Cape Verde Value Latest Year 92.5 94.8 87.8 . 3.0 26.0 Latest Year Fiji 2003 2003 2003 . 2007 2005Fiji Value Latest Year 98.7 97.4 100.0 . 2.5 28.2 Latest Year Vanuatu 2004 1999 1999 . 2007 2005Vanuatu Latest Year 77.7 71.8 72.4 . 2.4 20.0LI-Asia Median 67.8 67.6 67.5 77.4 1.4 37.2Low Income Median 69.2 68.8 67.9 70.4 2.0 41.0High Five Avg. 99.6 99.9 99.9 99.9 8.4 66.7Low Five Avg. 39.8 37.9 40.9 32.8 0.2 10.6
B-14

Employment and Workforce
Labor force participation rate
Rigidity of Employment Index
(0 for minimum rigidity to 100 for maximum rigidity)
Economically active children, % children ages 7-14
Unemployment rate, 15-24 year old
malesUnemployment
rate, 15-24 year old
Informal Sector employment, %
labor force
Indicator Number C33P1 C33P2 C33P3 C33P4a C33P4b C33S1Timor-Leste Data
Latest Year (T) 2005 2007 2001 . 2006 2001Value Year T 72.3 34.0 7.6 . 43.0 93.0Value Year T-1 71.3 34.0 . . . .Value Year T-2 71.7 34.0 . . . .Value Year T-3 70.3 . . . . .Value Year T-4 69.3 . . . . .Average Value, 5 year 71.0 . . . . .Growth Trend 1.0 . . . . .
Benchmark Data Latest Year Cape Verde 2005 2007 . . . .Cape Verde Value Latest Year 57.8 44.0 . . . . Latest Year Fiji 2005 2007 . . . .Fiji Value Latest Year 70.7 14.0 . . . . Latest Year Vanuatu 2005 2007 . . . .Vanuatu Latest Year 88.9 24.0 . . . .LI-Asia Median 71.6 31.3 . . 11.1 .Low Income Median 76.3 38.0 33.1 . 11.7 .High Five Avg. 92.4 74.2 . 46.3 . .Low Five Avg. 49.8 0.0 . 5.2 . .
B-15
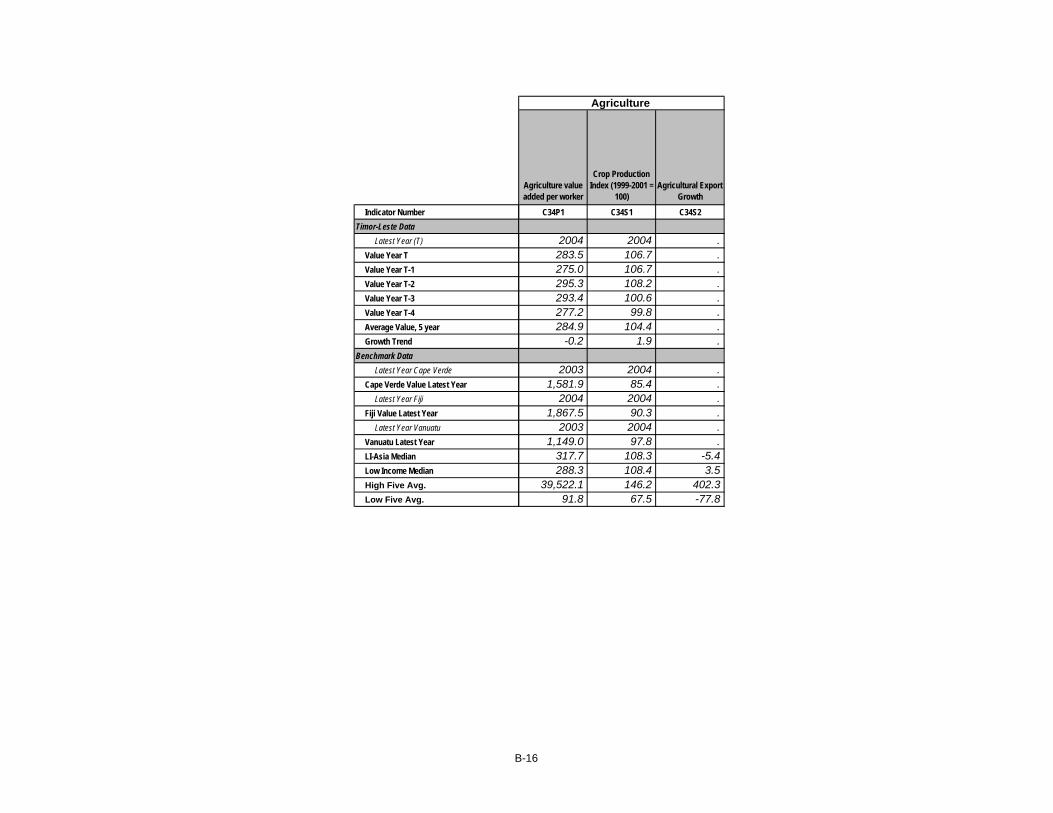
Agriculture
Agriculture value added per worker
Crop Production Index (1999-2001 =
100)Agricultural Export
Growth
Indicator Number C34P1 C34S1 C34S2Timor-Leste Data
Latest Year (T) 2004 2004 .Value Year T 283.5 106.7 .Value Year T-1 275.0 106.7 .Value Year T-2 295.3 108.2 .Value Year T-3 293.4 100.6 .Value Year T-4 277.2 99.8 .Average Value, 5 year 284.9 104.4 .Growth Trend -0.2 1.9 .
Benchmark Data Latest Year Cape Verde 2003 2004 .Cape Verde Value Latest Year 1,581.9 85.4 . Latest Year Fiji 2004 2004 .Fiji Value Latest Year 1,867.5 90.3 . Latest Year Vanuatu 2003 2004 .Vanuatu Latest Year 1,149.0 97.8 .LI-Asia Median 317.7 108.3 -5.4Low Income Median 288.3 108.4 3.5High Five Avg. 39,522.1 146.2 402.3Low Five Avg. 91.8 67.5 -77.8
B-16

Technical Notes The following technical notes identify the source for each indicator, provide a concise definition, indicate the coverage of USAID countries, and comment on data quality when pertinent. For reference purposes, a CAS code is also given for each indicator. In many cases, the descriptive information is taken directly from the original sources, as cited.
STATISTICAL CAPACITY
Statistical Capacity Indicator
Source: World Bank, updated annually: http://web.worldbank.org/WBSITE/EXTERNAL/DATASTATISTICS/0,,contentMDK:20541648~pagePK:64133150~piPK:64133175~theSitePK:239419,00.html
Definition: This indicator provides an evaluation of a country’s statistical practice, data collection activities, and key indicator availability against criteria consistent with international recommendations. The score ranges from 0 to 100, with a score of 100 indicating that the country meets all criteria.
Coverage: Data are available for the majority of USAID countries. CAS Code: C01P1
ECONOMIC GROWTH AND POSTCONFLICT RECOVERY
Failed States Index score
Source: Fund for Peace, Failed States Index, http://www.fundforpeace.org/web/index.php?option=com_content&task=view&id=229&Itemid=366
Definition: The Failed States Index assesses violent internal conflicts and measures the impact of mitigating strategies. Published annually by Fund for Peace, the index rates 12 social, economic, and political or military indicators, including Mounting Demographic Pressures, Massive Movement of Refugees or Internally Displaced Persons, Legacy of Vengeance-Seeking Group Grievance or Group Paranoia, Chronic and Sustained Human Flight, Uneven Economic Development along Group Lines, Sharp and/or Severe Economic Decline, Criminalization and/or Delegitimization of the State, Progressive Deterioration of Public Services, Suspension or Arbitrary Application of the Rule of Law and Widespread Violation of Human Rights; Security Apparatus Operates as a “State Within a State;” Rise of Factionalized Elites; and Intervention of Other States or External Political Actors. Each indicator is ranked on a scale of 1 (low) to 10 (high). A high ranking reflects high intensity or pressure on the state (more likely to foster conflict),
whereas a low ranking reflects lower intensity or pressure on the state (less likely to foster conflict). The rankings for the 12 indicators are combined to determine the country’s overall score.
Coverage: Data are available for all USAID countries. CAS Code: C11P1
Episode of Significant Violence, Highest Magnitude in Previous 10 years
Source: Center for Systemic Peace, Major Episodes of Political Violence, from Marshall, Monty G. 1998-2006. “Current Status of the World’s Major Episodes of Political Violence,” bimonthly reports to the U.S. government’s Political Instability Task Force, http://members.aol.com/CSPmgm/warlist.htm.
Definition: The variable tells the date and duration of the conflict episode with the highest magnitude in the past 10 years and whether the conflict is ongoing. At times delineating the exact beginning or end of a conflict is difficult, so the years presented are considered most likely to capture the transformative periods of the episodes.
Coverage: Data available for all USAID countries. CAS Code: C11P2
Type of Conflict, Highest Magnitude in Previous 10 years
Source: Center for Systemic Peace, Major Episodes of Political Violence, from Marshall, Monty G. 1998–2006. “Current Status of the World’s Major Episodes of Political Violence,” bimonthly reports to the U.S. government’s Political Instability Task Force: http://members.aol.com/CSPmgm/warlist.htm.
Definition: This variable tries to capture the characteristics of the conflict episode with the highest magnitude in the last 10 years. The first letter (C, E, I) denotes what caused the violence: a civil-intrastate (C) episode involving rival political groups; ethnic-intrastate conflict (E) involving the state agent and a distinct ethnic group; or international event-interstate (I), usually involving two or more states, but possibly denoting a distinct polity resisting foreign domination (colonialism). The second letter (V, W, N) denotes episodes of violence (V)—i.e., the use of instrumental violence without necessarily exclusive goals; war-violence (W) between distinct, exclusive groups with the intent to impose a unilateral result to the contention; or

B - 1 8 A P P E N D I X B
independence (I)—an attempt to forcibly remove foreign domination.
Coverage: Data available for all USAID countries. CAS Code: C11P3
Magnitude of Societal-Systemic Impact, Highest Magnitude in Previous 10 years
Source: Center for Systemic Peace, Major Episodes of Political Violence, from Marshall, Monty G. 1998–2006, “Current Status of the World’s Major Episodes of Political Violence,” bimonthly reports to the U.S. government’s Political Instability Task Force, http://members.aol.com/CSPmgm/warlist.htm.
Definition: This variable captures the highest magnitude of conflict episode in the last 10 years. From episodes in which the number of deaths is under 2,000, to extensive, systematic, and indiscriminate destruction of human resources and/or physical infrastructure with persistent and adverse effects.
Coverage: Data available for all USAID countries. CAS Code: C11P4
Per capita GDP, $PPP
Source: International Monetary Fund (IMF) World Economic Outlook database, updated every 6 months: http://www.imf.org/external/ns/cs.aspx?id=28 Definition: This indicator adjusts per capita GDP measured in current U.S. dollars for differences in purchasing power, using an estimated exchange rate reflecting the purchasing power of the various local currencies. Coverage: Data are available for about 65 USAID countries. CAS Code: C11P5
Real GDP Growth (Non-oil)
Source: IMF World Economic Outlook database, updated every six months; latest country data from IMF Article IV consultation reports: www.imf.org/external/np/sec/aiv/index.htm
Definition: Annual percentage growth rate of non-oil GDP at constant local currency prices.
Coverage: Data are available for about 85 USAID countries. CAS Code: C11P6
Gross Fixed Investment, Percentage of GDP
Source: IMF Article IV consultation reports for latest country data; international benchmark from the World Development Indicators, most recent publication series NE.GDI.FTOT.ZS.
Definition: Gross fixed investment is spending on replacing or adding to fixed assets (buildings, machinery, equipment and similar goods).
Coverage: Data are available for about 84 USAID countries. CAS Code: C11S1
Disarmament, Demobilization, and Reintegration
Source: Graduate Institute of International Studies in Geneva, Switzerland, Small Arms Survey, Cumulative Index 2001–2006, Search for “Where are DDR programmes currently being implemented?” http://www.unddr.org/whatisddr.php#11
Data are also available from the UN DDR Resource Centre http://www.unddr.org/.
Definition: This indicator is a yes/no indicator that shows whether the military powers that perpetuated conflict are reforming through a formal UN-led Disarmament, Demobilization and Reintegration program.
Coverage: Data available for only UN-sponsored DDR programs, covering about 13 countries. CAS Code: C11S2
Human Rights Index
Source: Mark Gibney and Matthew Dalton, “Political Terror Scale 1980–2005,” University of North Carolina Asheville, North Carolina, 2006: http://www.politicalterrorscale.org/ptsdata.html
Definition: This variable shows the degree to which countries experience government-induced violence against their own population (1 is best and 5 is worst). The scores range from countries under secure rule of law with no imprisonment for their views, to violence in the form of assassinations and torture extended to the whole population. State-sponsored political terror (defined here as coercion directed at personal security) targets predominantly groups opposed to the state. It could lead eventually to the escalation of violence by pushing moderates to espouse radical ideas (after becoming less convinced that peaceful resolution is possible), or by increasing the cost of collective action, thus making resorting to violent means more attractive or economically viable.
Coverage: Data are available for 179 countries. CAS Code: C11S3
Refugees and IDPs per Capita
Source: Derived from United Nations High Commissioner for Refugees, Global Refugee Trends, Table 2, refugees, asylum-seekers, internally displaced persons (IDPs), returnees (refugees and IDPs), stateless persons, and others of concern to UNHCR by country of origin. http://www.unhcr.org/statistics.html and World Development Indicators. Definition: Number of refugees and IDPs divided by total population. Refugees include persons recognized under the 1951 Convention relating to the Status of Refugees, its 1967 Protocol, the 1969 OAU Convention Governing the Specific Aspects of Refugee Problems in Africa, those recognized in accordance with the UNHCR Statute, persons granted a complementary form of protection, and persons granted temporary protection. Internally displaced persons (IDPs) are defined as “persons or groups of persons who have been forced or obligated to flee or leave their homes or places of habitual residence, in particular as a result of avoiding or in order to avoid the effect of armed conflict, situations of generalized violence, violations of human rights, or natural or manmade disasters, and who have not crossed an internationally recognized state border.” (Guiding Principles on Internal Displacement, Introduction, para. 2). Unlike refugees, who have been deprived of the protection of their state of origin, IDPs remain legally under the protection of national authorities of their country of habitual residence. Internally displaced persons are those forced to flee their homes because their lives were at danger, but unlike refugees, they did not cross international borders. Estimates come from various sources, including the Internal Displacement Monitoring Center, United Nations High Commission for Human Rights, and United Nations Office for the Coordination of Humanitarian Affairs. Total

T E C H N I C A L N O T E S B - 1 9
population is based on the de facto definition of population, which counts all residents regardless of legal status or citizenship—except for refugees not permanently settled in the country of asylum, which are generally considered part of the population of their country of origin. Coverage: 75 USAID countries CAS Code: C11S4
POVERTY AND INEQUALITY
Income Share, Poorest 20%
Source: World Development Indicators, most recent publication series SI.DST.FRST.20. These are World Bank staff estimates based on primary household survey data obtained from government statistical agencies and World Bank country departments. An alternative source is the country’s Poverty Reduction Strategy Paper: http://www.imf.org/external/np/prsp/prsp.asp Definition: Share of total income or consumption accruing to the poorest quintile of the population. Coverage: Data are available for about 59 USAID countries going back to 1997; for the period since 2000, data are available for about 35 USAID countries. CAS Code: C12P1
Population Living on Less than $1 PPP per Day
Source: World Development Indicators, most recent publication series SI.POV.DDAY, original data from national surveys. An alternative source is the country’s Poverty Reduction Strategy Paper: http://www.imf.org/external/np/prsp/prsp.asp Definition: The indicator captures the percentage of the population living on less than $1.08 a day at 1993 international prices. Coverage: Data are available for about 59 USAID countries going back to 1997; data for 2000 or later are available for about 35 USAID countries. Data quality: Poverty data originate from household survey questionnaires that can differ widely; even similar surveys may not be strictly comparable because of differences in quality. CAS Code: C12P2
Population Living below National Poverty Line
Source: World Development Indicators, most recent publication series SI.POV.NAHC. An alternative source is the country’s Poverty Reduction Strategy Paper:: http://www.imf.org/external/np/prsp/prsp.asp Definition: The percentage of the population living below the national poverty line. National estimates are based on population-weighted estimates from household surveys Coverage: Data are available for only 19 countries for 2000 or later; data are available for about 49 countries going back to 1997. For most countries, data can be obtained from the PRSP. Data quality: Measuring the percentage of people living below the “national poverty line” has the disadvantage of limiting international comparisons because of differences in the definition of the poverty line. Most lower-income countries, however, determine the national poverty line by the level of consumption required to have a minimally sufficient food intake plus other basic necessities. CAS Code: C12P3
Human Poverty Index
Source: UNDP, Human Development Report. http://hdr.undp.org/statistics/data/indicators.cfm?x=18&y=1&z=1 for most recent edition; updates may be found at http://hdr.undp.org/en/ Definition: The index measures deprivation in terms of not meeting target levels for specific economic and quality-of-life indicators. Values are based on (1) the percentage of people not expected to survive to age 40, (2) the percentage of adults who are illiterate, and (3) the percentage of people who fail to attain a “decent living standard,” which is subdivided into three (equally weighted) items: (1) the percentage of people without access to safe water, (2) the percentage of people without access to health services, and (3) the percentage of underweight children. The HPI ranges in value from 0 (zero incidence of deprivation) to 100 (high incidence of deprivation). Coverage: Data are available for about 60 USAID countries. CAS Code: C12P4
Population below Minimum Dietary Energy Consumption
Source: UN Millennium Indicators Database at http://millenniumindicators.un.org/unsd/mdg/Data.aspx, based on FAO estimates. Definition: Proportion of the population in a condition of undernourishment. The FAO defines undernourishment as the condition of people whose dietary energy consumption is continuously below a minimum dietary energy requirement for maintaining a healthy life and carrying out light physical activity. Coverage: Data are available for about 82 USAID countries. CAS Code: C12S1
ECONOMIC STRUCTURE
Output Structure
Source: World Development Indicators, most recent publication series NV.AGR.TOTL.ZS for value added in agriculture as a percentage of GDP; series NV.IND.TOTL.ZS for the share of industry; and NV.SRV.TETC.ZS for the share of services. Definition: The output structure is composed of value added by major sector of the economy (agriculture, industry, and services) as percentages of GDP, where value added is the net output of a sector after all outputs are added up and intermediate inputs are subtracted. Value added is calculated without deductions for depreciation of fabricated assets or depletion and degradation of natural resources. Agriculture includes forestry, hunting, and fishing, as well as cultivation of crops and livestock production. Industry includes manufacturing, mining, construction, electricity, water, and gas. Services include wholesale and retail trade (including hotels and restaurants), transport, and government, financial, professional, and personal services such as education, health care, and real estate services. Coverage: Data are available for about 86 USAID countries. Data quality: A major difficulty in compiling national accounts is the extent of unreported activity in the informal economy. In developing countries a large share of agricultural output is either not exchanged (because it is consumed within the household) or not exchanged for money. This production is estimated indirectly using estimates of inputs, yields, and area under cultivation. This approach can differ from the true values over time and across

B - 2 0 A P P E N D I X B
crops. Ideally, informal activity in industry and services is measured through regular enterprise censuses and surveys. In most developing countries such surveys are infrequent, so prior survey results are extrapolated. CAS Code: C13P1a-c
Employment or Labor Force Structure
Source: World Development Indicators, most recent publication series SL.AGR.EMPL.ZS for agriculture, series SL.IND.EMPL.ZS for industry, and series SL.SRV.EMPL.ZS for services. An alternative source is the CIA World Fact Book: https://www.cia.gov/library/publications/the-world-factbook/index.html
Definition: Employment in each sector is the proportion of total employment recorded as working in that sector. Employees are people who work for a public or private employer and receive remuneration in wages, salary, commission, tips, piece rates, or pay in kind. Agriculture includes hunting, forestry, and fishing. Industry includes mining and quarrying (including oil production), manufacturing, electricity, gas and water, and construction. Services include wholesale and retail trade and restaurants and hotels; transport, storage, and communications; financing, insurance, real estate, and business services; and community, social, and personal services.
Coverage: Data are available for about 37 USAID countries. For most countries, data can be obtained from the PRSP. Data quality: Employment figures originate with the International Labour Organization. Some countries report labor force structure instead of employment; thus the data must be checked carefully before comparisons are made. CAS Code: C13P2a-c
Adjusted Savings: Energy Depletion, percentage of GNI
Source: World Development Indicators, most recent publication series NY.ADJ.DNGY.GN.ZS. Definition: Energy depletion is equal to the product of unit resource rents and the physical quantities of energy extracted. It covers crude oil, natural gas, and coal. Coverage: Data are available for about 88 USAID countries. CAS Code: C13S1a
Adjusted Savings: Mineral Depletion, percentage of GNI
Source: World Development Indicators, most recent publication series NY.ADJ.DMIN.GN.ZS. Definition: Mineral depletion is equal to the product of unit resource rents and the physical quantities of minerals extracted. It refers to bauxite, copper, iron, lead, nickel, phosphate, tin, zinc, gold, and silver. Coverage: Data are available for about 88 USAID countries. CAS Code: C13S1b
DEMOGRAPHY AND ENVIRONMENT
Adult Literacy Rate
Source: World Development Indicators, most recent publication series SE.ADT.LITR.ZS, based on UNESCO calculations. Definition: Percentage of people aged 15 and over who can read and write a short, simple statement about their daily life.
Coverage: Data are available for about 66 USAID countries. Data quality: In practice, literacy is difficult to measure. A proper estimate requires census or survey measurements under controlled conditions. Many countries estimate the number of illiterate people from self-reported data or by taking people with no schooling as illiterate. CAS Code: C14P1
Youth Dependency Rate
Source: World Development Indicators, most recent publication series. Definition: Youth dependency rate is calculated as the percentage of the population below age 15 (WDI SP.POP.0014.TO.ZS) divided by the working-age population (those ages 15–64) (WDI SP.POP.1564.TO.ZS) Coverage: Data are available for about 89 USAID countries. CAS Code: C14P2
Youth Bulge
Source: Obtained from individual country sources. Definition: Youth bulge is calculated as the percentage of the population ages 15–24 divided by the total population (WDI SP.POP.TOTL) Coverage: Data are available for about 35 USAID countries. CAS Code: C14P3
Environmental Performance Index
Source: Center for International Earth Science Information Network (CIESIN) at Columbia University, and the Center for Environmental Law and Policy at Yale University. http://epi.yale.edu/Home Definition: The Environmental Performance Index (EPI) is a composite index of national environmental protection, which tracks (1) environmental health, (2) air quality, (3) water resources, (4) biodiversity and habitat, (5) productive natural resources, and (6) sustainable energy. The index is a weighted average of these six policy categories giving more weight to enviromental health (EPI = 0.5 × Environmental Health + 0.1 × (Air Quality + Water Resources + Productive Natural Resources + Biodiversity and Habitat + Sustainable Energy)). The index values range from 0 (for very poor performance) to 100 (for very good performance). Coverage: Data are available for about 80 USAID countries. Data quality: The 2006 pilot EPI and 2008 EPI differ in several strucutural and substantive areas. As a result comparison berween both years are not appropriate. CAS Code: C14P4
Population Growth Rate
Source: World Development Indicators, most recent publication series SP.POP.GROW. Definition: Annual population growth rate is based on the de facto definition of population. Total population counts all residents regardless of legal status or citizenship, except refugees not permanently settled in the country of asylum. Coverage: Data are available for about 88 USAID countries. CAS Code: C14P5
Rural Population Density
Source: World Development Indicators, most recent publication series EN.RUR.DNST

T E C H N I C A L N O T E S B - 2 1
Definition: Rural population density (rural population per sq. km of arable land) is the rural population divided by the arable land area. Rural population is calculated as the difference between the total population and the urban population. Arable land includes land defined by the FAO as land under temporary crops (double-cropped areas are counted once), temporary meadows for mowing or for pasture, land under market or kitchen gardens, and land temporarily fallow. Land abandoned as a result of shifting cultivation is excluded. Estimates are from the Food and Agriculture Organization and World Bank population estimates. Coverage: Nearly all relevant countries. CAS Code: C14P6
Percentage of Population Living in Urban Areas
Source: World Development Indicators, most recent publication series SP.URB.TOTL.IN.ZS. Definition: Urban population is the share of the total population living in areas defined as urban in each country. The calculation considers all residents regardless of legal status or citizenship, except refugees. Coverage: Data are available for about 86 USAID countries. Data quality: The estimates are based on national definitions of what constitutes an urban area; because these definitions vary greatly, cross-country comparisons should be made with caution. CAS Code: C14P7
Frequency and Scope of Natural Disasters
Source: Centre for Research on the Epidemiology of Disasters, Emergency Events Database, http://www.emdat.be/Database/DisasterProfile/profiles.php
Definition: This indicator measures the human-impact effects of natural disasters and the frequency of these occurrences. Natural disasters are defined as natural hazard events that have at least one of the following human-impact effects: 10 or more people reported killed, 100 people reported affected, declaration of a state of emergency, or call for international assistance. The scope is measured by the total number of people affected. This includes the number of people suffering from physical injuries, trauma, or an illness requiring medical treatment as a direct result of a disaster, the number of people needing immediate assistance for shelter, and the people requiring immediate assistance during a period of emergency; it can also include displaced or evacuated people.
Coverage: Data are available for nearly all USAID countries. CAS Code: C14S1
Net migration rate
Source: CIA World Factbook, https://www.cia.gov/library/publications/the-world-factbook/ Definition: Net migration rate (migrants per 1,000 population) is the difference between the number of persons entering and leaving a country during the year per 1,000 persons (based on midyear population). An excess of persons entering the country is referred to as net immigration (e.g., 3.56 migrants per 1,000 population); an excess of persons leaving the country as net emigration (e.g., -9.26 migrants per 1,000 population). Coverage: Data are available for nearly all USAID countries. Data quality: The source does not specify the estimating methodology.
CAS Code: C14S2
GENDER AND CHILDREN
Gender Empowerment Measure
Source: UNDP, Human Development Report, http://hdrstats.undp.org/indicators/279.html. Definition: Captures gender inequality in three areas: political participation and decision-making power, as measured by women’s and men’s participation in parliamentary seats; economic participation and decision-making power, as measured by two indicators – women’s and men’s percentage shares of positions as legislators, senior officials and managers and women’s and men’s percentage shares of professionals and technical positions; and power over economic resources, as measured by estimated earned income. Coverage: Data are available for half of USAID countries. CAS Code: C15P1
Girls’ Primary Completion Rate
Source: World Development Indicators, most recent publication series: SE.PRM.CMPT.FE.ZS Definition: Primary completion rate is the percentage of students completing the last year of primary school. It is the total number of students in the last grade of primary school, minus the number of repeaters in that grade, divided by the total number of children of official graduation age. Coverage: Data are available for about 80 USAID countries. Data quality: Completion rates are based on data collected during annual school surveys, typically conducted at the beginning of the school year. The indicator does not measure the quality of the education. CAS Code: C15P2
Gross Enrollment Rate, All Levels of Education, Male and Female
Source: UNDP Human Development Report http://hdr.undp.org/en/statistics/ and http://hdrstats.undp.org/indicators/
Definition: The number of students enrolled in primary, secondary, and tertiary levels of education by sex, regardless of age, as a percentage of the population of official school age for the three levels by sex.
Coverage: Data are available for about 80 USAID countries. Data quality: Enrollment rates are based on data collected during annual school surveys, typically conducted at the beginning of the school year. CAS Code: C15P3
Life Expectancy, Male and Female
Source: Estimated from UNDP Human Development Indicators: http://hdrstats.undp.org/indicators
Definition: The number of years a newborn male or female infant would live if prevailing patterns of age and sex-specific mortality rates at the time of birth were to stay the same throughout the child’s life.
Coverage: Data are available for about 85 USAID countries. CAS Code: C15P4

B - 2 2 A P P E N D I X B
Labor Force Participation Rate, Male and Female
Source: Derived from World Development Indicators, but the precise computation differs according to the edition of WDI used: To calculate the female labor force participation rate using WDI 2007: the numerator is the labor force, female (percent of total labor force) (SL.TLF.TOTL.FE.ZS) times labor force, total (SL.TLF.TOTL.IN); the denominator is simply population ages 15–64, female (SP.POP.1564.FE.IN). Using WDI 2006, the denominator (female population, ages 15–64), can be estimated only by multiplying the total population (SP.POP.TOTL) by the percentage of the population ages 15–64 (SP.POP.1564.IN.ZS) and the percentage of females in the total population (SP.POP.TOTL.FE.ZS). To calculate the male labor force participation rate using WDI 2004: the numerator is calculated by subtracting the female labor force, derived above, from the total labor force (SL.TLF.TOTL.IN). The denominator is population ages 15–64, male (SP.POP.1564.MA.IN). Using WDI 2006 and subsequent years, the denominator is an estimate of the male population, ages 15–64, calculated as the total population (SP.POP.TOTL) multiplied by the percentage ages 15–64 (SP.POP.1564.IN.ZS) and the percentage of males in the total population, where the final factor is computed as 100 minus the percentage of females in the total population (SP.POP.TOTL.FE.ZS). Definition: The percentage of the working-age population that is in the labor force. The labor force is made up of people who meet the International Labour Organization definition of the economically active population: all people who supply labor for the production of goods and services during a specified period. It includes both the employed and the unemployed. Coverage: Data are available for about 88 USAID countries. CAS Code: C15P5
Internally Displaced Females per Capita
Source: UNHCR, 2005 Global Refugee Trends, Annex, Table 14, http://www.unhcr.org/statistics.html and World Development Indicators, most recent publication series SP.POP.TOTL. Definition: Internally displaced women protected or assisted by UNHCR, 2005, divided by total population estimates. Coverage: Data are available for 14 USAID countries. Data quality: Most of the world’s internal-displacement situations are not covered by UNHCR and are thus not reflected in these statistics. CAS Code: C15S1
Use of Child Soldiers, Government and Political
Source: Text in country reports of Child Soldiers.org, http://www.child-soldiers.org/regions/regions, and The UN DDR Resource Centre http://www.unddr.org/ Definition: The 2002 Optional Protocol to the UN Convention on the Rights of the Child set 18 as the minimum age for participation in hostilities, for compulsory recruitment by governments, and all recruitment into armed groups. The use of child solider is therefore defined as an individual under the age of 18 participating in government forces or in armed political groups. Coverage: Data are available for approximately 70 percent of USAID countries. Data quality: Information for country entries was gathered from a wide range of sources, including governments, UN agencies and peacekeeping missions, other intergovernmental
organizations, news media, academic sources, and human rights and humanitarian organizations. Information was also provided by coalition members and partners and by local nongovernmental organizations, journalists, lawyers, activists, and others in many countries. CAS Code: C15S2
ECONOMIC STABILIZATION AND GOVERNMENT CAPACITY In the World Development Indicators for 2005, the World Bank adopted a new system for government budget statistics, switching from data based on cash outlays and receipts to a system with revenues booked on receipt and expenses booked on accrual, in accordance with the IMF’s Government Financial Statistics (GFS) Manual, 2001. On the revenue side, the changes are minor, and comparisons to the old system may still be valid. There is a major change, however, in the reporting of capital outlays, which are now treated as balance sheet entries; only the annual capital consumption allowance (depreciation) is reported as an expense. Hence, the data on total expense are not comparable to the former data on total expenditure. In addition, WDI 2005 provides data on a government’s cash surplus/deficit; this differs from the previous concept of the overall budget balance by excluding net lending minus repayments (which are now a financing item under net acquisition of financial assets). Many countries do not use the GFS system, so country coverage of fiscal data in WDI 2005 is limited. For these reasons, the template will continue to use some data from WDI 2004, along with new data from WDI 2005 and subsequent WDI series, as appropriate.
Government Effectiveness Index
Source: World Bank Institute, Governance Indicators, (Kaufmann, Kraay and Mastruzzi, September 2006) http://web.worldbank.org/WBSITE/EXTERNAL/WBI/EXTWBIGOVANTCOR/0,,contentMDK:21045735~pagePK:64168445~menuPK:1866365~piPK:64168309~theSitePK:1740530,00.html Definition: Based on perception surveys from 17 sources, this index measures the quality of public and civil services and the degree of the public sector’s independence from political pressures, the quality of policy formulation and implementation, and the credibility of the government’s commitment to such policies. Coverage: Data are available for all USAID countries. CAS Code: C21P1
Government Expenditure, Percent of Non-oil GDP
Source: IMF Article IV Reviews for latest country data: www.imf.org/external/np/sec/aiv/index.htm World Development Indicators for benchmarking data (GC.XPN.TOTL.GD.ZS). Original data from the IMF, Government Finance Statistics Yearbook, and World Bank estimates.
Definition: Total expenditure of the central government as a percent of non-oil GDP.
Coverage: Data are available for about 70 percent of USAID countries. CAS Code: C21P2
Government Revenue, Percent of Non-oil GDP
Source: IMF Article IV reviews for latest country data: www.imf.org/external/np/sec/aiv/index.htm;

T E C H N I C A L N O T E S B - 2 3
World Development Indicators for benchmarking data (GB.RVC.TOTL.GD.ZS). Original data from the IMF, Government Finance Statistics Yearbook and data file, and World Bank estimates.
Definition: Government revenue includes all revenue to the central government from taxes and nonrepayable receipts (other than grants), measured as a share of GDP. Grants represent monetary aid going to the central government that has no repayment requirement.
Coverage: Data are missing for about 24 USAID countries. CAS Code: C21P3
Money Supply Growth
Source: Latest country data are from national data sources or IMF Article IV Reviews: www.imf.org/external/np/sec/aiv/index.htm. Benchmarking data are from World Development Indicators, most recent publication, series FM.LBL.MQMY.ZG. Original source of WDI data is IMF, International Financial Statistics, and World Bank estimates.
Definition: Average annual growth rate in the broad money supply, M2 (money plus quasimoney) measured as the change in end-of-year totals relative to the preceding year. M2 is made up of the sum of currency outside banks, checking account deposits other than those of the central government, and the time, savings, and foreign currency deposits of resident sectors other than the central government. M2 corresponds to the sum of lines 34 and 35 in the IMF’s International Financial Statistics (IFS).
Coverage: Data are available for about 81 USAID countries. CAS Code: C21P4
Inflation Rate
Source: IMF World Economic Outlook database, updated every 6 months: http://www.imf.org/external/ns/cs.aspx?id=28 Definition: Inflation as measured by the consumer price index reflects the annual percentage change in the cost to the average consumer of acquiring a basket of goods and services that may be fixed or changed at specific intervals. Coverage: Data are available for about 85 USAID countries. Data quality: For many developing countries, figures for recent years are IMF staff estimates. Additionally, data for some countries are for fiscal years. CAS Code: C21P5
Overall Government Budget Balance, including Grants, Percent of Non-oil GDP
Source: For countries using the new GFS system (see explanation at the beginning of this section), benchmarking data on a government’s cash surplus or deficit are obtained from World Development Indicators, most recent publication series GC.BAL.CASH.GD.ZS. For countries that are not yet using the new system, benchmarking data on the overall budget balance are obtained from WDI 2004, series GB.BAL.OVRL.GD.ZS. The latest country data are obtained from national data sources or from IMF Article IV Reviews: www.imf.org/external/np/sec/aiv/index.htm. Definition: The cash surplus or deficit is revenue (including grants) minus expenses, minus net acquisition of nonfinancial assets. This is close to the previous concept of overall budget balance, differing only in that it excludes net lending (which
is now treated as a financing item, under net acquisition of financial assets). For countries that are not using the GFS system, the template will continue to focus on the overall budget balance, using data from alternative sources. The overall budget deficit is defined as the difference between total revenue (including grants) and total expenditure. Both concepts measure the central government’s financing requirement that must be met by domestic or foreign borrowing. As noted above, they differ in that the new cash surplus/deficit variable excludes net lending (which is usually a minor item). Coverage: Data are available in WDI 2005 for 41 USAID countries. CAS Code: C21S1
Interest Payments/Total Government Expenditure
Source: National data sources or IMF Article IV consultative reports: www.imf.org/external/np/sec/aiv/index.htm.
Definition: Interest payments as a percent of total expenditure.
Coverage: Data are available for about half of USAID countries. WDI stopped reporting government expenditures in 2005. The template will include this variable when the required data can be obtained from IMF Article IV consultation reports or national data sources for the target country and the comparison countries. Data quality: Many countries report revenue in noncomparable categories. Budget data are compiled by fiscal year. If the fiscal year differs from the calendar year, ratios to GDP may be calculated by interpolating budget data from two adjacent fiscal years. CAS Code: C21S2
Subsidies and Other Current Transfers/Total Government Expenditure
Source: National data sources or IMF Article IV consultative reports: www.imf.org/external/np/sec/aiv/index.htm.
Definition: Subsidies and other current transfers as a percent of total expenditure.
Coverage: Data are available for about half of USAID countries. WDI stopped reporting government expenditures in 2005. The template will include this variable when the required data can be obtained from IMF Article IV consultation reports or national data sources for the target country and the comparison countries. Data quality: Many countries report their revenue in noncomparable categories. Budget data are compiled by fiscal year. If the fiscal year differs from the calendar year, ratios to GDP may be calculated by interpolating budget data from two adjacent fiscal years. CAS Code: C21S3
Institutional Capacity
Source: Fund for Peace, content analysis http://www.fundforpeace.org
Definition: Fund for Peace computes this index by analyzing leadership, police, military, civil service, and judiciary capacity, applying a rating to each element on a 1 (worst) to 5 (best) scale and summing the result.
Coverage: Data are available for all USAID countries. CAS Code: C21S4

B - 2 4 A P P E N D I X B
BUSINESS ENVIRONMENT
Control of Corruption Index
Source: World Bank Institute: http://www.govindicators.org Definition: The Control of Corruption index is an aggregation of indicators that measure the extent to which public power is exercised for private gain, including both petty and grand forms of corruption, as well as the “capture” of the state by elites and private interests. Index ranges from -2.5 (for very poor performance) to +2.5 (for excellent performance). This is also an MCC indicator, under the criterion of ruling justly. The MCC rescales the values as percentile rankings relative to the set of MCA-eligible countries, ranging from a value from 0 (for very poor performance) to 100 (for excellent performance). Some country reports use the MCC scaling. Coverage: Data are available for nearly all USAID countries. Data quality: This indicator uses perception and opinions gathered from local businessmen and third-party experts; thus, the indicator is largely subjective. Also, standard errors are large. For both reasons, international comparisons are problematic, though widely used. CAS Code: C22P1
Rule of Law Index
Source: World Bank Institute: http://www.worldbank.org/wbi/governance/govdata2002/index.html. This indicator is based on perceptions of the legal system, drawn from 12 data sources. Definition: The Rule of Law Index is an aggregation of indicators that measure the extent to which agents have confidence in and abide by the rules of society. It ranges from -2.5 (for very poor performance) to +2.5 (for excellent performance). Coverage: Data are available for nearly all USAID countries. Data quality: This index is best used with caution for relative comparisons between countries in a single year, because the standard errors are large. Using the index to track a country’s progress over time is difficult because the index does not compensate for changes in the world average. For instance, if the world average decreases in a given year, a country whose score appears to increase may not actually have tangible improvements in their legal environment. CAS Code: C22P2
Voice and Accountability
Source: World Bank Institute, Governance Indicators, (Kaufmann, Kraay, and Mastruzzi, September 2006) http://web.worldbank.org/WBSITE/EXTERNAL/WBI/EXTWBIGOVANTCOR/0,,contentMDK:21045735~pagePK:64168445~menuPK:1866365~piPK:64168309~theSitePK:1740530,00.html Definition: Based on seven representative sources, this index measures the government’s capacity to transfer power in a legitimate manner and offer civil liberties and political rights. Although this is a subjective index of perception, the index is based on a broad range of sources: 31 data sources produced by 25 organizations, ranging from international organizations to political and business risk-rating agencies (Afrobarometer, Latinobarometro), think tanks, and NGOs. Coverage: Data are available for all USAID countries. CAS Code: C22P3
Ease of Doing Business Index
Source: World Bank, Doing Business Indictors http://www.doingbusiness.org/ Definition: The Ease of Doing Business index ranks economies from 1 to 175. The index is calculated as the ranking on the simple average of country percentile rankings on each of the 10 topics covered in Doing Business in 2006: starting a business, dealing with licenses, hiring and firing, registering property, getting credit, protecting investors, paying taxes, trading across borders, enforcing contracts, and closing a business. Coverage: Data are available for nearly all USAID countries. CAS Code: C22P4
Time to Start a Business
Source: World Bank, Doing Business; Starting a Business category: http://www.doingbusiness.org/ Definition: The number of calendar days needed to complete the required procedures for legally operating a business. If a procedure can be speeded up at additional cost, the fastest procedure, independent of cost, is chosen. Coverage: Data are available for nearly all USAID countries. CAS Code: C22S1
Procedures to Start a Business
Source: World Bank, Doing Business; Starting a Business category: http://www.doingbusiness.org/ Definition: The number of procedural steps required to legalize a simple limited liability company. A procedure is an interaction of a company with government agencies, lawyers, auditors, notaries, and the like, including interactions required to obtain necessary permits and licenses and complete all inscriptions, verifications, and notifications to start operations. Coverage: Data are available for nearly all USAID countries. CAS Code: C22S2
Cost of Starting a Business
Source: World Bank, Doing Business; Starting a Business category: http://www.doingbusiness.org/ Definition: Legally required cost for starting a simple limited liability company, expressed as percentage of GNI per capita. Coverage: Data are available for nearly all USAID countries. CAS Code: C22S3
Time to Enforce a Contract
Source: World Bank, Doing Business; Enforcing Contracts category: http://www.doingbusiness.org/ Definition: Minimum number of days required to enforce a contract through the court system. Coverage: Data are available for nearly all USAID countries. CAS Code: C22S4
Procedures to Enforce a Contract
Source: World Bank, Doing Business; Enforcing Contracts category: http://www.doingbusiness.org/ Definition: The number of procedures required to enforce a valid contract through the court system, with procedure defined as any interactive step the company must take with government agencies, lawyers, notaries, and the like, to proceed with enforcement action.

T E C H N I C A L N O T E S B - 2 5
Coverage: Data are available for nearly all USAID countries. CAS Code: C22S5
Cost to Enforce a Contract, Percent of Claim
Source: World Bank, Doing Business; Enforcing Contracts category: http://www.doingbusiness.org/ Definition: Cost is recorded as a percentage of the claim, assumed to be equivalent to 200% of income per capita. Only official costs required by law are recorded, including court and enforcement costs and average attorney fees where the use of attorneys is mandatory or common. Coverage: Data are available for nearly all USAID countries. CAS Code: C22S6
Time to Register Property
Source: World Bank, Doing Business; Registering Property category: http://www.doingbusiness.org/ Definition: The time required to accomplish the full sequence of procedures to transfer a property title from seller to buyer when a business purchases land and a building in a periurban area of the country’s most populous city. Every required procedure is included, whether it is the responsibility of the seller, the buyer, or a third party on their behalf. Coverage: Data are available for nearly all USAID countries. CAS Code: C22S7
FINANCIAL SECTOR
Domestic Credit to Private Sector, Percent of GDP
Source: IMF Article IV reviews or national data sources for latest country data; World Development Indicators, most recent publication series FS.AST.PRVT.GD.ZS for benchmarking data. The WDI data originate with IMF International Financial Statistics and data files and World Bank estimates. Definition: Domestic credit to the private sector refers to financial resources provided to the private sector, such as through loans, purchases of nonequity securities, and trade credits and other accounts receivable, that establish a claim for repayment. For some countries, these claims include credit to public enterprises. Coverage: Data are available for about 82 USAID countries. CAS Code: C23P1
Interest Rate Spread
Source: World Development Indicators, most recent publication series FR.INR.LNDP. Original data are from IMF International Financial Statistics and data files. Definition: The difference between the average lending and borrowing interest rates charged by commercial or similar banks on domestic currency deposits. Coverage: Data are available for about 66 USAID countries. CAS Code: C23P2
Money supply, Percent of GDP
Source: Latest country data obtained from national data sources or IMF Article IV reviews: www.imf.org/external/np/sec/aiv/index.htm. Benchmarking data from World Development Indicators, most recent publication series FM.LBL.MQMY.GD.ZS. WDI data originate from IMF, International Financial Statistics and data files, and World Bank and OECD GDP estimates.
Definition: Money supply (M2), also called broad money, is defined as the nonbank private sector’s holdings of notes, coins, and demand deposits, plus savings deposits and foreign currency deposits. Ratio of M2 to GDP is calculated to assess the degree of monetization of an economy. Coverage: Data are available for about 81 USAID countries. Data quality: In some countries M2 includes certificates of deposits, money market instruments, and treasury bills. CAS Code: C23P3
Real Interest Rate
Source: World Development Indicators, most recent publication series FR.INR.RINR. Definition: The real interest rate is the lending interest rate adjusted for inflation, as measured by the GDP deflator. Coverage: Data are available for about 68 USAID countries. CAS Code: C23S1
Banking Sector Default Rates
Source: IMF, Financial Soundness Indicators, Coordinated Compilation Exercise for Financial Soundness Indicators: core series of nonperforming loans to total loans, http://dsbb.imf.org/Applications/web/fsi/fsihome/ Definition: This is calculated by taking the value of nonperforming loans as the numerator and the total value of the loan portfolio (including nonperforming loans, and before the deduction of specific loan loss provisions) as the denominator. Coverage: Data are available for 29 USAID countries. CAS Code: C23S2
EXTERNAL SECTOR
Aid, Percent of GNI
Source: Latest country data obtained from national data sources or IMF Article IV Reviews: www.imf.org/external/np/sec/aiv/index.htm Benchmarking data from World Development Indicators, most recent publication series DT.ODA.ALLD.GN.ZS. Definition: The indicator measures official development assistance from OECD countries and official aid from non-OECD countries as a percentage of the recipient’s gross national income. Coverage: Data are available for about 84 USAID countries. Data quality: Data do not include aid given by recipient countries to other recipient countries and may not be consistent with the country’s balance sheets, because data are collected from donors. CAS Code: C24P1
Current Account Balance, Percent of GDP
Source: Latest country data from national data sources or IMF Article IV consultation reports: www.imf.org/external/np/sec/aiv/index.htm. Benchmarking data are from World Development Indicators, most recent publication series BN.CAB.XOKA.GD.ZS, based on IMF, Balance of Payments Statistics Yearbook and data files, World Bank staff estimates, and World Bank and OECD GDP estimates. Definition: Current account balance is the sum of net exports of goods, services, net income, and net current transfers. It is presented here as a percentage of a country’s GDP.

B - 2 6 A P P E N D I X B
Coverage: Data are available for about 79 USAID countries. CAS Code: C24P2
Debt Service Ratio, Percent of Exports
Source: Latest country data obtained from national data sources or IMF Article IV Reviews: www.imf.org/external/np/sec/aiv/index.htm. Benchmarking data from World Development Indicators, most recent publication, series DT.TDS.DECT.EX.ZS, based on World Bank, Global Development Finance data.
Definition: Total debt service is the sum of principal repayments and interest actually paid in foreign currency, goods, or services on long-term debt, interest paid on short-term debt and repayments (repurchases and charges) to the IMF. Debt is considered as a percent of exports of goods and services, which includes income and workers’ remittances.
Coverage: Data are available for about 77 USAID countries. Data quality: See Data Quality comments on the present value of debt, percent of GNI, about the of debt data reported. CAS Code: C24P3
Export Growth of Goods and Services
Source: Latest country data obtained from national data sources or IMF Article IV Reviews: www.imf.org/external/np/sec/aiv/index.htm. Benchmarking data from World Development Indicators, most recent publication, series NE.EXP.GNFS.KD.ZG, based on World Bank national accounts data, and OECD National Accounts data files.
Definitions: Annual growth rate of exports of goods and services based on constant local currency units. Exports include the value of merchandise, freight, insurance, transport, travel, royalties, license fees, and other services, such as communication, construction, financial, information, business, personal, and government services. They exclude labor and property income (formerly called factor services), as well as transfer payments.
Coverage: Data are available for about 81 USAID countries. CAS Code: C24P4
Foreign Direct Investment, Percent of GDP
Source: Latest country data obtained from national data sources or IMF Article IV reviews: www.imf.org/external/np/sec/aiv/index.htm Benchmarking data from World Development Indicators, most recent publication, series BX.KLT.DINV.DT.GD.ZS, based on IMF, International Financial Statistics and Balance of Payments databases, World Bank, Global Development Finance, and World Bank and OECD GDP estimates.
Definition: Foreign direct investment is the net inflow of investment to acquire a lasting management interest (10 percent or more of voting stock) in an enterprise operating in an economy other than that of the investor. It is the sum of equity capital, reinvestment of earnings, other long-term capital, and short-term capital as shown in the balance of payments. This series shows net inflows in the reporting economy.
Coverage: Data are available for about 82 USAID countries. CAS Code: C24P5
Gross International Reserves, Months of Imports
Source: Latest country data obtained from national data sources or IMF Article IV reviews: www.imf.org/external/np/sec/aiv/index.htm. Benchmarking data from World Development Indicators, most recent publication, series FI.RES.TOTL.MO.
Definition: Gross international reserves are made up of holdings of monetary gold, special drawing rights (SDRs), the reserve position of members in the IMF, and holdings of foreign exchange under the control of monetary authorities expressed in the number of months of imports of goods and services.
Coverage: Data are available for about 77 USAID countries. CAS Code: C24P6
Present Value of Debt, Percent of GNI
Source: World Development Indicators, most recent publication series DT.DOD.PVLX.GN.ZS, based on Global Development Finance data. Definition: Present value of debt is the sum of short-term external debt plus the discounted sum of total debt service payments due on public, publicly guaranteed, and private nonguaranteed, long-term external debt over the life of existing loans. The indicator measures the value of debt relative to the GNI. Coverage: Data are available for about 80 USAID countries. Data quality: The coverage and quality of debt data vary widely among countries because of the wide spectrum of debt instruments, the unwillingness of governments to provide information, and a lack of capacity in reporting. Discrepancies are significant when exchange rate fluctuations, debt cancellations, and rescheduling occur. CAS Code: C24P7
Remittance Receipts, Percent of Exports
Source: Latest country data obtained from national data sources or IMF Article IV reviews: www.imf.org/external/np/sec/aiv/index.htm.
Benchmarking data are obtained from World Development Indicators, most recent publication. The figure is constructed by dividing workers’ remittances (receipts), series BX.TRF.PWKR.CD, by exports of goods and services, series BX.GSR.GNFS.CD.
Definition: Workers’ remittances are current transfers by migrants who are employed or intend to remain employed for more than a year in another economy in which they are considered residents. The indicator is the ratio of remittances to exports.
Coverage: Data are available for about 74 USAID countries. CAS Code: C24P8
Concentration of Exports
Source: Constructed with ITC COMTRADE data by aggregating the value for the top three export product groups (SITC Rev.3) and dividing by total exports. Raw data: http://www.intracen.org/tradstat/sitc3-3d/indexre.htm Definition: The percentage of a country’s total merchandise exports consisting of the top three products, disaggregated at the SITC (Rev. 3) 3-digit level. Coverage: Data are available for about 74 USAID countries.

T E C H N I C A L N O T E S B - 2 7
Data quality: Smuggling is a serious problem in some countries. For countries that do not report trade data to the United Nations, ITC uses partner country data. This approach has a number of shortcomings: ITC does not cover trade with nonreporting countries; transshipments may hide the actual source of supply; and transport cost and insurance are included in measuring exports but excluded in measuring imports. CAS Code: C24P9
Trade Logistics Performance Index—Customs
Source: Latest country score obtained from World Bank Logistics Performance Index country scorecard: http://info.worldbank.org/etools/tradesurvey/mode1a.asp Definition: The Logistics Performance Index is a simple average of a country’s score on seven dimensions: the efficiency and effectiveness of clearance process by customs and other border control agencies; the quality of transport and IT infrastructure for logistics; the ease and affordability of arranging shipments; competence in the local logistics industry (e.g., transport operators, customs brokers); ability to track and trace shipments; domestic logistics costs (e.g., local transportation, terminal handling, warehousing); and the timeliness of shipments in reaching destination. This indicator captures the first dimension. Coverage: Data available for about 150 countries. CAS Code: C24S1
Trade in Non-oil Goods and Services, as a Percentage of GDP
Source: Latest country data obtained from national data sources or IMF Article IV consultation reports: www.imf.org/external/np/sec/aiv/index.htm. Benchmarking data from World Development Indicators, most recent publication, series NE.TRD.GNFS.ZS. Definition: The sum of exports and imports of goods and services, divided by the value of non-oil GDP, all expressed in current U.S. dollars. Coverage: Data available for about 84 USAID countries. CAS Code: C24S2
Real Effective Exchange Rate (REER)
Source: IMF Article IV reviews: www.imf.org/external/np/sec/aiv/index.htm. Definition: The REER is an index number with base 1995=100 that measures the value of a currency against a weighted average of foreign currencies. It is calculated as the nominal effective exchange rate divided by a price deflator or index of costs. The IMF defines the REER so that an increase in the value represents a real appreciation of the home currency and a decrease represents a real depreciation. Coverage: Information on coverage is not easily accessible. Data quality: Changes in REER should be interpreted with caution. For many countries the weights from 1990 onward take into account trade in 1988–90, and an index of relative changes in consumer prices is used as the deflator. CAS Code: C24S3
Country Credit Ranking
Source: Institutional Investor Magazine http://www.iimagazinerankings.com/countrycredit/GlobalRanking.asp
Definition: Institutional Investor Magazine measures individual countries’ creditworthiness by asking senior
economists and risk managers for their predictions on credit risk, exchange rate risk, valuation correction, and risk impact.
Coverage: Data are available for about 80 USAID countries. CAS Code: C24S4
ECONOMIC INFRASTRUCTURE
Logistics Performance Index, Infrastructure
Source: Latest country score obtained from World Bank Logistics Performance Index country scorecard: http://info.worldbank.org/etools/tradesurvey/mode1a.asp Definition: The Logistics Performance Index is a simple average of a country’s score on seven factors: the efficiency and effectiveness of the clearance process by customs and other border control agencies; the quality of transport and IT infrastructure for logistics; the ease and affordability of arranging shipments; competence in the local logistics industry (e.g., transport operators, customs brokers); the ability to track and trace shipments; domestic logistics costs (e.g., local transportation, terminal handling, warehousing); and the timeliness of shipments in reaching destination. This indicator captures the second dimension. Coverage: Data available for about 150 countries. CAS Code: C25P1
Number of Electrical Outages (Days)
Source: World Bank, Enterprise Surveys, Infrastructure. http://www.enterprisesurveys.org/ Definition: This indicator shows the average number of days per year the surveyed establishment experienced power outages or surges in the public grid. Coverage: Data available for a small number of countries. CAS Code: C25P2
Telephone Density, Fixed Line and Mobile
Source: World Development Indicators, most recent publication series IT.TEL.TOTL.P3, derived from the International Telecommunication Union database. Definition: The indicator is the sum of subscribers to telephone mainlines and mobile phones per 1,000 people. Fixed lines represent telephone main lines connected to the public switched telephone network. Mobile phone subscribers refer to users of cellular-based technology with access to the public switched telephone network. Coverage: Data are available for about 88 USAID countries. CAS Code: C25P3
Internet Users per 1,000 People
Source: World Development Indicators, most recent publication series IT.NET.USER.P3, derived from the International Telecommunication Union database. Definition: Indicator quantifies the number of Internet users, defined as those with access to the worldwide network, per 1,000 people. Coverage: Data are available for about 88 USAID countries. CAS Code: C25S1
Roads Paved, Percent of Total Roads
Source: World Development Indicators, most recent publication series IS.ROD.PAVE.ZS

B - 2 8 A P P E N D I X B
Definitions: Paved roads are roads surfaced with crushed stone (macadam) and hydrocarbon binder or bituminized agents, with concrete, or with cobblestones. Coverage: Data are available for nearly all USAID countries. CAS Code: C25S2
Percentage of Households with Access to Electricity
Source: Obtained from individual country sources. Definition: Access to electricity is defined as the percentage of households that have electrical power. Coverage: Data are available for about 25 USAID countries. CAS Code: C25S3
Overall Infrastructure Quality
Source: Global Competitiveness Report 2006–2007, World Economic Forum. The indicator can be found in the Data Tables, Section V. General Infrastructure; 5.01. Definition: The index measures executives’ perceptions of general infrastructure in their respective countries. Executives grade, on a scale from 1 to 7, whether general infrastructure in their country is poorly developed (1) or among the best in the world (7). Coverage: Data are available for about 52 USAID countries. Data quality: Comparisons between countries are difficult because the data are based on executives’ perceptions. CAS Code: C25S4
Quality of Infrastructure—Air, Ports, Railroads, Electricity, and Roads
Source: Global Competitiveness Report 2006-2007, World Economic Forum. The indicators can be found in the Data Tables, Section V. General Infrastructure, 5.02, 5.03, 5.04, and 5.05 for railroad, port; air transport, and electricity, respectively. Definition: The index measures executives’ perceptions of general infrastructure in their respective countries. Executives grade, on a scale from 1 to 7, whether railroads, ports, air transport, and electricity are poorly developed (1) or among the best in the world (7). Coverage: Data are available for about 52 USAID countries. Data quality: Comparisons between countries are difficult because the data are based on executives’ perceptions. CAS Code: 25S5 a-e
HEALTH
Child Mortality Rate (per 1,000 Live Births)
Source: World Development Indicators, most recent publication series SH.DYN.MORT. Definition: The number of children dying before reaching the age of five, per 1,000 live births in a given year, if subject to current age-specific mortality rates. Coverage: Data are available for about 87 USAID countries. CAS Code: C31P1
Maternal Mortality Rate
Source: Millennium Development Goals Indicators, http://millenniumindicators.un.org/unsd/mdg/Data.aspx based on WHO, UNICEF, and UNFPA data.
Definition: The indicator is the number of women who die during pregnancy and childbirth, per 100,000 live births. Coverage: Data are available for about 87 USAID countries. Data quality: Household surveys attempt to measure maternal mortality by asking respondents about their sisters. The estimates pertain to 12 years or so before the survey, making them unsuitable for monitoring recent changes. CAS Code: C31P2
Life Expectancy at Birth
Source: World Development Indicators, most recent publication, males SP.DYN.LE00.MA.IN, females SP.DYN.LE00.FE.IN. Definition: Life expectancy at birth indicates the number of years a newborn infant would live on average if prevailing patterns of mortality at the time of his or her birth were to stay the same throughout his or her life, by sex. Coverage: Data are available for about 88 USAID countries. Data quality: Life expectancy at birth is estimated on the basis of vital registration or the most recent census or survey. Extrapolations may not be reliable for monitoring changes in health status or for comparative analytical work. CAS Code: C31P3
HIV Prevalence
Source: UNAIDS for most recent country data: http://data.unaids.org/pub/GlobalReport/2006/2006_GR_ANN2_en.pdf. World Development Indicators, most recent publication for benchmark data, series sh.dyn.aids.zs.
Definition: Percentage of people ages 15–49 who are infected with HIV.
Coverage: Data are available for about 79 USAID countries. Data quality: UNAIDS/WHO estimates are based on all available data, including surveys of pregnant women, population-based surveys, household surveys conducted by Kenya, Mali, Zambia, and Zimbabwe, and other surveillance information. CAS Code: C31S1
Access to Improved Sanitation
Source: World Development Indicators, most recent publication, series SH.STA.ACSN. Definition: The indicator is the percentage of the population with at least adequate excreta disposal facilities (private or shared, but not public) that can effectively prevent human, animal, and insect contact with excreta. Coverage: Data are available for about 82 USAID countries. Data quality: The coverage rates may include nonfunctioning systems. CAS Code: C31S2
Access to Improved Water Source
Source: World Development Indicators, most recent publication series SH.H2O.SAFE.ZS. Definition: The indicator is the percentage of the population with reasonable access to an adequate amount of water from an improved source, such as a household connection, public standpipe, borehole, protected well or spring, or rain water collection. Coverage: Data are available for about 83 USAID countries.
T E C H N I C A L N O T E S B - 2 9
Data quality: Access to drinking water from an improved source does not ensure that the water is adequate or safe. CAS Code: C31S3
Prevalence of Child Malnutrition (Weight for Age)
Source: World Development Indicators, most recent publication, series SH.STA.MALN.ZS. Definition: The indicator is based on the percentage of children under age five whose weight for age is more than minus two standard deviations below the median for the international reference population ages 0–59 months. Coverage: Data are available for about 55 USAID countries. CAS Code: C31S4
Public Health Expenditure, Percent of GDP
Source: Latest data for host country are obtained from the MCC: http://www.mcc.gov/selection/scorecards/2007/. International benchmarking data from World Development Indicators, most recent publication (SH.XPD.PUBL.ZS), based on World Health Organization, World Health Report, and updates and from the OECD, supplemented by World Bank poverty assessments and country and sector studies. Definition: Public health expenditure consists of recurrent and capital spending from government (central and local) budgets, external borrowing and grants (including donations from international agencies and NGOs), and social (or compulsory) health insurance funds. Coverage: Data are available for about 88 USAID countries. CAS Code: 31S5
EDUCATION
Net Primary Enrollment Rate, Total, Male and Female
Source: UNESCO Institute for Statistics, http://stats.uis.unesco.org/ReportFolders/reportfolders.aspx Definition: The indicator measures the proportion of the population of the official age for primary, secondary, or tertiary education according to national regulations who are enrolled in primary schools. Primary education provides children with basic reading, writing, and mathematics skills along with an elementary understanding of such subjects as history, geography, natural science, social science, art, and music. Coverage: Data are available for about 80 USAID countries. Data quality: Enrollment rates are based on data collected during annual school surveys, which are typically conducted at the beginning of the school year and do not reflect actual rates of attendance during the school year. In addition, school administrators may report exaggerated enrollments because teachers often are paid proportionally to the number of pupils enrolled. The indicator does not measure the quality of the education provided. CAS Code: C32P1
Net Secondary Enrollment Rate
Source: World Development Indicators, most recent publication, series SE.SEC.NENR. Based on data from the United Nations Educational, Scientific, and Cultural Organization (UNESCO) Institute for Statistics. Definitions: Net enrollment ratio is the ratio of children of official school age based on the International Standard Classification of Education 1997 who are enrolled in school to the population of the corresponding official school age.
Secondary education completes the provision of basic education that began at the primary level and aims at laying the foundations for lifelong learning and human development by offering more subject- or skill-oriented instruction using more specialized teachers. Coverage: Data are available for half of USAID countries. Data quality: A break the in series between 1997 and 1998 is due to a change from International Standard Classification of Education (ISCED) 76 to ISCED97. Recent data are provisional. CAS Code: C32P2
Gross Tertiary Enrollment Rate
Source: World Development Indicators, most recent publication, series SE.TER.ENRR. Based on data from the UNESCO Institute for Statistics. Definitions: Gross enrollment ratio is the ratio of total enrollment, regardless of age, to the population of the age group that officially corresponds to the level of education shown. Tertiary education, whether or not to an advanced research qualification, normally requires as a minimum condition of admission the successful completion of education at the secondary level. Coverage: Data are available for nearly all USAID countries. Data quality: A break in the series between 1997 and 1998 is due to a change from International Standard Classification of Education (ISCED) 76 to ISCED97. Recent data are provisional. CAS Code: C32P3
Persistence in School to Grade 5, Total, Male and Female
Source: World Development Indicators, most recent publication series SE.PRM.PRS5.FE.ZS (female); SE.PRM.PRS5.MA.ZS (male); and SE.PRM.PRS5.ZS (total). Definition: The indicator is an estimate of the proportion of the population entering primary school who reach grade 5, for female, male, and total students. Coverage: Data are available for about 48 USAID countries. CAS Code: C32P4
Youth Literacy Rate
Source: World Development Indicators, most recent publication, series SE.ADT.1524.LT.ZS. Definition: The indicator is an estimate of the percent of people ages 15–24 who can, with understanding, read and write a short, simple statement on their everyday life. Coverage: Data are available for about 67 USAID countries. Data quality: Statistics are out of date by two to three years. CAS Code: C32P5
Education Expenditure, Primary, Percent of GDP
Source: Millennium Challenge Corporation: http://www.mcc.gov/selection/scorecards/2007/index.php
Definition: The indicator is the total expenditure on education by all levels of government as a percent of GDP.
Coverage: Data are available for about 58 USAID countries. Data quality: The MCC obtains the data from national sources through U.S. embassies. CAS Code: C32S1
B - 3 0 A P P E N D I X B
Pupil–Teacher Ratio, Primary School
Source: World Development Indicators, most recent publication series SE.PRM.ENRL.TC.ZS. Definition: Primary school pupil–teacher ratio is the number of pupils enrolled in primary school divided by the number of primary school teachers (regardless of their teaching assignment). Coverage: Data are available for about 76 USAID countries. Data quality: The indicator does not take into account differences in teachers’ academic qualifications, pedagogical training, professional experience and status, teaching methods, teaching materials, and variations in classroom conditions—all factors that could affect the quality of teaching and learning and pupil performance. CAS Code: C32S2
EMPLOYMENT AND WORKFORCE
Labor Force Participation Rate
Source: Derived from World Development Indicators, but the precise computation differs according to whether a particular country study uses the 2004 WDI or 2005 and subsequent-year WDI. To calculate the total labor force participation rate using WDI 2004: the numerator is Labor force, total (SL.TLF.TOTL.IN), and the denominator is Population ages 15–64, total (SP.POP.1564.TO). Using WDI 2005 and subsequent years, the denominator is calculated as the total population (SP.POP.TOTL) times the percentage of the population in the age group 15–64 (SP.POP.1564.IN.ZS). Definition: The percentage of the working age population that is in the labor force. The labor force is made up of people who meet the International Labour Organization definition of the economically active population: all people who supply labor for the production of goods and services during a specified period. It includes both the employed and the unemployed. Coverage: Data are available for about 88 USAID countries. CAS Code: C33P1
Rigidity of Employment Index
Source: World Bank, Doing Business in 2007, Employing workers category: http://www.doingbusiness.org/ExploreTopics/EmployingWorkers/
Definition: The rigidity of employment index is a measure of labor market rigidity constructed as the average of the Difficulty of Hiring index, Rigidity of Hours index, and Difficulty of Firing index. The index ranges in value from 0 (minimum rigidity) to 100 (maximum rigidity).
Coverage: Data are available for nearly all USAID countries. Data quality: Compiled by the World Bank from survey responses to in-country specialists. CAS Code: C33P2
Economically Active Children, Percent of Children ages 7–14
Source: World Development Indicators, most recent publication series SL.TLF.0714.ZS. Derived from the Understanding Children’s Work project based on data from ILO, UNICEF, and the World Bank.
Definition: Economically active children refer to children involved in economic activity for at least one hour in the reference week of the survey. Coverage: Data are available for 35 USAID countries. CAS Code: C33P3
Unemployment rate (15–24-year-old males, and total 15–24 year olds)
Source: World Development Indicators, most recent publication series SL.UEM.1524.MA.ZS. Definitions: Youth unemployment refers to the share of the labor force ages 15–24 without work but available for and seeking employment. Coverage: Data are available for 35 USAID countries. Data quality: Definitions of labor force and unemployment differ by country; thus caution is needed when benchmarking. CAS Code: C33P4a-b
Informal Sector Employment, percentage of Labor Force
Source: Normally obtained from national sources such as a labor market survey. Definition: Informal sector employment is defined as economic activities that fall outside the formal economy regulated by economic and legal institutions. It is economic activity that is not taxed or included in the government’s GNP. Coverage: Data are available for about 20 USAID countries. Data quality: The indicator is inherently difficult to calculate and the methodology may differ by country; thus caution is needed when benchmarking. CAS Code: C33S1
AGRICULTURE
Agriculture Value Added per Worker
Source: World Development Indicators, most recent publication series EA.PRD.AGRI.KD, derived from World Bank national accounts files and Food and Agriculture Organization Production Yearbook and data files. Definition: Agriculture value added per worker is a basic measure of labor productivity in agriculture. Value added in agriculture measures the output of the agricultural sector (ISIC divisions 1–5)—forestry, hunting, fishing, cultivation of crops, and livestock production—less the value of intermediate inputs. Data are in constant 1995 U.S. dollars. Coverage: Data are available for about 80 USAID countries. CAS Code: C34P1
Crop production index
Source: World Development Indicators, most recent publication series AG.PRD.CROP.XD, based on FAO statistics. Definition: Crop production index shows agricultural production for each year relative to the period 1999–2001 = 100. The index includes production of all crops except fodder crops. Regional and income group aggregates for the FAO’s production indices are calculated from the underlying values in international dollars, normalized to the base period. Coverage: Data are available for about 85 USAID countries. Data quality: Regional and income group aggregates for the FAO’s production indices are calculated from the underlying
T E C H N I C A L N O T E S B - 3 1
values in international dollars, normalized to the base period 1999–2001. The FAO obtains data from official and semiofficial reports of crop yields, area under production, and livestock numbers. If data are not available, the FAO makes estimates. To ease cross-country comparisons, the FAO uses international commodity prices to value production expressed in international dollars (equivalent in purchasing power to the U.S. dollar). This method assigns a single price to each commodity, so that, for example, one metric ton of wheat has the same price regardless of where it was produced. The use of international prices eliminates fluctuations in the value of output due to transitory movements of nominal exchange rates unrelated to the purchasing power of the domestic currency. Coverage: Data are available for about 85 USAID countries. CAS Code: C34S1
Agricultural Export Growth
Source: World Development Indicators, most recent publication series TX.VAL.AGRI.ZS.UNs, Agricultural raw materials exports (percentage of merchandise exports), based on World Bank staff estimates from the COMTRADE database maintained by the United Nations Statistics Division; and series TX.VAL.MRCH.CD.WT, Merchandise exports (current US$), based on data from the World Trade Organization. Definition: Agricultural raw materials comprise SITC section 2 (crude materials except fuels), excluding divisions 22, 27 (crude fertilizers and minerals excluding coal, petroleum, and precious stones), and 28 (metalliferous ores and scrap). Merchandise exports show the f.o.b. value of goods provided to the rest of the world valued in U.S. dollars. Data are in current U.S. dollars. The indicator is calculated by multiplying agricultural raw materials by merchandise exports. The annual growth rate is then calculated from the resulting series. Coverage: Data are available for about 85 USAID countries. CAS Code: C34S2