timingandmagnitude ofdepth-dependent
TRANSCRIPT

Timing and magnitude of depth-dependent lithosphere stretching on the
southern Lofoten and northern Vøring continental margins offshore
mid-Norway: implications for subsidence and hydrocarbon maturation
at volcanic rifted margins
N. J. KUSZNIR,1 R. HUNSDALE2, A. M. ROBERTS3 and iSIMM Team4
1Department of Earth Sciences, University of Liverpool, Liverpool L69 3BX, UK
(e-mail: [email protected])2ConocoPhillips, P.O. Box 220, 4098 Tananger, Norway (current address, Statoil, 4035 Stavanger, Norway)3Badley Geoscience, Hundleby, Spilsby, Lincolnshire PE23 5NB, UK4iSIMM Team comprises P. A. F. Christie, N. J. Kusznir, A. M. Roberts, R. S. White, N. W. Hurst,
V. Tymms, D. Healy, Z. C. Lunnon, C. J. Parkin, A. W. Roberts, L. K. Smith & R. Spitzer
Abstract: Subsidence analysis on the southern Lofoten and northern Vøring segments of the Norwegian rifted
margin shows depth-dependent stretching of continental margin lithosphere in which lithosphere stretching and
thinning at continental break-up at,54Ma greatly exceeds that of the upper crust within 100 km landward of the
COB. For the southern Lofoten margin lithosphere b stretching factors approaching infinity are required at 54Ma
west of the Utrøst Ridge to restore the top Basalt (inner lava flow) reflectors and top Tare formation (54Ma) to
presumed sub-aerial depositional environments, while for the northern Vøringmargin lithosphere b values of 2.5
are required. In contrast, upper crustal extension by faulting shows little stretching with b , 1.1 at break-up or
immediately preceding break-up in the Paleocene and Late Cretaceous. The presence of lithosphere depth-
dependent stretching and the absence of significant Paleocene and Late Cretaceous upper crustal extension imply
that depth-dependent stretching of the southern Lofoten and northern Vøring margins occurred during sea-floor
spreading initiation rather than during pre-break-up intra-continental rifting. Depth-dependent stretching, where
upper-crustal extension is significantly smaller than whole-crustal or whole-lithosphere extension within 75–
150 km of the COB, has been observed worldwide for both volcanic and non-volcanic rifted continental margins.
Temperature and hydrocarbon maturation modelling show that the inclusion of depth-dependent stretching has an
important effect on temperature and hydrocarbon maturation evolution in depth and time. Failure to include the
large b factors for the lower crust and lithosphericmantle (below the less stretched upper crust) leads to a serious
under-prediction of temperature and hydrocarbon maturation. While the effect of emplacing thick sill intrusions
or magmatic underplating at continental break-up has an important effect on predicted temperature and %VR,
their effects can be small in comparison with that of depth-dependent stretching.
Keywords: rifted continental margins, continental break-up, continental rifting, depth-dependent lithosphere
stretching, heat flow, hydrocarbon maturation, Norwegian continental margin
Depth-dependent lithosphere stretching, in which extension and
thinning of the whole crust and lithosphere of the rifted continental
margin greatly exceeds that of the upper crust, has been observedat many rifted continental margins (Roberts et al. 1997; Driscoll&
Karner 1998; Davis & Kusznir 2004). Stretching estimates may be
independently determined for the upper crust, the whole crust, and
the lithosphere for continental rifted margins using three
independent data sets and methodologies (Fig. 1a). Extensionand thinning of the upper crust may bemeasured using fault heaves
from seismic reflection data; of the whole crust using crustal
basement thinning derived from crustal structure using wide angle
seismology and gravity studies; and of the whole lithosphere
from post-break-up subsidence using flexural backstripping ofpost-break-up stratigraphic data.
An example of these three independent stretching and thinning
estimates is shown for theGobanSpur riftedmargin inFigure 1b–d.
Profiles of b stretching factors and thinning factor (1-1/b) show
upper crustal stretching and thinningwhich is substantially less thanthat of thewhole crust and lithospherewithin approximately 100 km
landward of the continent–ocean boundary. Error analysis shows
that the stretching and thinning differences between the upper crust,
and the deeper whole crust and lithosphere levels are statistically
significant for this region (Davis&Kusznir 2004). Further towards
the continent, stretching and thinning estimates converge as bfactors tend to 1. Similar analyses have been carried out for the
South China Sea, Galicia, Vøring, Møre, Vulcan and Exmouth
Plateau margins (Roberts et al. 1997; Driscoll & Karner 1998;
Baxter et al. 1999;Davis&Kusznir 2004) and show similar results
inwhich stretching of thewhole crust and lithosphere of continentalmargins greatly exceeds that of the upper crust. The total margin
extension may be determined by integrating the thinning-factor
(1-1/b) across the continental margin. Margin extension is
summarized in Figure 1e for a number of rifted continental
margins. In all cases stretching of the whole crust and lithosphereexceeds that of the upper crust. Depth-dependent stretching is
observed at both non-volcanic and volcanic continental margins.
A key question is the timing of depth-dependent lithos-
phere stretching at rifted margins. Does depth-dependent stretch-
ing occur during pre-breakup intracontinental rifting, or doesdepth-dependent stretching occur during sea-floor spreading
initiation? In order to answer this question, good strati-
graphic resolution of the pre- and post-break-up stages
KUSZNIR, N. J., HUNSDALE, R., ROBERTS, A.M.& iSIMM Team 2005.Norwegian margin depth-dependent stretching. In: DORE, A. G.&VINING, B. A. (eds)Petroleum Geology: North-West Europe and Global Perspectives—Proceedings of the 6th Petroleum Geology Conference, 767–783. q Petroleum GeologyConferences Ltd. Published by the Geological Society, London.

of margin evolution is required. The Lofoten and Vøring riftedmargins have good stratigraphic resolution of the Upper Cretac-eous and Paleocene sequences preceding continental break-up andsea-floor spreading initiation at ,54Ma.An analysis of pre- and post-break-up subsidence, and
Paleocene and Late Cretaceous upper-crustal fault extensionhas been carried out on the southern Lofoten and northern Vøringmargins. Three profiles have been studied and their locations areshown in Figure 2a on a map showing the N Atlantic pre-break-upmargin restoration at ,54Ma (adapted from Eide, 2002) and inFigure 2b showing the present-day margin geometry and continentocean boundary (adapted from Tsikalas et al. 2001). The three
profiles form part of a regional study on the mid-Norway Margininvolving the construction of regional cross sections extendingfrom the area of the continent–ocean boundary to close to thecoast. Horizon picking from seismic reflection data was con-strained by well data where possible. The sections were depthconverted using a regional velocity model that incorporated allavailable well information and seismic stacking velocities. Thedepth sections also satisfactorily model the present-day gravityfield. Pre-basalt sediment thickness and basalt thicknesses weredetermined using seismic refraction and potential field data(Mjelde et al. 1993; Tsikalas et al. 2001). Geological interpret-ations of depth converted seismic sections for the three profiles areshown in Figure 2c–e. Profile 3 extends westwards on to oceaniccrust according to magnetic anomaly data and other geophysicalwork (Mjelde et al. 1993; Tsikalas et al. 2001, 2002; Mosar et al.2002; Sigmond, 2002), while profiles 1 and 2 extend westwards tonear the continent–ocean boundary. Profile 2 crosses the BivrostLineament.The Lofoten and Vøring margins, like most of the NW
European continental margin, have a prolonged history ofextension from the Devonian through to continental break-up atthe start of the Eocene (Eldholm et al. 1989; Dore, 1991; Blystadet al. 1995; Skogseid & Eldholm et al. 2000; Lundin & Dore,
1997; Dore et al. 1999; Roberts et al. 1999; Brekke 2000). Themain rift phases are widely held to be Early Triassic, Middle toLate Jurassic, Early Cretaceous, and Late Cretaceous toPaleocene leading to break-up at the beginning of the Eocene(Talwani & Eldholm 1977; Eldholm et al. 1989; Blystad et al.1995; Skogseid et al. 2000; Lundin & Dore, 1997). TheNorwegian–Greenland Sea opened during Chron 24r (53.35–55.90Ma: Cande & Kent, 1992; Talwani & Eldholm 1977;Skogseid et al. 2000; Tsikalas et al. 2002). The age of break-up isestimated from the age of the first definitive magnetic anomaly,Anomaly 24B (Sigmond, 2002; Skogseid et al. 2000; Tsikalaset al. 2002) which, based on the timescale of Cande & Kent
(1992), has an age of 53.9Ma and lies within the earliest Eocene.Tsikalas et al. (2002) have suggested that early opening may havecommenced at ,54.6Ma. For modelling purposes we use 54Mafor the age of the top Tare Formation reflector (Dalland et al.1988; Berggren et al. 1995; Ren et al. 2003) and 54.1Ma for theage of break-up and top Basalt inner lava flow reflector.The break-up of the Norwegian continental margin took placein the presence of a mantle plume or mantle hot spot, leading tothe formation of a volcanic margin (White & McKenzie 1989,1995; Eldholm et al. 1995).The analysis of pre- and post-break-up subsidence has been
carried out using reverse post-rift subsidencemodelling, consistingof flexural backstripping and reverse post-break-up thermalsubsidence modelling. The principles of this technique aresummarized in Figure 3a and are described in detail in Kuszniret al. (1995) and Roberts et al. (1998). Using this analysistechnique, a present-day depth-converted section is sequentiallybackstripped to base post-rift or base post-break-up, the remainingstratigraphic units are decompacted, and the flexural isostaticrebound due to sediment load removal and decompaction iscomputed and applied to the backstripped and decompactedsection. In addition post-rift or post-break-up thermal subsidenceis applied to the backstripped section using flexural isostasy.
Fig. 1. (a) Continental margin extension and thinning can be measured at the levels of the upper crust, the whole crust and the lithosphere using three
distinct data sets and techniques. (b–d) Example of depth-dependent stretching for the Goban Spur non-volcanic margin. Stretching of the upper crust is
much less than that of the whole crust and lithosphere. (e) Comparison of upper crustal, whole crustal and lithosphere extension showing depth-dependent
stretching for the Goban Spur, S. China Sea, Exmouth Plateau, Vøring and Vulcan Basin margins.
Fig. 2. The location of lines 1, 2 and 3 on the southern Lofoten and northern Vøring margins used in this study superimposed on (a) plate reconstruction
to ,54Ma (after Eide, 2002) and (b) present-day map showing ocean isochrons, COB and main structural elements (after Tsikalas et al. 2001). Line 2
and 3 are located on the southern Lofoten margin. Line 1 is located on the northern Vøring margin. Line 3 extends 50 km onto oceanic crust to the NW
(Mosar et al. 2002). Line 2 crosses the Bivrøst Lineament. (c–e) Interpretations of depth converted cross sections for Lines 1, 2 and 3. UR, Utrøst Ridge;
COB, continent–ocean boundary; BFZ, Bivrøst Fracture Zone; JMFZ, Jan Mayen Fracture Zone.
N. J. KUSZNIR ET AL.768

NORWEGIAN MARGIN DEPTH-DEPENDENT STRETCHING 769

Post-break-up thermal subsidence depends on lithosphere stretch-
ing and is computed using a trial b factor (McKenzie 1978). The
application of flexural backstripping and reverse post-break-up
thermal modelling produces a series of restored sections, which
can be tested or calibrated against observed palaeobathymetry
data. This technique may be used to predict palaeobathymetry
from known b factor distribution, or alternatively (as in the case of
the work described in this paper) can be used to determine b factor
distribution from palaeobathymetry constraints. The analysis of
Paleocene and Late Cretaceous upper-crustal fault extension has
been carried out using the flexural cantilever model of continental
lithosphere extension. This technique may be used to forward
model syn- and post-rift basin development (Fig. 3b and c), and is
described in detail in Kusznir et al. (1991) and Kusznir & Ziegler
(1992). The flexural cantilever model has been used to quantify
lithosphere extension associated with faulting during the Paleo-
cene and Late Cretaceous. Whole crustal thinning and stretching
have not been determined for the LofotenMargin because volcanic
addition has also modified crustal thickness (Mjelde et al. 1993).
A key requirement of our subsidence analysis using reverse
post-rift subsidence modelling is knowledge of the palaeobathy-
metries of the top Tare and top Basalt reflector levels in order to
determine the lithosphere b factors controlling post-break-up
thermal subsidence. ODP and DSDP well data suggest that the
Tare formation and basalt inner flow sequences were deposited or
extruded in a terrestrial or shallow marine environment (Eldholm
et al. 1989), or that basaltic and sediment material of this age were
emergent and being eroded (Caston 1976; Talwani & Eldholm
1972). A more comprehensive discussion of palaeobathymetry,
depositional environments and age constraints at break-up on
thesouthern Lofoten and northern Vøring margins is given in
Kusznir et al. (2004).
Depth-dependent stretching on the southern Lofotenand northern Vøring margins
The analysis of pre- and post-break-up subsidence and faulting ofthe three Lofoten and Vøring margin profiles was carried out aspart of a regional study designed to develop a tectono-stratigraphicframework for the Norwegian Sea. Particular aims of the studywere the evaluation of the tectonic history of the Lofoten Marginthrough structural and stratigraphic modelling, and on thedetermination of the spatial and temporal distribution of litho-sphere subsidence and stretching.
Line 2 (southern Lofoten Margin)
Break-up rifting. Flexural backstripping and reverse post-break-up modelling has been carried out for the three modelled crosssections to determine the break-up lithosphere b factor. Thepreferred model of the present-day section for line 2, restored totop Tare formation and top Basalt times, is shown in Figure 4. Thismodelling procedure restores top Tare and top Basalt to near sea-level at ,54Ma (break-up age) consistent with theirpalaeobathymetries at that time. The preferred restorationrequires a break-up lithosphere b stretching factor, whichapproaches infinity towards the ocean and rapidly tends to b ¼ 1east of the Utrøst Ridge.An earlier rift event with b ¼ 1.3 at 142Ma is included in the
model to represent the residual thermal subsidence of the earlierLate Jurassic–Early Cretaceous rift event (Roberts et al. 1997).The omission of the earlier Late Jurassic–Early Cretaceous riftevent in the flexural backstripping and reverse post-break-upmodelling would lead to an increase in themagnitude of the break-up lithosphere b factors required to restore top Tare and top Basaltto near sea-level at ,54Ma. Sensitivity tests of the determined
Fig. 3. (a) Schematic diagram showing application of flexural backstripping and reverse post-rift modelling to predict sequential restorations of post-rift
stratigraphy and palaeobathymetry. Restored sections are dependent on the b factor used to define the magnitude of lithosphere extension at rifting and
lithosphere flexural strength during isostatic load removal. Flexural backstripping and reverse post-rift modelling may be used to determine the b factor
from a knowledge of palaeobathymetry. (b) Schematic diagrams showing application of the flexural cantilever model of continental lithosphere extension to
the syn-rift stage of basin development. Crustal extension of the upper crust on planar faults generates footwall uplift and hanging wall collapse. Plastic
deformation in the lower crust and mantle are quantified by a 2D b stretching-factor. (c) The interference of footwall uplift and hanging-wall collapse gives
rise to the familiar half-grabens, rotated fault blocks and horsts of rift tectonics depending on fault polarity.
N. J. KUSZNIR ET AL.770

break-up lithosphere b factor to the magnitude of Late Jurassic–
Early Cretaceous rifting is given by Roberts et al. (1997).Volcanic
addition through sill intrusion and magmatic underplating
undoubtedly occurred during the Paleocene prior to continental
break-up at ,54Ma. The flexural backstripping and reverse post-
break-up modelling procedure shown in Figure 4 restores a
present-day section to top Tare and top Basalt time at ,54Ma.
Any permanent crustal uplift due to magmatic underplating
occurring before break-up will not effect the restoration shown
in Figure 4. If permanent uplift due to magmatic underplating did
take place since break-up at ,54Ma, this would lead to an
underestimate of break-up lithosphere stretching-factors.
Restored cross sections using constant b factors of 1, 2, 5 and
infinity to define the reverse thermal subsidence are shown in
Figure 5. Increasing the break-up b factor to significantly greater
than b ¼ 1 east of the Utrøst Ridge produces a restoration of top
Tare and top Basalt reflectors at ,54Ma too high above sea-level
which is inconsistent with palaeobathymetric evidence, while
using values of b factor significantly less than infinity on the
western oceanic end of the profile fails to restore top Tare and topBasalt reflectors to sea-level at ,54Ma.The preferred restoration model (Fig. 4) includes a Late Paleo-
cene plume dynamic uplift with amplitude of 300 m (Nadin &Kusznir 1995; Nadin et al. 1997). While the large lithosphereb factors at the oceanic end of the profile may be reduced byincreasing plume dynamic uplift above 300m, larger values ofPaleocene plume uplift elevate the continental part of the sectioneast of the Utrøst Ridge too high at top Tare and top Basalt times,leading to erosion which is not observed. The preferred restorationmodel uses a lithosphere elastic thickness (Te) of 3 km. Tests showthat the restorations and the derived break-up lithosphere b factorare not sensitive to Te due to the relatively long wavelength of thesediment and thermal subsidence loads. Sensitivity tests to b factorTe and rift age are shown in greater detail in Kusznir et al. (2004).
Paleocene rifting. The results of flexurally backstripping,decompaction and reverse thermal subsidence modelling of theline 2 section from top Tare to base Tertiary at 65Ma are shown in
Fig. 4. Restored cross sections for line 2 (southern Lofoten margin) produced by 2D flexural backstripping and reverse post-rift modelling from
present day to top Tare at 54Ma and top Basalt reflector levels at 54.1Ma. Break-up age is 54.1Ma. Lithosphere b factor varies laterally decreasing from
b ¼ infinity near COB in the west to b ¼ 1 in east. Transient mantle plume uplift for Upper Paleocene is 300m. Earlier Jurassic-Cretaceous rift at
142Ma with b ¼ 1:3: Lithosphere effective elastic thickness Te ¼ 3 km. The top Tare and top Basalt horizons are restored to sea-level at ,54Ma
consistent with depositional environments.
NORWEGIAN MARGIN DEPTH-DEPENDENT STRETCHING 771

Figure 6. The starting point for this restoration sequence is asection backstripped, decompacted and flattened to sea-level at topTare, consistent with the near sea-level palaeobathymetriesthought to exist at this time. The preferred restoration usesb ¼ 1 for Paleocene rifting, and an earlier rift event with b ¼ 1.3at 142Ma. Using a Paleocene stretching-factor significantlygreater than b ¼ 1 produces a set of Paleocene restorations thatbecome increasingly emergent as time is wound back to 65Ma,which is inconsistent with the observed depositional environments.The restorations from top Tare to 65Ma (Fig. 6) show that nosignificant Paleocene faulting occurred prior to break-up and thatthe associated Paleocene lithosphere stretching factor is negligible.
Late Cretaceous rifting. Late Cretaceous faulting andlithosphere extension has been investigated for line 2 bybackstripping and reverse thermal subsidence modelling thesection from 65Ma to 81.5Ma, from a starting section obtainedby backstripping, decompaction and flattening to sea-level at65Ma, consistent with the near sea-level palaeobathymetriesthought to exist at this time. The Late Cretaceous sectionsproduced by reverse modelling are shown in Figure 7, and use aLate Cretaceous b factor of 1.05 (at 81.5Ma) and an earlier Late
Jurassic–Early Cretaceous rift b factor of 1.3 (at 142Ma). Therestored sections in the interval 65 to 81.5Ma show very littleevidence of faulting other than a large eastward dipping fault to theeast of the Utrøst Ridge, and smaller westward dipping faults to thewest of the Utrøst Ridge. The use of a Late Cretaceous b factormuch greater than 1.05 in the reverse thermal subsidence modelelevates the restored section too high above sea-level at 81.5Ma,inconsistent with the marine depositional environments thought tohave existed during the Late Cretaceous on the Lofoten margin.Late Cretaceous extensional faulting on line 2 has also been
forwardmodelled using the flexural cantilever model (Fig. 3). Thistechnique has been used to quantify the upper-crustal faultextension during this time. The reverse modelled section to81.5Ma (Fig. 7) has been used as a target to constrain the forwardmodel. The forwardmodel (Fig. 7) gives a peak b factor of 1.03 forLate Cretaceous extension on line 2. The combined techniques ofreverse post-rift modelling and forward flexural cantilevermodelling give an upper bound of b ¼ 1.05 for Late Cretaceousextension on line 2.Additional mid-Cretaceous continental rifting of Aptian-Albian
age also occurred on the Lofoten and northern Vøring margin.However lithosphere extension at this time was small incomparison to that of break-up at ,54Ma and is beyond thescope of this paper.
Line 1 (northern Vøring Margin)
Break-up rifting. This profile is located in the northern part of theVøring Basin to the south of the Bivrost Fracture Zone andLineament. Reverse post-break-up modelling of line 1 (Fig. 8),using a similar approach to that used for line 2, predicts a break-uplithosphere b factor, decreasing from 2.5 in the west to 1 in theeast, in order to restore top Tare and top Basalt to sea-level atbreak-up time. Break-up lithosphere b factors are substantially lessthan for line 2 and 3. The break-up lithosphere b factorsdetermined from this analysis are similar to those obtained byRoberts et al. (1997) for the Vøring margin.
Paleocene and Late Cretaceous rifting. Forward and reversemodelling procedures similar to those used for line 2 have beenused to investigate Paleocene and Late Cretaceous rifting for line 1(Fig. 9). Lofoten line 1 shows a maximum b of 1.1 for LateCretaceous rifting. This is more Late Cretaceous extension than forline 2, but very small compared with the lithosphere b stretchingfactor of 2.5 determined from post break-up thermal subsidence(Fig. 8). The backstripping analysis (Fig. 9) also suggests that verylittle extension occurred in the Paleocene compared with the LateCretaceous.
Line 3 (Southern Lofoten Margin)
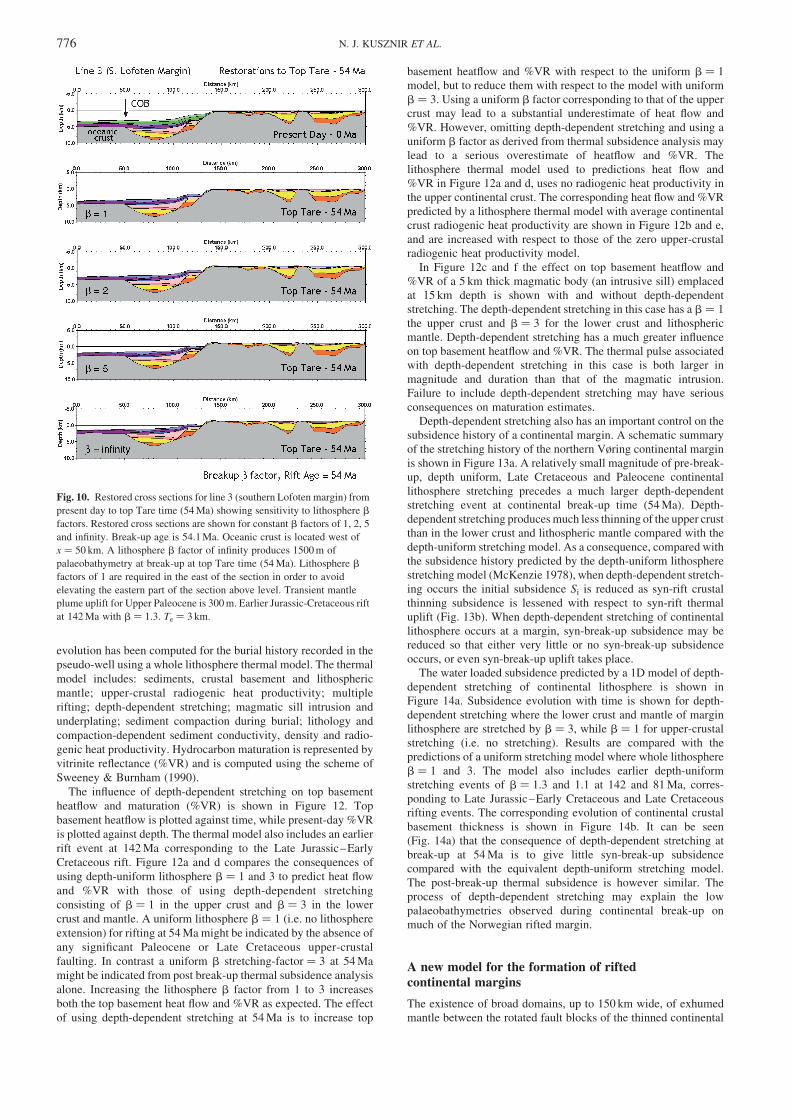
Break-up rifting. Line 3 lies to the north of the Bivrost FractureZone and Lineament (Fig. 2) and extends in the west onto oceaniccrust. The continent–ocean boundary is located at approximately50 km from the western end of profile. Restored cross sections totop Tare produced by flexural backstripping and reverse thermalsubsidence modelling using constant b factors of 1, 2, 5 andinfinity are shown in Figure 10. Increasing the break-up b factor tosignificantly greater than 1 to the east of the Utrøst Ridge(x ¼ 150 km) produces a restoration of top Tare at 54Ma too highabove sea-level, which is inconsistent with palaeobathymetricevidence. For this profile, in contrast to line 2, a break-uplithosphere b factor of infinity cannot restore top Tare and topBasalt to sea-level at ,54Ma in the west of the section. Using abreak-up lithosphere b factor of infinity still produces a residualwater depth of, 1500m. The restoration models include an earlierrift event with b ¼ 1.3 at 142Ma to represent the earlier LateJurassic–Early Cretaceous rift. The western 50 km of line 3 arelocated on oceanic crust for which the lithosphere b factor isinfinity.
Fig. 5. Sensitivity tests of restored cross sections for line 2 (southern
Lofoten margin) to lithosphere b factors. Restored cross section are shown
for constant b factors of 1, 2, 5 and infinity and correspond to top Tare time
(54Ma). Break-up age is 54Ma. A lithosphere b factor of infinity is
required in the west of the profile to restore top Tare to sea level at 54Ma.
Lithosphere b factors of 1 are required in the east of the section in order to
avoid elevating the eastern part of the section above level.Other modelling
parameters are identical to those of the model shown in Figure 4.
N. J. KUSZNIR ET AL.772

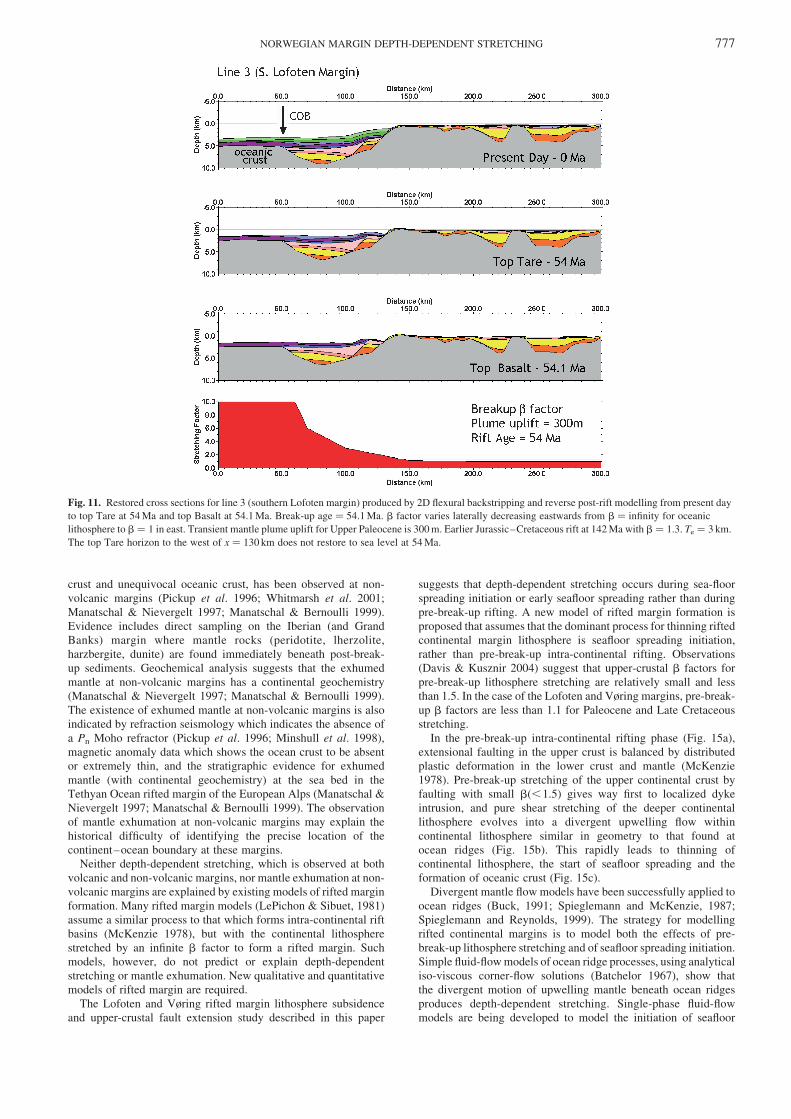
The results of reverse post-break-up modelling the present-daysection for line 3 to top Tare and top Basalt times at,54Ma, witha b factor varying from infinity for the oceanic crust in the westto b ¼ 1 to the east of the Utrøst Ridge, are shown in Figure 11.The Paleocene plume dynamic uplift in the restorations shown inFigures 10 and 11 is 300m (Nadin et al. 1997). The bathymetricdiscrepancy in the west can be reduced to zero by increasing thePaleocene dynamic uplift to 1500m. However, such large plumeuplift would have elevated the inboard part of the Lofoten marginhigh above sea-level, leading to widespread erosion, which is notobserved.The palaeobathymetries predicted for line 3 for the oceanic crust
west of 50 km at top Tare (break-up) time are in the order of,1500m (Figs 10 and 11). This predicted oceanic palaeobathymetryis less than the water depth expected for an ocean ridge withaverage ocean crustal thickness but is consistent with an oceanridge water depth where the basaltic ocean crust is overthickened,as is expected for a volcanic margin.If the palaeobathymetric evidence for zero bathymetry at top
Tare and top Basalt times, seen in the ODP and DSDP wells to thesouth (Caston, 1976; Talwani & Eldholm 1972; Eldholm et al.1989), can be extrapolated to line 3 on the southernLofotenmargin,then the restorations shown in Figures 10 and 11 imply that line 3experienced an additional subsidence event younger than top Tare(i.e. post-54Ma) for the region between profile distances of 50 and130 km. Seismic facies analysis for line 3 independently suggests
that the lava sequences were emergent at the time of theirdeposition. If the assumption of zero bathymetry for line 3 at topTare and top Basalt time is valid, this discrepant bathymetry andadditional post-break-up subsidence had a long wavelength(.50 km), and as a consequence it is unlikely to be solely explainedby hanging-wall subsidence of themajor extensional fault system tothe west of the Utrøst Ridge. It is more likely that this long-wavelength discrepant subsidence was generated by post-break-upEocene thinning of the lower crust of the continental margin. Thisadditional subsidence event may have occurred in the early Eoceneduring seafloor spreading initiation, although there is no availabledata to constrain its precise timing. An alternative mechanism forexplaining the discrepant Eocene subsidence is the evacuation ofmolten crustal underplating material oceanward as sea-floorspreading commenced. However, lower crustal magmatic under-plating bodies (LCBs) are not observed on the Lofoten continentalmargin segment (Mjelde et al. 1993, 1998; Tsikalas et al. 2001).Alternatively it may be that the palaeobathymetric evidence for
zero bathymetry at top Tare and top Basalt times seen in the ODPand DSDP wells to the southmay not be extrapolated to line 3, andthat palaeobathymetries between distances of 50 and 130 kmon line 3 were in the order of, 1000 to, 1500m, as shown inFigure 11. Planke et al. (2000) and Berndt et al. (2001) havepresented evidence based on volcanic seismic facies data for amarine volcanic extrusion environment at break-up time for theLofoten margin.
Fig. 6. Restored cross sections for line 2 (southern Lofoten margin) from 54 to 65Ma produced by flexural backstripping and reverse post-rift modelling
from section flattened to sea-level at 54Ma. b ¼ 1 (no stretching) for Early–Mid-Paleocene rift. Earlier Jurassic–Cretaceous rift at 142Ma with b ¼ 1.3.
Transient mantle plume uplift for Upper Paleocene is 300m. Te ¼ 3 km. The restored sections show no significant faulting in the interval 54 to 65Ma.
NORWEGIAN MARGIN DEPTH-DEPENDENT STRETCHING 773

Summary of observations for the southern Lofoten
and northern Vøring margins
For the southern Lofoten and northern Vøring margins, large bfactors are required at ,54Ma to restore top Basalt and the top
Tare to sub-aerial depositional environments. In contrast these
margins show upper-crustal faulting in the Paleocene and Late
Cretaceous with b factors less than 1.1.The southern Lofoten and
northern Vøring segments of the Norwegian margin show depth-
dependent stretching of lithosphere at continental break-up. Break-
up on the southern Lofoten and northern Vøring margins is not
preceded by significant Paleocene or latest Cretaceous extension.
The lack of significant Paleocene extension on the southern
Lofoten and northern Vøring margins implies that depth-
dependent stretching of the continental margin lithosphere
occurred during sea-floor spreading initiation rather than pre-
break-up intra-continental rifting. Depth-dependent stretching also
been observed and mapped further south on the Vøring margin
(Roberts et al. 1997) and on the Møremargin (Roberts&Hunsdale
unpublished).
Depth-dependent stretching of continental margin lithosphere
occurs at both volcanic and non-volcanic margins (Roberts et al.
1997; Driscoll & Karner 1998; Davis & Kusznir 2004). Commonto all observations is stretching of the upper crust, as indicated byextensional faulting, which is substantially less than stretching andthinning of the whole crust and mantle. Possible explanations forthis observation are: subseismic resolution faulting; secondgeneration faulting; aseismic extension; and poor seismic imaging.These possible explanations are examined in detail by Davis &Kusznir (2004) who conclude that the observed extensiondiscrepancies are real and not explained by any of the above.Sub-seismic resolution faulting (Walsh et al. 1991) may accountfor up to 40% of the ‘missing’ extension in the upper crust, butcannot explain the much larger observed differences in stretchingand thinning between the upper crust, and that of the whole crustand mantle (Fig. 1e).
Implications of depth-dependent stretching onhydrocarbon maturation and margin subsidence
The implications of depth-dependent stretching for sedimenttemperature and hydrocarbon maturation history have beencalculated for a pseudo-well extracted from line 2 at a distanceof 60 km (Fig. 4) from the western end of the profile. Temperature
Fig. 7. (a) Restored cross sections for line 2 (southern Lofoten margin) from 65 to 81.5Ma produced by flexural backstripping and reverse post-rift modelling
from flattened section to sea-level at 65Ma. b ¼ 1.05 for Upper Cretaceous rift with rift age ¼ 81.5Ma. Earlier Jurassic–Cretaceous rift at 142Ma with
b ¼ 1.3. Te ¼ 3 km. The restored cross section at 81.5Ma shows evidence of minor faulting in the interval 65 to 81.5Ma. (b) 2D syn-rift forward model of
Late Cretaceous rifting for southern Lofoten line 1. Target stratigraphy derived by reverse post-rift modelling to 81.5Ma. Te ¼ 3 km. The forward model
predicts a maximum b factor of 1.05. Reverse and forward models are consistent at 81.5Ma.
N. J. KUSZNIR ET AL.774

Fig. 8. Restored cross sections for line 1 (northern Vøring margin) produced by 2D flexural backstripping and reverse post-rift modelling from present
day to top Tare at 54Ma. Rift age ¼ 54.1Ma. Lithosphere b factor varies laterally decreasing from b ¼ 2.5 to b ¼ 1 in east. Transient mantle plume uplift
for Upper Paleocene is 300m. Earlier Jurassic–Cretaceous rift at 142Ma with b ¼ 1.3. Te ¼ 3 km. The top Tare and top Basalt horizons are restored to
sea-level at ,54Ma consistent with depositional environments.
Fig. 9. (a) Restored cross sections for line 1 (northern Vøringmargin) from 54 to 81.5Ma produced by flexural backstripping and reverse post-rift modelling
from section flattened to sea-level at top Tare (54Ma). b ¼ 1.1 for Late Cretaceous rift with rift age ¼ 81.5Ma. Earlier Jurassic–Cretaceous rift at
142Ma with b ¼ 1.3. Te ¼ 3 km. The restored cross section at 81.5Ma shows evidence of faulting in the interval 65 to 81.5Ma. (b) 2D syn-rift forward
model of Late Cretaceous rifting for line 1. Target structural geometry derived by reverse post-rift modelling to 81.5Ma. Te ¼ 3 km. The forward model
predicts a maximum b factor of 1.1. Reverse and forward models are consistent at 81.5Ma.
NORWEGIAN MARGIN DEPTH-DEPENDENT STRETCHING 775
evolution has been computed for the burial history recorded in the
pseudo-well using awhole lithosphere thermal model. The thermal
model includes: sediments, crustal basement and lithospheric
mantle; upper-crustal radiogenic heat productivity; multiple
rifting; depth-dependent stretching; magmatic sill intrusion and
underplating; sediment compaction during burial; lithology and
compaction-dependent sediment conductivity, density and radio-
genic heat productivity. Hydrocarbon maturation is represented by
vitrinite reflectance (%VR) and is computed using the scheme of
Sweeney & Burnham (1990).
The influence of depth-dependent stretching on top basement
heatflow and maturation (%VR) is shown in Figure 12. Top
basement heatflow is plotted against time, while present-day %VR
is plotted against depth. The thermal model also includes an earlier
rift event at 142Ma corresponding to the Late Jurassic–Early
Cretaceous rift. Figure 12a and d compares the consequences of
using depth-uniform lithosphere b ¼ 1 and 3 to predict heat flow
and %VR with those of using depth-dependent stretching
consisting of b ¼ 1 in the upper crust and b ¼ 3 in the lower
crust and mantle. A uniform lithosphere b ¼ 1 (i.e. no lithosphere
extension) for rifting at 54Mamight be indicated by the absence of
any significant Paleocene or Late Cretaceous upper-crustal
faulting. In contrast a uniform b stretching-factor ¼ 3 at 54Ma
might be indicated from post break-up thermal subsidence analysis
alone. Increasing the lithosphere b factor from 1 to 3 increases
both the top basement heat flow and %VR as expected. The effect
of using depth-dependent stretching at 54Ma is to increase top
basement heatflow and %VR with respect to the uniform b ¼ 1model, but to reduce them with respect to the model with uniform
b ¼ 3. Using a uniform b factor corresponding to that of the uppercrust may lead to a substantial underestimate of heat flow and
%VR. However, omitting depth-dependent stretching and using auniform b factor as derived from thermal subsidence analysis may
lead to a serious overestimate of heatflow and %VR. Thelithosphere thermal model used to predictions heat flow and
%VR in Figure 12a and d, uses no radiogenic heat productivity inthe upper continental crust. The corresponding heat flow and%VR
predicted by a lithosphere thermal model with average continentalcrust radiogenic heat productivity are shown in Figure 12b and e,
and are increased with respect to those of the zero upper-crustalradiogenic heat productivity model.
In Figure 12c and f the effect on top basement heatflow and%VR of a 5 km thick magmatic body (an intrusive sill) emplaced
at 15 km depth is shown with and without depth-dependentstretching. The depth-dependent stretching in this case has a b ¼ 1
the upper crust and b ¼ 3 for the lower crust and lithosphericmantle. Depth-dependent stretching has a much greater influence
on top basement heatflow and %VR. The thermal pulse associatedwith depth-dependent stretching in this case is both larger in
magnitude and duration than that of the magmatic intrusion.Failure to include depth-dependent stretching may have serious
consequences on maturation estimates.Depth-dependent stretching also has an important control on the
subsidence history of a continental margin. A schematic summaryof the stretching history of the northern Vøring continental margin
is shown in Figure 13a. A relatively small magnitude of pre-break-up, depth uniform, Late Cretaceous and Paleocene continental
lithosphere stretching precedes a much larger depth-dependentstretching event at continental break-up time (54Ma). Depth-
dependent stretching producesmuch less thinning of the upper crustthan in the lower crust and lithospheric mantle compared with the
depth-uniform stretchingmodel.As a consequence, comparedwiththe subsidence history predicted by the depth-uniform lithosphere
stretchingmodel (McKenzie 1978),when depth-dependent stretch-ing occurs the initial subsidence Si is reduced as syn-rift crustal
thinning subsidence is lessened with respect to syn-rift thermaluplift (Fig. 13b). When depth-dependent stretching of continental
lithosphere occurs at a margin, syn-break-up subsidence may bereduced so that either very little or no syn-break-up subsidence
occurs, or even syn-break-up uplift takes place.The water loaded subsidence predicted by a 1D model of depth-
dependent stretching of continental lithosphere is shown inFigure 14a. Subsidence evolution with time is shown for depth-
dependent stretching where the lower crust and mantle of marginlithosphere are stretched by b ¼ 3, while b ¼ 1 for upper-crustal
stretching (i.e. no stretching). Results are compared with thepredictions of a uniform stretchingmodel where whole lithosphere
b ¼ 1 and 3. The model also includes earlier depth-uniformstretching events of b ¼ 1.3 and 1.1 at 142 and 81Ma, corres-
ponding to Late Jurassic–Early Cretaceous and Late Cretaceousrifting events. The corresponding evolution of continental crustal
basement thickness is shown in Figure 14b. It can be seen(Fig. 14a) that the consequence of depth-dependent stretching at
break-up at 54Ma is to give little syn-break-up subsidencecompared with the equivalent depth-uniform stretching model.
The post-break-up thermal subsidence is however similar. Theprocess of depth-dependent stretching may explain the low
palaeobathymetries observed during continental break-up onmuch of the Norwegian rifted margin.
A new model for the formation of riftedcontinental margins
The existence of broad domains, up to 150 km wide, of exhumedmantle between the rotated fault blocks of the thinned continental
Fig. 10. Restored cross sections for line 3 (southern Lofoten margin) from
present day to top Tare time (54Ma) showing sensitivity to lithosphere b
factors. Restored cross sections are shown for constant b factors of 1, 2, 5
and infinity. Break-up age is 54.1Ma. Oceanic crust is located west of
x ¼ 50 km. A lithosphere b factor of infinity produces 1500m of
palaeobathymetry at break-up at top Tare time (54Ma). Lithosphere b
factors of 1 are required in the east of the section in order to avoid
elevating the eastern part of the section above level. Transient mantle
plume uplift forUpper Paleocene is 300m. Earlier Jurassic-Cretaceous rift
at 142Ma with b ¼ 1.3. Te ¼ 3 km.
N. J. KUSZNIR ET AL.776
crust and unequivocal oceanic crust, has been observed at non-volcanic margins (Pickup et al. 1996; Whitmarsh et al. 2001;
Manatschal & Nievergelt 1997; Manatschal & Bernoulli 1999).Evidence includes direct sampling on the Iberian (and GrandBanks) margin where mantle rocks (peridotite, lherzolite,
harzbergite, dunite) are found immediately beneath post-break-up sediments. Geochemical analysis suggests that the exhumed
mantle at non-volcanic margins has a continental geochemistry(Manatschal & Nievergelt 1997; Manatschal & Bernoulli 1999).
The existence of exhumed mantle at non-volcanic margins is alsoindicated by refraction seismology which indicates the absence of
a Pn Moho refractor (Pickup et al. 1996; Minshull et al. 1998),magnetic anomaly data which shows the ocean crust to be absentor extremely thin, and the stratigraphic evidence for exhumed
mantle (with continental geochemistry) at the sea bed in theTethyan Ocean rifted margin of the European Alps (Manatschal &
Nievergelt 1997; Manatschal & Bernoulli 1999). The observationof mantle exhumation at non-volcanic margins may explain the
historical difficulty of identifying the precise location of thecontinent–ocean boundary at these margins.Neither depth-dependent stretching, which is observed at both
volcanic and non-volcanicmargins, nor mantle exhumation at non-volcanicmargins are explained by existingmodels of riftedmargin
formation. Many rifted margin models (LePichon & Sibuet, 1981)assume a similar process to that which forms intra-continental rift
basins (McKenzie 1978), but with the continental lithospherestretched by an infinite b factor to form a rifted margin. Suchmodels, however, do not predict or explain depth-dependent
stretching or mantle exhumation. New qualitative and quantitativemodels of rifted margin are required.
The Lofoten and Vøring rifted margin lithosphere subsidenceand upper-crustal fault extension study described in this paper
suggests that depth-dependent stretching occurs during sea-floorspreading initiation or early seafloor spreading rather than during
pre-break-up rifting. A new model of rifted margin formation isproposed that assumes that the dominant process for thinning riftedcontinental margin lithosphere is seafloor spreading initiation,
rather than pre-break-up intra-continental rifting. Observations(Davis & Kusznir 2004) suggest that upper-crustal b factors for
pre-break-up lithosphere stretching are relatively small and lessthan 1.5. In the case of the Lofoten and Vøringmargins, pre-break-
up b factors are less than 1.1 for Paleocene and Late Cretaceousstretching.
In the pre-break-up intra-continental rifting phase (Fig. 15a),extensional faulting in the upper crust is balanced by distributedplastic deformation in the lower crust and mantle (McKenzie
1978). Pre-break-up stretching of the upper continental crust byfaulting with small b(,1.5) gives way first to localized dyke
intrusion, and pure shear stretching of the deeper continentallithosphere evolves into a divergent upwelling flow within
continental lithosphere similar in geometry to that found atocean ridges (Fig. 15b). This rapidly leads to thinning ofcontinental lithosphere, the start of seafloor spreading and the
formation of oceanic crust (Fig. 15c).Divergent mantle flow models have been successfully applied to
ocean ridges (Buck, 1991; Spieglemann and McKenzie, 1987;Spieglemann and Reynolds, 1999). The strategy for modelling
rifted continental margins is to model both the effects of pre-break-up lithosphere stretching and of seafloor spreading initiation.Simple fluid-flowmodels of ocean ridge processes, using analytical
iso-viscous corner-flow solutions (Batchelor 1967), show thatthe divergent motion of upwelling mantle beneath ocean ridges
produces depth-dependent stretching. Single-phase fluid-flowmodels are being developed to model the initiation of seafloor
Fig. 11. Restored cross sections for line 3 (southern Lofoten margin) produced by 2D flexural backstripping and reverse post-rift modelling from present day
to top Tare at 54Ma and top Basalt at 54.1Ma. Break-up age ¼ 54.1Ma. b factor varies laterally decreasing eastwards from b ¼ infinity for oceanic
lithosphere to b ¼ 1 in east. Transient mantle plume uplift forUpper Paleocene is 300m. Earlier Jurassic–Cretaceous rift at 142Mawith b ¼ 1.3. Te ¼ 3 km.
The top Tare horizon to the west of x ¼ 130 km does not restore to sea level at 54Ma.
NORWEGIAN MARGIN DEPTH-DEPENDENT STRETCHING 777

Fig. 12. Top basement heat flow and maturation (%VR) are dependent on depth-dependent stretching within continental margin lithosphere. (a) Predicted
top basement heatflow with time and (d) present day %VR with depth compared for depth-dependent stretching with b ¼ 1 in the upper crust and b ¼ 3
in the lower crust and mantle, and predictions using depth uniform lithosphere stretching with b ¼ 1 and 3. Failure to include depth-dependent stretching
may lead to a substantial underestimate of top basement heatflow and %VR. The thermal model is dynamic and includes compacting sediments, continental
crust and lithospheric mantle. Burial history is for a pseudo-well located on line 3 (southern Lofoten margin) at x ¼ 60 km. An earlier depth-uniform rift
event at 142Ma is included in the model. (b,e) Top basement heat flow and %VR predicted as in (a,d) but including average upper continental crust
radiogenic heat productivity in lithosphere thermal model. (c,f) Comparison of effects of 5 km thick sill intruded at 15 km depth and depth-dependent
stretching with b ¼ 1 in the upper crust and b ¼ 3 in the lower crust and mantle on heat flow history and%VR with depth. Depth-dependent stretching flow
may increase top basement heatflow in magnitude and duration more than magmatic intrusions, and may also have a greater effect on %VR.
Fig. 13. (a–c) Schematic summary of the stretching history of the northern Vøring continental margin showing small magnitude depth uniform
pre-break-up continental lithosphere stretching in Late Cretaceous and Paleocene preceding much larger magnitude depth-dependent lithosphere stretching
at break-up. (d) Depth-dependent stretching has an important control on subsidence history and leads to a reduction of initial subsidence (Si) compared with
depth uniform lithosphere stretching (cf. McKenzie 1978) resulting in low syn-break-up bathymetry or even emergence.
N. J. KUSZNIR ET AL.778

spreading, and the stretching and thinning of the young riftedcontinental margin. Our model formulation uses the Batchelor(1967) stream-function corner-flow solution. Continent litho-sphere material is advected to predict lithosphere and crustalthinning. Temperature is predicted by a coupled thermal diffusionand advection solution. The ocean ridge fluid-flow stream-functionsolution is isoviscous, kinematic (Fig. 15d) and requires thedefinition of Vx (the half-spreading rate of the oceanridge) and Vz
(the upwelling velocity beneath the ridge-axis).Mantle convectionmodelling (Nielsen & Hopper 2002) suggests that for volcanicmargins Vz/Vx may be .5 during seafloor spreading initiation,reducing to Vz/Vx approximately 1 after a few Ma, while for non-volcanic margins, lower values of Vz/Vx (of the order of 1) areexpected during seafloor spreading initiation.Application of the new model of seafloor spreading initiation to
rifted margin formation is shown in Figure 16 for both ‘passive’and ‘active’ rifted margin formation, with and without pre-break-up pure-shear lithosphere stretching.Model results are shown after10Ma of seafloor spreading with Vx ¼ 2 cm/year. The ‘passive’model has Vz ¼ 3 cm/year at all times,while the ‘active’ model hasVz ¼ 10 cm/year for time ,2Ma and Vz ¼ 3 cm/year for time.2Ma. Model solutions are also shown which include pre-break-up pure-shear lithosphere stretching with 50 km of pre-break-upextension distributed over a width of 300 km, giving a maximumb value of 1.5. All models shown in Figure 16 show depth-dependent stretching. The models for which Vz is approximatelyequal to Vx, corresponding to ‘passive’ rifting, show an oceanwardflow of the continental mantle leading to mantle exhumation(Fig. 16a and b). In contrast, the models for which Vzq Vx,corresponding to ‘active’ rifting, show transport of the continentalmantle towards the continent (Fig. 16c and d). The effects of the
pre-break-up pure-shear lithosphere stretching can be seen (cf.Fig. 16a and c with Fig. 16b and d). However, the effects of 50 kmof pure shear lithosphere extension are minor compared with thatof seafloor spreading initiation.An application of the model to a volcanic margin is shown in
Figure 17. Model parameters are: elapsed time since sea-floorspreading initiation ¼ 10Ma; Vx ¼ 2 cm/year; Vz ¼ 10 cm/yearfor t , 2Ma; Vz ¼ 3 cm/year for t . 2Ma; and pre-break-upstretching b ¼ 1.5 distributed over a pure shear width of 300 km.Flow streamlines and velocity history (Vx and Vz) are shown inFigures 17a, b and e.The thinning of continental margin lithosphere
Fig. 14. (a) Sensitivity of rifted margin water-loaded subsidence history
to lithosphere depth-dependent stretching predicted by 1D model. Earlier
depth uniform lithosphere stretching at 142 and 81Ma with b ¼ 1.3 and
1.1 respectively. Break-up age ¼ 54Ma. Depth-dependent stretching at
54Ma with b ¼ 1 for upper crust and b ¼ 3 for lower crust and mantle
generates little syn-break-up subsidence compared with depth-uniform
b ¼ 3. (b) Corresponding crustal thickness history.
Fig. 15. (a) Pre-break-up continental rifting with upper-crustal faulting
balanced at depth in the lower crust and lithospheric mantle by pure shear
(plastic) deformation for small b(,1.5). (b) Upper crustal extension by
faulting is replaced by dyke injection, and at depth pure shear extension of
continental lithosphere gives way to divergent upwelling of continental
lithosphere and asthenosphere generating depth-dependent stretching and
thinning, leading to sea-floor spreading initiation. (c) Sea-floor spreading
commences and the divergent upwelling flow ofmantlematerial continues
to generate depth-dependent stretching of continental lithosphere.
(d) Illustration of the seafloor spreading initiation model. The divergent
upwelling mantle-flow of the initiating ocean-ridge is predicted using the
Batchelor (1967) stream-function corner-flow solution. The stream-
function solution is isoviscous and requires the definition of Vx (half
spreading rate of ocean-ridge) and Vz (upwelling velocity beneath ocean-
ridge ridge-axis). Continental lithosphere material is advected to predict
lithosphere and crustal thinning. Temperature is predicted by a coupled
thermal diffusion and advection solution.
NORWEGIAN MARGIN DEPTH-DEPENDENT STRETCHING 779

and lithosphere temperature structure is shown in Figures 17cand d. The model predicts depth-dependent stretching, marginsubsidence and heat flow (Fig. 17f, g and h). The distribution andsense of depth-dependent stretching is qualitatively similar to thatobserved on the Lofoten margin.Driscoll & Karner (1998) noted that the sense of depth-
dependent stretching, in which stretching of the upper crust ismuch less than that of the whole crust and lithospheric mantle, isconsistent with an upper plate location within a lithosphere simpleshear extension model (Wernicke 1985; Lister et al. 1991), andthat all rifted margins, including conjugate margins, appear to beupper plate. Driscoll & Karner (1998) named this the ‘Upper PlateParadox’. The model described above and illustrated in Figures 16and 17 predicts symmetric depth-dependent stretching fromseafloor spreading initiation and gives ’upper plate’ behaviouron both conjugate rifted margins, providing an explanation for the‘Upper Plate Paradox’.The volcanic margin model shown in Figure 17 uses Vzq Vx.
For the volcanic margin, depth-dependent stretching is achievedby ocean ridgemantle flow pushing the continental lower crust andlithospheric mantle towards the continent. For a non-volcanicmargin, Vz is similar in magnitude to Vx (Nielsen & Hopper 2002).A model with Vz approximately equal to Vx, appropriate for non-volcanicmargins, also produces depth-dependent stretching but bygenerating an oceanward flow of the continental lower crust andlithospheric mantle leading to the exhumation of a broad region ofcontinental mantle.
Summary
Tertiary subsidence patterns along the outer part of the Lofoten,Vøring and Møre segments of the Norwegian rifted continentalmargin require depth-dependent stretching of lithosphere atcontinental break-up. The southern Lofoten and northern Vøring
margins show only a small magnitude of lithosphere extension by
faulting (b , 1.1) preceding break-up in the Paleocene and latest
Late Cretaceous. In contrast large lithosphere b factors (.2.5) are
required at 54Ma to restore top Tare and top Basalt to sub-aerial
depositional environments. The absence of significant Paleocene
extensional faulting on the Lofoten and Vøring margins may be
explained by depth-dependent stretching occurring during sea-
floor spreading initiation rather than during pre-break-up intra-
continental rifting.
Depth-dependent stretching has an important effect on tem-
perature and %VR evolution in depth and time. Failure to include
the large b factors for the lower crust and lithosphericmantle leads
to a serious under-prediction of sediment temperature and
hydrocarbon maturation. Depth-dependent stretching may have a
stronger influence on temperature and maturation than magmatic
underplating.
New discoveries of depth-dependent stretching and mantle
exhumation at rifted margins require new models of rifted margin
formation. Observations suggest that the dominant process
responsible for thinning continental margin lithosphere is
seafloor spreading initiation. A new model of seafloor spreading
initiation and riftedmargin formation has been developed. The new
model uses a single-phase fluid-flow model of divergent ocean-
ridgemantle flow to predict continental margin lithosphere thinning
and thermal evolution during seafloor spreading initiation. The new
model may be used to predict depth-dependent stretching, and
margin subsidence and heat flow history.
We thank ConocoPhillips for allowing us to publish the work described in
this paper, Elizabeth Eide and Filoppos Tsikalas for providing the maps
shown in Figure 2, P. van Veen for providing stratigraphic data, and
C. Berndt, M. Davis, M. Cheadle, N. Driscoll, G. Karner, E. Lundin,
T. Minshull and R. Whitmarsh for helpful and stimulating discussions.
Fig. 16. Application of the sea-floor spreading initiation model to ‘passive’ and ‘active’ rifted margin formation without and with pre-break-up
pure-shear lithosphere stretching. Time elapsed is 10Ma. (a) ‘passive’ rifting with Vx ¼ 2 cm/year and Vz ¼ 3 cm/year, (b) ‘passive’ rifting and pre-break-up
b factor ¼ 1.5, (c) ‘active’ rifting with Vx ¼ 2 cm/year, Vz ¼ 10 cm/year for time ,2Ma and Vz ¼ 3 cm/year for time .2Ma, (d) ‘active’ rifting and
pre-break-up b factor ¼ 1.5.
N. J. KUSZNIR ET AL.780

Fig. 17. Application of the ocean ridge initiation model to a volcanic rifted margin. Time elapsed since seafloor spreading initiation is 10Ma. (a,b) ocean-
ridge flow stream lines, (c) predicted thinning of the rifted continental margin lithosphere, (d) predicted lithosphere temperature, (e) Vx and Vz history
(kinematic input parameters), profiles of (f) predicted thinning-factors (1-1/b) for upper crust, whole crust and whole lithosphere showing depth-dependent
stretching, (g) margin subsidence (and uplift), and (h) top basement heat flow.
NORWEGIAN MARGIN DEPTH-DEPENDENT STRETCHING 781

We also thank F. Tsikalas and S. Price for their reviews and constructive
comments. The development and testing of new rifted margin formation
models forms part of the iSIMM (integrated Seismic Imaging and
Modelling of Margins) project. The iSIMM project is supported by
funding from NERC, DTI, Agip, BP, Amerada Hess, Anadarko, Conoco,
Phillips, Shell, Statoil and WesternGeco.
References
Batchelor, G. K. 1967. An Introduction to Fluid Dynamics. Cambridge
University Press.
Baxter, K., Cooper, G. T., Hill, K. C.&O’Brian, G.W. 1999. Late Jurassic
subsidence and passive margin evolution in the Vulcan Sub-basin,
north-west Australia: constraints from basin modelling. Basin
Research, 11, 97–111.
Berggren, W. A., Kent, D. V., Swisher, C. C. III & Aubrry, M. P. 1995.
A revised Cenozoic geochronology and chronostratigraphy. In:
Berggren, W. A., Kent, D. V., Swisher, C. C. III & Hardenol, J. III
(eds) Geochronology, Time Scales and Global Stratigraphic Corre-
lation, Society for Sedimentary Geology (SEPM) Special Publication,
54, 129–212.
Berndt, C., Planke, S., Alvestad, E., Tsikalas, F. & Rasmussen, T. 2001.
Seismic volcanostratigraphy of the Norwegian margin: constarints on
break-up process. Journal of the Geological Society, London, 158,
413–426 .
Blystad, P., Brekke, H., Færseth, R. B., Larsen, B. T., Skogseid, J. &
Tørudbekken, B. 1995. Structural elements of the Norwegian
continental shelf. Part II: the Norwegian Sea Region. Norwegian
Petroleum Directorate Bulletin, 8, 45.
Brekke, H. 2000. The tectonic evolution of the Norwegian Sea conti-
nental margin with emphasis on the Vøring and Møre Basins.
In: Nøttvedt, A. et al. (eds) Dynamics of the Norwegian Margin.
Geological Society, London, Special Publications, 167, 327–378.
Buck, W. R. 1991. Modes of continental lithospheric extension. Journal of
Geophysical Research, 96, 20161–20178.
Cande, S. C. & Kent, D. V. 1992. A new geomagnetic timescale for the
Late Cretaceous and Cenozoic. Journal of Geophysical Research, 97,
13917–13951.
Caston, V. N. D. 1976. Tertiary sediments of the Vøring Plateau,
Norwegian Sea, recovered by Leg 38 of the Deep Sea Drilling
Project. In: Talwani, M. & Udintsev, G. et al. (eds) Initial Reports of
the Deep Sea Drilling Project, Volume 38. U.S. Government Printing
Office, Washington, 1101–1168.
Dalland, A., Worsley, W. & Ofstad, K. 1988. A lithostratigraphic scheme
for the Mesozoic and Cenozoic succession offshoremid- and northern
Norway. Norwegian Petroleum Directorate, Bulletin, 4, 65.
Davis, M. & Kusznir, N. J. 2004. Depth-dependent lithospheric stretching
at rifted continental margins. In: Karner, G. D. (ed.) Proceedings of
NSF Rifted Margins Theoretical Institute. Columbia University Press,
92–136.
Dore, A. G. 1991. The structural foundation and evolution of Mesozoic
seaways between Europe and the Arctic. Palaeogeography, Palaeo-
climatology and Palaeoceanography, 87, 441–446.
Dore, A. G., Lundin, E. R., Jensen, L. N., Birkeland, O., Eliassen, P. E. &
Fichler, C. 1999. Principal tectonic events in the evolution of the
northwest EuropeanAtlanticmargin. In: Fleet, A. J.& Boldy, S.A. R.
(eds) PetroleumGeology of Northwest Europe: Proceedings of the 5th
Conference. Geological Society, London, 41–61.
Driscoll, N. & Karner, G. 1998. Lower crustal extension across the
Northern Carnarvon basin, Australia: Evidence for an eastward
dipping detachment. Journal of Geophysical Research, 103,
4975–4991.
Eide, E. E. 2002. BATLAS – Mid-Norway Plate Reconstruction Atlas with
Global and Atlantic Perspectives. Geological Survey of Norway.
Eldholm, O., Thiede, J., Taylor, E. 1989. Evolution of the Vøring volcanic
margin. In: Eldholm, O., Thiede, J. & Taylor, E. et al. (eds) Procee-
dings of the Ocean Drilling Program, Scientific Results, 104. Ocean
Drilling Program, College Station, TX, 1033–1065.
Eldholm, O., Skogseid, J., Planke, S. & Gladczenko, T. P. 1995. Volcanic
margin concepts. In: Banda, E. (ed.) Rifted Ocean-Continent
Boundaries. Kluwer, Dordrecht, 1–16.
Kusznir, N. J. & Ziegler, P. A. 1992. The mechanics of continental
extension and sedimentary basin formation – a simple-shear pure-
shear flexural cantilever model. Tectonophysics, 215, 117–131.
Kusznir, N. J., Marsden, G. & Egan, S. S. 1991. A flexural-cantilever
simple-shear/pure-shear model of continental lithosphere extension:
applications to the Jeanne D’Arc basin, Grand banks and Viking
Graben North Sea. In: Roberts, A. M., Yielding, G. & Freeman, B.
(eds) Geometry of Normal Faults. Geological Society, London,
Special Publications, 56, 41–60.
Kusznir, N. J., Roberts, A. M. & Morley, C. 1994. Forward and reverse
modelling of rift basin formation. In: Lambiase, J. (ed.) Hydrocarbon
Habitat in Rift Basins. Geological Society, London, Special
Publications, 80, 33–56.
Kusznir, N. J., Hunsdale, R. & Roberts, A. M. 2004. Timing of depth-
dependent lithosphere stretching on the S. Lofoten rifted margin
offshore Mid-Norway: Pre-breakup or post-breakup? Basin Research,
16, 279–296.
Le Pichon, X.& Sibuet, J. C. 1981. Passivemargins: amodel of formation.
Journal of Geophysical Research, 86, 3708–3720.
Lister, G. S., Etheridge, M. A.& Symonds, P.A. 1991.Detachment models
for the formation of passive continental margins. Tectonics, 10,
1038–1064.
Lundin, E. R. & Dore, A. G. 1997. A tectonic model for the Norwegian
passivemargin with implications for the NEAtlantic EarlyCretaceous
to break-up. Journal of the Geological Society, London, 154,
545–550.
Manatschal, G. & Bernoulli, D. 1999. Architecture and tectonic evolution
of nonvolcanic margins: Present day Galicia and ancient Adria.
Tectonics, 18, 1099–1119.
Manatschal, G. & Nievergelt, P. 1997. A continent–ocean transition
recorded in the Err and Platta nappes (Eastern Switzerland). Eclogae
Geologicae Helvetiae, 90, 3–27.
McKenzie, D. P. 1978. Some remarks on the development of sedimentary
basins. Earth and Planetary Science Letters, 40, 25–32.
Minshull, T. A., Dean, S. M., White, R. S. & Whitmarsh, R. B. 1998.
Restricted melting at the onset of seafloor spreading: ocean-continent
transition zones at non-volcanic rifted margins. Transactions of the
American Geophysical Union, 79, 906.
Mjelde, R., Sellevoll, M. A., Shimamura, H., Iwasaki, T. & Kanazawa, T.
1993. Crustal structure beneath Lofoten, N. Norway, from vertical
incidence and wide-angle seismic data. Geophysical Journal Inter-
national, 114, 116–126.
Mjelde, R., Digranes, P., Shimamura, H., Shiobara, H., Kodira, S., Brekke,
H., Egebjerg, T., Sørnes, N. & Thorbjørnsen, S. 1998. Crustal
structure of the northern part of the Vøring Basin, mid-Norway
margin, from wide-angle seismic and gravity data. Tectonophysics,
293, 175–205.
Mosar, J., Torsvik, T. H. & The BAT team, T. H. 2002. Opening the
Norwegian and Greenland Seas: Plate tectonics in Mid Norway since
the Late Permian. In: Eide, E. E. (ed.) BATLAS – Mid Norway plate
reconstruction atlas with global and Atlantic perspectives, Geological
Survey of Norway, 48–59.
Nadin, P. A. & Kusznir, N. J. 1995. Paleocene uplift and Eocene
subsidence in the northern North Atlantic from 2D forward and
reverse stratigraphic modelling. Journal of the Geological Society,
152, 833–848.
Nadin, P., Kusznir, N. J.&Cheadle, M. J. 1997. Early Tertiary plume uplift
in the North Sea and Faeroe-Shetland Basin. Earth and Planetary
Science Letters, 148, 109–127.
Nielsen, T. K.& Hopper, J. R. 2002. Formation of volcanic rifted margins:
Are temperature anomalies required? Geophysical Research Letters,
29, 2022–2025.
Pickup, S. L. B., Whitmarsh, R. B., Fowler, C.M. R. & Reston, T. J. 1996.
Insight into the nature of the ocean-continent transition off West Iberia
from a deep multichannel seismic reflection profile. Geology, 24,
1079–1082.
Planke, S., Symonds, P., Alvestad, E. & Skogseid, J. 2000. Seismic
volcano-stratigraphy of large-volume basalt extrusive complexes on
rifted margins. Journal of Geophysical Research, 105, 19335–19351.
Ren, S., Faleide, J. I., Eldholdm, O., Skogseid, J.&Gradstein, F. 2003. Late
Cretaceous–Paleocene tectonic development of the NW Vøring
Basin. Marine and Petroleum Geology, 20, 177–206.
N. J. KUSZNIR ET AL.782

Roberts, A. M., Lundin, E. R. & Kusznir, N. J. 1997. Subsidence
of the Vøring Basin and the influence of the Atlantic continental
margin. Journal of the Geological Society London, 154,
551–557.
Roberts, A. M., Kusznir, N. J., Yielding, G. & Styles, P. 1998.
Backstripping extensional basins: the need for a sideways glance.
Petroleum Geoscience, 4, 327–338.
Roberts, D. G., Thompson, M., Mitchener, B., Hossack, J., Carmichael,
S. M. M. & Bjornseth, H. M. 1999. Palaeozoic to Tertiary rift and
basin dynamics; mid-Norway to the Bay of Biscay; a new context for
hydrocarbon prospectivity in the deep water frontier. In: Fleet, A. J.&
Boldy, S. A. R. (eds) Petroleum Geology of Northwest Europe:
Proceedings of the 5th Conference. Geological Society, London,
7–40.
Sigmond, E.M. O. 2002.Geological map, Land and Sea Areas of Northern
Europe. Geological Survey of Norway, Scale 1:3 Million.
Skogseid, J., Planke, S., Faleide, J. I., Pedersen, T., Eldholm, O., Neverdal,
F. 2000. NE Atlantic continental rifting and volcanic margin
formation. In: Nottvedt, A. et al. (eds) Dynamics of the Norwegian
Margin. Geological Society, London, Special Publications, 167,
295–326.
Spieglemann, N. & McKenzie, D. 1987. Simple 2-D models for melt
extraction at mid-ocean ridges and island arcs. Earth and Planetary
Science Letters, 83, 137–152.
Spieglemann, M. & Reynolds, J. R. 1999. Combined dynamic and
geochemical evidence for convergent melt flow beneath the East
Pacific Rise. Nature, 402, 282–285.
Sweeney, J. J. & Burnham, A. K. 1990. Evaluation of a simple model of
vitrinite reflectance based on chemical kinetics. AAPG Bulletin, 74,
1559–1570.
Talwani, M. & Eldholm, O. 1972. Continental Margin off Norway; A
Geophysical Study. Geological Society of America Bulletin, 83,
3575–3606.
Talwani, M. & Eldholm, O. 1977. Evolution of the Norwegian-Greenland
Sea. Geological Society of America Bulletin, 88, 969–999.
Tsikalas, F., Faleide, J. I. & Eldholm, O. 2001. Lateral variations in
tectono-magmatic style along the Lofoten-Vesteralen volcanicmargin
off Norway. Marine and Petroleum Geology, 18, 807–832.
Tsikalas, F., Eldholm, O. & Faleide, J. I. 2002. Early Eocene sea floor
spreading and continent-ocean boundary between Jan Mayen and
Senja Fracture zones in the Norwegian-Greenland Sea. Marine
Geophysical Research, 23, 247–270, 807–832.
Walsh, J., Watterson, J. & Yielding, G. 1991. The importance of small-
scale faulting in regional extension. Nature, 351, 391–393.
Wernicke, B. 1985. Uniform-sense simple shear of the continental
lithosphere. Canadian Journal of Earth Sciences, 22, 108–125.
White, R. & McKenzie, D. 1989. Magmatism at rift zones: the generation
of volcanic continental margins and flood basalts. Journal of
Geophysical Research, 94, 7685–7729.
White, R. S. & McKenzie, D. 1995. Mantle plumes and flood basalts.
Journal of Geophysical Research, 100, 17543–17585.
Whitmarsh, R. B., Manatschal, G. & Minshull, T. A. 2001. Evolution of
magma-poor continental margins from rifting to sea-floor spreading.
Nature, 413, 150–153.
NORWEGIAN MARGIN DEPTH-DEPENDENT STRETCHING 783