timing, composition and abundance of juvenile …
TRANSCRIPT
DEPARTMENT OF FISH AND GAME
HABITAT CONSERVATION DIVISION
Native Anadromous Fish and Watershed Branch
Stream Evaluation Program
TIMING, COMPOSITION AND ABUNDANCE OF JUVENILE
ANADROMOUS SALMONID EMIGRATION IN THE
SACRAMENTO RIVER NEAR KNIGHTS LANDING
OCTOBER 1996–SEPTEMBER 1997
by
Bill Snider
and
Robert G. Titus
Stream Evaluation Program
Technical Report No. 00-04
July 2000
DEPARTMENT OF FISH AND GAME
HABITAT CONSERVATION DIVISION
Native Anadromous Fish and Watershed Branch
Stream Evaluation Program
TIMING, COMPOSITION AND ABUNDANCE OF JUVENILE
ANADROMOUS SALMONID EMIGRATION IN THE
SACRAMENTO RIVER NEAR KNIGHTS LANDING
OCTOBER 1996–SEPTEMBER 19971/,2/
by
Bill Snider
and
Robert G. Titus
July 2000
1/ Conducted by the Department of Fish and Game. Funded partially by the California
Department of Water Resources through the Interagency Ecological Program.
2/ Stream Evaluation Program Technical Report No. 00-4
TABLE OF CONTENTS
SUMMARY . . . . . . . . . . . . . . . . . . . . . . . . . . . . . . . . . . . . . . . . . . . . . . . . . . . . . . . . . . . . . . . i
INTRODUCTION . . . . . . . . . . . . . . . . . . . . . . . . . . . . . . . . . . . . . . . . . . . . . . . . . . . . . . . . . . 1
METHODS . . . . . . . . . . . . . . . . . . . . . . . . . . . . . . . . . . . . . . . . . . . . . . . . . . . . . . . . . . . . . . . . 3
RESULTS and DISCUSSION . . . . . . . . . . . . . . . . . . . . . . . . . . . . . . . . . . . . . . . . . . . . . . . . . . 5
General Sampling Conditions . . . . . . . . . . . . . . . . . . . . . . . . . . . . . . . . . . . . . . . . . . . . . 5
Rotary Screw Trap Results . . . . . . . . . . . . . . . . . . . . . . . . . . . . . . . . . . . . . . . . . . . . . . 8
Chinook Salmon Emigration . . . . . . . . . . . . . . . . . . . . . . . . . . . . . . . . . . . . . . . . 8
Late-Fall-Run-Sized Chinook Salmon . . . . . . . . . . . . . . . . . . . . . . . . . . 12
Winter-Run-Sized Chinook Salmon . . . . . . . . . . . . . . . . . . . . . . . . . . . . 12
Spring-Run-Sized Chinook Salmon . . . . . . . . . . . . . . . . . . . . . . . . . . . . 13
Fall-Run-Sized Chinook Salmon . . . . . . . . . . . . . . . . . . . . . . . . . . . . . . 17
Steelhead Trout Emigration . . . . . . . . . . . . . . . . . . . . . . . . . . . . . . . . . . . . . . . 19
Adult Steelhead . . . . . . . . . . . . . . . . . . . . . . . . . . . . . . . . . . . . . . . . . . . 19
Yearling Steelhead . . . . . . . . . . . . . . . . . . . . . . . . . . . . . . . . . . . . . . . . 19
Fyke Net Results . . . . . . . . . . . . . . . . . . . . . . . . . . . . . . . . . . . . . . . . . . . . . . . . . . . . . 21
Chinook Salmon . . . . . . . . . . . . . . . . . . . . . . . . . . . . . . . . . . . . . . . . . . . . . . . . 21
Steelhead . . . . . . . . . . . . . . . . . . . . . . . . . . . . . . . . . . . . . . . . . . . . . . . . . . . . . 21
RST versus Fyke Net . . . . . . . . . . . . . . . . . . . . . . . . . . . . . . . . . . . . . . . . . . . . . . . . . . 21
Gear Efficiency Using Mark-Recapture . . . . . . . . . . . . . . . . . . . . . . . . . . . . . . . . . . . . 25
Relative Abundance Estimates . . . . . . . . . . . . . . . . . . . . . . . . . . . . . . . . . . . . . . . . . . . 25
ACKNOWLEDGMENTS . . . . . . . . . . . . . . . . . . . . . . . . . . . . . . . . . . . . . . . . . . . . . . . . . . . . 30
REFERENCES . . . . . . . . . . . . . . . . . . . . . . . . . . . . . . . . . . . . . . . . . . . . . . . . . . . . . . . . . . . . 30
FIGURES . . . . . . . . . . . . . . . . . . . . . . . . . . . . . . . . . . . . . . . . . . . . . . . . . . . . . . . . . . . . . . . . 31
APPENDIX . . . . . . . . . . . . . . . . . . . . . . . . . . . . . . . . . . . . . . . . . . . . . . . . . . . . . . . . . . . . . . A1
i
SUMMARY
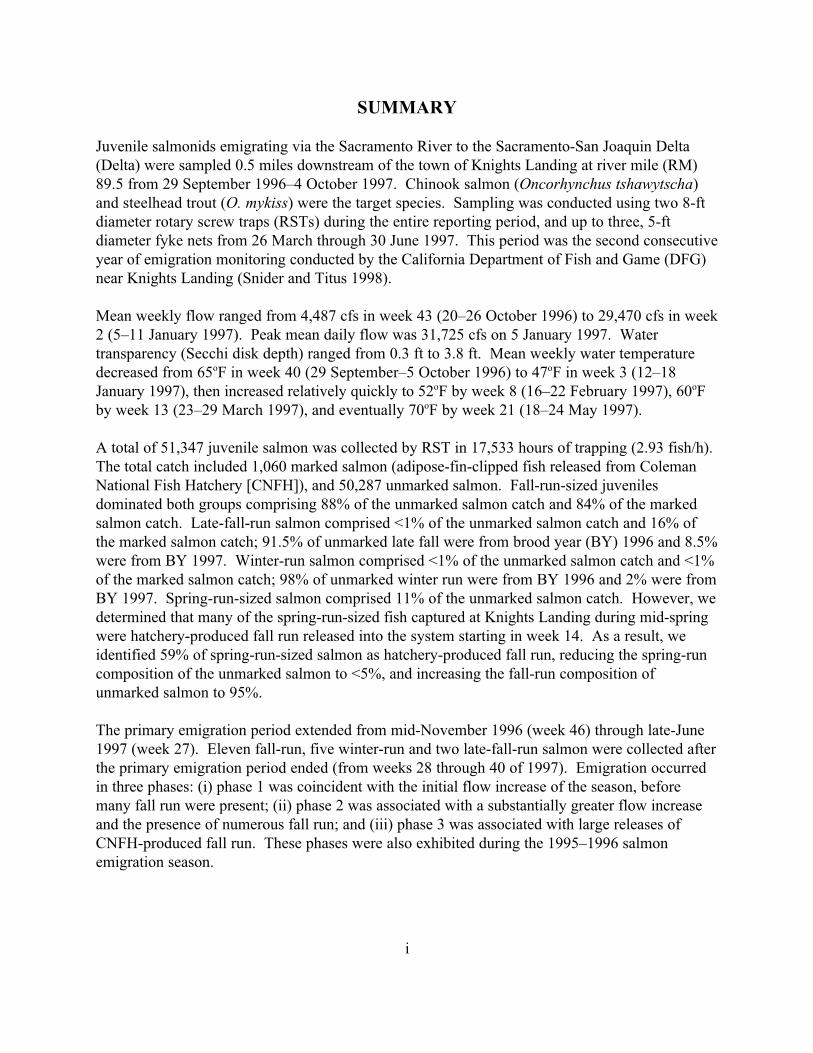
Juvenile salmonids emigrating via the Sacramento River to the Sacramento-San Joaquin Delta
(Delta) were sampled 0.5 miles downstream of the town of Knights Landing at river mile (RM)
89.5 from 29 September 1996–4 October 1997. Chinook salmon (Oncorhynchus tshawytscha)
and steelhead trout (O. mykiss) were the target species. Sampling was conducted using two 8-ft
diameter rotary screw traps (RSTs) during the entire reporting period, and up to three, 5-ft
diameter fyke nets from 26 March through 30 June 1997. This period was the second consecutive
year of emigration monitoring conducted by the California Department of Fish and Game (DFG)
near Knights Landing (Snider and Titus 1998).
Mean weekly flow ranged from 4,487 cfs in week 43 (20–26 October 1996) to 29,470 cfs in week
2 (5–11 January 1997). Peak mean daily flow was 31,725 cfs on 5 January 1997. Water
transparency (Secchi disk depth) ranged from 0.3 ft to 3.8 ft. Mean weekly water temperature
decreased from 65oF in week 40 (29 September–5 October 1996) to 47oF in week 3 (12–18
January 1997), then increased relatively quickly to 52oF by week 8 (16–22 February 1997), 60oF
by week 13 (23–29 March 1997), and eventually 70oF by week 21 (18–24 May 1997).
A total of 51,347 juvenile salmon was collected by RST in 17,533 hours of trapping (2.93 fish/h).
The total catch included 1,060 marked salmon (adipose-fin-clipped fish released from Coleman
National Fish Hatchery [CNFH]), and 50,287 unmarked salmon. Fall-run-sized juveniles
dominated both groups comprising 88% of the unmarked salmon catch and 84% of the marked
salmon catch. Late-fall-run salmon comprised <1% of the unmarked salmon catch and 16% of
the marked salmon catch; 91.5% of unmarked late fall were from brood year (BY) 1996 and 8.5%
were from BY 1997. Winter-run salmon comprised <1% of the unmarked salmon catch and <1%
of the marked salmon catch; 98% of unmarked winter run were from BY 1996 and 2% were from
BY 1997. Spring-run-sized salmon comprised 11% of the unmarked salmon catch. However, we
determined that many of the spring-run-sized fish captured at Knights Landing during mid-spring
were hatchery-produced fall run released into the system starting in week 14. As a result, we
identified 59% of spring-run-sized salmon as hatchery-produced fall run, reducing the spring-run
composition of the unmarked salmon to <5%, and increasing the fall-run composition of
unmarked salmon to 95%.
The primary emigration period extended from mid-November 1996 (week 46) through late-June
1997 (week 27). Eleven fall-run, five winter-run and two late-fall-run salmon were collected after
the primary emigration period ended (from weeks 28 through 40 of 1997). Emigration occurred
in three phases: (i) phase 1 was coincident with the initial flow increase of the season, before
many fall run were present; (ii) phase 2 was associated with a substantially greater flow increase
and the presence of numerous fall run; and (iii) phase 3 was associated with large releases of
CNFH-produced fall run. These phases were also exhibited during the 1995–1996 salmon
emigration season.
ii
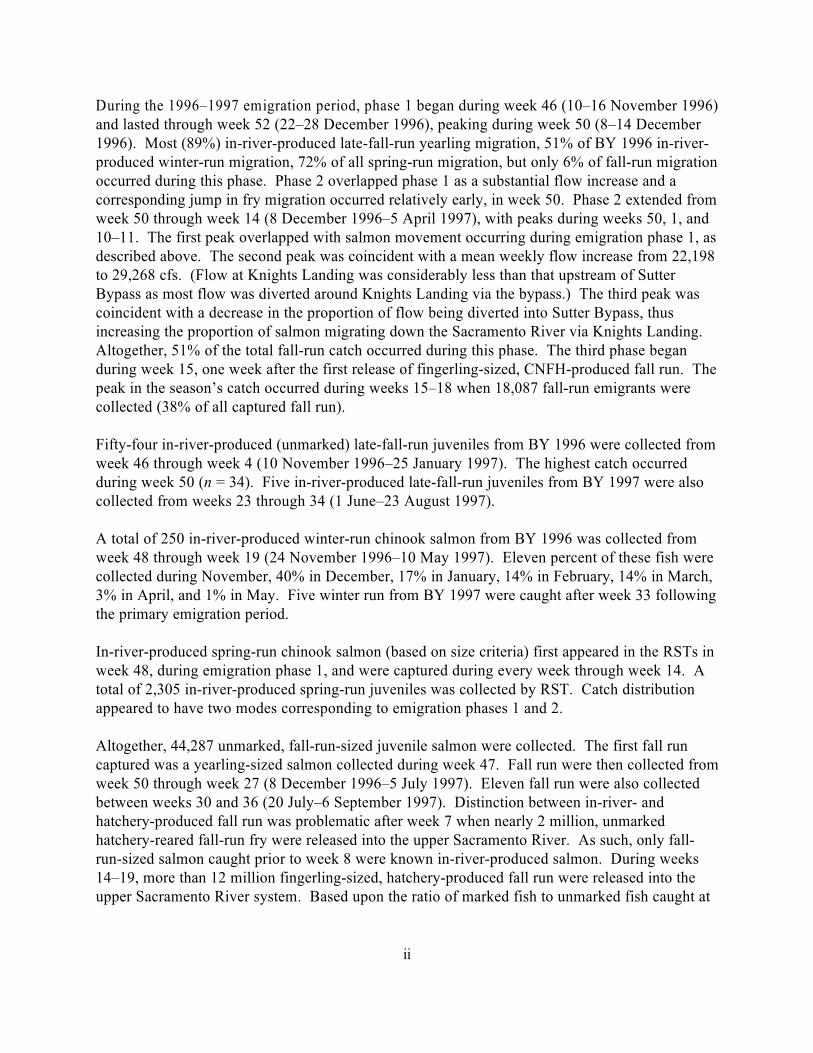
During the 1996–1997 emigration period, phase 1 began during week 46 (10–16 November 1996)
and lasted through week 52 (22–28 December 1996), peaking during week 50 (8–14 December
1996). Most (89%) in-river-produced late-fall-run yearling migration, 51% of BY 1996 in-river-
produced winter-run migration, 72% of all spring-run migration, but only 6% of fall-run migration
occurred during this phase. Phase 2 overlapped phase 1 as a substantial flow increase and a
corresponding jump in fry migration occurred relatively early, in week 50. Phase 2 extended from
week 50 through week 14 (8 December 1996–5 April 1997), with peaks during weeks 50, 1, and
10–11. The first peak overlapped with salmon movement occurring during emigration phase 1, as
described above. The second peak was coincident with a mean weekly flow increase from 22,198
to 29,268 cfs. (Flow at Knights Landing was considerably less than that upstream of Sutter
Bypass as most flow was diverted around Knights Landing via the bypass.) The third peak was
coincident with a decrease in the proportion of flow being diverted into Sutter Bypass, thus
increasing the proportion of salmon migrating down the Sacramento River via Knights Landing.
Altogether, 51% of the total fall-run catch occurred during this phase. The third phase began
during week 15, one week after the first release of fingerling-sized, CNFH-produced fall run. The
peak in the season’s catch occurred during weeks 15–18 when 18,087 fall-run emigrants were
collected (38% of all captured fall run).
Fifty-four in-river-produced (unmarked) late-fall-run juveniles from BY 1996 were collected from
week 46 through week 4 (10 November 1996–25 January 1997). The highest catch occurred
during week 50 (n = 34). Five in-river-produced late-fall-run juveniles from BY 1997 were also
collected from weeks 23 through 34 (1 June–23 August 1997).
A total of 250 in-river-produced winter-run chinook salmon from BY 1996 was collected from
week 48 through week 19 (24 November 1996–10 May 1997). Eleven percent of these fish were
collected during November, 40% in December, 17% in January, 14% in February, 14% in March,
3% in April, and 1% in May. Five winter run from BY 1997 were caught after week 33 following
the primary emigration period.
In-river-produced spring-run chinook salmon (based on size criteria) first appeared in the RSTs in
week 48, during emigration phase 1, and were captured during every week through week 14. A
total of 2,305 in-river-produced spring-run juveniles was collected by RST. Catch distribution
appeared to have two modes corresponding to emigration phases 1 and 2.
Altogether, 44,287 unmarked, fall-run-sized juvenile salmon were collected. The first fall run
captured was a yearling-sized salmon collected during week 47. Fall run were then collected from
week 50 through week 27 (8 December 1996–5 July 1997). Eleven fall run were also collected
between weeks 30 and 36 (20 July–6 September 1997). Distinction between in-river- and
hatchery-produced fall run was problematic after week 7 when nearly 2 million, unmarked
hatchery-reared fall-run fry were released into the upper Sacramento River. As such, only fall-
run-sized salmon caught prior to week 8 were known in-river-produced salmon. During weeks
14–19, more than 12 million fingerling-sized, hatchery-produced fall run were released into the
upper Sacramento River system. Based upon the ratio of marked fish to unmarked fish caught at

iii
Knights Landing after releases began, about 52% of the fall-run caught after week 14 were
hatchery produced.
A total of 156 yearling steelhead trout was caught from weeks 3 through 21 (12 January–24 May
1997). Ten percent were caught in January, 41% in February, 17% in March, 22% in April, and
10% in May. More than 500,000 unmarked, hatchery-produced yearlings were released into the
upper river during weeks three and four making it impossible to distinguish in-river from
hatchery-produced steelhead. Ten adult-sized steelhead were also collected. Five of these fish
were likely 2-year-old smolts.
Estimates of the relative abundance of juvenile salmonids emigrating past Knights Landing are
provided based upon a mean RST efficiency of 1.45% (range: 0.0%–5.40%; SD = 1.19%; 80%
CI: 1.06%–1.83%; n = 17). The estimated number of in-river salmon that passed Knights
Landing included 4,138 BY 1996 late-fall run and 345 BY 1997 late-fall run; 18,690 winter run;
160,276 spring run; and 2,667,679 fall run. The estimated number of hatchery-produced chinook
salmon passing Knights Landing was 12,138 late-fall run, 138 winter run, and 759,355 fall run.
The estimated number of combined in-river- and hatchery-produced yearling steelhead passing
Knights Landing was 11,586.
Fyke net catches were substantially less than the RST catches (~14%) during the concurrent
sampling period. However, trends in catch, and catch composition were similar. Catch by both
gears peaked during the same week. The portion of each catch comprising fall-run salmon and
steelhead were comparable, as was the proportion of marked salmon.
Emigration from the upper Sacramento River system to the Delta is exclusively through Knights
Landing until flow increases require diversion through the Sutter Bypass, upstream of Knights
Landing. Typically, diversion to the bypass occurs when flow exceeds about 23,000 cfs. During
1996–1997, flow exceeded 23,000 cfs from week 50 of 1996 through week 7 of 1997 when
nearly 40% of the catch occurred at Knights Landing. Since the proportion of juvenile salmonids
that emigrates through the bypass is unknown, the magnitude of salmonids emigrating to the
Delta cannot be estimated by just using Knights Landing results. However, the temporal
distribution and, likely, the relative abundance of juvenile salmonids migrating toward the Delta
are reflected in the Knights Landing results.

1 Listed as endangered under both the California and Federal Endangered Species acts.
1
INTRODUCTION
Juvenile anadromous salmonid emigration was monitored on the Sacramento River near Knights
Landing (RM 89.5) for the second consecutive year (Snider and Titus 1998). Monitoring was
conducted to develop information on timing, composition (race and species), and relative
abundance of juvenile chinook salmon Oncorhynchus tshawytscha and steelhead O. mykiss
emigrating from the upper Sacramento River system. This information provides early warning of
emigration into the Sacramento-San Joaquin Delta (Delta) to enable implementation of
management actions deemed necessary to protect juvenile anadromous salmonids as they pass
into and through the Delta. Data acquired over several years will improve understanding of the
attributes of emigration and identify implications of management actions both up- and
downstream of the Delta relative to protection and recovery of the Sacramento River’s
anadromous salmonid populations.
The indigenous, anadromous salmonid populations of California’s Central Valley have been
severely reduced due to a variety of man-caused alterations to their environment. The region’s
chinook salmon and steelhead trout populations have been extirpated from most of their historic
range and the existence of the few remaining depleted populations is constantly challenged.
Beginning in the mid-1800's through the mid-1900's, the construction of dams on most of the
major streams within the Valley progressively eliminated use of more than 90% of these fishes’
historic habitat. Changes in water quality and drastic modifications in stream channel form began
with the unbridled quest for gold in 1849 and continue today with escalating urban expansion and
intensive agriculture and industrial development. Stream channels have been modified to protect
cities and agriculture. Pollutants ranging from elevated water temperatures to urban and
agricultural runoff and associated, sophisticated toxicants, including pesticides and treated
effluent, have further degraded much of the region’s stream habitats. Increasing water diversion
continues to modify the timing and magnitude of flow that sustain most of the remaining habitat.
Emigrating fish are continually lost as they attempt to navigate the many diversions that lie
between their natal streams and the Pacific Ocean. Potentially, the most imposing of these
diversions are the State Water Project’s Harvey Banks Delta Pumping Plant and the Central
Valley Project’s Tracy Pumping Plant both located in the southern Sacramento-San Joaquin
Delta. The work summarized in this report is a portion of an ongoing effort upon the part of
water developers and fishery managers to reduce the deleterious impacts of these facilities on
Central Valley salmon and steelhead, to preserve one of California’s valued natural heritages.
Anadromous salmonids produced in the Sacramento River system upstream of the Feather River
(RM 80) are of special concern. The upper Sacramento River and several of its tributaries
(Figure 1) provide most of the essential spawning and rearing habitat for the Central Valley’s
depleted, anadromous salmonid populations. The winter-run chinook salmon1, unique to
California’s Central Valley, spawns and rears exclusively in the upper Sacramento River. Central

2Listed as threatened under both the California and Federal Endangered Species acts.
3Listed as threatened under the Federal Endangered Species Act.
2
Valley spring-run chinook salmon2 are nearly exclusive to the upper Sacramento system where
remnant populations occur in a few isolated locations including Deer, Mill and Butte creeks
(Figure 1). All late-fall-run chinook salmon, most steelhead trout3 and a major portion of the
natural, or in-river-produced, fall-run chinook salmon spawn and rear in the upper Sacramento
River and its tributaries. The continued existence of these populations could well depend upon
the ability to protect the juveniles as they emigrate from their natal waters, into and through the
Delta on their way to the Pacific Ocean.
Accurate estimates of the abundance and timing of emigrating anadromous salmonids as they
enter the Delta would improve the ability to address critical water management questions. Water
management activities in the Delta can influence survival of anadromous salmonids. Various
restrictions have been placed on project operations to protect juvenile salmonids migrating
through and residing within the Delta. For example, Delta diversions are limited seasonally
predicated on the presence of winter-run chinook salmon. Water management decisions could be
considered for the other anadromous salmonids under increasing concern (i.e., spring-run chinook
salmon and steelhead trout) if better information existed on timing, abundance, and overall
emigration attributes. Improved estimates of the timing and relative abundance of these species as
they enter the Delta should improve confidence in defining impacts and protective measures to
enhance overall protection, and potentially maximize water management flexibility.
An appropriately located and operated monitoring site would provide early warning of emigrating
juvenile salmonids entering the Delta and improve the ability to use water project flexibility and
other actions to protect winter-run chinook salmon and, potentially, other anadromous species of
concern. As such, representatives of agencies involved in fishery and water management issues
within the Central Valley recommended establishing a monitoring station to:
1) Provide early warning to trigger Central Valley Project and State Water Project operation
modifications (e.g., manipulation of Delta Cross Channel gate operation and water export
levels).
2) Provide a monitoring station intermediate between the Glenn-Colusa Irrigation District
(GCID) diversion and the Delta.
3) Provide opportunity to follow movement of juvenile salmonids downstream in response to
various environmental conditions, including flow.
4) Determine the relative proportion of winter-run chinook salmon fry and pre-smolts that
enter and potentially rear in the lower river and Delta through the fall and early-winter
months.
5) Develop abundance estimates for juvenile salmonids entering the lower river and Delta.
4Emigrants can enter the Sutter Bypass, upstream of Knights Landing when flow in the
vicinity of the bypass surpasses 23,000 cfs. The proportion of emigrants entering the bypass is
unknown; their survival to the Delta is also unknown.
3
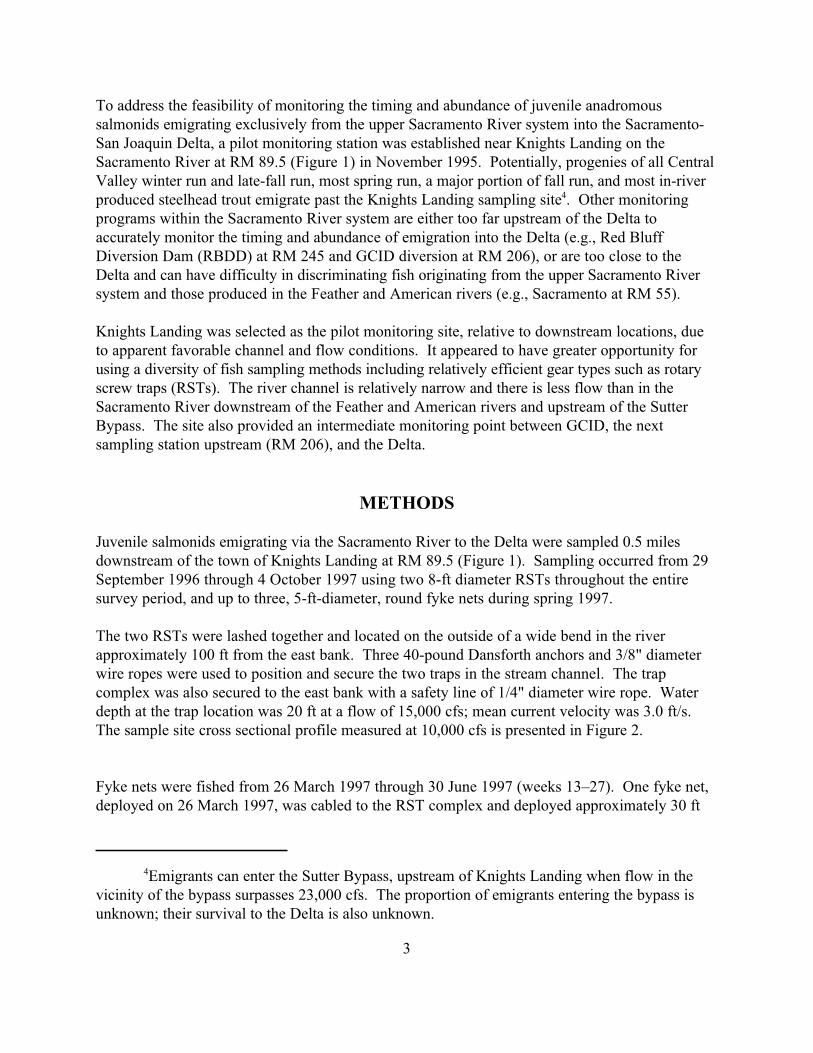
To address the feasibility of monitoring the timing and abundance of juvenile anadromous
salmonids emigrating exclusively from the upper Sacramento River system into the Sacramento-
San Joaquin Delta, a pilot monitoring station was established near Knights Landing on the
Sacramento River at RM 89.5 (Figure 1) in November 1995. Potentially, progenies of all Central
Valley winter run and late-fall run, most spring run, a major portion of fall run, and most in-river
produced steelhead trout emigrate past the Knights Landing sampling site4. Other monitoring
programs within the Sacramento River system are either too far upstream of the Delta to
accurately monitor the timing and abundance of emigration into the Delta (e.g., Red Bluff
Diversion Dam (RBDD) at RM 245 and GCID diversion at RM 206), or are too close to the
Delta and can have difficulty in discriminating fish originating from the upper Sacramento River
system and those produced in the Feather and American rivers (e.g., Sacramento at RM 55).
Knights Landing was selected as the pilot monitoring site, relative to downstream locations, due
to apparent favorable channel and flow conditions. It appeared to have greater opportunity for
using a diversity of fish sampling methods including relatively efficient gear types such as rotary
screw traps (RSTs). The river channel is relatively narrow and there is less flow than in the
Sacramento River downstream of the Feather and American rivers and upstream of the Sutter
Bypass. The site also provided an intermediate monitoring point between GCID, the next
sampling station upstream (RM 206), and the Delta.
METHODS
Juvenile salmonids emigrating via the Sacramento River to the Delta were sampled 0.5 miles
downstream of the town of Knights Landing at RM 89.5 (Figure 1). Sampling occurred from 29
September 1996 through 4 October 1997 using two 8-ft diameter RSTs throughout the entire
survey period, and up to three, 5-ft-diameter, round fyke nets during spring 1997.
The two RSTs were lashed together and located on the outside of a wide bend in the river
approximately 100 ft from the east bank. Three 40-pound Dansforth anchors and 3/8" diameter
wire ropes were used to position and secure the two traps in the stream channel. The trap
complex was also secured to the east bank with a safety line of 1/4" diameter wire rope. Water
depth at the trap location was 20 ft at a flow of 15,000 cfs; mean current velocity was 3.0 ft/s.
The sample site cross sectional profile measured at 10,000 cfs is presented in Figure 2.
Fyke nets were fished from 26 March 1997 through 30 June 1997 (weeks 13–27). One fyke net,
deployed on 26 March 1997, was cabled to the RST complex and deployed approximately 30 ft

5Salmon race was determined using size-at-time criteria developed by Frank Fisher
(California Department of Fish and Game, Northern California - North Coast Region, unpubl.
data).
4
behind the RST complex. A second fyke net was deployed 500 ft downstream of the RST
complex on 1 April 1997 (week 14) and a third was deployed 1,000 ft downstream of the RST
complex on 25 April 1997 (week 17). All three fykes were fished just below the river’s surface.
The two downstream fykes were fished near the bank in about 6 ft of water.
Data acquired from each trap per servicing included total time fished since the last servicing,
current velocity at the trap opening, and, for RSTs, the average number of cone revolutions per
minute, and the cumulative number of cone revolutions since the last servicing. All salmonids
were counted by species, and race for chinook salmon5. All salmon classified as winter run,
spring run and late-fall run were measured (fork length [FL] in mm and weight in g). At each trap
servicing, up to 150 fall-run-sized salmon per trap were selected and measured using a random-
stratified subsampling protocol. All juvenile steelhead trout were counted and measured. The
traps were serviced up to two times per day: once in mid-morning and once near dusk.
The data are reported on a weekly time step to smooth variation in effort and trap efficiency while
retaining sufficient detail to evaluate trends in timing and abundance. Data were typically reduced
to weekly sums or weekly means. Weeks began on Sunday and ended on Saturday and were
identified by number. Week 1 was defined as the first week of 1997 (i.e., contains 1 January
1997). Weeks prior to week 1 were consecutively numbered in descending order from 52; weeks
after week 1 were numbered in ascending order.
Flow at Knights Landing was obtained from records of the U. S. Geological Survey gaging
station at Wilkins Slough. Water transparency was measured each day at the RST using a Secchi
disk following standard methods (Orth 1983). Water temperature was measured during each trap
servicing using a hand-held thermometer.
Trap efficiency was evaluated using a mark-and-recapture technique. All trapped chinook salmon
(except winter-run-sized chinook) were marked using Bismark Brown Y stain (e.g. Deacon 1961)
then released about 0.5 miles upstream of the traps. Efficiency was calculated as the percentage
of marked fish that were recaptured in the traps on a weekly basis. Trap efficiency evaluations
started during week 48 of 1996 (24–30 November 1996) and continued through week 19 of 1997
(4–10 May 1997). Salmon were generally marked and released each day from week 50 of 1996
(8–14 December 1996) through week 19, except during week 14 when less than 100 salmon were
collected. Our objective was to mark and release at least 100 salmon per trial. When <100
salmon were collected in a day, fish were held until >100 fish were available for marking, or up to
3 days maximum, whichever occurred first. Recapture data collected during weeks 1–4 (29
December 1996–25 January 1997) were not reported due to problems identifying recaptured
salmon.

5
Adipose-fin clipped (marked) salmon produced at Coleman National Fish Hatchery (CNFH), near
RM 271.5, and released into the upper Sacramento River system were available for capture at
Knights Landing throughout the survey. All captured marked fish were collected and examined
for coded-wire tags (CWT). All acquired CWTs were read to verify the fish’s source, including
race. Information on race derived from the tag replaced the original size-at-time race designation,
as needed. Race was determined for marked fish without a CWT by considering the fish’s size
and tag data collected from other marked, similarly sized fish captured at the same time.
RESULTS and DISCUSSION
General Sampling Conditions
Mean weekly flow ranged from 4,520 cfs in week 43 (20–26 October 1996) to 29,470 cfs in week
2 (5–11 January 1997) (Table 1). Mean daily flow was as high as 31,725 cfs on 5 January 1997
(Figure 3). Flow was high early, reaching flood levels by the end of December 1996. Flow also
receded early as precipitation declined to drought-like levels from mid-January, immediately
following historic flood conditions, through the end of the survey period. Mean weekly water
temperature decreased from 65oF in week 40 (29 September–5 October 1996) to 47oF in week 3
(12–18 January 1997) (Table 1, Figure 3), then increased relatively quickly to 52oF by week 8
(16–22 February 1997), 61oF by week 13 (23–29 March 1997), and eventually 70oF by week 20
(11–17 May 1997). Mean weekly water temperature after week 20 ranged from 65oF to 70oF
through the end of the survey period.
Water transparency (Secchi disk depth) was very poor throughout the survey (Figure 4), and
ranged from 0.3 ft to 3.8 ft (Table 1). Transparency was inversely related to flow. Mean weekly
transparency (as ln Secchi disk depth) was negatively correlated ® = !0.73) with mean weekly
river flow. Flow was not a particularly good predictor of transparency (r2 = 0.53) although the
linear model relating the two variables was highly significant (p<0.0001) (Appendix Figure 1).
The two RSTs were successfully operated within a fairly wide range of flows (~4,500 to ~30,000
cfs; Figure 5). Interruptions in sampling were typically less than 24 h within a week and were
generally due to debris buildup that disabled the traps. Longer interruptions occurred during
week 52 (22–28 December 1996) and week 1 (29 December–4 January 1997) when the traps
were raised during holidays. Debris-induced interruptions occurred during weeks 48 (24–30
November 1996), 1 (29 December–4 January 1997), 4 (19–25 January 1997), 21 (18–24 May
1997) and 27 (29 June–5 July 1997). The only weeks during which neither trap was fishing for
more than 24 h at a time was during weeks 52 and 1. Overall, the two RSTs fished nearly 99% of
the time averaging 331 h/week (out of a possible 336 h).

6
Week
Beginning
date
Mean flow
(cfs)
Mean water
temperature (oF)
Mean Secchi depth
(ft)
40 29 Sep 1996 7,505 65 3.1
41 6 Oct 1996 6,478 65 3.1
42 13 Oct 1996 4,723 62 2.1
43 20 Oct 1996 4,520 56 2.7
44 27 Oct 1996 5,236 55 3.5
45 3 Nov 1996 5,307 55 3.7
46 10 Nov 1996 5,267 57 3.8
47 17 Nov 1996 7,115 58 2.6
48 24 Nov 1996 8,150 56 1.4
49 1 Dec 1996 8,210 50 2.6
50 8 Dec 1996 22,600 52 0.5
51 15 Dec 1996 24,737 51 1.4
52 22 Dec 1996 22,198 49 1.4
1 29 Dec 1996 29,268 52 0.4
2 5 Jan 1997 29,470 48 0.3
3 12 Jan 1997 28,051 47 0.3
4 19 Jan 1997 27,499 48 0.4
5 26 Jan 1997 28,812 50 0.3
6 2 Feb 1997 26,654 49 0.3
7 9 Feb 1997 23,599 50 0.3
8 16 Feb 1997 15,669 52 0.5
9 23 Feb 1997 12,296 52 0.4
10 2 Mar 1997 10,397 53 0.5
11 9 Mar 1997 8,819 56 0.6
12 16 Mar 1997 11,004 57 0.5
13 23 Mar 1997 9,816 61 0.6
14 30 Mar 1997 8,510 57 0.7
15 6 Apr 1997 7,159 58 0.7
16 13 Apr 1997 6,056 63 1.0
17 20 Apr 1997 7,159 63 1.1
18 27 Apr 1997 5,259 65 1.4
19 4 May 1997 5,179 67 1.4
20 11 May 1997 6,096 70 1.9
21 18 May 1997 5,737 70 1.4
22 25 May 1997 7,467 67 1.4
23 1 Jun 1997 7,156 68 1.6
Table 1. Summary of mean weekly sampling conditions in the Sacramento River near Knights Landing
during the juvenile salmonid emigration investigation, 29 September 1996–4 October 1997.

7
Week Beginning date
Mean flow
(cfs)
Mean water
temperature (oF)
Mean Secchi depth
(ft)
24 8 Jun 1997 8,335 69 1.4
25 15 Jun 1997 9,873 68 1.4
26 22 Jun 1997 9,253 67 2.3
27 29 Jun 1997 9,851 66 2.0
28 6 Jul 1997 9,350 69 1.6
29 13 Jul 1997 9,613 68 1.2
30 20 Jul 1997 9,738 68 1.2
31 27 Jul 1997 9,580 68 1.1
32 3 Aug 1997 9,660 68 1.2
33 10 Aug 1997 8,749 69 1.3
34 17 Aug 1997 6,984 69 1.3
35 24 Aug 1997 6,800 70 0.9
36 31 Aug 1997 7,672 70 1.0
37 7 Sep 1997 8,276 68 1.3
38 14 Sep 1997 7,629 66 1.6
39 21 Sep 1997 6,655 66 2.2
40 28 Sep 1997 5,868 65 2.4
Table 1 (continued)
8
Rotary Screw Trap Results
Chinook Salmon Emigration
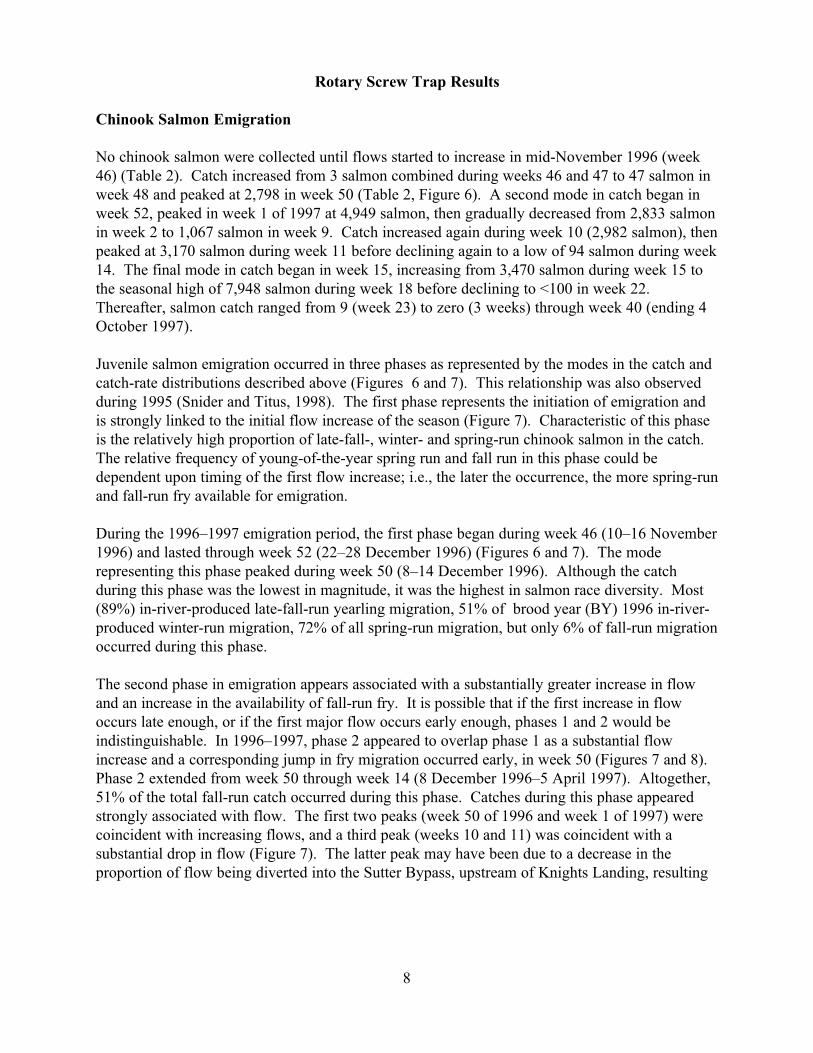
No chinook salmon were collected until flows started to increase in mid-November 1996 (week
46) (Table 2). Catch increased from 3 salmon combined during weeks 46 and 47 to 47 salmon in
week 48 and peaked at 2,798 in week 50 (Table 2, Figure 6). A second mode in catch began in
week 52, peaked in week 1 of 1997 at 4,949 salmon, then gradually decreased from 2,833 salmon
in week 2 to 1,067 salmon in week 9. Catch increased again during week 10 (2,982 salmon), then
peaked at 3,170 salmon during week 11 before declining again to a low of 94 salmon during week
14. The final mode in catch began in week 15, increasing from 3,470 salmon during week 15 to
the seasonal high of 7,948 salmon during week 18 before declining to <100 in week 22.
Thereafter, salmon catch ranged from 9 (week 23) to zero (3 weeks) through week 40 (ending 4
October 1997).
Juvenile salmon emigration occurred in three phases as represented by the modes in the catch and
catch-rate distributions described above (Figures 6 and 7). This relationship was also observed
during 1995 (Snider and Titus, 1998). The first phase represents the initiation of emigration and
is strongly linked to the initial flow increase of the season (Figure 7). Characteristic of this phase
is the relatively high proportion of late-fall-, winter- and spring-run chinook salmon in the catch.
The relative frequency of young-of-the-year spring run and fall run in this phase could be
dependent upon timing of the first flow increase; i.e., the later the occurrence, the more spring-run
and fall-run fry available for emigration.
During the 1996–1997 emigration period, the first phase began during week 46 (10–16 November
1996) and lasted through week 52 (22–28 December 1996) (Figures 6 and 7). The mode
representing this phase peaked during week 50 (8–14 December 1996). Although the catch
during this phase was the lowest in magnitude, it was the highest in salmon race diversity. Most
(89%) in-river-produced late-fall-run yearling migration, 51% of brood year (BY) 1996 in-river-
produced winter-run migration, 72% of all spring-run migration, but only 6% of fall-run migration
occurred during this phase.
The second phase in emigration appears associated with a substantially greater increase in flow
and an increase in the availability of fall-run fry. It is possible that if the first increase in flow
occurs late enough, or if the first major flow occurs early enough, phases 1 and 2 would be
indistinguishable. In 1996–1997, phase 2 appeared to overlap phase 1 as a substantial flow
increase and a corresponding jump in fry migration occurred early, in week 50 (Figures 7 and 8).
Phase 2 extended from week 50 through week 14 (8 December 1996–5 April 1997). Altogether,
51% of the total fall-run catch occurred during this phase. Catches during this phase appeared
strongly associated with flow. The first two peaks (week 50 of 1996 and week 1 of 1997) were
coincident with increasing flows, and a third peak (weeks 10 and 11) was coincident with a
substantial drop in flow (Figure 7). The latter peak may have been due to a decrease in the
proportion of flow being diverted into the Sutter Bypass, upstream of Knights Landing, resulting
9
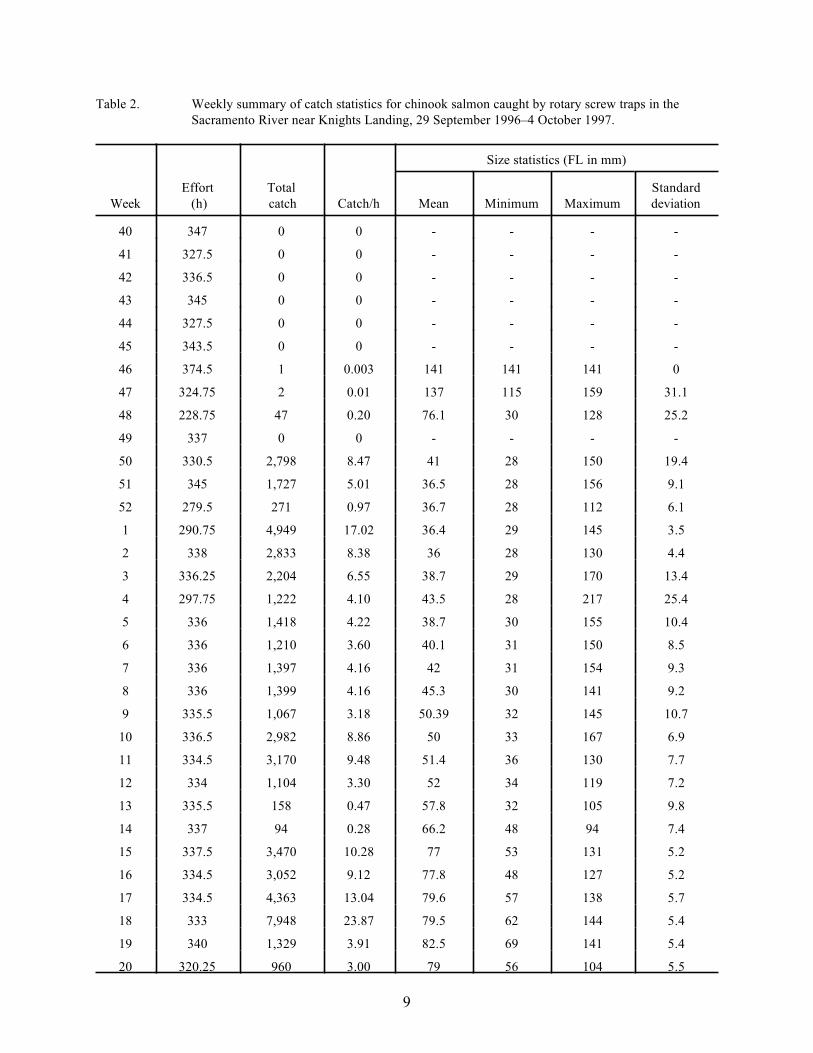
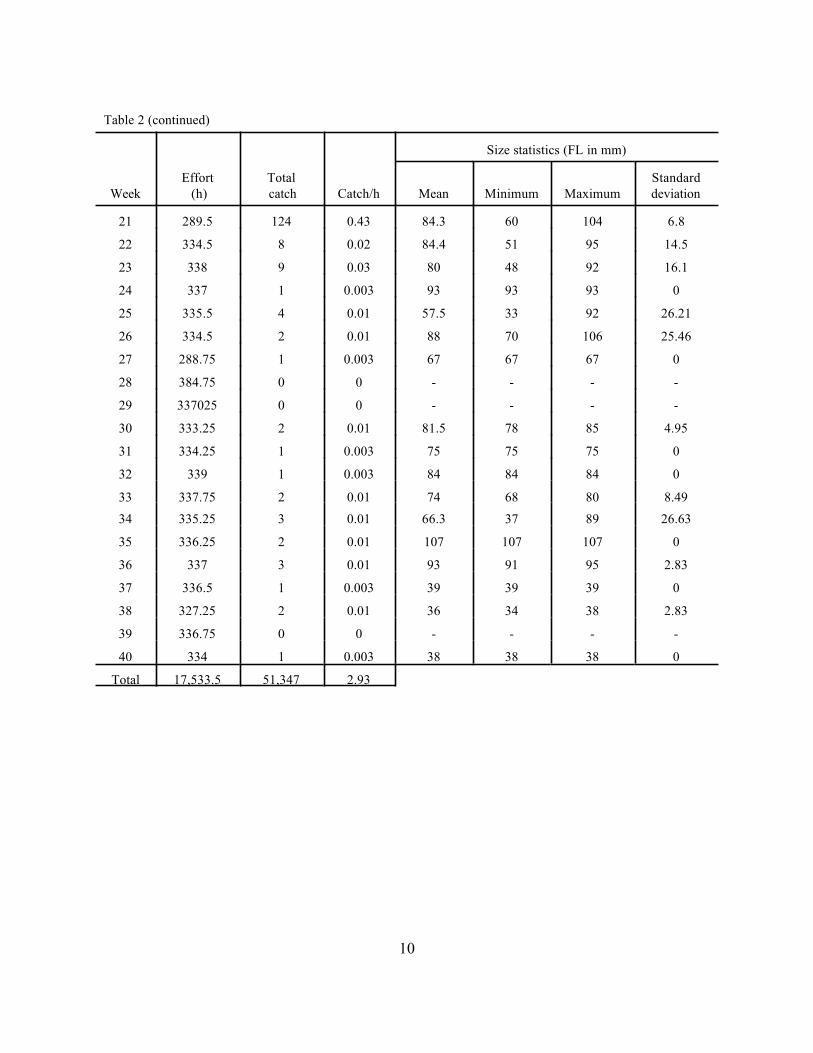
Table 2. Weekly summary of catch statistics for chinook salmon caught by rotary screw traps in the
Sacramento River near Knights Landing, 29 September 1996–4 October 1997.
Week
Effort
(h)
Total
catch Catch/h
Size statistics (FL in mm)
Mean Minimum Maximum
Standard
deviation
40 347 0 0 - - - -
41 327.5 0 0 - - - -
42 336.5 0 0 - - - -
43 345 0 0 - - - -
44 327.5 0 0 - - - -
45 343.5 0 0 - - - -
46 374.5 1 0.003 141 141 141 0
47 324.75 2 0.01 137 115 159 31.1
48 228.75 47 0.20 76.1 30 128 25.2
49 337 0 0 - - - -
50 330.5 2,798 8.47 41 28 150 19.4
51 345 1,727 5.01 36.5 28 156 9.1
52 279.5 271 0.97 36.7 28 112 6.1
1 290.75 4,949 17.02 36.4 29 145 3.5
2 338 2,833 8.38 36 28 130 4.4
3 336.25 2,204 6.55 38.7 29 170 13.4
4 297.75 1,222 4.10 43.5 28 217 25.4
5 336 1,418 4.22 38.7 30 155 10.4
6 336 1,210 3.60 40.1 31 150 8.5
7 336 1,397 4.16 42 31 154 9.3
8 336 1,399 4.16 45.3 30 141 9.2
9 335.5 1,067 3.18 50.39 32 145 10.7
10 336.5 2,982 8.86 50 33 167 6.9
11 334.5 3,170 9.48 51.4 36 130 7.7
12 334 1,104 3.30 52 34 119 7.2
13 335.5 158 0.47 57.8 32 105 9.8
14 337 94 0.28 66.2 48 94 7.4
15 337.5 3,470 10.28 77 53 131 5.2
16 334.5 3,052 9.12 77.8 48 127 5.2
17 334.5 4,363 13.04 79.6 57 138 5.7
18 333 7,948 23.87 79.5 62 144 5.4
19 340 1,329 3.91 82.5 69 141 5.4
20 320.25 960 3.00 79 56 104 5.5
10
Table 2 (continued)
Week
Effort
(h)
Total
catch Catch/h
Size statistics (FL in mm)
Mean Minimum Maximum
Standard
deviation
21 289.5 124 0.43 84.3 60 104 6.8
22 334.5 8 0.02 84.4 51 95 14.5
23 338 9 0.03 80 48 92 16.1
24 337 1 0.003 93 93 93 0
25 335.5 4 0.01 57.5 33 92 26.21
26 334.5 2 0.01 88 70 106 25.46
27 288.75 1 0.003 67 67 67 0
28 384.75 0 0 - - - -
29 337025 0 0 - - - -
30 333.25 2 0.01 81.5 78 85 4.95
31 334.25 1 0.003 75 75 75 0
32 339 1 0.003 84 84 84 0
33 337.75 2 0.01 74 68 80 8.49
34 335.25 3 0.01 66.3 37 89 26.63
35 336.25 2 0.01 107 107 107 0
36 337 3 0.01 93 91 95 2.83
37 336.5 1 0.003 39 39 39 0
38 327.25 2 0.01 36 34 38 2.83
39 336.75 0 0 - - - -
40 334 1 0.003 38 38 38 0
Total 17,533.5 51,347 2.93

11
in a higher proportion of emigrants moving down the Sacramento River via Knights Landing
rather than into the Sutter Bypass.
The third phase was strongly associated with releases of large numbers of hatchery-produced fall-
run from CNFH into the upper Sacramento River. In 1997, the third phase began during week
15, one week after the first release of fingerling-sized, CNFH-produced fall run was made (Table
3).
Size of salmon captured by RST ranged from 28 to 217 mm FL (Table 2, Figure 8). Large
salmon (>90 mm FL) were captured during every week between week 46 (10–16 November
1996) and week 26 (22–28 June 1997) with several large salmon caught as late as week 36
(31 August–6 September 1997) (Table 2, Figures 8–20). Recently emerged-sized salmon (<45
mm FL) were also captured every week from week 48 of 1996 through week 13, and in weeks
25, 34, 37, 38 and 40 of 1997.
Table 3. Summary of juvenile chinook salmon produced at Coleman National Fish Hatchery
and released into the Sacramento River system upstream of Knights Landing,
including run, number marked with an adipose-fin clip (with and without coded-
wire tags [CWTs]), and release date and location.
Chinook
salmon run
Week of release
(Date)
Number marked
w/CWT
Number marked
w/o CWT
Number
unmarked
Release location
(RM)1/
Late-fall run 45 (7 Nov 1996) 121,056 6,404 0 CNFH (271.5)
Late-fall run 50 (10 Dec 1996) 118,059 4,956 0 CNFH (271.5)
Late-fall run 2 (9 Jan 1997) 121,231 6,317 0 CNFH (271.5)
Late-fall run 3 (16/17 Jan 1997) 501,687 46,878 0 CNFH (271.5)
Winter run 5 (30 Jan 1997) 2,294 71 0 CP (298)
Winter run 11 (12 Mar 1997) 2,259 94 0 CP (298)
Fall run fry 7 (13 Feb 1997) 0 0 1,972,634 HR (235)
Fall run fry 11 (12 Mar 1997) 0 0 6,013,529 BRBR (240)
Fall run 14 (1 Apr 1997) 288,499 36,478 3,618,122 CNFH (271.5)
Fall run 15 (9 Apr 1997) 97,230 4,093 1,948,233 CNFH (271.5)
Fall run 16 (15/16 Apr 1997) 444,034 22,868 4,800,757 CNFH (271.5)
Fall run 19 (6 May 1997) 104,099 4,714 1,072,848 CNFH (271.5)
Steelhead 3,4 (7–15 Jan) 0 0 540,287 Balls Ferry
(276)
1/ CNFH = Coleman National Fish Hatchery; CP = Caldwell Park; HR = Hunters Resort; BRBR = Bow River Boat
Ramp.
12
Late-Fall-Run-Sized Chinook Salmon
All late-fall run released from CNFH were marked. As such, we considered all unmarked late-
fall-run-sized chinook salmon to have been produced in-river. The first in-river-produced late-
fall-run chinook salmon was caught during week 46 (Table 4, Figure 21). Altogether, 54 in-river-
produced late-fall-run juveniles from BY 1996 were collected from week 46 (10–16 November
1996) through week 4 (19–25 January 1997). The highest catches occurred during week 50 (n =
34). These fish ranged from 90 to 170 mm FL (Table 4). Five in-river-produced late-fall-run
juveniles from BY 1997 were also collected from week 23 (1–7 June 1997) through week 34
(17–23 August 1997) (Figure 21). These fish ranged from 33 to 73 mm FL (Table 4).
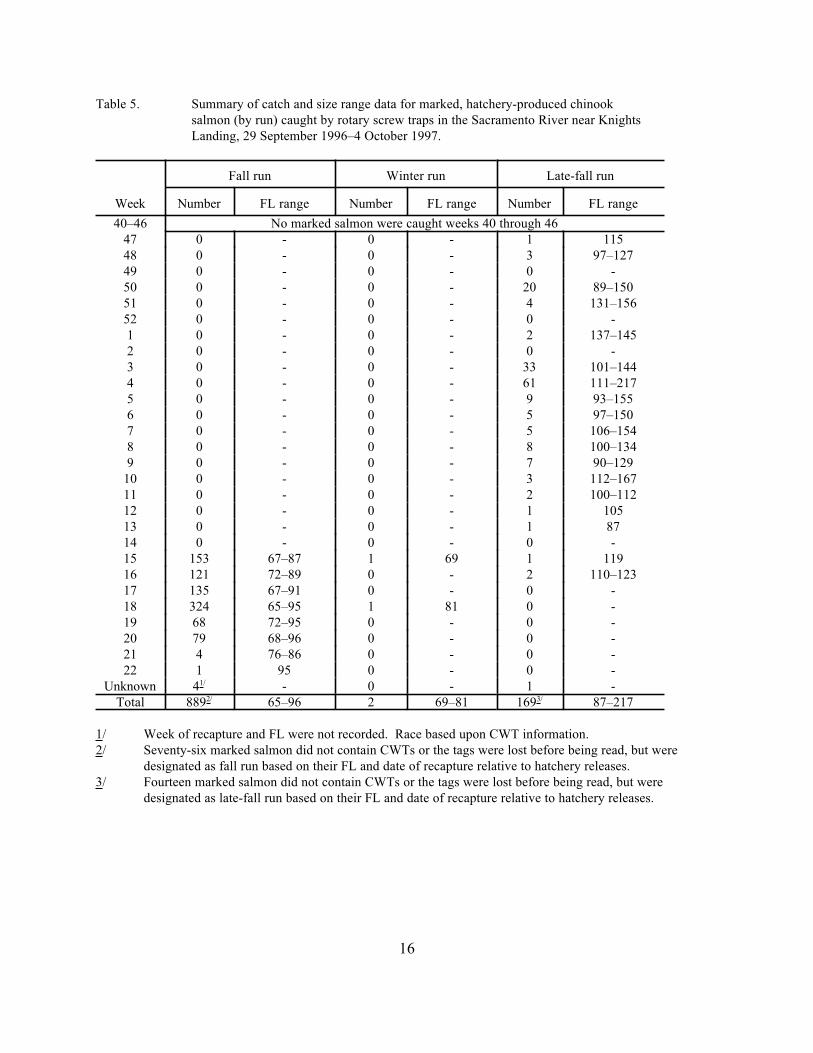
We collected 169 marked late-fall run (Table 5). These fish were collected from week 47 (17–23
November 1996) through week 16 (13–19 April 1997) (Figure 22). Relatively high catches
occurred during weeks 50 (n = 20), 3 (n = 33), and 4 (n = 61). Ninety-five of the 168 marked
fish were late-fall-run sized (BY 1996) of which 90 had CWTs that identified them as late-fall run
from CNFH. (Five marked, late-fall-run-sized salmon without CWTs were also classified as late-
fall run from CNFH). CWT data also revealed that an additional 60 of these marked fish were
classified by size as winter run, but actually were late-fall run from CNFH. One marked spring-
run-sized fish was similarly identified as a late-fall run. We also classified nine marked winter-run-
sized salmon without CWTs as late-fall run based upon the proportion of marked winter-run-sized
salmon bearing CWTs that were actually CNFH late-fall run (60 out of 60). Finally, four marked,
unmeasured fish were identified by CWTs as late-fall run.
A total of 926,588 late-fall run produced at CNFH were marked, tagged with CWTs and released
into Battle Creek, approximately 180 miles upstream of Knights Landing. Of these, an estimated
64,555 were marked but either shed or otherwise did not have a CWT when released. Four
releases consisting of 15 distinct tag groups were made over a period of 11 weeks between 7
November 1996 and 17 January 1997 (Table 3). Each tag group was comparable in size. We
captured 16 (0.013%) fish from the first release (7 November 1996), 15 (0.013%) from the
second (released 10 December 1996), 42 (0.035% total) from those released on 9 January 1997,
and 82 (0.016%) from the last release (16–17 January 1997) (Table 5, Figure 22). Fish from the
first release were collected at Knights Landing from 16 to 36 days after their release (mean = 31
days); fish from the second release were collected from 3 to 74 days later (mean = 16 days); fish
from the third release were collected 3 to 100 days later (mean = 14 days); and fish from the last
group were collected 3 to 89 days later (mean = 15 days).
Winter-Run-Sized Chinook Salmon
As with late-fall, all winter run released from CNFH were marked and all unmarked winter-run-
sized salmon were considered to have been produced in-river. A total of 250 in-river-produced
winter-run chinook salmon from BY 1996 was collected from week 48 through week 19 (24
November 1996–10 May 1997) (Table 4, Figure 21). Eleven percent of the in-river-produced

13
winter-run catch occurred in November, 40% in December, 17% in January, 14% in February,
14% in March, 3% in April, and 1% in May. Winter run from BY 1996 ranged in size from 61 to
104 mm FL.
We observed three peaks in catches of in-river-produced winter run during the first two phases of
emigration discussed above (Table 4, Figure 21). Winter-run catch first peaked in week 50 then
declined to a low in week 1 (phase 1). Catch peaked again in week 3 then gradually declined
before peaking a third time during week 9 (phase 2). The third peak occurred after flow
decreased in the system, reducing diversions to the Sutter Bypass and likely increasing the
proportion of salmon migrating past Knights Landing, as discussed above. Weekly catches were
relatively constant during phase 2, and ranged from 7 to 15 winter run during the first 10 weeks
of this phase before declining to #3 during the last 3 weeks. More than 50% of in-river-produced
winter run were captured during phase 1 coincident with the first major increase in flow. Some
47% were captured during phase 2, in association with increased flow and a large number of fall-
run emigrants. Only 3% were captured during phase 3. Migration of BY 1996 winter run ended
in week 19, immediately following the peak of overall migration during phase 3.
Five winter run from BY 1997 were caught following the primary emigration period, after week
33 (17 August–4 October 1997) (Table 4, Figure 21). These fish ranged from 34 to 39 mm FL.
We captured 69 marked, winter-run-sized salmon. Of these, none were confirmed by CWT to be
winter run released from CNFH. As discussed above, 60 of the 69 were identified by CWT as
late-fall run from CNFH. Nine did not have a CWT. Based upon the proportion of late-fall to
winter run for fish with CWTs, we estimated that none of the fish without tags were winter run.
Two marked, fall-run-sized fish were identified by CWT as winter run (Table 5).
Only 4,553 marked and tagged (165 marked without tags) winter run were released into the upper
Sacramento River during 1996–1997 (Table 3). Two separate releases were made, one on 30
January 1997 (2,294) and one on 12 March 1997 (2,259). We collected 2 (0.04%) tagged winter
run, both from the second release group, one on 11 April (31 days later) and one on 29 April
1997 (49 days later) (Table 5, Figure 22). These fish were 69 and 81 mm FL, respectively.
Spring-Run-Sized Chinook Salmon
No hatchery-produced spring-run chinook salmon were released upstream of Knights Landing.
Several thousand wild, spring-run juveniles caught in Butte Creek were marked and released back
into Butte Creek. Butte Creek enters the upper portion of the Sutter Bypass and, depending upon
flow conditions, the marked fish released into Butte Creek could have entered either the
Sacramento River upstream of Knights Landing or the bypass. All unmarked spring-run-sized
chinook salmon captured through week 14 (5 April 1997) were considered in-river-produced
spring run. Beginning in week 15, all spring-run-sized salmon were considered CNFH-produced
fall-run juveniles based upon the following information:

14
Table 4. Summary of catch and size range data for in-river-produced1/ chinook salmon (by run) caught by
rotary screw traps in the Sacramento River near Knights Landing, 29 September 1996–4 October
1997.
Week
Fall run2/ Spring run3/ Winter run Late-fall run
Number FL range Number FL range Number FL range Number FL range
40 0 - 0 - 0 - 0 -
41 0 - 0 - 0 - 0 -
42 0 - 0 - 0 - 0 -
43 0 - 0 - 0 - 0 -
44 0 - 0 - 0 - 0 -
45 0 - 0 - 0 - 0 -
46 0 - 0 - 0 - 1 141
47 1 159 0 - 0 - 0 -
48 0 - 8 30–38 27 61–87 9 90–128
49 0 - 0 - 0 - 0 -
50 1,564 28–35 1,101 34.5–40 79 60.5–98 34 94–145
51 1,159 28–37 541 34–44 20 63–98 3 101–138
52 250 28–39 18 38–41 2 68–89 1 112
1 4,879 29–40 67 40–52 1 102 0 -
2 2,799 28–42 26 42–55 7 87–110 1 130
3 2,114 29–44 38 44–56 15 60–121 4 122–170
4 1,142 28–46 7 46–50 11 77–124 1 150
5 1,387 30–48 12 49–59 10 82–126 0 -
6 1,192 31–49 6 51–64 7 93–118 0 -
7 1,380 31–53 4 55–62 8 93–135 0 -
8 1,352 30–56 31 55–73 8 83–141 0 -
9 935 32–58 110 58–78 15 78–120 0 -
10 2,827 33–62 139 61–84 13 85–110 0 -
11 3,013 36–64 143 63–86 12 85–130 0 -
12 1,068 34–67 32 68–90 3 92–119 0 -
13 148 32–71 7 72–87 2 105 0 -
14 79 48–73 15 72–94 0 - 0 -
15 1,695 53–88 1,619 76–90 1 131 0 -
16 2,210 48–82 717 61–91 2 115–127 0 -
17 3,600 57–86 625 83–99 3 125–138 0 -

15
Table 4 (continued)
Week
Fall run2/ Spring run3/ Winter run Late-fall run
Number FL range Number FL range Number FL range Number FL range
18 7,2554/ 62–90 366 87–103 2 128–144 0 -
19 1,215 69–93 44 91–99 2 131–141 0 -
20 872 56–95 9 95–104 0 - 0 -
21 119 60—99 1 104 0 - 0 -
22 7 51–95 0 - 0 - 0 -
23 8 57–92 0 - 0 - 1 48
24 1 93 0 - 0 - 0 -
25 2 63–92 0 - 0 - 2 33–42
26 2 70–106 0 - 0 - 0 -
27 1 67 0 - 0 - 0 -
28 0 - 0 - 0 - 0 -
29 0 - 0 - 0 - 0 -
30 2 78–85 0 - 0 - 0 -
31 1 75 0 - 0 - 0 -
32 1 84 0 - 0 - 0 -
33 1 80 0 - 0 - 1 68
34 1 89 0 - 1 37 1 73
35 2 1075/ 0 - 0 - 0 -
36 3 91–95 0 - 0 - 0 -
37 0 - 0 - 1 39 0 -
38 0 - 0 - 2 34–38 0 -
39 0 - 0 - 0 - 0 -
40 0 - 0 - 1 38 0 -
Total 44,287 28–159 2,3053/
3,3816/
30B94
61B104
250 7/
5 8/
60.5B144
34B38
547/
58/
90–170
33–73
1/ Unmarked salmon were considered in-river-produced fish except as noted below.
2/ A large portion of the fall run listed in this table were likely of hatchery origin since in-river- and
hatchery-produced fall run could not be distinguished (see text).
3/ All spring-run-sized fish collected after week 14 were considered fall run based upon CWT data and size
distributions of fall run released from CNFH (see text).
4/ Includes one marked salmon, CWT code 05-01-01-15-11, that was tagged as a wild fish and released at
Red Bluff Diversion Dam.
5/ One fish was unmeasurable.
6/ Total captured after week 14, considered CNFH-produced fall run.
7/ BY 1996
8/ BY 1997
16
Table 5. Summary of catch and size range data for marked, hatchery-produced chinook
salmon (by run) caught by rotary screw traps in the Sacramento River near Knights
Landing, 29 September 1996–4 October 1997.
Week
Fall run Winter run Late-fall run
Number FL range Number FL range Number FL range
40–46 No marked salmon were caught weeks 40 through 46
47 0 - 0 - 1 115
48 0 - 0 - 3 97–127
49 0 - 0 - 0 -
50 0 - 0 - 20 89–150
51 0 - 0 - 4 131–156
52 0 - 0 - 0 -
1 0 - 0 - 2 137–145
2 0 - 0 - 0 -
3 0 - 0 - 33 101–144
4 0 - 0 - 61 111–217
5 0 - 0 - 9 93–155
6 0 - 0 - 5 97–150
7 0 - 0 - 5 106–154
8 0 - 0 - 8 100–134
9 0 - 0 - 7 90–129
10 0 - 0 - 3 112–167
11 0 - 0 - 2 100–112
12 0 - 0 - 1 105
13 0 - 0 - 1 87
14 0 - 0 - 0 -
15 153 67–87 1 69 1 119
16 121 72–89 0 - 2 110–123
17 135 67–91 0 - 0 -
18 324 65–95 1 81 0 -
19 68 72–95 0 - 0 -
20 79 68–96 0 - 0 -
21 4 76–86 0 - 0 -
22 1 95 0 - 0 -
Unknown 41/ - 0 - 1 -
Total 8892/ 65–96 2 69–81 1693/ 87–217
1/ Week of recapture and FL were not recorded. Race based upon CWT information.
2/ Seventy-six marked salmon did not contain CWTs or the tags were lost before being read, but were
designated as fall run based on their FL and date of recapture relative to hatchery releases.
3/ Fourteen marked salmon did not contain CWTs or the tags were lost before being read, but were
designated as late-fall run based on their FL and date of recapture relative to hatchery releases.
17
· A substantial increase in the catch of spring-run-sized salmon began in week 15 (n = 89)
concurrent with the arrival of marked, hatchery-produced fall run released into the upper
river during week 14 (Table 5).
· Many of the fall run measured just prior to their release during week 14 were spring-run
sized.
Unmarked spring-run chinook salmon first appeared in the RSTs in week 48 during emigration
phase 1, and were captured during every week through week 14, except week 49 (Table 4, Figure
21). A total of 2,305 in-river-produced spring run was collected. Catch distribution had two
modes corresponding to emigration phases 1 and 2. The first peak occurred during week 50 (n =
1,101), coincident with the first major flow increase of the season. The second but smaller peak
began in week 9 and continued through week 11 (combined n = 392) when flow in the system
decreased sharply (Figure 4), reducing diversions to the Sutter Bypass and likely increasing the
proportion of salmon migrating past Knights Landing, as discussed earlier.
Unmarked spring run collected before week 15 ranged in size from 30 to 94 mm FL. More than
65% of these salmon were recently emerged-sized salmon and were essentially just a few
millimeters larger than the maximum fall-run size criteria for the date of capture.
A total of 159 marked, spring-run-sized salmon was caught by RST, all after week 14. Nineteen
of these fish did not contain a CWT but were considered fall run based upon time and size at
capture. The remaining 140 were identified as fall run based upon CWT information.
Fall-Run-Sized Chinook Salmon
Fall-run-sized chinook clearly dominated the catch of in-river-produced juvenile salmon in the
RSTs. Altogether, 44,287 fall-run-sized salmon were collected (Table 4). An additional 3,381
marked, spring-run-sized salmon were also actually fall run, as discussed above. The first fall run
captured was a yearling (159 mm FL) caught during week 47. Fall run from BY 1996 were first
collected during week 50, and then in every subsequent week through week 27 (8 December
1996–5 July 1997) (Table 4, Figure 21). Eleven fall run were also collected from week 30
through week 36 (20 July–6 September 1997).
The catch distribution exhibited several peaks consistent with the emigration phases discussed
above (Table 4, Figures 4 and 21). The first weekly peak (n = 1,564) occurred in week 50 during
the initial flow increase event of the season (emigration phase 1). The next peak occurred during
weeks 1–3 (combined n = 9,792) at the top of the seasonal hydrograph (emigration phase 2). A
second peak during emigration phase 2 occurred during weeks 10–11 (combined n = 5,840) in
association with reduced flow diversion to Sutter Bypass and upswing in water temperature
(Tables 1 and 4, Figures 3 and 21). The highest weekly peak catch (n = 7,255) occurred in week
18 during emigration phase 3 and was coincident with the arrival of known (based on CWT data)
hatchery-reared-fall run released from CNFH (Figures 21 and 22).

18
Distinction between in-river- and hatchery-produced fall run was problematic after week 7 when
nearly two million hatchery-reared fall-run fry were released into the upper Sacramento River
(Table 3). A second release of more than six million fry was made during week 11 (Table 3).
These unmarked fish were indistinguishable from in-river-produced fall run. As such, all fall-run-
sized salmon caught at Knights Landing prior to week 8 were known in-river-produced salmon,
but were of unknown origin after week 7.
Beginning in week 14, ~ 8% of the fall run released into the upper river were marked. Four
releases totaling over 12.4 million fall-run chinook salmon from CNFH were made into Battle
Creek, near RM 271.5, during week 14 (1 April 1997), week 15 (9 April 1997), week 16 (15–16
April 1997) and week 19 (6 May 1997). A representative group from each plant was measured
just prior to planting. Comparison of size distribution of fish from each plant with salmon
collected at Knights Landing indicates that a large portion of salmon caught from weeks 15
through 21 were likely from CNFH (Appendix Figures 2–4).
A total of 709 marked, fall-run-sized salmon was caught by RST: 650 contained tags that
identified them as fall run, two contained tags that identified them as winter run, and 57 did not
have tags but were considered fall run. In addition, 140 marked, spring-run-sized salmon
contained tags that identified them as fall run. Nineteen marked, spring-run-sized salmon without
CWTs were also classified as fall run. We also collected 23 marked fish that were not measured,
but had CWTs that identified them as fall run. Altogether, 889 marked fall run were collected.
Based upon CWT information, fall run from the first release into Battle Creek arrived at Knights
Landing during week 15 (Table 5, Figure 22). From week 15 through week 22, when the last
marked salmon was caught, the 889 marked fall run, in addition to 20,354 unmarked fall run
(including 3,381 spring-run-sized salmon that were classified as CNFH-produced fall run), were
collected (Tables 4 and 5, Figures 21 and 22). The marked fish accounted for 4.2% of all fall run
collected during weeks 15–22 compared to ~8% of all hatchery-released fall run. Assuming that
survival of hatchery-produced fall run to Knights Landing was independent of tagging, about 52%
of the fish caught at Knights Landing after week 14 were from CNFH.
Altogether, based on CWT data, we captured 294 (0.10%) fish from the first release, 79 (0.08%)
from the second release, 368 (0.08%) from the third release, and 67 (0.06%) from the last release.
Fish from the first release were collected at Knights Landing 6 to 41 days after release (mean = 15
days); fish from the second release were collected 7 to 31 days after release (mean = 16 days); fish
from the third release were collected 5 to 31 days after release (mean = 14 days); and fish from
the last group were collected 4 to 13 days release (mean = 7 days).
Fall run from BY 1996 ranged in size from 28 to 107 mm FL (Table 4). More than 49% of fall
run were recently emerged-sized fish (<45 mm FL). Recently emerged-sized salmon were
collected from week 50 of 1996 through week 13 of 1997 (Table 4, Figure 8). Smolt-sized fall
run (>70 mm FL) were collected from week 13 essentially through week 36.

19
Steelhead trout captured in the RSTs represented possibly four age groups: young-of-year (<100
mm FL), yearlings (100-300 mm FL), and trout >300 mm FL that were likely a combination of
two-year-old smolts and adults. Scales collected from fish >100 mm FL will be analyzed and
should help further define these groups. Although more than 500,000 hatchery-produced
steelhead were released from CNFH, none of these fish was marked.
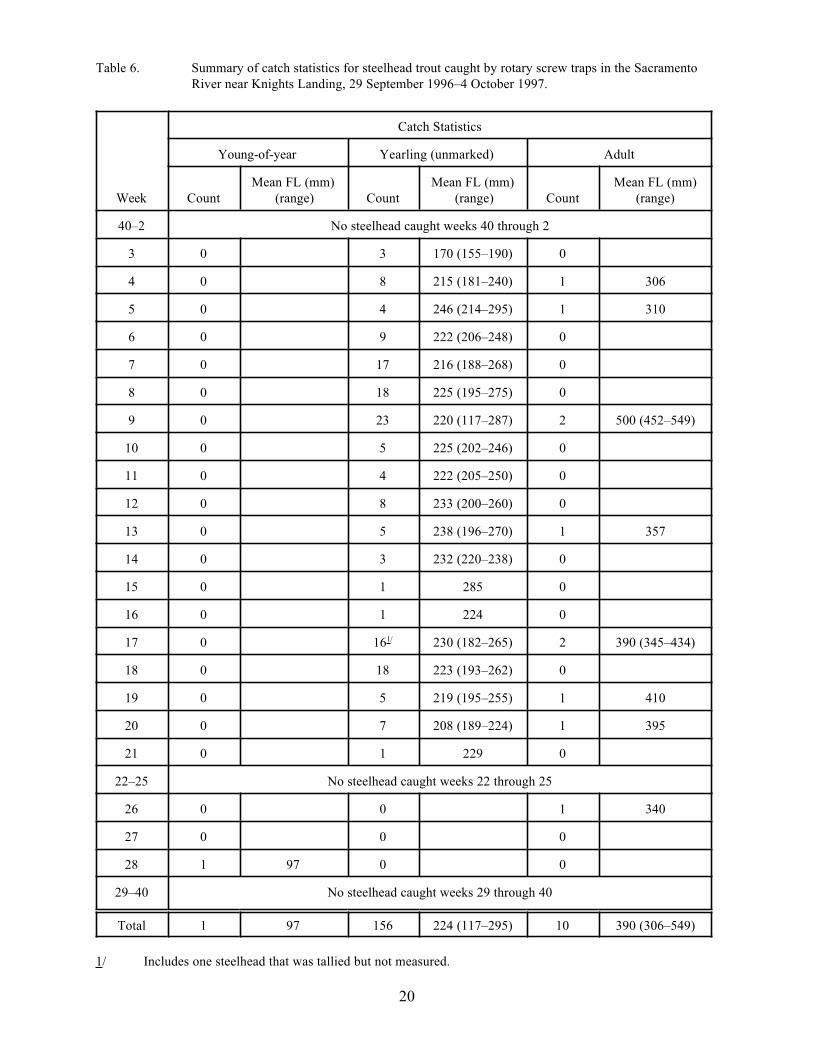
Adult Steelhead
Ten adult-sized steelhead (>300 mm FL) were collected from week 4 through week 26 of 1997
(Table 6). These fish ranged from 306 to 549 mm FL, and averaged 390 mm FL. There was no
apparent pattern in migration although all steelhead were collected concurrent with peaks in
yearling steelhead migration (see below).
Yearling Steelhead
We collected 156 yearling-sized steelhead from week 3 through week 21 of 1997 (12 January–24
May 1997) (Table 6, Figure 23). Ten percent of yearling steelhead were caught in January, 41%
in February, 17% in March, 22% in April, and 10% in May. Yearling steelhead ranged from 117
to 295 mm FL, and averaged 224 mm FL. There was no apparent trend in size versus time of
capture (Figures 24–29).
There appeared to be two modes in catch distribution (Figure 23). The first mode extended from
week 3 through week 15 and started at the peak of the seasonal hydrograph (Figure 4), rather
than with the first flow increase associated with emigration phase 1 for salmon. The first mode
peaked during weeks 7–9, following releases of steelhead smolts from CNFH in weeks 3 and 4
(Table 3), and in association with reduced flow diversion to Sutter Bypass (Sacramento River
flow dropping below 23,000 cfs; Figure 4).
The second mode extended from week 16 through week 21, and peaked during weeks 17 and 18.
This mode was coincident with the first three releases of fall-run salmon from CNFH in weeks
14–16 (Table 3), and the peak occurred in association with the bottom of the spring 1997
hydrograph (Figure 4).
Steelhead Trout Emigration
20
Table 6. Summary of catch statistics for steelhead trout caught by rotary screw traps in the Sacramento
River near Knights Landing, 29 September 1996–4 October 1997.
Week
Catch Statistics
Young-of-year Yearling (unmarked) Adult
Count
Mean FL (mm)
(range) Count
Mean FL (mm)
(range) Count
Mean FL (mm)
(range)
40–2 No steelhead caught weeks 40 through 2
3 0 3 170 (155–190) 0
4 0 8 215 (181–240) 1 306
5 0 4 246 (214–295) 1 310
6 0 9 222 (206–248) 0
7 0 17 216 (188–268) 0
8 0 18 225 (195–275) 0
9 0 23 220 (117–287) 2 500 (452–549)
10 0 5 225 (202–246) 0
11 0 4 222 (205–250) 0
12 0 8 233 (200–260) 0
13 0 5 238 (196–270) 1 357
14 0 3 232 (220–238) 0
15 0 1 285 0
16 0 1 224 0
17 0 161/ 230 (182–265) 2 390 (345–434)
18 0 18 223 (193–262) 0
19 0 5 219 (195–255) 1 410
20 0 7 208 (189–224) 1 395
21 0 1 229 0
22–25 No steelhead caught weeks 22 through 25
26 0 0 1 340
27 0 0 0
28 1 97 0 0
29–40 No steelhead caught weeks 29 through 40
Total 1 97 156 224 (117–295) 10 390 (306–549)
1/ Includes one steelhead that was tallied but not measured.
21
Fyke Net Results
Chinook Salmon
During weeks 13–27, 1,498 salmon were collected in 5,571 h (overall, 0.27 fish/h; Table 7). The
catch generally increased from one salmon in week 14 (0.004 fish/h) to 690 in week 18 (1.37
fish/h), then decreased to zero in week 24 (Table 7). Unmarked, fyke-caught chinook salmon
ranged in size from 49 to 122 mm FL (Table 8).
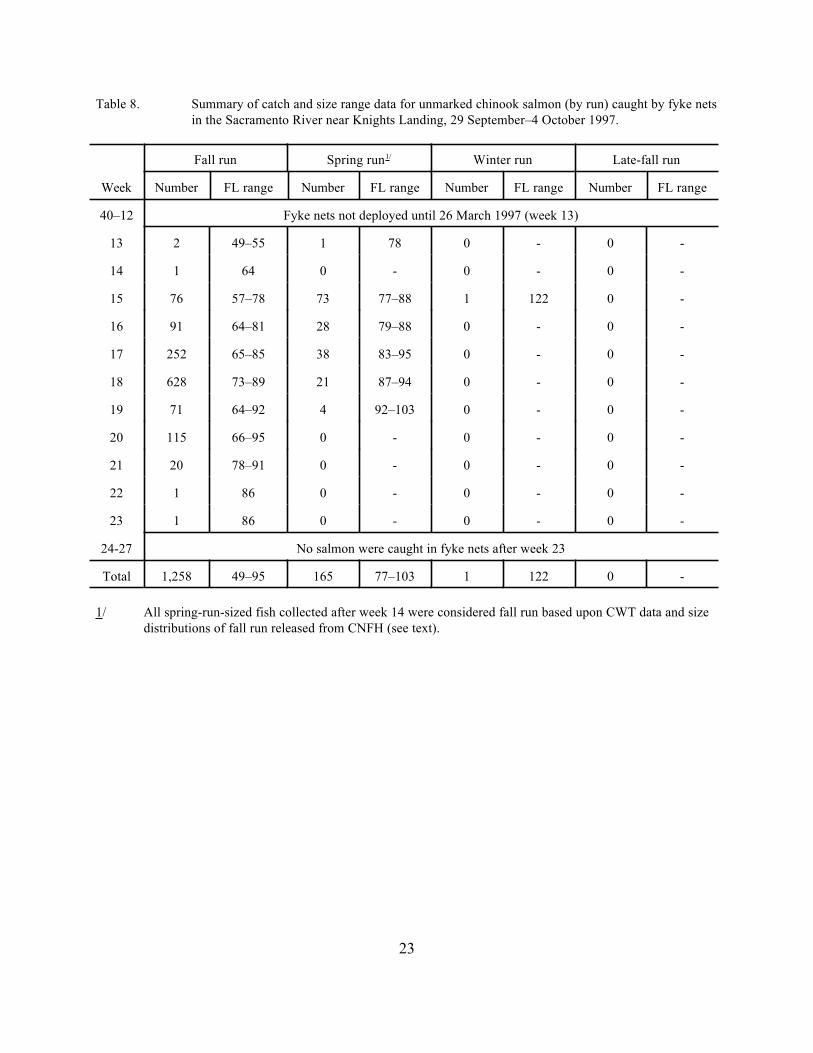
Fall-run juvenile salmon dominated the fyke net catches. A total of 1,258 unmarked fall run was
captured (Table 8, Figure 30), comprising 84% of all fyke-caught salmon. One spring-run-sized
salmon was caught in week 13. All other spring-run-sized salmon (n = 164) were caught after
week 14 and were considered CNFH-produced fall run, as discussed earlier. One winter-run-
sized salmon was also caught by fyke net in week 15.
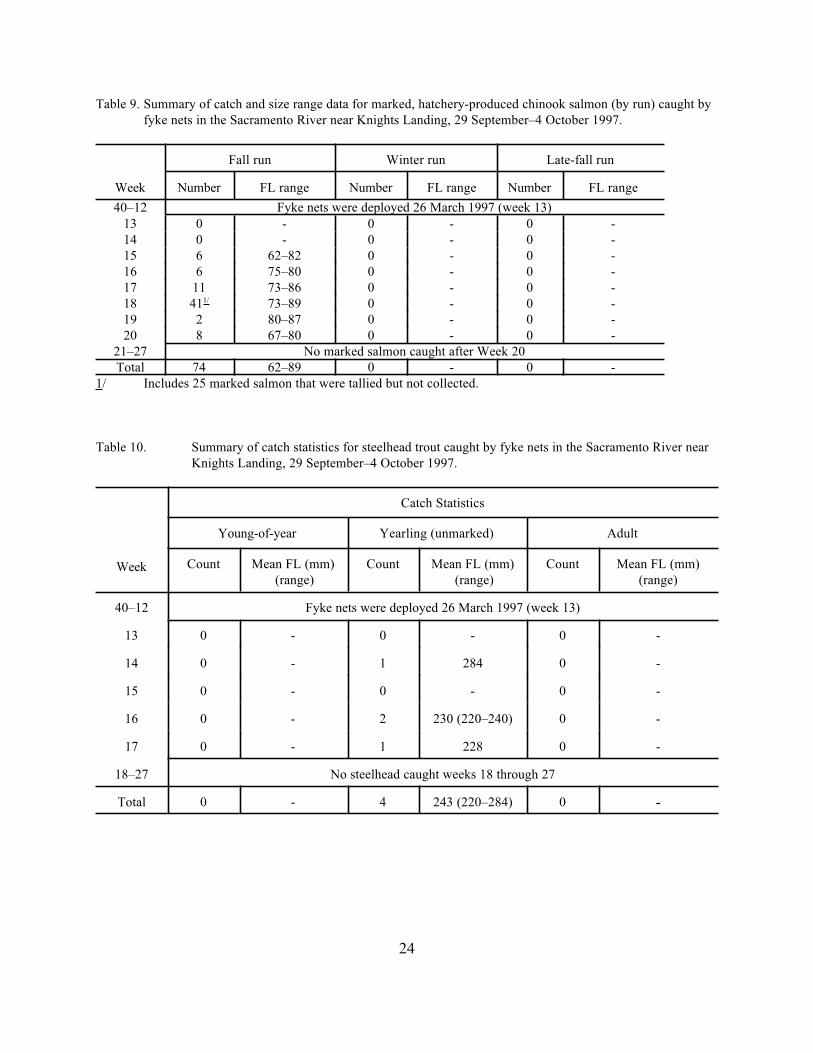
Seventy-four marked chinook salmon were also caught in the fyke nets (Table 9). All of the
marked salmon were CNFH fall run. Marked fall run were captured during weeks 15–20. The
majority (55%) of these fish was captured during week 18 (n = 41). The size of marked fish
ranged from 62–89 mm FL (Table 9).
Steelhead
Four yearling-sized steelhead were collected by fyke net (Table 10). One was caught during week
14, two in week 16, and one in week 17. The size range for fyke-caught steelhead ranged from
220–284 mm FL (Table 10).
RST versus Fyke Net
The RSTs collected substantially more salmonids than the fykes during the period when both
gears were fishing (weeks 13–27), although the trends in catch timing and composition were
similar with both gears. The relative distributions in catches were nearly identical (Figure 31).
Catches with both gears peaked during week 18, and the changes in relative abundance were the
same, except for minor differences between weeks 19 and 20. Similarly, unmarked fall run
dominated both traps, comprising 83% of the RST salmon catch and 84% of the fyke catch.
Spring run comprised 0.1% of the RST catch and 0.07% of the fyke catch; spring-run-sized
CNFH fall run comprised 16% of the RST catch and 12% of the fyke catch; and winter run
comprised 0.06% of the RST catch and 0.07% of the fyke catch. Marked salmon comprised
4.1% of the RST catch and 4.9% of the fyke catch. Steelhead comprised 0.26% of both catches.
The ratios of RST:fyke net caught fish were about 7:1 for all salmon, 9:1 for steelhead, 7:1 for fall
run, 8:1 for winter run, and 5:1 for spring run.

22
Table 7. Summary of catch statistics for chinook salmon caught by fyke nets in the Sacramento River near
Knights Landing, 29 September 1996–4 October 1997.
Week
Effort
(h)
Total
catch Catch/h
Size Statistics (FL in mm)
Mean Minimum Maximum
Standard
deviation
40–12 Fyke nets were deployed 26 March 1997 (week 13)
13 72.50 3 0.04 60.7 49 78 13.3
14 281.75 1 0.004 64.0 64 64 0
15 345.75 156 0.45 76.3 57 122 6.9
16 297.00 125 0.42 77.0 64 88 4.2
17 460.00 301 0.65 79.3 65 95 4.7
18 504.00 690 1.37 78.8 64 94 4.8
19 500.50 77 0.15 82.6 64 103 5.9
20 443.75 123 0.28 77.6 66 95 5.1
21 433.25 20 0.05 84.8 78 91 4.4
22 501.50 1 0.002 86.0 86 86 0
23 505.75 1 0.002 86.0 86 86 0
24 409.25 0 0 - - - -
25 336.75 0 0 - - - -
26 333.75 0 0 - - - -
27 146.00 0 0 - - - -
Total 5,571.50 1,498 0.27
23
Table 8. Summary of catch and size range data for unmarked chinook salmon (by run) caught by fyke nets
in the Sacramento River near Knights Landing, 29 September–4 October 1997.
Week
Fall run Spring run1/ Winter run Late-fall run
Number FL range Number FL range Number FL range Number FL range
40–12 Fyke nets not deployed until 26 March 1997 (week 13)
13 2 49–55 1 78 0 - 0 -
14 1 64 0 - 0 - 0 -
15 76 57–78 73 77–88 1 122 0 -
16 91 64–81 28 79–88 0 - 0 -
17 252 65–85 38 83–95 0 - 0 -
18 628 73–89 21 87–94 0 - 0 -
19 71 64–92 4 92–103 0 - 0 -
20 115 66–95 0 - 0 - 0 -
21 20 78–91 0 - 0 - 0 -
22 1 86 0 - 0 - 0 -
23 1 86 0 - 0 - 0 -
24-27 No salmon were caught in fyke nets after week 23
Total 1,258 49–95 165 77–103 1 122 0 -
1/ All spring-run-sized fish collected after week 14 were considered fall run based upon CWT data and size
distributions of fall run released from CNFH (see text).
24
Table 9. Summary of catch and size range data for marked, hatchery-produced chinook salmon (by run) caught by
fyke nets in the Sacramento River near Knights Landing, 29 September–4 October 1997.
Week
Fall run Winter run Late-fall run
Number FL range Number FL range Number FL range
40–12 Fyke nets were deployed 26 March 1997 (week 13)
13 0 - 0 - 0 -
14 0 - 0 - 0 -
15 6 62–82 0 - 0 -
16 6 75–80 0 - 0 -
17 11 73–86 0 - 0 -
18 411/ 73–89 0 - 0 -
19 2 80–87 0 - 0 -
20 8 67–80 0 - 0 -
21–27 No marked salmon caught after Week 20
Total 74 62–89 0 - 0 -
1/ Includes 25 marked salmon that were tallied but not collected.
Table 10. Summary of catch statistics for steelhead trout caught by fyke nets in the Sacramento River near
Knights Landing, 29 September–4 October 1997.
Week
Catch Statistics
Young-of-year Yearling (unmarked) Adult
Count Mean FL (mm)
(range)
Count Mean FL (mm)
(range)
Count Mean FL (mm)
(range)
40–12 Fyke nets were deployed 26 March 1997 (week 13)
13 0 - 0 - 0 -
14 0 - 1 284 0 -
15 0 - 0 - 0 -
16 0 - 2 230 (220–240) 0 -
17 0 - 1 228 0 -
18–27 No steelhead caught weeks 18 through 27
Total 0 - 4 243 (220–284) 0 -
6 Inconsistency in mark recognition precluded accurate gear efficiency tests during weeks
1–4. Therefore, those weeks were not included in our evaluation.
Gear Efficiency Using Mark-Recapture
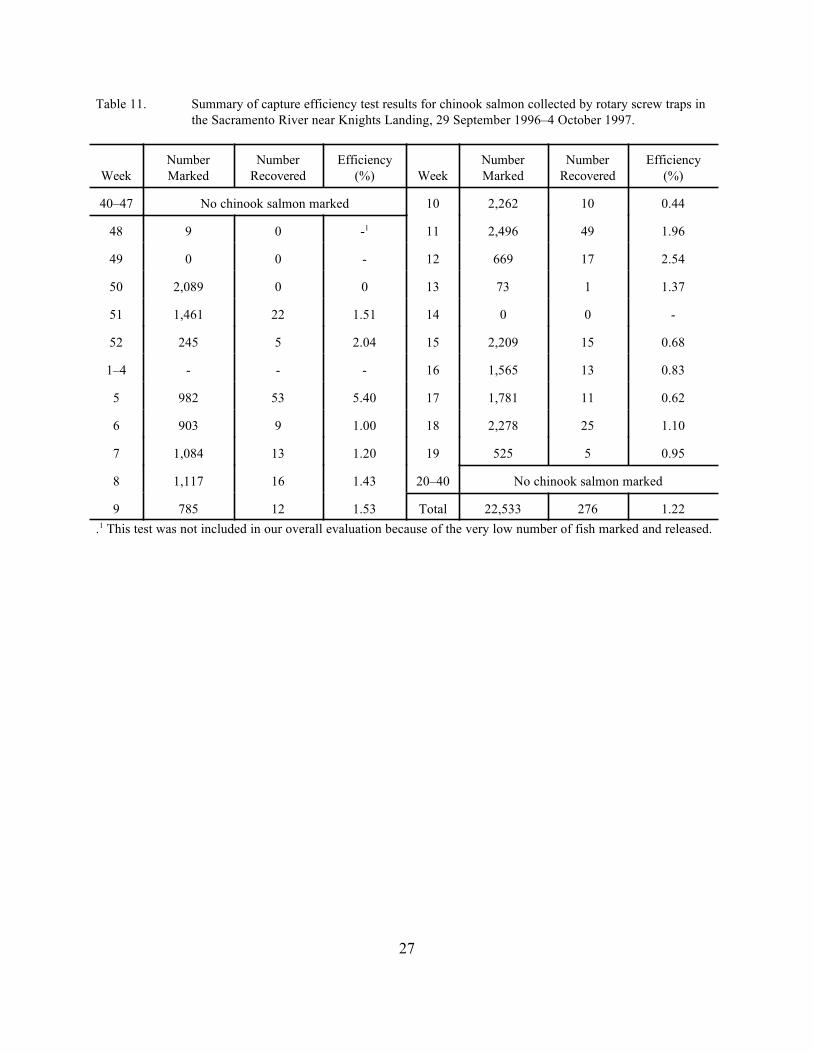
Salmon were marked for efficiency evaluations beginning in week 48 (Table 11), although
sufficient numbers (>100/week) of fish were not available for marking until week 50. A total of
22,533 chinook salmon was marked from week 48 through week 196. Overall, 276 (1.22%)
salmon were recaptured. The percent recaptured, by week, ranged from 0% during week 50 to
5.40% during week 5. The mean trap efficiency during 17 weeks of evaluation was 1.45% (SD =
1.19%).
The size distributions of marked and recaptured salmon were compared for size-selectivity by the
RSTs. Comparison of length-frequency distributions (Figure 32) suggested that the recapture
group was slightly negatively biased. Overall, marked salmon averaged (±SD) 55.7 (±18.0) mm
FL while recaptured salmon averaged 51.2 (±16.9) mm FL (Mann–Whitney W test, p<0.0001).
Thirty-four percent of the marked population, but only 24% of the recaptured population, were
between 70 and 100 mm FL (Figure 32). In a progressive analysis comparing the medians of the
two groups with an upper length limit beginning at 70 mm FL and decreasing in 5 mm increments,
it was not until only salmon <55 mm FL were compared that their medians did not differ
(Mann–Whitney W test, p>0.05).
Yearling-sized steelhead were also marked for efficiency beginning in week 3. A total of 148
steelhead were marked and two were recaptured (1.36%), which was in good agreement with the
mean trap efficiency for salmon (1.45%).
There were no significant correlations between weekly trap efficiency and the number of fish
marked per week ® = !0.34, p = 0.18), number of fish caught per week ® = !0.30, p = 0.24),
mean weekly flow ® = 0.41, p = 0.10), mean weekly water transparency ® = !0.21, p = 0.41), or
mean weekly water temperature ® = !0.29, p = 0.25). Because trap efficiency varied
independently of any measured factor, and to allow for determination of confidence intervals
using standard statistical methods (e.g. Zar 1984), abundance estimates were calculated using the
mean of weekly trap efficiency estimates (see below).
Relative Abundance Estimates
A primary objective of monitoring at Knights Landing is to make an abundance estimate for
juvenile salmonids emigrating from the upper Sacramento River system into the lower river and
Delta. Mean weekly trap efficiency (0.0145) and associated 80% confidence interval
(0.0106–0.0183) were used to estimate the abundance of each salmon run and steelhead. Both
the in-river and hatchery-produced portions of each group were estimated. Estimates of hatchery-
produced juveniles were made only for groups containing marked fish. Thus, no attempt was
2 5
26
made to determine the number of salmon captured at Knights Landing that came from the eight
million unmarked fall-run fry planted in February and March 1997.
In order to estimate the number of fish that passed Knights Landing during the entire emigration
period, including those few weeks when trapping effort was less than 100%, we expanded the
total catch of each species and race to represent 100% effort. The weekly catch was estimated
for those weeks when trapping effort was less than 100% by expanding the catch in proportion to
the percentage of actual effort (e.g., if effort was 80% the estimate was made by dividing the
actual catch by 0.8). The catch of unmarked fish was increased by 1,103 for fall run, 19 for spring
run, 16 for winter run, 5 for late-fall and 12 for steelhead. The marked catch was increased by 3
for fall run and 8 for late-fall run. These numbers were added to the actual counts and used in the
calculation of the total estimates (Tables 12 and 13).
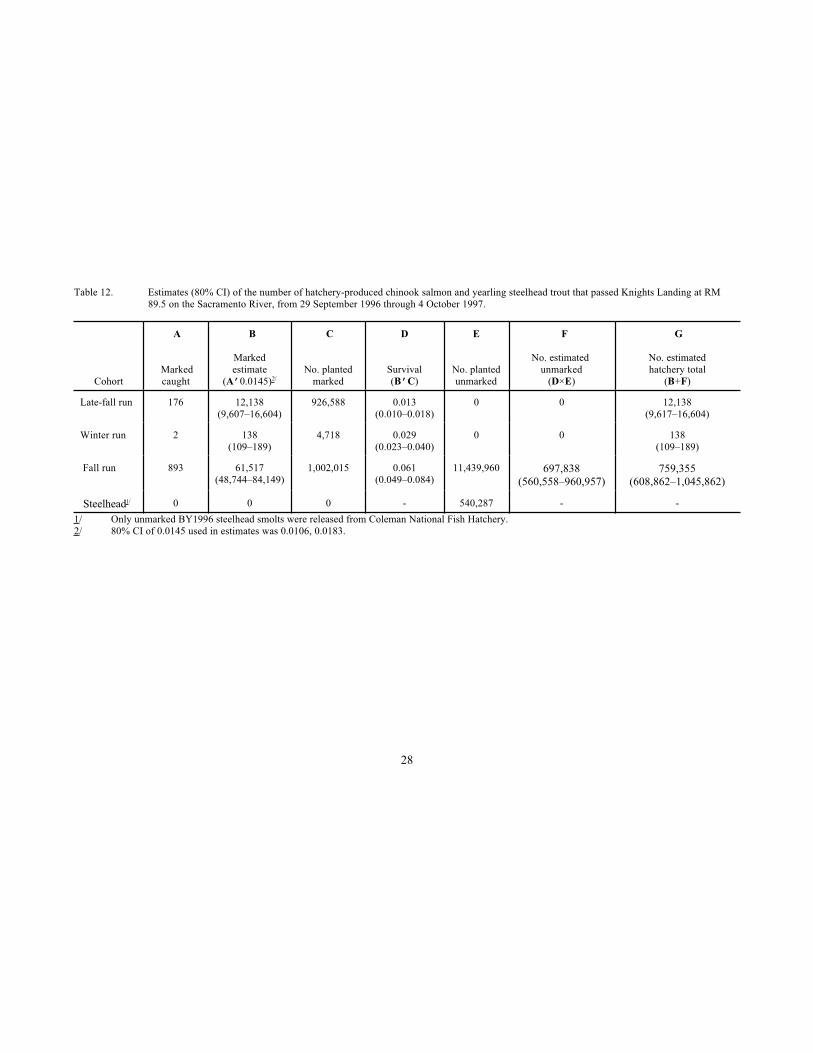
The estimated number of marked and unmarked hatchery-produced fish was determined as shown
in Table 12. Estimated survival to Knights Landing of hatchery salmonids by run/species ranged
from 1.3% to 6.1%.
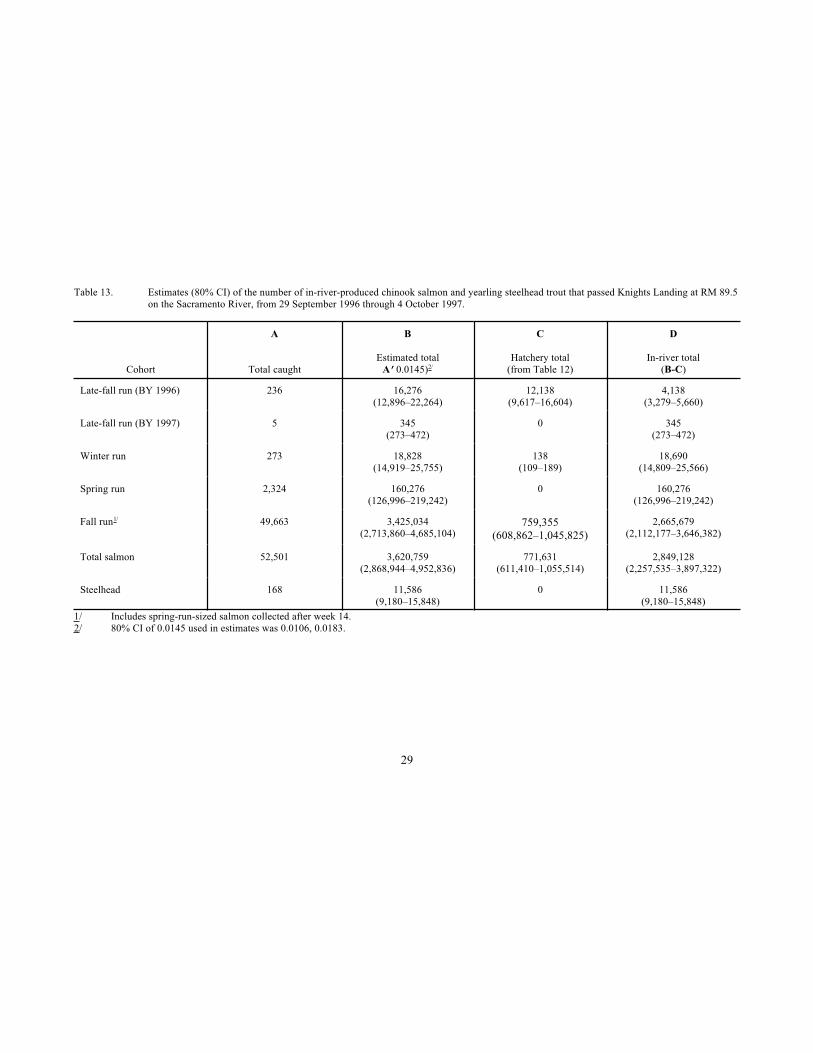
In-river produced fish were estimated by subtracting the estimated hatchery-produced component
passing Knights Landing (results from Table 12), by cohort, from the estimated total abundance
of each cohort moving past the site (Table 13). Overall, an estimated 3.6 million chinook salmon
(80% CI, 2.9 million–4.9 million) emigrated past Knights Landing into the lower Sacramento
River and Delta. About 79% of those were estimated to have been produced in-river. An
estimated 11,586 yearling steelhead (80% CI, ~9,200–15,800) emigrated past Knights Landing.
Because BY 1996 steelhead from CNFH were not marked, we could not estimate relative
proportions of hatchery- and in-river-produced steelhead moving past Knights Landing.
Emigration from the upper Sacramento River system to the Delta is exclusively through Knights
Landing until flow increases require diversion through the Sutter Bypass, upstream of Knights
Landing. Typically, diversion to the bypass occurs when flow exceeds about 23,000 cfs
(California Department of Water Resources, Division of Flood Management, pers. comm., 14 July
1998). During 1996–1997, flow exceeded 23,000 cfs from week 50 of 1996 through week 7 of
1997 when nearly 40% of the catch occurred at Knights Landing. Since the proportion of
juvenile salmonids that emigrates through the bypass is unknown, the magnitude of salmonids
emigrating to the Delta cannot be estimated by just using Knights Landing results. However, the
temporal distribution and, likely, the relative abundance of juvenile salmonids migrating toward
the Delta are reflected in the Knights Landing results.
27
Table 11. Summary of capture efficiency test results for chinook salmon collected by rotary screw traps in
the Sacramento River near Knights Landing, 29 September 1996–4 October 1997.
Week
Number
Marked
Number
Recovered
Efficiency
(%) Week
Number
Marked
Number
Recovered
Efficiency
(%)
40–47 No chinook salmon marked 10 2,262 10 0.44
48 9 0 -1 11 2,496 49 1.96
49 0 0 - 12 669 17 2.54
50 2,089 0 0 13 73 1 1.37
51 1,461 22 1.51 14 0 0 -
52 245 5 2.04 15 2,209 15 0.68
1–4 - - - 16 1,565 13 0.83
5 982 53 5.40 17 1,781 11 0.62
6 903 9 1.00 18 2,278 25 1.10
7 1,084 13 1.20 19 525 5 0.95
8 1,117 16 1.43 20–40 No chinook salmon marked
9 785 12 1.53 Total 22,533 276 1.22
.1 This test was not included in our overall evaluation because of the very low number of fish marked and released.
28
Table 12. Estimates (80% CI) of the number of hatchery-produced chinook salmon and yearling steelhead trout that passed Knights Landing at RM
89.5 on the Sacramento River, from 29 September 1996 through 4 October 1997.
Cohort
A
Marked
caught
B
Marked
estimate
(A’0.0145)2/
C
No. planted
marked
D
Survival
(B’C)
E
No. planted
unmarked
F
No. estimated
unmarked
(D×E)
G
No. estimated
hatchery total
(B+F)
Late-fall run 176 12,138
(9,607–16,604)
926,588 0.013
(0.010–0.018)
0 0 12,138
(9,617–16,604)
Winter run 2 138
(109–189)
4,718 0.029
(0.023–0.040)
0 0 138
(109–189)
Fall run 893 61,517
(48,744–84,149)
1,002,015 0.061
(0.049–0.084)
11,439,960 697,838
(560,558–960,957)
759,355
(608,862–1,045,862)
Steelhead1/ 0 0 0 - 540,287 - -
1/ Only unmarked BY1996 steelhead smolts were released from Coleman National Fish Hatchery.
2/ 80% CI of 0.0145 used in estimates was 0.0106, 0.0183.
29
Table 13. Estimates (80% CI) of the number of in-river-produced chinook salmon and yearling steelhead trout that passed Knights Landing at RM 89.5
on the Sacramento River, from 29 September 1996 through 4 October 1997.
Cohort
A
Total caught
B
Estimated total
A’0.0145)2/
C
Hatchery total
(from Table 12)
D
In-river total
(B-C)
Late-fall run (BY 1996) 236 16,276
(12,896–22,264)
12,138
(9,617–16,604)
4,138
(3,279–5,660)
Late-fall run (BY 1997) 5 345
(273–472)
0 345
(273–472)
Winter run 273 18,828
(14,919–25,755)
138
(109–189)
18,690
(14,809–25,566)
Spring run 2,324 160,276
(126,996–219,242)
0 160,276
(126,996–219,242)
Fall run1/ 49,663 3,425,034
(2,713,860–4,685,104)759,355
(608,862–1,045,825)
2,665,679
(2,112,177–3,646,382)
Total salmon 52,501 3,620,759
(2,868,944–4,952,836)
771,631
(611,410–1,055,514)
2,849,128
(2,257,535–3,897,322)
Steelhead 168 11,586
(9,180–15,848)
0 11,586
(9,180–15,848)
1/ Includes spring-run-sized salmon collected after week 14.
2/ 80% CI of 0.0145 used in estimates was 0.0106, 0.0183.

30
ACKNOWLEDGMENTS
The Knights Landing monitoring project is part of the Interagency Ecological Program (IEP)
Salmonid Project Work Team’s (SPWT) juvenile salmonid monitoring program. It was partially
funded by the California Department of Water Resources (DWR) as part of DWR’s contribution
to the IEP. Many of the agencies and private entities involved in management activities within the
Sacramento-San Joaquin Delta and its tributaries are represented on the SPWT, including
National Marine Fisheries Service, U. S. Fish and Wildlife Service, California Department of
Water Resources, California Department of Fish and Game, State Water Contractors, and
Metropolitan Water District.
We wish to thank the field crews consisting of Al Daniel, Jennifer Ikemoto, Steve Kramer, Scott
Monday, Shawn Oliver, Doug Post, Mike Stiehr, and Mark Van Dam of the California
Department of Fish and Game. A special thanks goes to Katherine Berry and Glenn Sibbald for
their assistance in data management and analysis and preparation of the numerous graphics.
REFERENCES
Deacon, J. E. 1961. A staining method for marking large numbers of small fish. Prog. Fish Cult.
23:41–42.
Orth, D. J. 1983. Aquatic habitat measurements. Pages 61-84 in: L. A. Nielsen and D. L.
Johnson eds. Fisheries Techniques. American Fisheries Society, Bethesda, Md.
Snider, B. and R. G. Titus. 1998. Evaluation of juvenile anadromous salmonid emigration in the
Sacramento River near Knights Landing, November 1995–July 1996. Calif. Dept. Fish Game,
Environmental Services Division, Stream Evaluation Program Report. 67 pp.
Zar, J. H. 1984. Biostatistical analysis, 2nd ed. Prentice Hall, Englewood Cliffs, NJ. 718 pp.

FIGURES
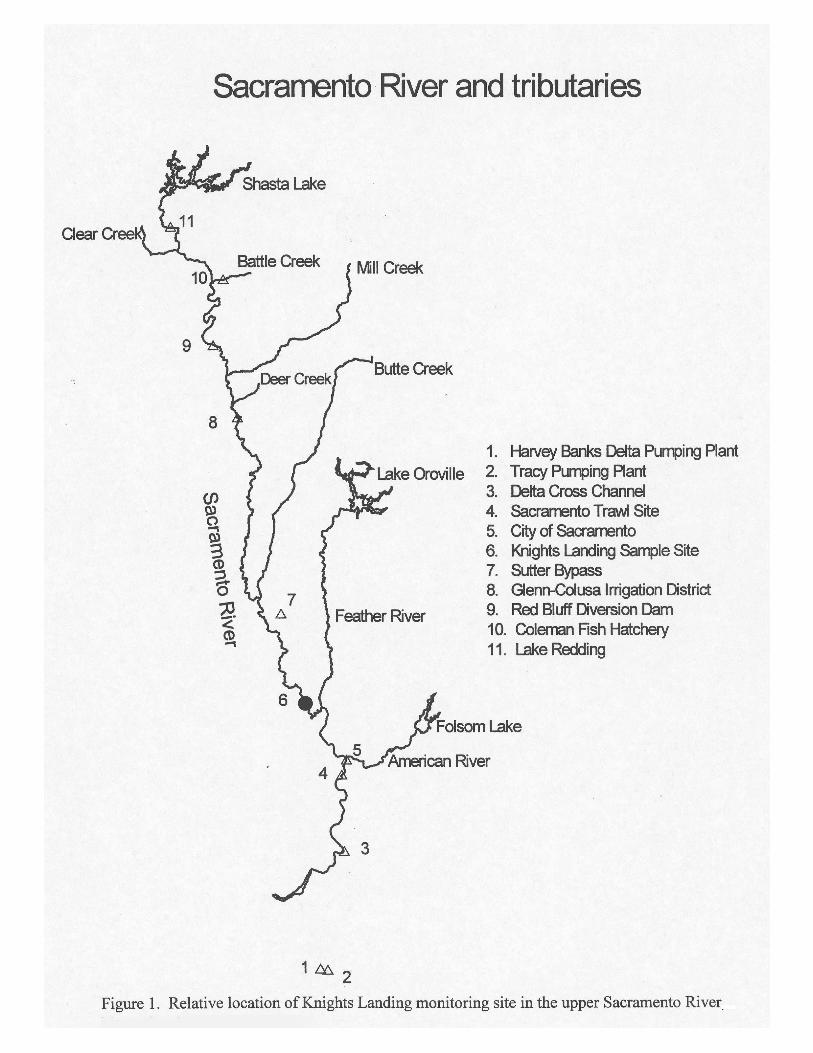


Sacramento River flow and water temperature near Knights Landing
Figure 3. Mean daily flow measured in the Sacramento River near Knights Landing at Wilkins Slough, and meandaily water temperature measured at Knights Landing, 29 September 1996 - 4 October 1997.
29-S
ep
6 O
ct
13
-Oct
20
-Oct
27
-Oct
3 N
ov
10
-No
v1
7-N
ov
24
-No
v1
De
c8
De
c1
5-D
ec
22
-De
c2
9-D
ec
5 J
an
12
-Ja
n1
9-J
an
26
-Ja
n2
Fe
b9
Fe
b1
6-F
eb
23
-Fe
b2
Ma
r9
Ma
r1
6-M
ar
23
-Ma
r 30
-Ma
r6
Ap
r1
3-A
pr
20
-Ap
r2
7-A
pr
4 M
ay1
1-M
ay
18
-Ma
y 25
-Ma
y1
Ju
n8
Ju
n1
5-J
un
22
-Ju
n2
9-J
un
6 J
ul
13
-Ju
l2
0-J
ul
27
-Ju
l3
Au
g1
0-A
ug
17
-Au
g2
4-A
ug
31
-Au
g7
Se
p1
4-S
ep
21
-Se
p2
8-S
ep
0
5
10
15
20
25
30
35
40
Flo
w (
cfs
x 1
00
0)
40
50
60
70
80
Wa
ter T
em
pe
ratu
re (F
)
Flow Temperature
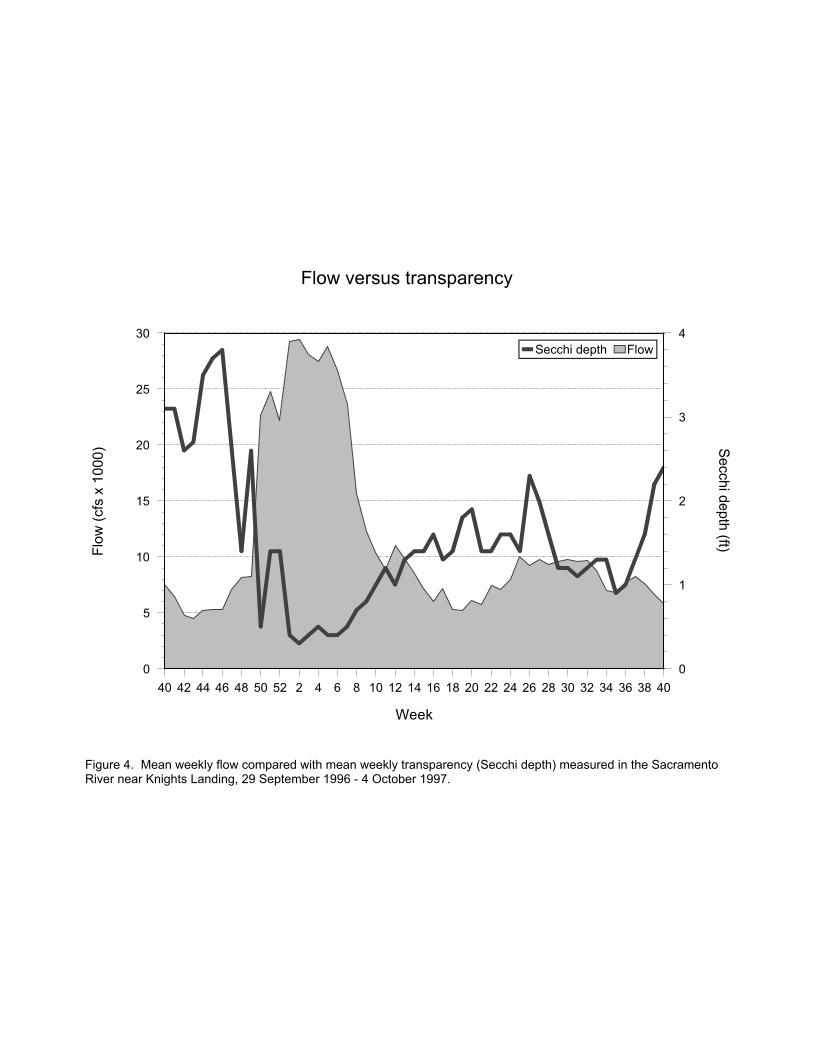
Flow versus transparency
Figure 4. Mean weekly flow compared with mean weekly transparency (Secchi depth) measured in the SacramentoRiver near Knights Landing, 29 September 1996 - 4 October 1997.
40 42 44 46 48 50 52 2 4 6 8 10 12 14 16 18 20 22 24 26 28 30 32 34 36 38 40
Week
0
5
10
15
20
25
30
Flo
w (
cfs
x 1
00
0)
0
1
2
3
4
Secch
i de
pth
(ft)
Secchi depth Flow
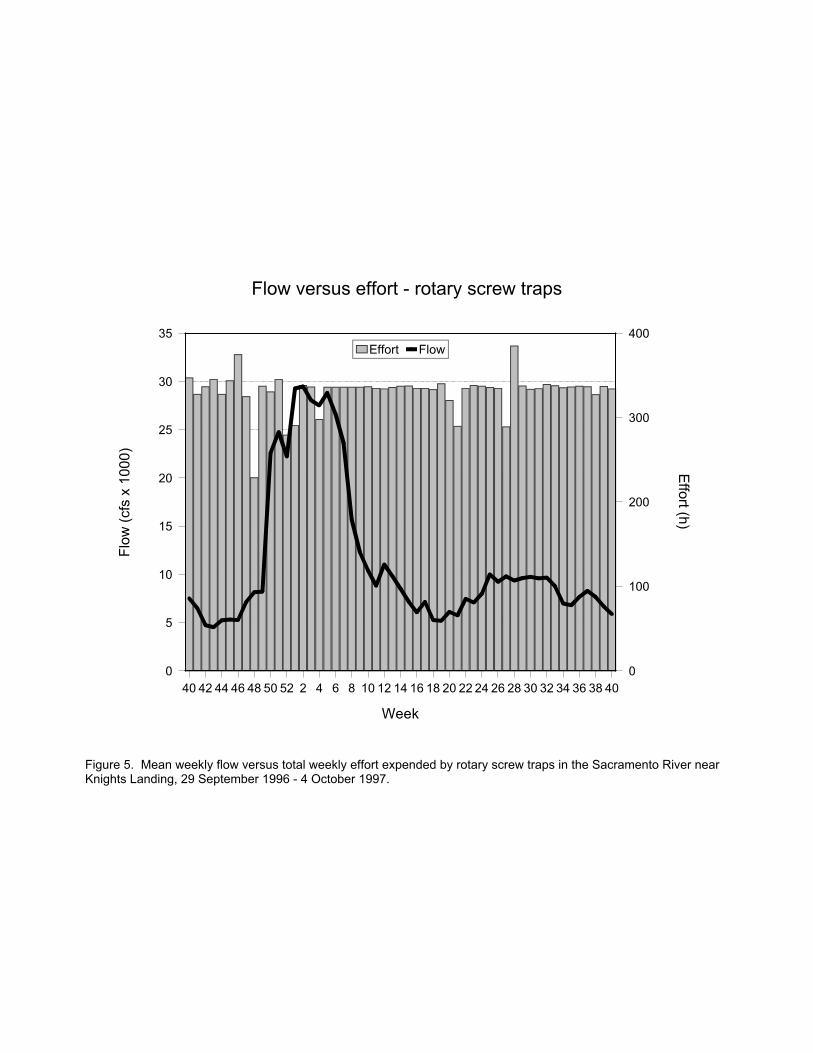
Flow versus effort - rotary screw traps
Figure 5. Mean weekly flow versus total weekly effort expended by rotary screw traps in the Sacramento River nearKnights Landing, 29 September 1996 - 4 October 1997.
40 42 44 46 48 50 52 2 4 6 8 10 12 14 16 18 20 22 24 26 28 30 32 34 36 38 40
Week
0
5
10
15
20
25
30
35
Flo
w (
cfs
x 1
00
0)
0
100
200
300
400
Effo
rt (h)
Effort Flow
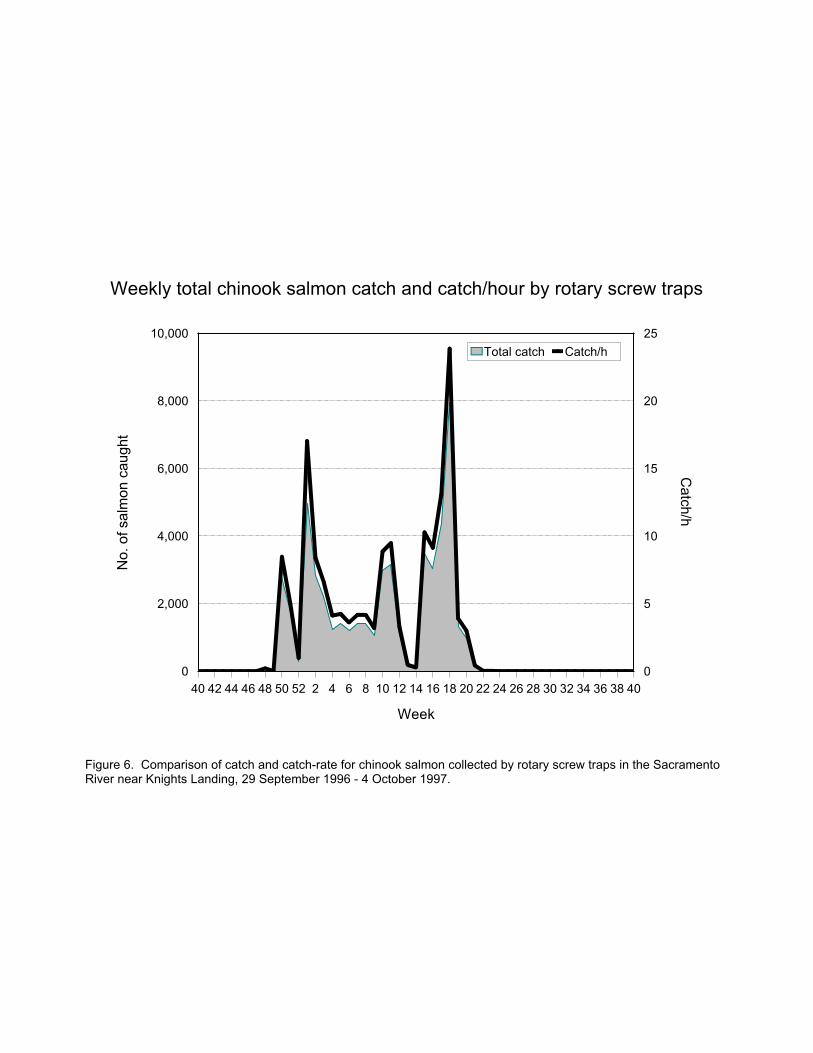
Weekly total chinook salmon catch and catch/hour by rotary screw traps
Figure 6. Comparison of catch and catch-rate for chinook salmon collected by rotary screw traps in the SacramentoRiver near Knights Landing, 29 September 1996 - 4 October 1997.
40 42 44 46 48 50 52 2 4 6 8 10 12 14 16 18 20 22 24 26 28 30 32 34 36 38 40
Week
0
2,000
4,000
6,000
8,000
10,000
No.
of
sa
lmo
n c
au
gh
t
0
5
10
15
20
25
Catc
h/h
Total catch Catch/h
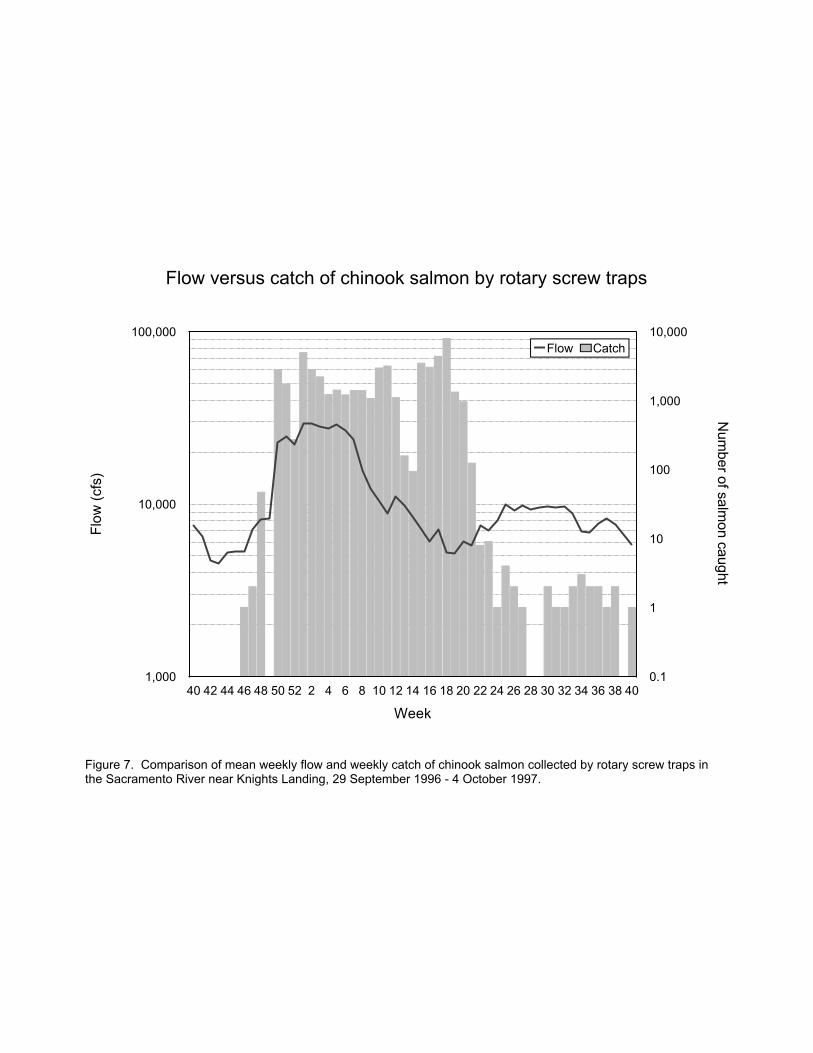
Flow versus catch of chinook salmon by rotary screw traps
Figure 7. Comparison of mean weekly flow and weekly catch of chinook salmon collected by rotary screw traps inthe Sacramento River near Knights Landing, 29 September 1996 - 4 October 1997.
40 42 44 46 48 50 52 2 4 6 8 10 12 14 16 18 20 22 24 26 28 30 32 34 36 38 40
Week
1,000
10,000
100,000
Flo
w (
cfs
)
0.1
1
10
100
1,000
10,000
Num
ber o
f salm
on c
aught
Flow Catch
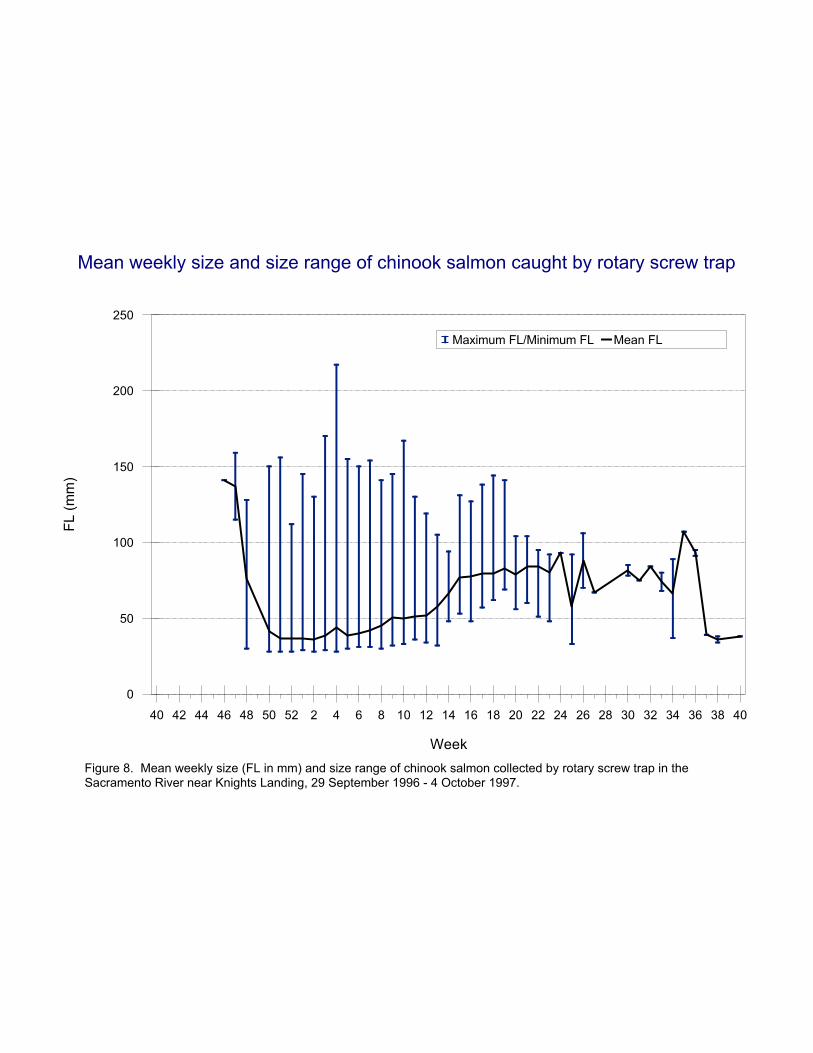
Mean weekly size and size range of chinook salmon caught by rotary screw trap
Figure 8. Mean weekly size (FL in mm) and size range of chinook salmon collected by rotary screw trap in theSacramento River near Knights Landing, 29 September 1996 - 4 October 1997.
40 42 44 46 48 50 52 2 4 6 8 10 12 14 16 18 20 22 24 26 28 30 32 34 36 38 40
Week
0
50
100
150
200
250
FL
(m
m)
Maximum FL/Minimum FL Mean FL

Figure 9. Size distribution of chinook salmon caught by rotary screw traps near KnightsLanding, Sacramento River, 29 September through 30 November 1996.
25
30
35
40
45
50
55
60
65
70
75
80
85
90
95
10
0
10
5
11
0
11
5
12
0
12
5
13
0
13
5
14
0
14
5
15
0
15
5
16
0
16
5
17
0
17
5
18
0
18
5
19
0
19
5
20
0
Size (FL in mm)
0.1
1
10
100
No
. o
f sa
lmo
n c
au
gh
t
Week 48, 24-30 Nov
0.1
1
10
100
No.
of
sa
lmo
n c
au
ght Week 47, 17-23 Nov
0.1
1
10
100
No
. o
f sa
lmo
n c
au
gh
t
Week 46, 10-16 Nov
Chinook salmon size distributionKnights Landing rotary screw traps
1
10
100
No
. o
f sa
lmo
n c
au
gh
t Week 40-45, 29 Sep-9 Nov
No salmon caught

Figure 10. Size distribution of chinook salmon caught by rotary screw traps nearKnights Landing, Sacramento River, 1 - 28 December 1996.
25
30
35
40
45
50
55
60
65
70
75
80
85
90
95
10
0
10
5
11
0
11
5
12
0
12
5
13
0
13
5
14
0
14
5
15
0
15
5
16
0
16
5
17
0
17
5
18
0
18
5
19
0
19
5
20
0
Size (FL in mm)
0.1
1
10
100
No
. o
f sa
lmo
n c
au
gh
t
Week 52, 22-28 Dec
0.1
1
10
100
1000
No
. o
f sa
lmo
n c
au
gh
t Week 51, 15-21 Dec
0.1
1
10
100
1000
No
. o
f sa
lmo
n c
au
gh
t
Week 50, 8-14 Dec
Chinook salmon size distributionKnights Landing rotary screw traps
1
10
100
No.
of
sa
lmo
n c
au
ght Week 49, 1-7 Dec
No salmon caught
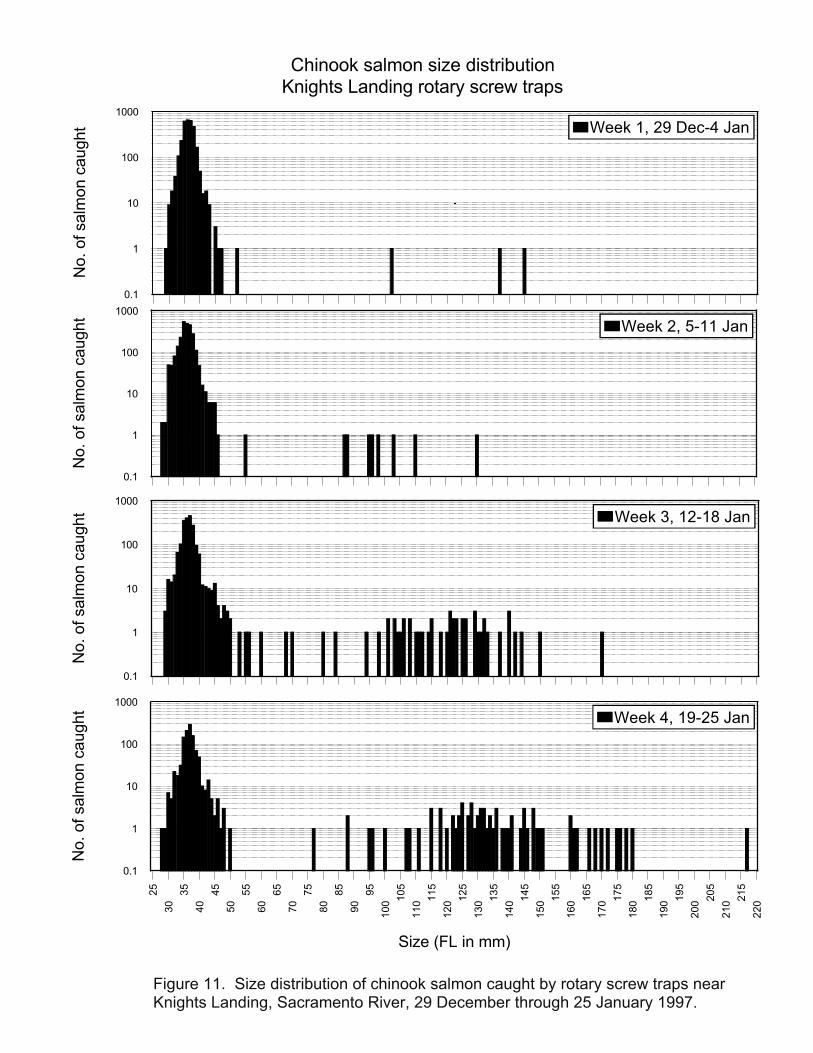
Figure 11. Size distribution of chinook salmon caught by rotary screw traps nearKnights Landing, Sacramento River, 29 December through 25 January 1997.
25
30
35
40
45
50
55
60
65
70
75
80
85
90
95
10
0
10
5
11
0
11
5
12
0
12
5
13
0
13
5
14
0
14
5
15
0
15
5
16
0
16
5
17
0
17
5
18
0
18
5
19
0
19
5
20
0
20
5
21
0
21
5
22
0
Size (FL in mm)
0.1
1
10
100
1000
No
. o
f sa
lmo
n c
au
gh
t
Week 4, 19-25 Jan
0.1
1
10
100
1000
No.
of
sa
lmo
n c
au
ght Week 3, 12-18 Jan
0.1
1
10
100
1000
No
. o
f sa
lmo
n c
au
gh
t
Week 2, 5-11 Jan
Chinook salmon size distributionKnights Landing rotary screw traps
0.1
1
10
100
1000
No.
of
sa
lmo
n c
au
ght Week 1, 29 Dec-4 Jan
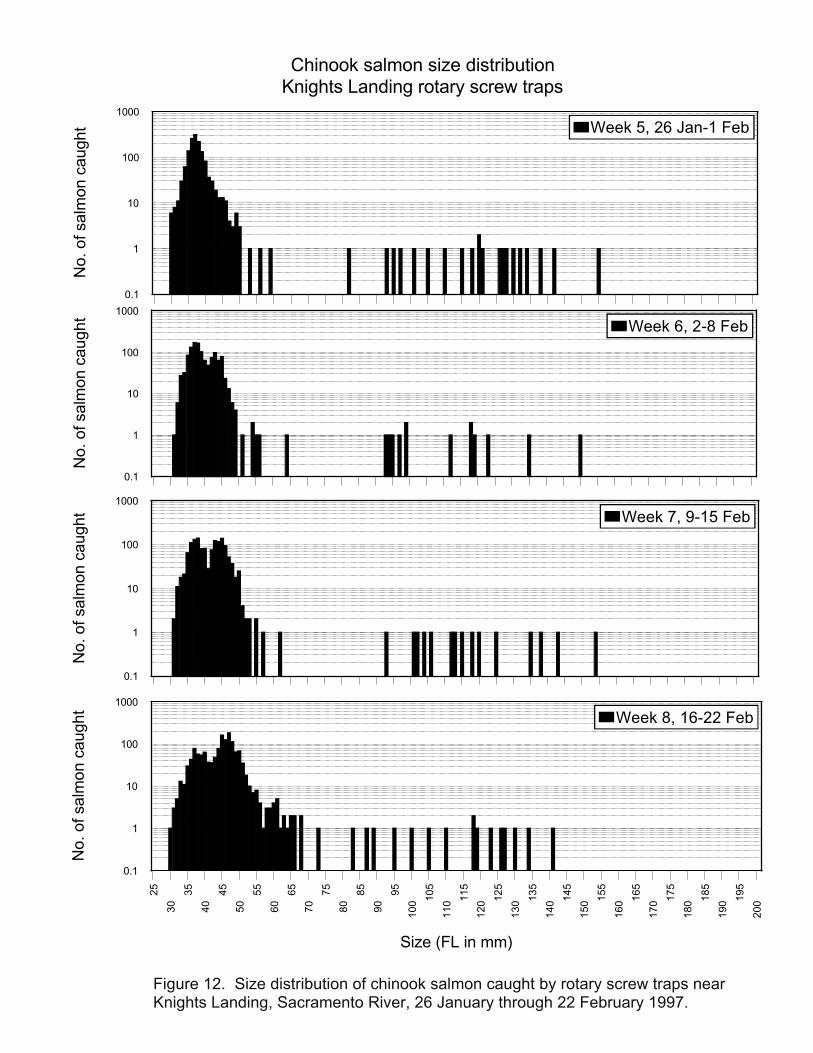
Figure 12. Size distribution of chinook salmon caught by rotary screw traps nearKnights Landing, Sacramento River, 26 January through 22 February 1997.
25
30
35
40
45
50
55
60
65
70
75
80
85
90
95
10
0
10
5
11
0
11
5
12
0
12
5
13
0
13
5
14
0
14
5
15
0
15
5
16
0
16
5
17
0
17
5
18
0
18
5
19
0
19
5
20
0
Size (FL in mm)
0.1
1
10
100
1000
No
. o
f sa
lmo
n c
au
gh
t
Week 8, 16-22 Feb
0.1
1
10
100
1000
No
. o
f sa
lmo
n c
au
gh
t Week 7, 9-15 Feb
0.1
1
10
100
1000
No.
of
sa
lmo
n c
au
ght
Week 6, 2-8 Feb
Chinook salmon size distributionKnights Landing rotary screw traps
0.1
1
10
100
1000
No
. o
f sa
lmo
n c
au
gh
t Week 5, 26 Jan-1 Feb

Figure 13. Size distribution of chinook salmon caught by rotary screw traps nearKnights Landing, Sacramento River, 23 February through 22 March 1997.
25
30
35
40
45
50
55
60
65
70
75
80
85
90
95
10
0
10
5
11
0
11
5
12
0
12
5
13
0
13
5
14
0
14
5
15
0
15
5
16
0
16
5
17
0
17
5
18
0
18
5
19
0
19
5
20
0
Size (FL in mm)
0.1
1
10
100
1000
No
. o
f sa
lmo
n c
au
gh
t
Week 12, 16-22 Mar
0.1
1
10
100
1000
No.
of
sa
lmo
n c
au
ght Week 11, 9-15 Mar
0.1
1
10
100
1000
No.
of
sa
lmo
n c
au
ght
Week 10, 2-8 Mar
Chinook salmon size distributionKnights Landing rotary screw traps
0.1
1
10
100
1000
No
. o
f sa
lmo
n c
au
gh
t Week 9, 23 Feb-1 Mar

Figure 14. Size distribution of chinook salmon caught by rotary screw traps nearKnights Landing, Sacramento River, 23 March through 19 April 1997.
25
30
35
40
45
50
55
60
65
70
75
80
85
90
95
10
0
10
5
11
0
11
5
12
0
12
5
13
0
13
5
14
0
14
5
15
0
15
5
16
0
16
5
17
0
17
5
18
0
18
5
19
0
19
5
20
0
Size (FL in mm)
0.1
1
10
100
1000
No
. o
f sa
lmo
n c
au
gh
t
Week 16, 13-19 Apr
0.1
1
10
100
1000
No.
of
sa
lmo
n c
au
ght Week 15, 6-12 Apr
0.1
1
10
100
1000
No
. o
f sa
lmo
n c
au
gh
t
Week 14, 30 Mar-5 Apr
Chinook salmon size distributionKnights Landing rotary screw traps
0.1
1
10
100
1000
No.
of
sa
lmo
n c
au
ght Week 13, 23-29 Mar
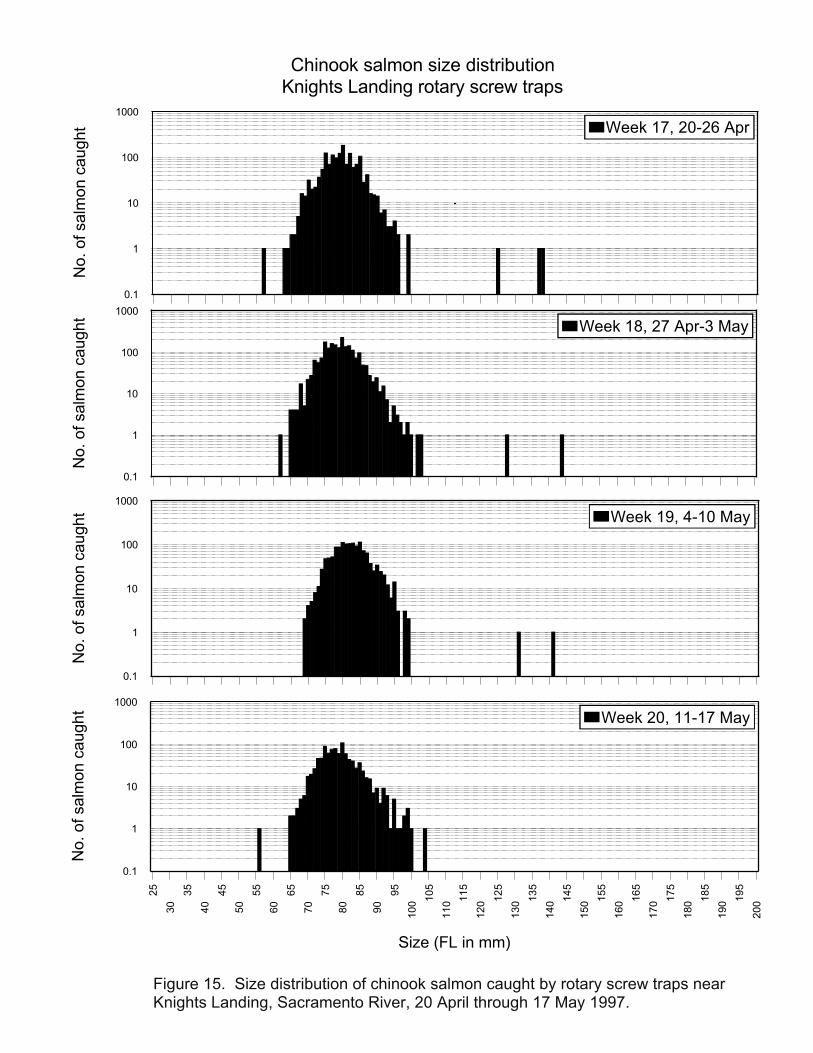
Figure 15. Size distribution of chinook salmon caught by rotary screw traps nearKnights Landing, Sacramento River, 20 April through 17 May 1997.
25
30
35
40
45
50
55
60
65
70
75
80
85
90
95
10
0
10
5
11
0
11
5
12
0
12
5
13
0
13
5
14
0
14
5
15
0
15
5
16
0
16
5
17
0
17
5
18
0
18
5
19
0
19
5
20
0
Size (FL in mm)
0.1
1
10
100
1000
No
. o
f sa
lmo
n c
au
gh
t
Week 20, 11-17 May
0.1
1
10
100
1000
No.
of
sa
lmo
n c
au
ght Week 19, 4-10 May
0.1
1
10
100
1000
No
. o
f sa
lmo
n c
au
gh
t
Week 18, 27 Apr-3 May
Chinook salmon size distributionKnights Landing rotary screw traps
0.1
1
10
100
1000
No.
of
sa
lmo
n c
au
ght Week 17, 20-26 Apr

Figure 16. Size distribution of chinook salmon caught by rotary screw traps nearKnights Landing, Sacramento River, 18 May through 14 June 1997.
25
30
35
40
45
50
55
60
65
70
75
80
85
90
95
10
0
10
5
11
0
11
5
12
0
12
5
13
0
13
5
14
0
14
5
15
0
15
5
16
0
16
5
17
0
17
5
18
0
18
5
19
0
19
5
20
0
Size (FL in mm)
0.1
1
10
100
1000
No
. o
f sa
lmo
n c
au
gh
t
Week 24, 8-14 Jun
0.1
1
10
100
1000
No.
of
sa
lmo
n c
au
ght Week 23, 1-7 Jun
0.1
1
10
100
1000
No
. o
f sa
lmo
n c
au
gh
t
Week 22, 25-31 May
Chinook salmon size distributionKnights Landing rotary screw traps
0.1
1
10
100
1000
No.
of
sa
lmo
n c
au
ght Week 21, 18-24 May
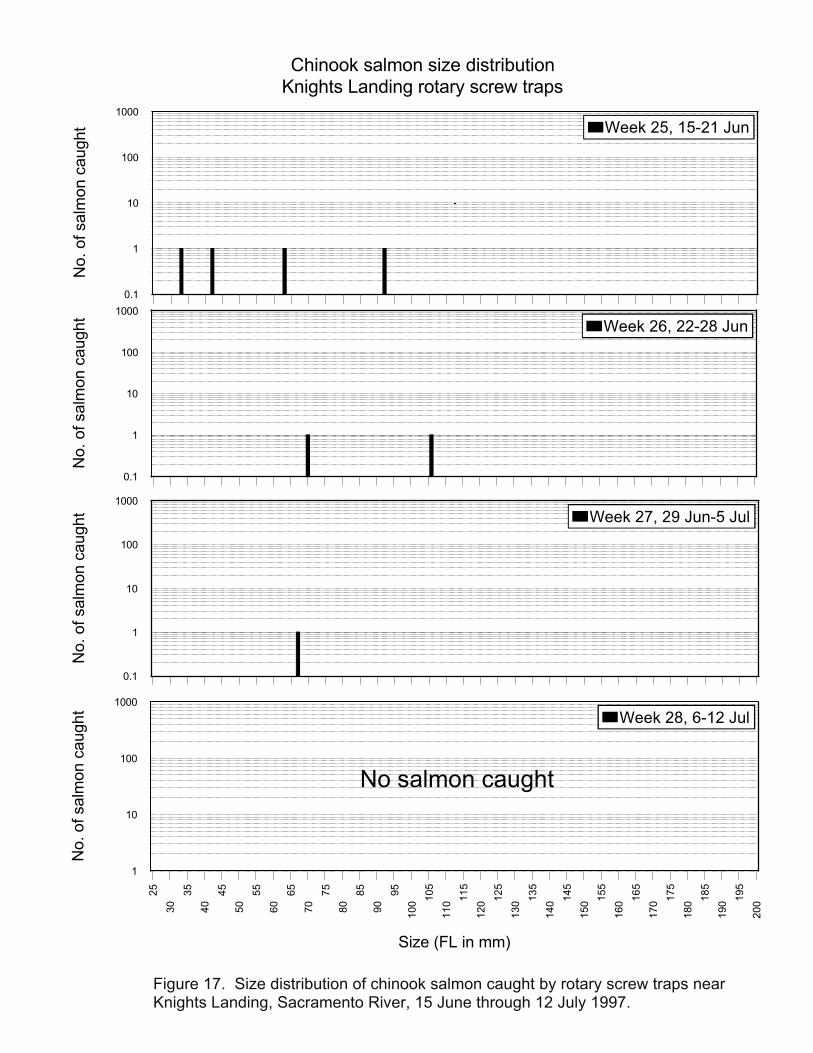
Figure 17. Size distribution of chinook salmon caught by rotary screw traps nearKnights Landing, Sacramento River, 15 June through 12 July 1997.
25
30
35
40
45
50
55
60
65
70
75
80
85
90
95
10
0
10
5
11
0
11
5
12
0
12
5
13
0
13
5
14
0
14
5
15
0
15
5
16
0
16
5
17
0
17
5
18
0
18
5
19
0
19
5
20
0
Size (FL in mm)
1
10
100
1000
No
. o
f sa
lmo
n c
au
gh
t
Week 28, 6-12 Jul
0.1
1
10
100
1000
No.
of
sa
lmo
n c
au
ght Week 27, 29 Jun-5 Jul
0.1
1
10
100
1000
No
. o
f sa
lmo
n c
au
gh
t
Week 26, 22-28 Jun
Chinook salmon size distributionKnights Landing rotary screw traps
0.1
1
10
100
1000
No.
of
sa
lmo
n c
au
ght Week 25, 15-21 Jun
No salmon caught
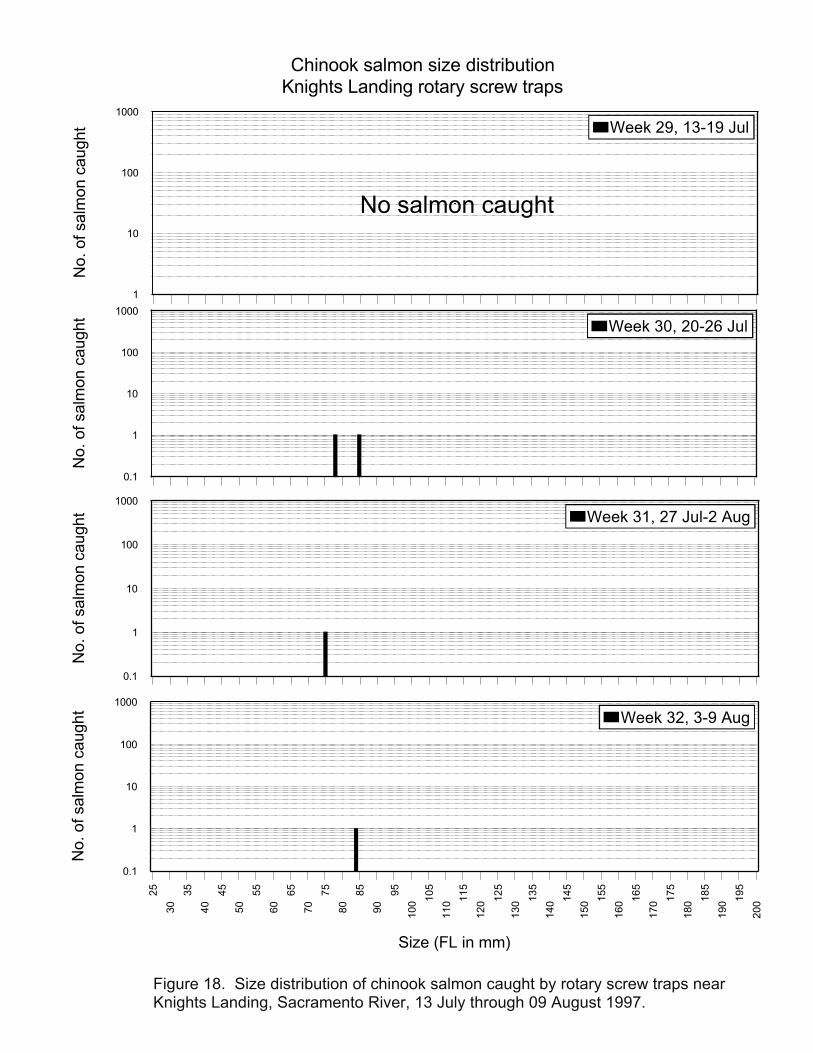
Figure 18. Size distribution of chinook salmon caught by rotary screw traps nearKnights Landing, Sacramento River, 13 July through 09 August 1997.
25
30
35
40
45
50
55
60
65
70
75
80
85
90
95
10
0
10
5
11
0
11
5
12
0
12
5
13
0
13
5
14
0
14
5
15
0
15
5
16
0
16
5
17
0
17
5
18
0
18
5
19
0
19
5
20
0
Size (FL in mm)
0.1
1
10
100
1000
No
. o
f sa
lmo
n c
au
gh
t
Week 32, 3-9 Aug
0.1
1
10
100
1000
No.
of
sa
lmo
n c
au
ght Week 31, 27 Jul-2 Aug
0.1
1
10
100
1000
No
. o
f sa
lmo
n c
au
gh
t
Week 30, 20-26 Jul
Chinook salmon size distributionKnights Landing rotary screw traps
1
10
100
1000
No.
of
sa
lmo
n c
au
ght Week 29, 13-19 Jul
No salmon caught

Figure 19. Size distribution of chinook salmon caught by rotary screw traps nearKnights Landing, Sacramento River, 10 August through 06 September 1997.
25
30
35
40
45
50
55
60
65
70
75
80
85
90
95
10
0
10
5
11
0
11
5
12
0
12
5
13
0
13
5
14
0
14
5
15
0
15
5
16
0
16
5
17
0
17
5
18
0
18
5
19
0
19
5
20
0
Size (FL in mm)
0.1
1
10
100
1000
No
. o
f sa
lmo
n c
au
gh
t
Week 36, 31 Aug-6 Sep
0.1
1
10
100
1000
No.
of
sa
lmo
n c
au
ght Week 35, 24-30 Aug
0.1
1
10
100
1000
No
. o
f sa
lmo
n c
au
gh
t
Week 34, 17-24 Aug
Chinook salmon size distributionKnights Landing rotary screw traps
0.1
1
10
100
1000
No.
of
sa
lmo
n c
au
ght Week 33, 10-16 Aug
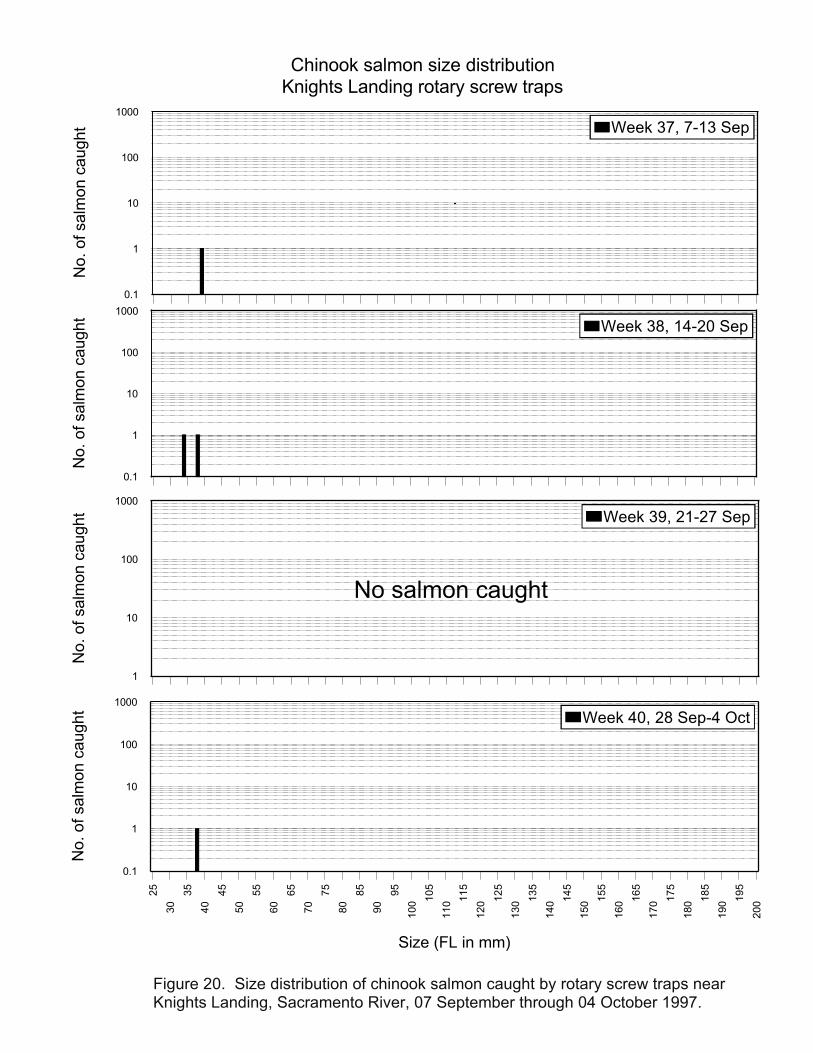
Figure 20. Size distribution of chinook salmon caught by rotary screw traps nearKnights Landing, Sacramento River, 07 September through 04 October 1997.
25
30
35
40
45
50
55
60
65
70
75
80
85
90
95
10
0
10
5
11
0
11
5
12
0
12
5
13
0
13
5
14
0
14
5
15
0
15
5
16
0
16
5
17
0
17
5
18
0
18
5
19
0
19
5
20
0
Size (FL in mm)
0.1
1
10
100
1000
No
. o
f sa
lmo
n c
au
gh
t
Week 40, 28 Sep-4 Oct
1
10
100
1000
No.
of
sa
lmo
n c
au
ght Week 39, 21-27 Sep
0.1
1
10
100
1000
No
. o
f sa
lmo
n c
au
gh
t
Week 38, 14-20 Sep
Chinook salmon size distributionKnights Landing rotary screw traps
0.1
1
10
100
1000
No.
of
sa
lmo
n c
au
ght Week 37, 7-13 Sep
No salmon caught

Figure 21. Catch distribution of in-river produced chinook salmon caught by rotaryscrew traps near Knights Landing, Sacramento River, 29 September 1996 through 4October 1997.
40
414
24
34
44
54
64
74
84
95
05
15
21
23
45
67
891
01
11
21
31
41
51
61
71
81
92
02
12
22
32
42
52
62
72
82
93
03
13
23
33
43
53
63
73
83
94
0
Week
0.1
1
10
100
1000
10000
100000
No
. o
f sa
lmo
n c
au
gh
t Fall run
0.1
1
10
100
1000
10000
No.
of
sa
lmo
n c
au
ght Spring run
0.1
1
10
100
1000
10000
No
. o
f sa
lmo
n c
au
gh
t
Winter run
Catch distribution of in-river produced chinook salmon caught by rotary screw trapsnear Knights Landing, Sacramento River
0.1
1
10
100
1000
10000
No
. o
f sa
lmo
n c
au
gh
t Late-fall run
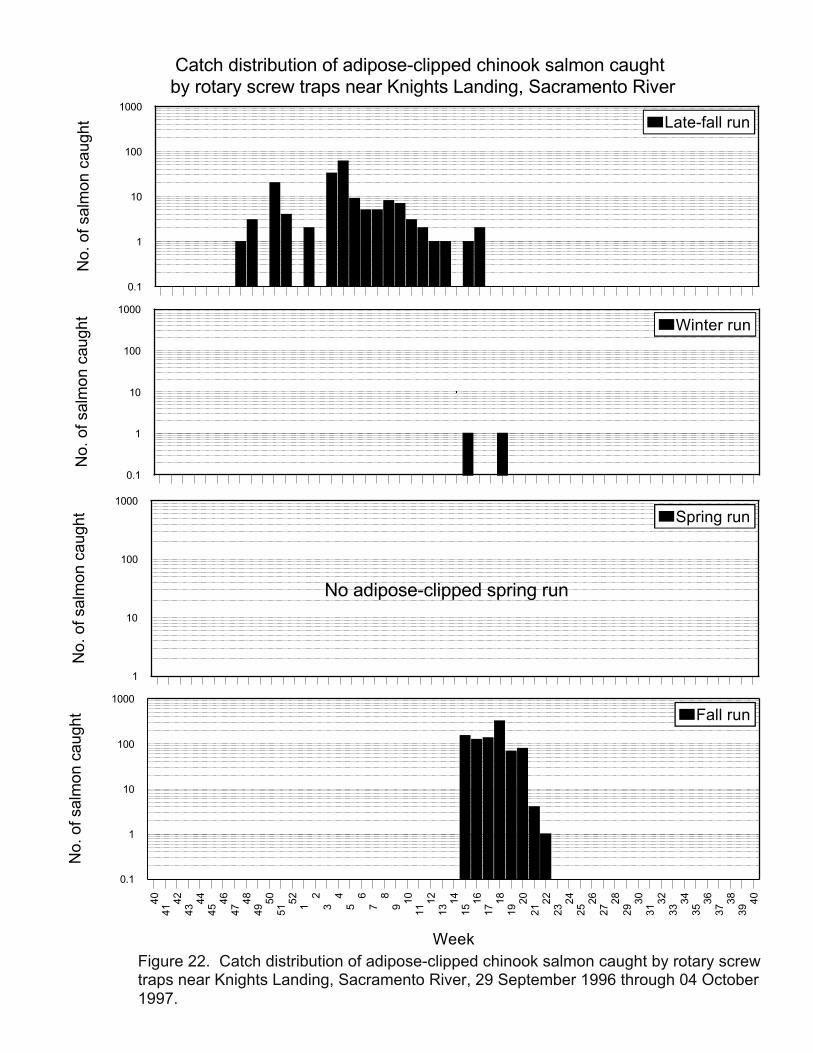
Figure 22. Catch distribution of adipose-clipped chinook salmon caught by rotary screwtraps near Knights Landing, Sacramento River, 29 September 1996 through 04 October1997.
40
414
24
34
44
54
64
74
84
95
05
15
21
23
45
67
891
01
11
21
31
41
51
61
71
81
92
02
12
22
32
42
52
62
72
82
93
03
13
23
33
43
53
63
73
83
94
0
Week
0.1
1
10
100
1000
No
. o
f sa
lmo
n c
au
gh
t Fall run
1
10
100
1000
No.
of
sa
lmo
n c
au
ght Spring run
0.1
1
10
100
1000
No.
of
sa
lmo
n c
au
ght
Winter run
Catch distribution of adipose-clipped chinook salmon caught by rotary screw traps near Knights Landing, Sacramento River
0.1
1
10
100
1000
No
. o
f sa
lmo
n c
au
gh
t Late-fall run
No adipose-clipped spring run
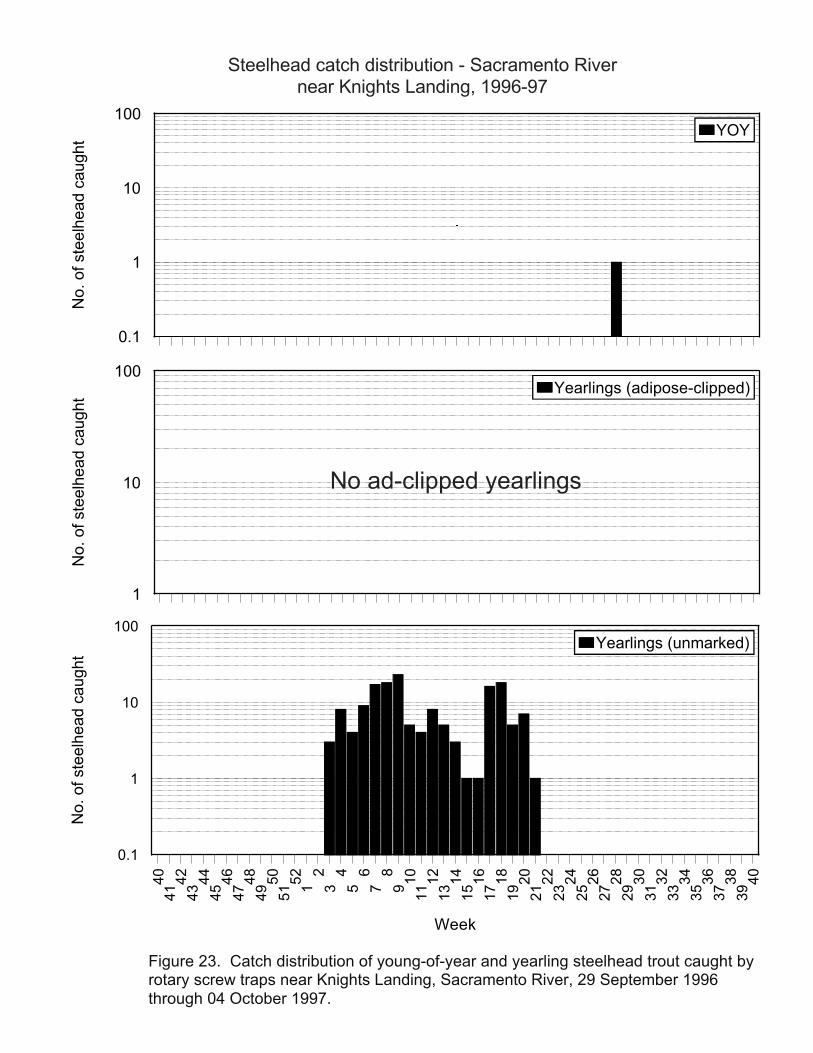
Figure 23. Catch distribution of young-of-year and yearling steelhead trout caught byrotary screw traps near Knights Landing, Sacramento River, 29 September 1996through 04 October 1997.
Steelhead catch distribution - Sacramento Rivernear Knights Landing, 1996-97
0.1
1
10
100
No
. o
f ste
elh
ea
d c
au
gh
t
YOY
1
10
100
No
. of
ste
elh
ea
d c
au
gh
t
Yearlings (adipose-clipped)
40
414
24
34
44
54
64
74
84
95
05
15
21
23
45
67
891
01
11
21
31
41
51
61
71
81
92
02
12
22
32
42
52
62
72
82
93
03
13
23
33
43
53
63
73
83
94
0
Week
0.1
1
10
100
No.
of
ste
elh
ea
d c
au
gh
t
Yearlings (unmarked)
No ad-clipped yearlings
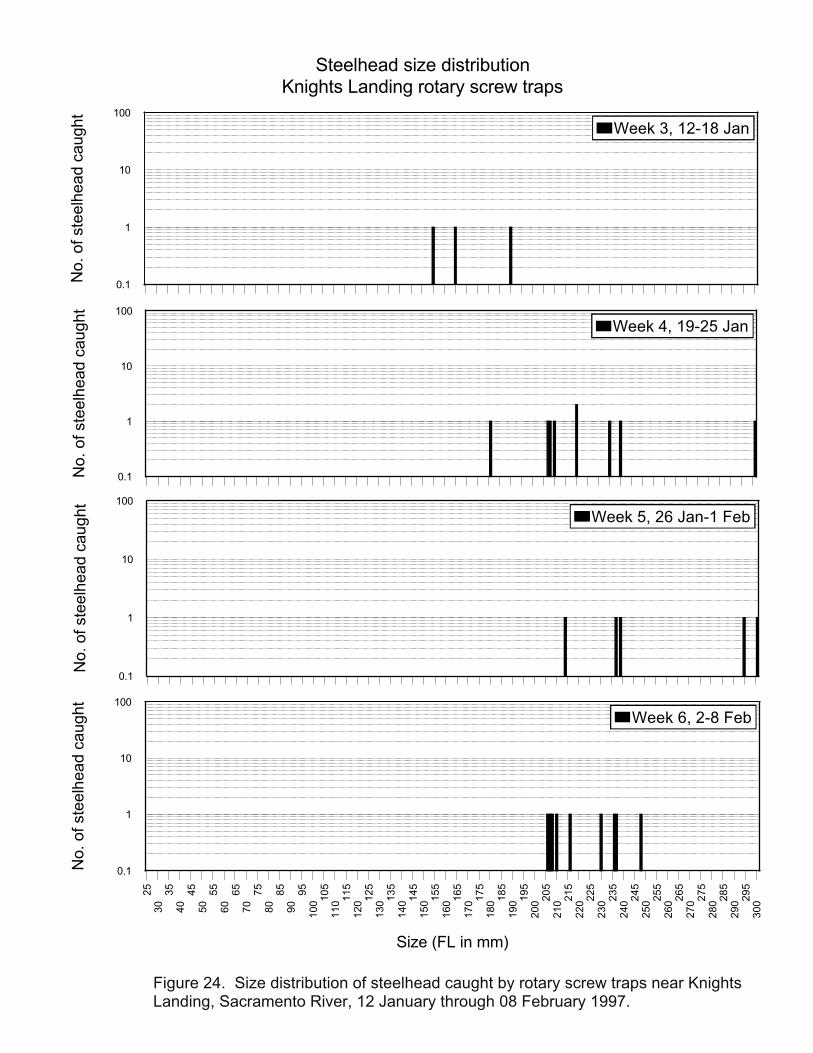
Figure 24. Size distribution of steelhead caught by rotary screw traps near KnightsLanding, Sacramento River, 12 January through 08 February 1997.
25
30
35
40
45
50
55
60
65
70
75
80
85
90
95
10
01
05
11
01
15
12
01
25
13
01
35
14
01
45
15
01
55
16
01
65
17
01
75
18
01
85
19
01
95
20
02
05
21
02
15
22
02
25
23
02
35
24
02
45
25
02
55
26
02
65
27
02
75
28
02
85
29
02
95
30
0
Size (FL in mm)
0.1
1
10
100
No.
of ste
elh
ea
d c
aug
ht
Week 6, 2-8 Feb
0.1
1
10
100
No.
of ste
elh
ea
d c
aug
ht
Week 5, 26 Jan-1 Feb
0.1
1
10
100
No.
of ste
elh
ea
d c
aug
ht
Week 4, 19-25 Jan
Steelhead size distributionKnights Landing rotary screw traps
0.1
1
10
100
No.
of ste
elh
ea
d c
aug
ht
Week 3, 12-18 Jan
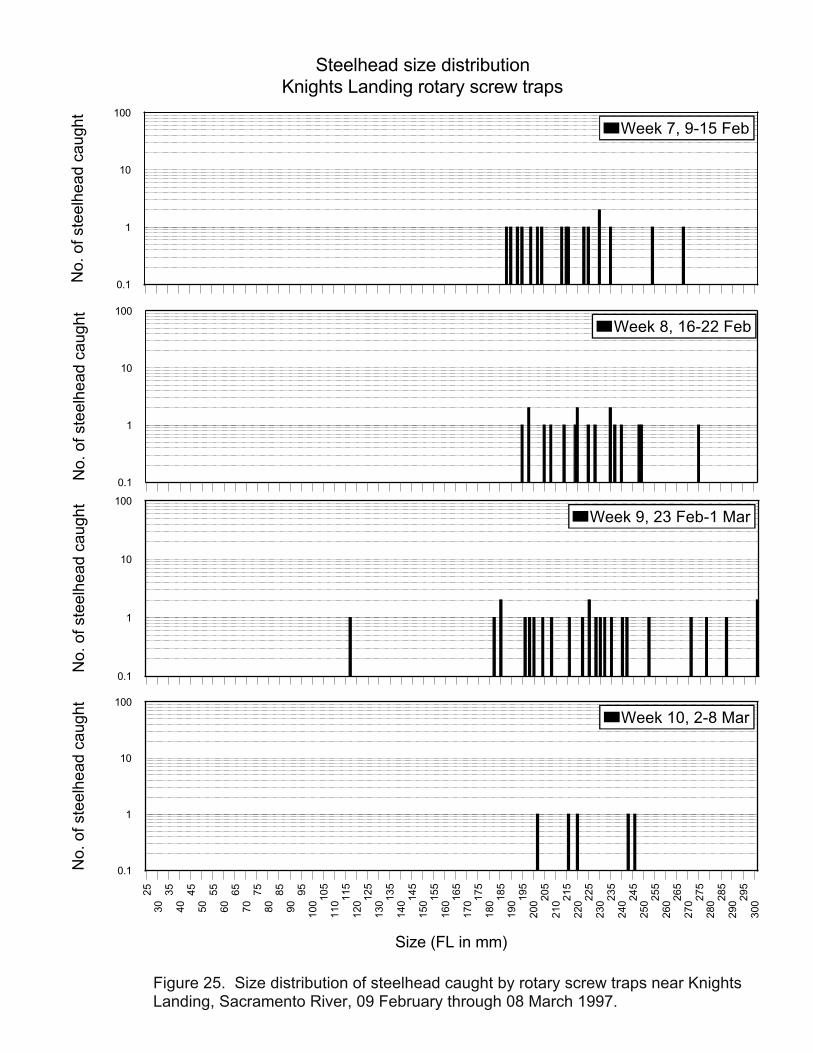
Figure 25. Size distribution of steelhead caught by rotary screw traps near KnightsLanding, Sacramento River, 09 February through 08 March 1997.
25
30
35
40
45
50
55
60
65
70
75
80
85
90
95
10
01
05
11
01
15
12
01
25
13
01
35
14
01
45
15
01
55
16
01
65
17
01
75
18
01
85
19
01
95
20
02
05
21
02
15
22
02
25
23
02
35
24
02
45
25
02
55
26
02
65
27
02
75
28
02
85
29
02
95
30
0
Size (FL in mm)
0.1
1
10
100
No
. of
ste
elh
ea
d c
au
gh
t
Week 10, 2-8 Mar
0.1
1
10
100
No.
of
ste
elh
ea
d c
au
gh
t
Week 9, 23 Feb-1 Mar
0.1
1
10
100
No.
of ste
elh
ea
d c
aug
ht
Week 8, 16-22 Feb
Steelhead size distributionKnights Landing rotary screw traps
0.1
1
10
100
No
. o
f ste
elh
ea
d c
au
gh
t
Week 7, 9-15 Feb
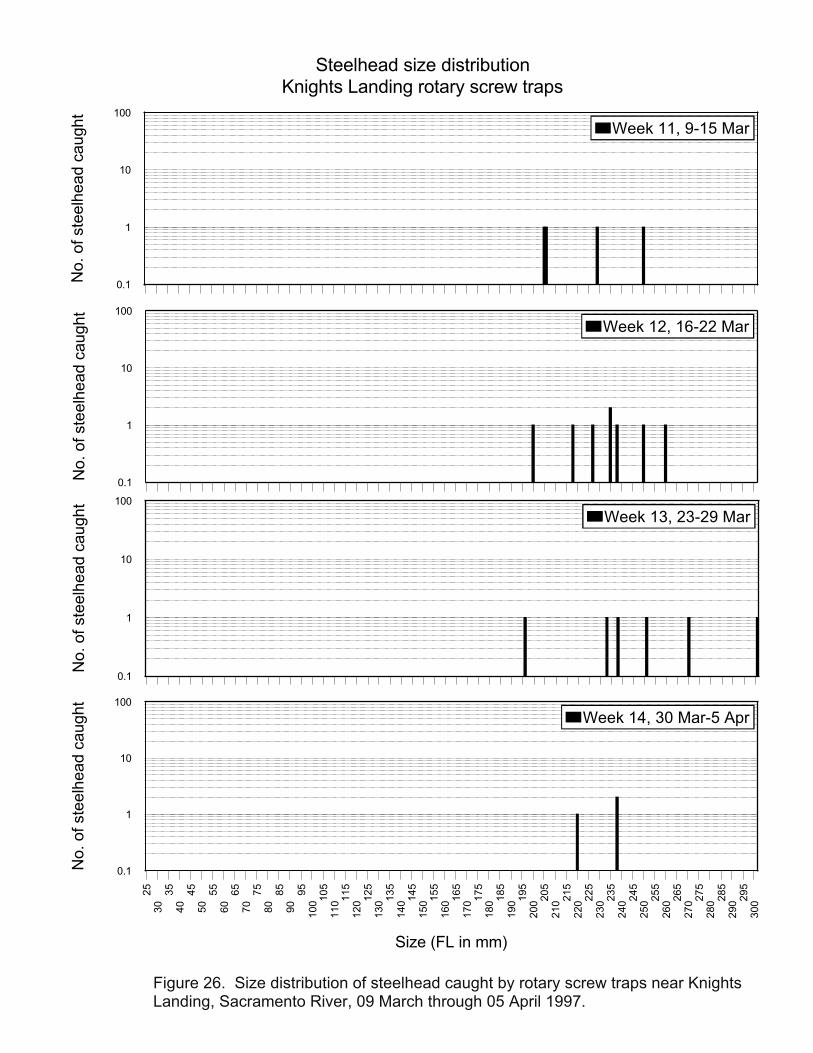
Figure 26. Size distribution of steelhead caught by rotary screw traps near KnightsLanding, Sacramento River, 09 March through 05 April 1997.
25
30
35
40
45
50
55
60
65
70
75
80
85
90
95
10
01
05
11
01
15
12
01
25
13
01
35
14
01
45
15
01
55
16
01
65
17
01
75
18
01
85
19
01
95
20
02
05
21
02
15
22
02
25
23
02
35
24
02
45
25
02
55
26
02
65
27
02
75
28
02
85
29
02
95
30
0
Size (FL in mm)
0.1
1
10
100
No.
of ste
elh
ea
d c
aug
ht
Week 14, 30 Mar-5 Apr
0.1
1
10
100
No.
of
ste
elh
ea
d c
au
gh
t
Week 13, 23-29 Mar
0.1
1
10
100
No.
of ste
elh
ea
d c
aug
ht
Week 12, 16-22 Mar
Steelhead size distributionKnights Landing rotary screw traps
0.1
1
10
100
No
. o
f ste
elh
ea
d c
au
gh
t
Week 11, 9-15 Mar
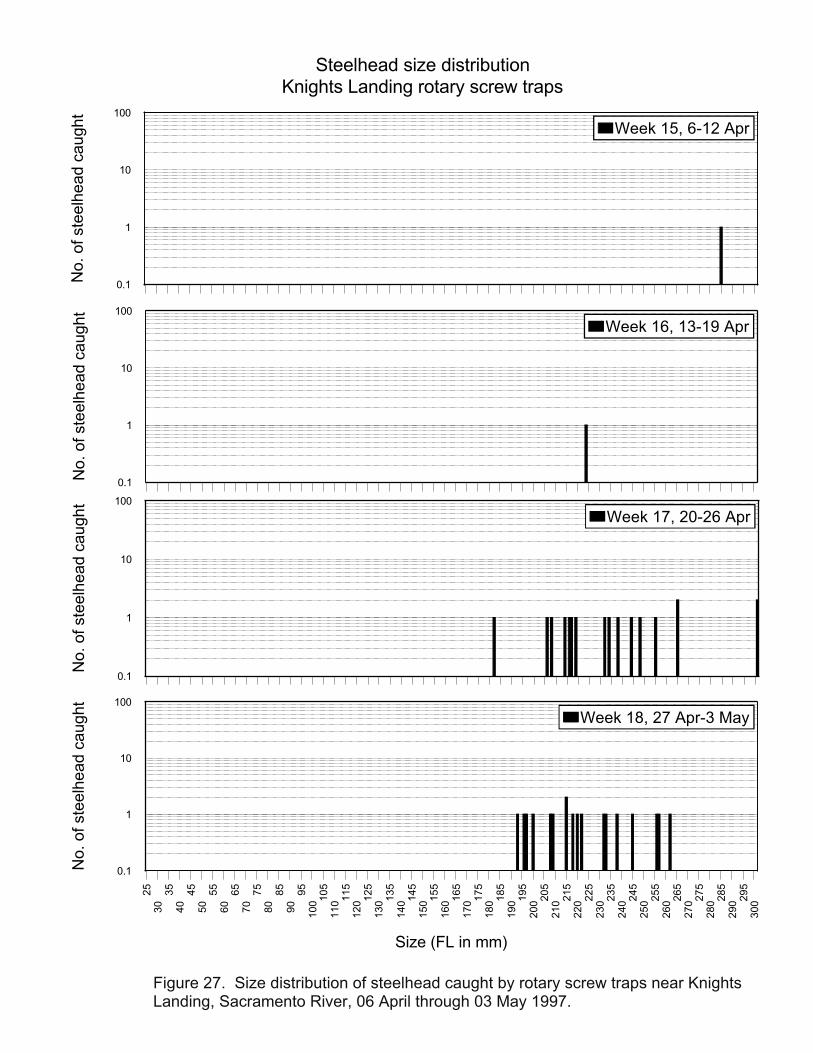
Figure 27. Size distribution of steelhead caught by rotary screw traps near KnightsLanding, Sacramento River, 06 April through 03 May 1997.
25
30
35
40
45
50
55
60
65
70
75
80
85
90
95
10
01
05
11
01
15
12
01
25
13
01
35
14
01
45
15
01
55
16
01
65
17
01
75
18
01
85
19
01
95
20
02
05
21
02
15
22
02
25
23
02
35
24
02
45
25
02
55
26
02
65
27
02
75
28
02
85
29
02
95
30
0
Size (FL in mm)
0.1
1
10
100
No
. of
ste
elh
ea
d c
au
gh
t
Week 18, 27 Apr-3 May
0.1
1
10
100
No.
of
ste
elh
ea
d c
au
gh
t
Week 17, 20-26 Apr
0.1
1
10
100
No.
of ste
elh
ea
d c
aug
ht
Week 16, 13-19 Apr
Steelhead size distributionKnights Landing rotary screw traps
0.1
1
10
100
No
. o
f ste
elh
ea
d c
au
gh
t
Week 15, 6-12 Apr
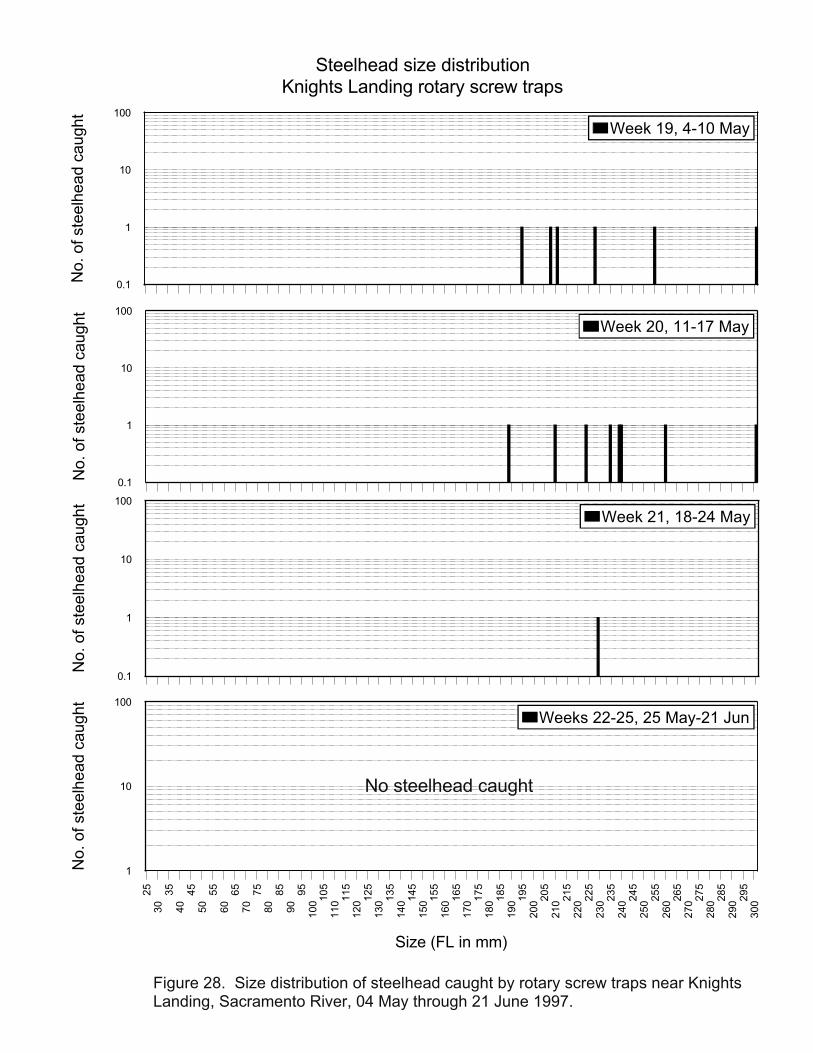
Figure 28. Size distribution of steelhead caught by rotary screw traps near KnightsLanding, Sacramento River, 04 May through 21 June 1997.
25
30
35
40
45
50
55
60
65
70
75
80
85
90
95
10
01
05
11
01
15
12
01
25
13
01
35
14
01
45
15
01
55
16
01
65
17
01
75
18
01
85
19
01
95
20
02
05
21
02
15
22
02
25
23
02
35
24
02
45
25
02
55
26
02
65
27
02
75
28
02
85
29
02
95
30
0
Size (FL in mm)
1
10
100
No
. of
ste
elh
ea
d c
au
gh
t
Weeks 22-25, 25 May-21 Jun
0.1
1
10
100
No.
of
ste
elh
ea
d c
au
gh
t
Week 21, 18-24 May
0.1
1
10
100
No.
of ste
elh
ea
d c
aug
ht
Week 20, 11-17 May
Steelhead size distributionKnights Landing rotary screw traps
0.1
1
10
100
No
. o
f ste
elh
ea
d c
au
gh
t
Week 19, 4-10 May
No steelhead caught

Figure 29. Size distribution of steelhead caught by rotary screw traps near KnightsLanding, Sacramento River, 22 June through 04 October 1997.
25
30
35
40
45
50
55
60
65
70
75
80
85
90
95
10
01
05
11
01
15
12
01
25
13
01
35
14
01
45
15
01
55
16
01
65
17
01
75
18
01
85
19
01
95
20
02
05
21
02
15
22
02
25
23
02
35
24
02
45
25
02
55
26
02
65
27
02
75
28
02
85
29
02
95
30
0
Size (FL in mm)
1
10
100
No.
of ste
elh
ea
d c
aug
ht
Weeks 29-40, 13 Jul-4 Oct
0.1
1
10
100
No.
of
ste
elh
ea
d c
au
gh
t
Week 28, 6-12 Jul
1
10
100
No.
of ste
elh
ea
d c
aug
ht
Week 27, 29 Jun-5 Jul
Steelhead size distributionKnights Landing rotary screw traps
0.1
1
10
100
No
. o
f ste
elh
ea
d c
au
gh
t
Week 26, 22-28 Jun
No steelhead caught
No steelhead caught
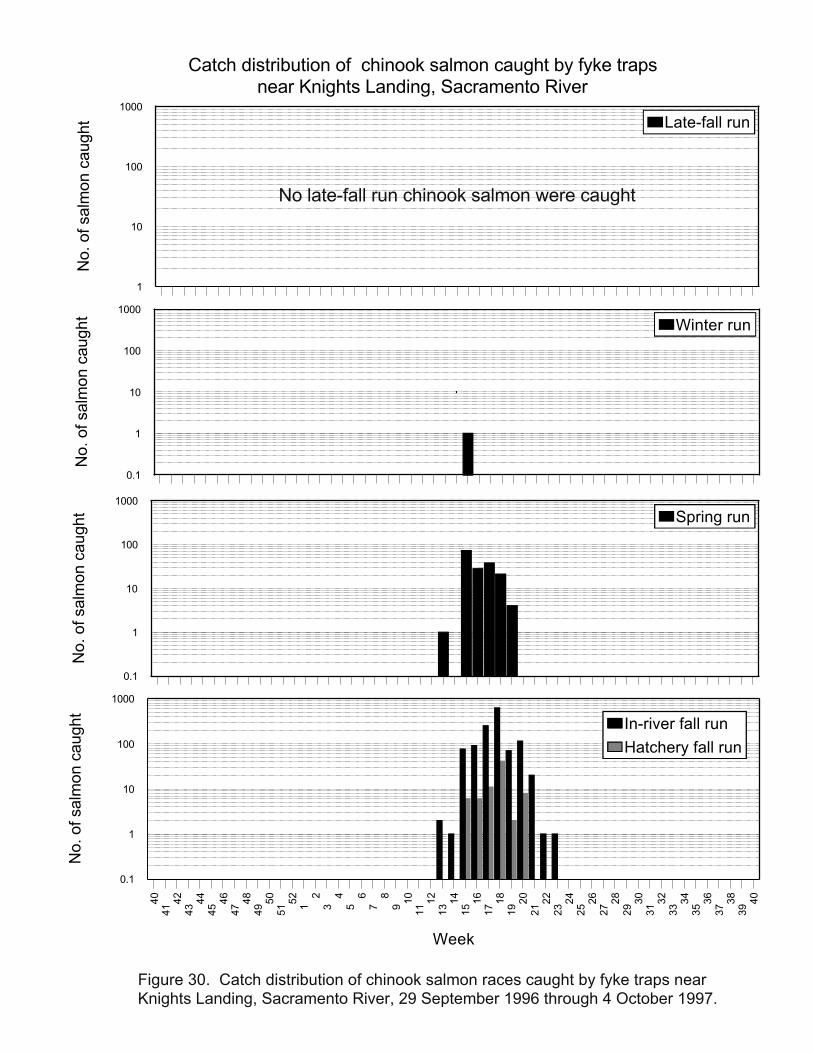
Figure 30. Catch distribution of chinook salmon races caught by fyke traps nearKnights Landing, Sacramento River, 29 September 1996 through 4 October 1997.
40
414
24
34
44
54
64
74
84
95
05
15
21
23
45
67
891
01
11
21
31
41
51
61
71
81
92
02
12
22
32
42
52
62
72
82
93
03
13
23
33
43
53
63
73
83
94
0
Week
0.1
1
10
100
1000
No
. o
f sa
lmo
n c
au
gh
t
In-river fall run
Hatchery fall run
0.1
1
10
100
1000
No.
of
sa
lmo
n c
au
ght Spring run
0.1
1
10
100
1000
No.
of
sa
lmo
n c
au
ght
Winter run
Catch distribution of chinook salmon caught by fyke trapsnear Knights Landing, Sacramento River
1
10
100
1000
No.
of
sa
lmo
n c
au
ght Late-fall run
No late-fall run chinook salmon were caught

RST versus fyke net catch distribution
Figure 31. Comparison of juvenile chinook salmon catch distributions for RST and fyke nets when the two gear typeswere concurrently fishing in the Sacramento RIver near Knights Landing, 26 March - 5 June 1997.
!
!!
!!
!
!
!!
!
!
13 14 15 16 17 18 19 20 21 22 23 24 25 26 27
Week
0.1
1
10
100
1,000
10,000
No
. o
f sa
lmo
n c
au
gh
t b
y R
ST
0.1
1
10
100
1,000
No. o
f salm
on c
aught b
y fy
ke n
ets
RST fyke nets!

Figure 32. Comparison of lenght frequency distributions for salmon that were marked and salmon that wererecaptured during the trap efficiency evaluations conducted on the Sacramento RIver near Knights Landing between24 November 1996 and 10 May 1997.
0
5
10
15
20
25
30
No
. o
f re
ca
ptu
red
sa
lmo
n Recaptured salmon
25 30 35 40 45 50 55 60 65 70 75 80 85 90 95 100
Size (FL in mm)
0
200
400
600
800
1000
1200
1400
No
. o
f m
ark
ed
sa
lmo
n
0
5
10
15
20
25
30 No. o
f recaptu
red s
alm
on
Recaptured Marked

APPENDIX

Comparison of water transparency and flow
Appendix Figure 1. Comparison of water transparency (ln of Secchi disk depth) versus flow measured on theSacramento River near Knights Landing, 29 September 1996 - 4 October 1997.
+
+
+
++
+++
+
+
+
+
++
+
+
+
+
++
+
++
+
+
+
++ +
+
++
+ +
+ ++ +
+
++
+
++++
+ +
++
+
+
+
0 5,000 10,000 15,000 20,000 25,000 30,000
0
0.5
1
1.5
-0.5
-1
-1.5
Tra
nsp
are
ncy (
ln)

Appendix Figure 2. Size distribution of chinook salmon collected in the SacramentoRiver near Knights Landing compared with size distribution of Coleman NFH salmonreleased 01, 09, and 15/16 April 1997.
Size distributions of chinook salmon collected near Knights Landingversus salmon released from Coleman NFH
0.1
1
10
100
1000
No.
of chin
ook s
alm
on
CNFH, 01 Apr
Week 14, 30 Mar-5 Apr
0.1
1
10
100
1000
No.
of chin
ook s
alm
on
CNFH, 01 Apr
CNFH, 09 Apr
Week 15, 6-12 Apr
25
30
35
40
45
50
55
60
65
70
75
80
85
90
95
10
01
05
11
01
15
12
01
25
13
01
35
14
01
45
15
01
55
16
01
65
17
01
75
18
01
85
19
01
95
20
0
Size (FL in mm)
0.1
1
10
100
1000
No.
of
ch
ino
ok s
alm
on CNFH, 01 Apr
CNFH, 09 Apr
CNFH, 15/16 Apr
Week 16, 13-19 Apr
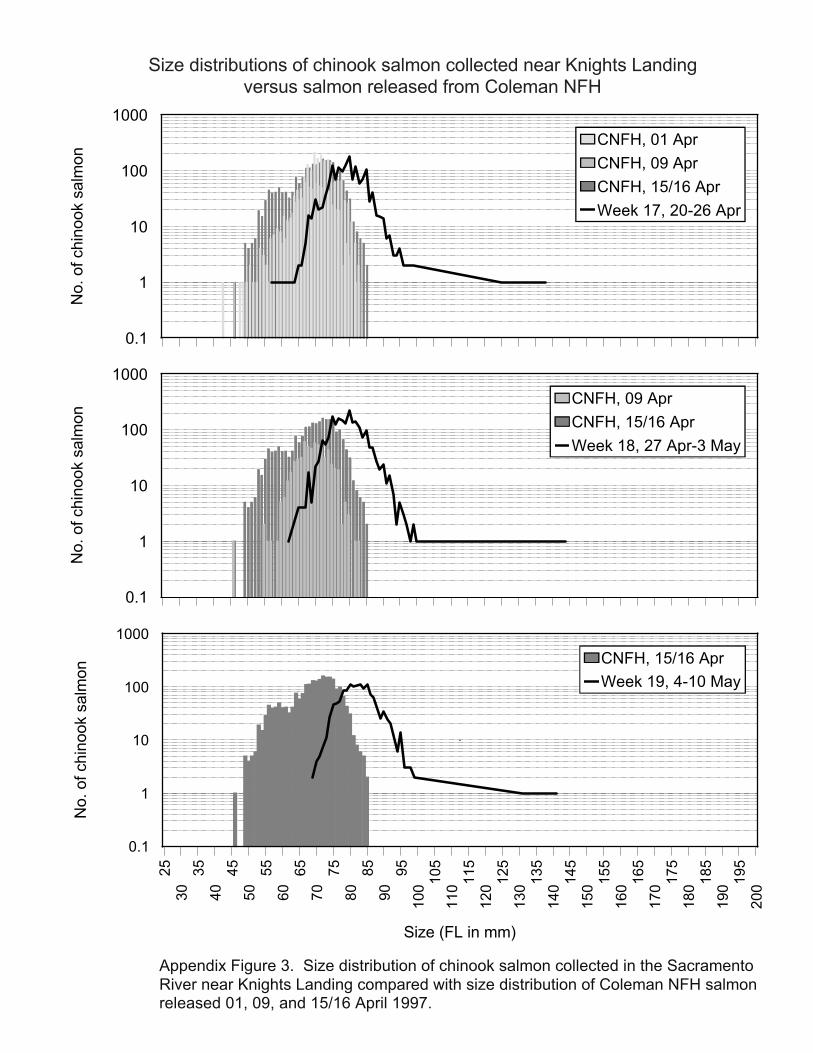
Appendix Figure 3. Size distribution of chinook salmon collected in the SacramentoRiver near Knights Landing compared with size distribution of Coleman NFH salmonreleased 01, 09, and 15/16 April 1997.
Size distributions of chinook salmon collected near Knights Landingversus salmon released from Coleman NFH
0.1
1
10
100
1000
No.
of chin
ook s
alm
on
CNFH, 01 Apr
CNFH, 09 Apr
CNFH, 15/16 Apr
Week 17, 20-26 Apr
0.1
1
10
100
1000
No.
of chin
ook s
alm
on
CNFH, 09 Apr
CNFH, 15/16 Apr
Week 18, 27 Apr-3 May
25
30
35
40
45
50
55
60
65
70
75
80
85
90
95
10
01
05
11
01
15
12
01
25
13
01
35
14
01
45
15
01
55
16
01
65
17
01
75
18
01
85
19
01
95
20
0
Size (FL in mm)
0.1
1
10
100
1000
No.
of
ch
ino
ok s
alm
on CNFH, 15/16 Apr
Week 19, 4-10 May

Appendix Figure 4. Size distribution of chinook salmon collected in the SacramentoRiver near Knights Landing compared with size distribution of Coleman NFH salmonreleased 06 May 1997.
Size distributions of chinook salmon collected near Knights Landingversus salmon released from Coleman NFH
0.1
1
10
100
1000
No.
of chin
ook s
alm
on
CNFH, 06 May
Week 19, 4-10 May
0.1
1
10
100
1000
No.
of chin
ook s
alm
on
CNFH, 06 May
Week 20, 11-17 May
25
30
35
40
45
50
55
60
65
70
75
80
85
90
95
10
01
05
11
01
15
12
01
25
13
01
35
14
01
45
15
01
55
16
01
65
17
01
75
18
01
85
19
01
95
20
0
Size (FL in mm)
0.1
1
10
100
1000
No.
of
ch
ino
ok s
alm
on CNFH, 06 May
Week 21, 18-24 May