time reversal for electromagnetism: applications in … · 2018-09-25 · 0 time reversal for...
TRANSCRIPT

0
Time Reversal for Electromagnetism:Applications in Electromagnetic Compatibility
Ibrahim El Baba1,2, Sébastien Lalléchère1,2 and Pierre Bonnet1,2
1Clermont University, Blaise Pascal University, BP 10448, F-63000, Clermont-Ferrand2CNRS, UMR 6602, LASMEA, F-63177, Aubière
France
1. Introduction
ElectroMagnetic Compatibility (EMC) is the branch of electromagnetism that studiesgeneration, propagation and reception of involuntary electromagnetic energy in reference tothe undesirable effect (electromagnetic interference) that this energy can induce. Since 1996,date of the directive 89/336/CEE (Directive 89/336/CEE, 1989) compulsory implementationconcerning the electromagnetic compatibility (called CE) in Europe, and for much longer inUnited States, EMC has been playing an increasingly important role.
Most electrical and electronic equipment may be considered as sources of interference becauseit generates electromagnetic perturbations that pollute the environment and may disruptthe operation of other equipment (victims). The EMC is the ability of a device, equipmentor system to operate satisfactorily within its electromagnetic environment and withoutproducing itself an intolerable electromagnetic disturbance to anything in this environment.EMC hence controls the electromagnetic environment of the electronic equipment. To thisend, EMC tackles several issues. Firstly, are the emission problems related to the generationof unwanted electromagnetic energy from a source and the measures that should be takento reduce the generation of such disturbances and to prevent the escape of any remainingenergy to the external environment. To verify that the perturbation level does not exceeda threshold value defined by standards, we measure the electric and/or magnetic fieldsradiated at a certain distance in the case of electromagnetic emissions, the voltage and/orcurrent in the case of conducted disturbances. Secondly the susceptibility problems referto the proper functioning of electrical equipment in presence of unplanned electromagneticfield. In the tests, we inject perturbation (conducting/radiating mode) on a device andcheck its good operation. Thirdly, for interference/noise disturbances, the EMC solutions aremainly obtained by addressing both the emissions and the vulnerability problems. This meansminimizing the interference source levels and hardening the potential victims (shielding forexample).
For measurements, EMC provides as test facilities different tools, the most popular are:the Anechoic Chamber (AC) (Emerson, 1973) and the Mode Stirred Reverberation Chamber(MSRC) (Corona et al., 2002; Hill, 1998). The AC is a cavity whose aim is to simulate thefree space. Its walls are covered with ferrite tiles and/or polyurethane pyramids loadedwith carbon absorbing electromagnetic waves and preventing their reflection. The secondtool has grown in popularity over the past twenty years due to its ability to provide a
8
www.intechopen.com

2 Will-be-set-by-IN-TECH
statistically uniform and homogeneous electromagnetic field on a relatively large domain(called Working Volume: WV). In addition, high field’s levels could be generated in theReverberation Chamber (RC) for relatively low injected power. For mechanical stirring,the "statistical" uniformity is mainly based on the number N of the available independentconfigurations (i.e. the number N of the stirrer independent positions) for the RC and thestudied frequency. When the number N tends to infinity, the intern electromagnetic fieldproprieties are statistically identical from one point to another in the WV. A statisticallyuniform and homogeneous distribution of the field in the MSRC signifies that the same energyattacks the Equipment Under Test (EUT) from all directions and with the same polarization,when averaged over the number N of the stirrer positions. A disadvantage of the AC is thehigh injected power needed, thus powerful amplifier are required, in addition to the high costof the absorbers. In comparison with the AC case, low power in MSRC is needed.
Based on the principle of reciprocity, Time Reversal (TR) is a technique that allows focusinga field in time and space. Recently, it has been applied for EMC where better results havebeen reported in strongly reverberant or diffracting environments. Indeed, different studies(de Rosny, 2000; Moussa et al., 2009b) in acoustics and electromagnetics have verified how RCcan provide an appropriate environment for TR. One of the main advantages of the MSRC is toprovide the most critical illumination of the EUT. Paradoxically, this benefit may be consideredas a disadvantage, since in this case it becomes impossible to know precisely the characteristicsof the electromagnetic excitation. On the one hand, recent TR studies (Cozza & Moussa, 2009;Moussa et al., 2009a) have demonstrated how to make benefit of the re-focusing to control thewave incidence and polarization attacking the EUT. On the other hand, for the same inputpower, the TR enables to increase the achievable field levels in the MSRC. These promisingapplications of TR justify its characterization in MSRC.
During susceptibility tests of electronic equipments a problem may occur when the EUT iscomposed of several components with different field/current threshold values that cannot beexceeded. Indeed, various immunity levels can coexist on an electronic device (power supply,components, signal integrity, etc.) or on different zones of a complex structure (automobile,aircraft, etc.) since the expected reliability might be different from an area or device toanother. But, in a classical susceptibility EMC MSRC test, the illumination is statistically thesame for the whole EUT placed in the working volume and it may damage components thathave a smaller threshold value than the incident field. A solution consists in performingthe susceptibility test independently for each component. Unfortunately, "on table" tests arenot always possible and also might not represent the reality. An alternative approach can begiven via TR technique and selective focusing. As a matter of fact, at the focusing time, onlyone component can be illuminated by a desired field level while others parts of the system areaggressed by lower noise.
In this chapter, after presenting TR basis and theoretical principles, characteristic parametersof TR are numerically studied in free space and reverberating environment before introducingan original way for performing impulsive susceptibility testing.
2. Time reversal basis
2.1 Preamble
Originally developed in acoustics (Fink, 1992) by Mathias Fink team in the early 1990at the ESPCI (Ecole Supérieure de Physique et de Chimie Industrielles) in Paris, TR is
178 Trends in Electromagnetism – From Fundamentals to Applications
www.intechopen.com

Time Reversal for Electromagnetism: Applications in Electromagnetic Compatibility 3
a physical process that is based on the principle of reciprocity. This technique allowsa wave to propagate backward to its source. This retro-propagation is based on thereversibility of the wave equation in time. One of the results is to offer the possibility tofocus a given wave both in time and space. Many studies have been led based on theacoustic wave equation, for applications concerning the detection and selective focusing(Prada & Fink, 1994), submarine telecommunications (Edelmann, 2005), and ultrasound andmedical imaging (Quieffin, 2004) domains. More recently successful tests have been achievedin electromagnetics (de Rosny et al., 2007), mainly in telecommunications (Lerosey et al., 2004),detection and imaging (Liu et al., 2005; Maaref et al., 2008; Neyrat et al., 2008), and EMC(Davy et al., 2009; El Baba et al., 2009; 2010) fields.
(a) (b)
Fig. 1. (a) First and (b) second phase of time reversal process with a time reversal cavity.
In practice, the TR technique needs two phases. During the first (Fig. 1a), a source locatedat (R0) emits an electromagnetic pulse that spreads in the medium. The source can be eitheractive (transmission mode) or passive as a source of diffraction (in detection problems targetsor diffusers act as passive sources). The electromagnetic radiation is recorded for a periodΔt through an array of probes in reception (Ri) surrounding the source into a closed entityand forming a Time Reversal Cavity (TRC). Indeed, the data that arrive first in time travels ashorter distance than the data that arrive later. During the second phase (Fig. 1b), each proberetransmits its received signal in reversed time order, so the data that travel a longer distanceare emitted earlier and the data that travel a shorter distance are emitted later (Last In FirstOut). Consequently, a returned wave propagates and acts as if it relives exactly its past lifeand this leads to a temporal and spatial focusing of the field at the original source location(R0) where the focusing moment is considered as the time origin.
Unfortunately, from an experimental point of view and because of the large number of probesrequired for such operation, the TRC is not feasible. That’s why classical TR experimentsare conducted through a limited opening array forming the Time Reversal Mirror (TRM)(de Rosny & Fink, 2002).
In the case of a TRM, the focusing protocol by TR remains the same as in the TRC case (Fig. 2).The decrease in the angular aperture allows the convenient realization of such a mirror, butin the reemission step (Fig. 2b) only a part of the wave is time reversed leading to a loss ofinformation reducing the focusing quality.
179Time Reversal for Electromagnetism: Applications in Electromagnetic Compatibility
www.intechopen.com

4 Will-be-set-by-IN-TECH
(a) (b)
Fig. 2. (a) First and (b) second phase of time reversal process with a time reversal mirror.
This loss of information can be partially avoided if the scene takes place in a reverberant cavity.Different studies have shown that, in the case of a reverberant environment, the probe arraycan be replaced by a single probe (Fig. 3). Therefore, the first experiments in electromagnetismwere realized in a RC. The properties of the cavity allow us to benefit from the differentreflections suffered by the wave on the metal walls of the chamber, which ensures that a singleprobe collecting these echoes is sufficient to record necessary information for TR experiment.
Fig. 3. TRM can be replaced by a single probe in a reverberant cavity.
2.2 Time reversal of electromagnetic waves
A propagation medium is called reversible if a field and its time reversed versioncan propagate in such an environment, i.e., if Φ(t) and Φ(−t) are solutions of thesame propagation equation. In electromagnetism, the wave equation in a uniform andnon-dissipative medium is given by
1c2
∂2Φ
∂t2 = ΔΦ (1)
where Φ stands for the electric E or magnetic H field, and c is the propagation celerity of theelectromagnetic waves in the medium.
Assuming that Φ0(t) is a solution of (1), the absence of first time derivative in the left-handside leads to the existence of another solution chronologically reversed Φ1(t) = Φ0(−t).
180 Trends in Electromagnetism – From Fundamentals to Applications
www.intechopen.com
Time Reversal for Electromagnetism: Applications in Electromagnetic Compatibility 5
Therefore (1) is invariant under the TR action, and theoretically, an electromagnetic scene maybe replayed in reverse from time t = Δt to t = 0s.
Defining the electric field estimated at the position r (given by TRM or TRC devices) and timet by E(r, t), the TR data are first recorded during the experiment time T = Δt. Then, fields arereturned and reemitted following a reverse chronology, for example, an electric field E(r, t) isretransmitted during the reversal phase as E(r, T − t), t ∈ [0; T].
An electromagnetic wave is described by four field vectors, the electric field E, the magneticfield H, the electric induction D, and the magnetic induction B. It has been shown in (Jackson,1998) that E and D are even vectors; however H and B are odd pseudovectors under thetime reversal action. Therefore if we consider TTR the time inversion operator given byTTR Φ(r, t) = Φ(r,−t), we can write
TTR E(r, t) = E(r,−t); TTR D(r, t) = D(r,−t);TTR H(r, t) = −H(r,−t); TTR B(r, t) = −B(r,−t).
(2)
3. Theoretical principles
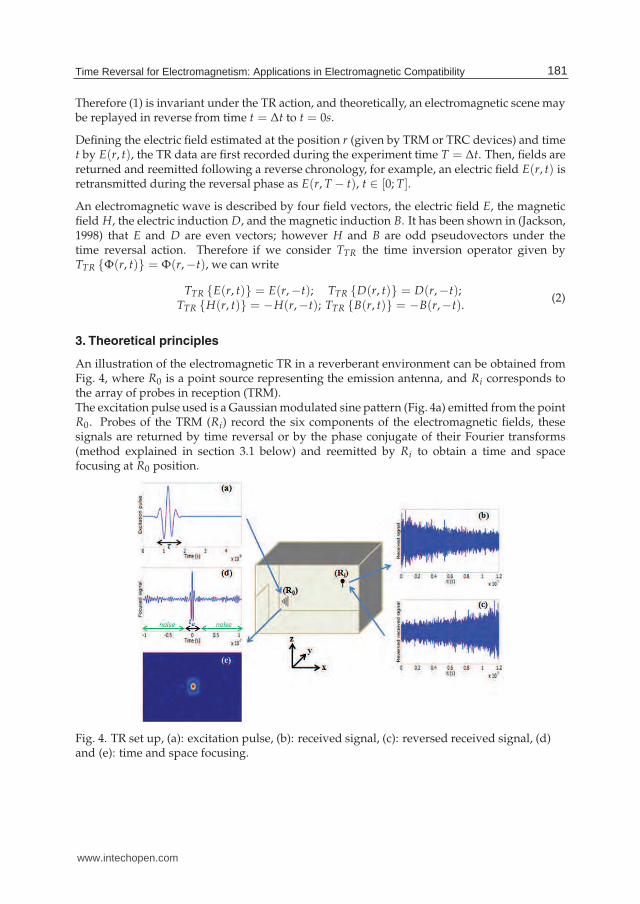
An illustration of the electromagnetic TR in a reverberant environment can be obtained fromFig. 4, where R0 is a point source representing the emission antenna, and Ri corresponds tothe array of probes in reception (TRM).The excitation pulse used is a Gaussian modulated sine pattern (Fig. 4a) emitted from the pointR0. Probes of the TRM (Ri) record the six components of the electromagnetic fields, thesesignals are returned by time reversal or by the phase conjugate of their Fourier transforms(method explained in section 3.1 below) and reemitted by Ri to obtain a time and spacefocusing at R0 position.
Fig. 4. TR set up, (a): excitation pulse, (b): received signal, (c): reversed received signal, (d)and (e): time and space focusing.
181Time Reversal for Electromagnetism: Applications in Electromagnetic Compatibility
www.intechopen.com

6 Will-be-set-by-IN-TECH
3.1 Time reversal and phase conjugate
Let Φ(r, ω) the Fourier transform of the field Φ(r, t). It was verified that time reversinga signal corresponds to the inverse Fourier transform (FTinv) of the phase conjugate of itsFourier transform
TTR Φ (r, t) = Φ(r,−t) = FTinvΦ∗ (r, ω) (3)
In Fig. 5a we plot the evolution of a signal with respect to time, and in Fig. 5b we verify thatwe can reverse a signal in time indifferently by the phase conjugate of its Fourier transform orby time reversal.
0 10 20 30 40 50 60
−1
−0.8
−0.6
−0.4
−0.2
0
0.2
0.4
0.6
0.8
1
Time (ns)
Φ(t
)
(a)
0 10 20 30 40 50 60
−1
−0.8
−0.6
−0.4
−0.2
0
0.2
0.4
0.6
0.8
1
Time (ns)
Φ(−
t)
(b)
Fig. 5. (a) Temporal signal Φ(t). (b) Φ(−t) by time reversal (plain blue curve) and by inverseFourier transform of its phase conjugate (red markers).
3.2 Mathematical foundation
The received signal (Fig. 4b) by a TRM probe (following a pulse x(t) (Fig. 4a) emitted fromR0) can be written
yi(t) = k(t, R0 → Ri)⊗ x(t) (4)
where ⊗ is the convolution product, and 1 ≤ i ≤ M with M the number of probes of the TRM,and k(t, R0 → Ri) is the impulse response of the medium at a point Ri for a pulse emitted fromR0. After time reversal of yi(t) (Fig. 4c) and the reemission from Ri, the focused signal on R0(Fig. 4d) can be written as follows:
ETR(t, R0) =M
∑i=1
k(t, Ri → R0)⊗ yi(−t) =M
∑i=1
k(t, Ri → R0)⊗ k(−t, R0 → Ri)⊗ x(−t) (5)
The advantage of working in the frequency domain is to replace the convolution product byan ordinary product. Since reversing a signal versus time corresponds to the phase conjugateof its Fourier transform, the above equation (5) takes the following form in the frequencydomain
ETR(ω, R0) =M
∑i=1
k(ω, Ri → R0).k∗(ω, R0 → Ri).x
∗(ω) (6)
Switching into matrix notation, (6) takes the following form
ETR(ω, R0) = K(ω, Ri → R0).K∗(ω, R0 → Ri).x
∗(ω) (7)
182 Trends in Electromagnetism – From Fundamentals to Applications
www.intechopen.com

Time Reversal for Electromagnetism: Applications in Electromagnetic Compatibility 7
Now, if the medium is reversible, thanks to the reciprocity theorem, the position of a pointsource and a probe can be reversed without altering the field. Consequently, the impulseresponse from R0 to Ri is equal to the one from Ri to R0, and therefore the matrix K(ω, R0 →Ri) is equal to the matrix K(ω, Ri → R0), in other words the matrix K is symmetric. In (7),the propagation matrix K is the Fourier transform of different impulse responses between onetransmitter and M receivers.
3.3 Time reversal operator
One can build the so-called Time Reversal Operator (TRO) by considering the case wherewe have M × M transmitter receivers. The M transmitters emit successively M pulsesxi(t)(i = 1, ..., M) that can be described in the frequency domain by a vector X containingM components for each frequency. The M components given by the receivers can be writtenby a matrix product KX. When signals are reversed (phase conjugate in the frequency domain)and retransmitted, the resulting vector is KtK∗X∗, with K the M × M propagation matrix andKt its matrix transpose. Therefore (7) can be written
Foc(ω) = Kt(ω)K∗(ω)X∗(ω) (8)
with Foc the vector containing the M focused signals for each frequency. It is interesting tonote that T(ω) = Kh(ω)K(ω), defined as the TRO (Derode et al., 2003), is a symmetricalsquare matrix where h is the Hermitian conjugate (conjugate-transpose). By performing asingular value decomposition of the propagation matrix we get K(ω) = U(ω)Λ(ω)Vt(ω),where U and V are unitary matrices and Λ is a diagonal matrix whose elements are thesingular values Λi. On the other hand, the eigenvalue decomposition of the TRO givesT(ω) = V(ω)S(ω)Vt(ω), with S(ω) = Λt(ω)Λ(ω) the diagonal matrix of eigenvalues thatare the propagation matrix singular values square, and V the unit matrix of eigenvectors. Thisdecomposition of the TRO gives us information on the propagation medium. In the detectionfield, Decomposition of the Time Reversal Operator (DORT) (Yavuz & Teixeira, 2006) providesinformation on the diffraction strength of the target via the eigenvalues and information onthe position via the eigenvector of the TRO.
4. Definitions, numerical methodologies and outputs
In this study, TR is applied in a numerical way in order to facilitate its characterization indifferent configurations. From a practical point of view, it is easier to carry out a parametricstudy numerically than experimentally. For instance, a numerical study offers the flexibilityto choose between a TRC and a TRM, to vary the number of probes, their positions in manytest cases, etc. The proposed methodology needs to gather from the TR principles and MSRCstudies. This is why the chosen method must take into account the characteristics of eachdomain. Indeed, it is important to consider all elements present in the experimental RCdevice: cavity, stirrer, equipment (Corona et al., 2002). From a numerical point of view,the influence of the metallic elements must be considered in time simulation. Consequently,the fields temporal distribution must be numerically implemented with special care given tometal facets (i.e., considered as Perfect Electric Conductor, PEC). For all the above reasons, thenumerical simulations were carried out using an own-made Finite Difference Time Domain(FDTD) electromagnetic code (Bonnet et al., 2005) with E / H formulation and later for morecomplex cases the commercial software CST MICROWAVE STUDIO without neglectingthe fact that we can use any numerical tool that solves Maxwell’s equations.
183Time Reversal for Electromagnetism: Applications in Electromagnetic Compatibility
www.intechopen.com

8 Will-be-set-by-IN-TECH
4.1 Focusing quality
To characterize time and space focusing after the TR process, we will define multiple criteriaand parameters.
4.1.1 Maximum magnitude of focusing
The first idea about the quality of focusing is obtained by considering the useful part of thereconstructed signal (see duration τu, Fig. 4d) and implementing the absolute maximum ofthe focused signal.
Max (R0) = maxt∈τu(|ETR(t, R0)|) (9)
4.1.2 Focal spot
The second criterion characterizing spatial focusing around R0 is the focal spot dimension(δ) which is described in two dimensions by distance along the x and y directions for whichthe total electric field focused at time t = 0 (which is the focusing time) is between ETR(R0)and ETR(R0)/2 (in other words where ETR(R0)/Max (R0) belongs to [−6 dB; 0 dB]). TheFig. 6 illustrates this criterion in two dimensions (2-D), the principle can be extended to threedimensions (3-D). According to Fig. 6, we may write
Fig. 6. Definition of the focal spot around the focusing point.
δx = ux2 − ux1δy = uy2 − uy1
(10)
where ux1, ux2, uy1, and uy2 are the positions of both sides of R0 at the focusing time (t = 0)along x and y directions. Note that the width of the focal spot in a reverberating environment,depending on the diffraction limit, is about λ/2 where λ is the wavelength corresponding tothe frequency of the excitation pulse. On the other hand, in free space the focal spot is givenby the following formula
δ =λF
D(11)
with F the distance between the focusing point (R0) and the TRM (Ri), and D the size of theTRM.
184 Trends in Electromagnetism – From Fundamentals to Applications
www.intechopen.com
Time Reversal for Electromagnetism: Applications in Electromagnetic Compatibility 9
4.1.3 Signal to noise ratio
An important criterion to characterize focusing in a reverberation chamber is the Signal ToNoise (STN) ratio, which was theoretically introduced in (de Rosny, 2000) as follows:
STN ∼= 4√
πΔHΔΩ
〈α〉4
〈α2〉2 +ΔHΔt
(12)
where we have: ΔΩ, the frequency bandwidth of the excitation pulse; α, the ensembleaverage of the eigenmodes magnitude of the chamber; ΔH, the Heisenberg’s time given bythe following formula
ΔH = 2πn(ω) (13)
with n(ω), the average modal density of the reverberation chamber assumed constant overthe entire bandwidth ΔΩ.
Numerically, this ratio can be calculated from the temporally focused signal in R0, and it isknown as the temporal STN ratio (STNt) which is the ratio between the squared magnitude ofthe focused signal peak (Fig. 4d, t = 0) and the temporal noise around the peak. It is definedas the square of the focused field RMS on a part of the simulation time apart the useful signal(Fig. 4d, t /∈ τu).
The ratio is given by
STNt =〈ETR (r = R0, t = 0)〉2⟨
E2TR (r = R0, t /∈ τu)
⟩ (14)
where ETR(R0, t) represents the focused total electric field in R0.
Similarly to (14), we can also calculate the spatial STN ratio (STNs) which is the ratio of thesquared magnitude of the focused signal peak in R0 on the square of the field RMS valuecalculated over the rest of the studied domain at the focusing time (t = 0), this one can beconsidered as "spatial noise". So we have
STNs =〈ETR (r = R0, t = 0)〉2⟨
E2TR (r = R0, t = 0)
⟩ (15)
It has been proved in (Moussa et al., 2009a) that for whole averages and as RC are ergodicsystems, temporal STN ratio is equivalent to spatial one. In what follows, for the sake ofsimplicity, both temporal and spatial signal to noise ratios are denoted STN.
4.1.4 Delay spread
To characterize the temporal focusing (and linked to spatial aspects) in reverberation chamber,the delay spread parameter is defined as in (Ziadé et al., 2008). Indeed, the impulse responseshown in Fig. 4b shows that a pulse emitted from a source will be received as a series ofpulses (with different arrival times). This parameter stands for time separating last echoand straightforward way. The root mean square of the delay spread parameter (linking thestandard deviation of time with the mean value) can be written for the E fields by
τRMS =
√
√
√
√
∫
(τ − τm)2 |ETR(r, τ)|2 dτ∫
|ETR(r, τ)|2 dτ(16)
185Time Reversal for Electromagnetism: Applications in Electromagnetic Compatibility
www.intechopen.com

10 Will-be-set-by-IN-TECH
with τm: mean value of E delays. Electric fields ETR are given at location r and time τ. Thus,the average delay τm is given by
τm =
∫
τ |ETR(r, τ)|2 dτ∫
|ETR(r, τ)|2 dτ. (17)
4.2 FDTD method for time reversal
In the FDTD method, Maxwell’s equations are discretized following the Yee algorithm (Yee,1966), these equations are invariant to time reversal transformation (Jackson, 1998). For moresimplicity, we will consider here a 2-D formulation; the 3-D case can be straightforwardextended by simple modifications. In the FDTD method, electric and magnetic fields arecalculated by an explicit "leapfrog" scheme for time intervals separated by a half time step,in other words from the electric field at time t = n − 1/2 and the magnetic field at time t = n,the electric field at time t = n + 1/2 is calculated as we can see in the discretized Maxwell’sequation below (18) (2-D TM mode)
En+ 1
2z
(
i +12
, j +12
)
=2ǫ − σdt
2ǫ + σdtE
n− 12
z
(
i +12
, j +12
)
+2dt
2ǫ + σdt×
⎡
⎣
Hny
(
i + 1, j + 12
)
− Hny
(
i, j + 12
)
dx−
Hnx
(
i + 12 , j + 1
)
− Hnx
(
i + 12 , j
)
dy
⎤
(18)
where dx, dy and dz are the space steps in Cartesian directions (Ox), (Oy), and (Oz), while dtis the time step. σ and ǫ represent conductivity and permittivity of the medium.
Regarding time reversal, we need to reverse the calculation sequence. In fact, the electric fieldat time t = n − 1/2 is calculated from the electric field at time t = n + 1/2 and the magneticfield at time t = n. To do that, we only need to take the discretized Maxwell’s equations andrewrite them under the desired shape (Sorrentino et al., 1993)
En− 1
2z
(
i +12
, j +12
)
=2ǫ + σdt
2ǫ − σdtE
n+ 12
z
(
i +12
, j +12
)
− 2dt
2ǫ − σdt×
⎡
⎣
Hny
(
i + 1, j + 12
)
− Hny
(
i, j + 12
)
dx−
Hnx
(
i + 12 , j + 1
)
− Hnx
(
i + 12 , j
)
dy
⎤
(19)
The above relation (19) should be applied to calculate fields at earlier moments from the laterinstants. To check the validity of this TR algorithm, consider a 2-D domain whose boundariesare simulated by PEC. An excitation point source emitting a Gaussian pulse is located in themiddle of the Computational Domain (CD). The field propagates in the domain for a timet = t1. Fig. 7a shows the distribution of the electric field Ez at time t = t1. For t > t1,time is reversed and we consider the field distribution Ez at time t = t1 (Fig. 7a) as initialcondition. After this time, and from the modified FDTD equations, we come to rebuildthe field distribution of the source and found its position (Fig. 7b). This TR algorithm waseffectively applied in (Neyrat, 2009) for buried object detection.
186 Trends in Electromagnetism – From Fundamentals to Applications
www.intechopen.com

Time Reversal for Electromagnetism: Applications in Electromagnetic Compatibility 11
(a) (b)
Fig. 7. (a) Electric field Ez distribution at time t = t1. (b) Reconstructed pulse obtained byinverse FDTD simulation.
The technique described above may only have numerical applications since fields have to berecorded for each discretisation point. In our case (applying TR in EMC), our objective is notdetection, but focusing field numerically in a given place and time, and for instance, extendingto experimental developments in further works. To avoid field registration throughout thewhole domain which should be impossible experimentally, we will focus on the techniquebriefly described on Fig. 4. In this case, the field is recorded on probes during the first phaseusing the FDTD discretization (18), and in the second it is time reversed and retransmittedwithout changing the Maxwell’s equations in the FDTD code. This alternative is the one usedin most of TR experiments and TR numerical simulations.
4.3 Numerical configurations
Already mentioned, simulations were performed using an own-made code based on theFDTD method. Two CDs were considered: the first one is a 2-D TM mode given byCD1 = 3.3 × 3.3 m2, the second is a 3-D CD2 = 2.2 × 1.5 × 1 m3 volume. The excitationsignal used for the first phase of the TR process is a Gaussian modulated sine pattern (Fig. 8a)
x(t) = E0e−(t+
z−z0c −t0ℓ
)2sin(2π fct) (20)
where E0 is the Gaussian magnitude, z0 and t0 are respectively the delays with respect tothe origins of space and time, ℓ is the mid-height width of the pulse, and fc is the centralfrequency.
The bandwidth ΔΩ of this pulse is the frequency distance (Fig. 8b) of both sides of the centralfrequency with respect to the attenuation (Att) of the maximum amplitude (the amplitudecorresponding to fc). To calculate ΔΩ, we consider successively different attenuation levels.For instance, in the case of Att = 2 (corresponding to a −6 dB decrease) we divide theamplitude corresponding to fc by 2 and calculate f2 and f1, and the bandwidth is given byΔΩ = f2 − f1.
For all FDTD simulations in this chapter, we used a Gaussian modulated at a central frequencyfc = 600 MHz and bandwidth ΔΩ = 350 MHz calculated at −6 dB. Simulations areperformed with an uniform spatial discretization dx = dy = 3.3 cm for the 2-D domain,and dx = dy = dz = 3.3 cm for the 3-D domain (corresponding to λ fc
/15, λ fc: wavelength
corresponding to the central frequency fc).
187Time Reversal for Electromagnetism: Applications in Electromagnetic Compatibility
www.intechopen.com

12 Will-be-set-by-IN-TECH
0 0.5 1 1.5 2 2.5 3 3.5 4 4.5 5
x 10−8
−1
−0.8
−0.6
−0.4
−0.2
0
0.2
0.4
0.6
0.8
1
Time (s)
No
rma
lize
d m
ag
nitu
de
(V
/m)
(a)
0 2 4 6 8 10 12
x 108
0
0.2
0.4
0.6
0.8
1
Frequency (Hz)
No
rma
lize
d m
ag
nitu
de
(V
/m)
f1
f2
ΔΩ
(b)
Fig. 8. (a) Time response of the excitation signal used for the first phase of TR and (b) itsspectrum.
5. Numerical results
In this section, we investigate the impact of various parameters on the TR process. These willbe studied initially in free space, then we will see how the complexity of the environmentcan improve the focusing quality, and finally we will check how reverberant media are idealenvironments to work with TR.
5.1 Preliminary study in free space
The first numerical example treated helps to qualify focusing relatively to the number ofprobes in the TRC. For this, we consider the 2-D CD1 domain (Fig. 9) where the excitationsource is located in the middle of the area and a TRC composed of 320 probes completelysurrounding the point source. Free space is simulated by Mur absorbing boundary conditions(Mur, 1981).
Fig. 9. CD1 domain: (0) absorbing conditions, (1) source R0, (2) TRC probes Ri.
A 7 ns pulse (Fig. 8a) is emitted from the point source and the TRC probes record the evolutionof the electric field component Ez and the magnetic field components Hx and Hy (TM mode).After time reversal and reemission of the recorded signals by the TRC probes, we can findthe position of the excitation source as shown in the spatio-temporal evolution of the absolutevalue of the electric field Ez on Fig. 10.
The returned excitation signals x(−t) and the normalized temporal focusing signal ETR atthe point source are plotted on Fig. 11a. The original shape of the excitation signal and theposition of the emission point are observed (here it is an active source but it can also be adiffracting object).
188 Trends in Electromagnetism – From Fundamentals to Applications
www.intechopen.com

Time Reversal for Electromagnetism: Applications in Electromagnetic Compatibility 13
(a) t = −1.47ns (b) t = −0.29ns
(c) t = 0 (d) t = +2.12ns
Fig. 10. Electric field spatio-temporal evolution around focusing point (focusing time set astime origin).
−2.5 −2 −1.5 −1 −0.5 0 0.5 1 1.5 2 2.5
x 10−8
−1
−0.8
−0.6
−0.4
−0.2
0
0.2
0.4
0.6
0.8
1
Time (s)
No
rma
lize
d m
ag
nitu
de
(V
/m)
x(−t)
ETR
(t, R0)
(a) (b)
Fig. 11. (a) Temporal and (b) spatial focus on the point source at focusing time (t = 0).
The number of probes used in the previous example (320 probes) is the maximum numberallowed by the used FDTD discretization. In Fig. 12a, curves (1), (2) and (3) demonstratethe importance of the probes number in the TRC on the maximum magnitude of focusingcriterion. In addition, we note (Fig. 12b) that this criterion increases linearly with the numberof probes.
For a 3-D domain (CD2), two cases were treated. The first one deals with an excitationemitted by the point source along the three components of the electric field Ex, Ey and Ez, andthe second one only Ex component is considered. The Fig. 13 shows the treated numericalconfiguration where the excitation point is in the middle of the CD2 (Cartesian coordinates(0, 0, 0) which corresponds to the mesh (34, 23, 15), and the TRC is composed of 6114 probescorresponding to the maximum number allowed by the used FDTD discretization.
189Time Reversal for Electromagnetism: Applications in Electromagnetic Compatibility
www.intechopen.com

14 Will-be-set-by-IN-TECH
−2.5 −2 −1.5 −1 −0.5 0 0.5 1 1.5 2 2.5
x 10−8
−0.5
−0.4
−0.3
−0.2
−0.1
0
0.1
0.2
0.3
0.4
0.5
Time (s)
Ma
gn
itu
de
(V
/m)
(1) TRC (320 probes)
(2) TRC (162 probes)
(3) TRC (82 probes)
(a)
0 50 100 150 200 250 300 3500
0.05
0.1
0.15
0.2
0.25
0.3
0.35
0.4
0.45
0.5
TRC probes number
Ma
xim
um
ma
gn
itu
de
of
focu
sin
g (
V/m
)
(b)
Fig. 12. (a) Focused signals (ETR(t, R0)) for different number of probes uniformly distributedon the TRC. (b) Maximum magnitude of focusing criterion with respect to the TRC probesnumber.
Fig. 13. CD2 domain: (0) absorbing conditions, (1) source R0, (2) TRC.
In the first case, we can see that the focused signal after TR is along the three polarizationsx, y and z (Fig. 14a), and we can focus on the spatial distribution of the total electric field atfocusing time (Fig. 14b) where an energy concentration appears around the point source.
−2.5 −2 −1.5 −1 −0.5 0 0.5 1 1.5 2 2.5
x 10−8
−0.1
−0.05
0
0.05
0.1
Time (s)
Ma
gn
itu
de
(V
/m)
ETRx
(t, R0)
ETRy
(t, R0)
ETRz
(t, R0)
(a) (b)
Fig. 14. (a) Time focusing for emitted excitation along Ex, Ey, and Ez. (b) Total electric fieldcartography at focusing time (t = 0).
In the second case (where the excitation is along Ex), we see that the electric field is focusedonly along the x component (Fig. 15) and this can be verified if we extract E-field over aplan corresponding to z = 0 and we look to the field cartography at focusing time for allpolarizations (Fig. 16). We clearly note that the electric field corresponding to Ey and Ez isalmost zero compared to Ex.
190 Trends in Electromagnetism – From Fundamentals to Applications
www.intechopen.com

Time Reversal for Electromagnetism: Applications in Electromagnetic Compatibility 15
−2.5 −2 −1.5 −1 −0.5 0 0.5 1 1.5 2 2.5
x 10−8
−0.1
−0.08
−0.06
−0.04
−0.02
0
0.02
0.04
0.06
0.08
0.1
Time (s)M
ag
nitu
de
(V
/m)
ETRx
(t, R0)
ETRy
(t, R0)
ETRz
(t, R0)
Fig. 15. Time focusing for excitation emitted along Ex.
−0.6
−0.4
−0.2
0
0.2
0.4
0.6
−1 −0.8 −0.6 −0.4 −0.2 0 0.2 0.4 0.6 0.8 1
y (
m)
x (m)
−0.08
−0.06
−0.04
−0.02
0
0.02
0.04
0.06
0.08
(a)
−0.6
−0.4
−0.2
0
0.2
0.4
0.6
−1 −0.8 −0.6 −0.4 −0.2 0 0.2 0.4 0.6 0.8 1
y (
m)
x (m)
−0.08
−0.06
−0.04
−0.02
0
0.02
0.04
0.06
0.08
(b)
−0.6
−0.4
−0.2
0
0.2
0.4
0.6
−1 −0.8 −0.6 −0.4 −0.2 0 0.2 0.4 0.6 0.8 1
y (
m)
x (m)
−0.08
−0.06
−0.04
−0.02
0
0.02
0.04
0.06
0.08
(c)
Fig. 16. E-field slice plan corresponding to (a) Ex, (b) Ey, and (c) Ez components at thefocusing time (t = 0).
We deduce that it is theoretically possible to control the polarization of the wave attackingthe EUT without changing the antenna polarization. This application can be very interestingespecially in a reverberant environment, as we shall see later in this chapter.
Given the huge number of probes needed for the TRC and the inability to achieve such anexperimental configuration, in the following simulations TRC is replaced by a TRM withlimited opening (Fig. 17).
(a) (b)
Fig. 17. (a) CD1 and (b) CD2 domains: (0) absorbing conditions, (1) source R0, (2) TRMprobes Ri.
The previous simulations are repeated with a TRM of 41 probes for 2-D domain and 54 probesfor 3-D domain, comparing temporal focusing (Figs. 18a, 19a) with those obtained with aTRC (Figs. 12a, 14a), we note that the maximum magnitude of focusing is greatly reduced.Moreover we note a spatial focusing damage. The Figs. 18b and 19b show that focusing is ofweaker quality comparatively to TRC cases (Figs.11b, 14b).
So, unlike the previous case, recording fields on one side of the domain can not reconstructthe exact propagation of the wave as it spread, from the fact that the information is reduced
191Time Reversal for Electromagnetism: Applications in Electromagnetic Compatibility
www.intechopen.com

16 Will-be-set-by-IN-TECH
−2.5 −2 −1.5 −1 −0.5 0 0.5 1 1.5 2 2.5
x 10−8
−0.1
−0.08
−0.06
−0.04
−0.02
0
0.02
0.04
0.06
0.08
0.1
Time (s)
Ma
gn
itu
de
(V
/m)
(a) (b)
Fig. 18. CD1: (a) Temporal and (b) spatial focusing on the point source at the focusing time(t = 0) using a TRM.
−2.5 −2 −1.5 −1 −0.5 0 0.5 1 1.5 2 2.5
x 10−8
−6
−4
−2
0
2
4
6
x 10−4
Time (s)
Ma
gn
itu
de
(V
/m)
ETRx
(t,R0)
(a) (b)
Fig. 19. CD2: (a) Temporal and (b) spatial focusing on the point source at the focusing time(t = 0) for an excitation along Ex, Ey, and Ez using a TRM.
especially for 3-D. This loss of information can be solved by making the domain morecomplex, which will allow recording more information without increasing the number of TRMprobes. In the following, we will only consider the 3-D domain (CD2).
5.2 Introducing multiple reflections
To collect more information on the wave propagation in the first phase of TR, it is better toincrease the TRM angular opening or make the environment more complex. To achieve this,a metal plate modeled by PEC is added in the domain (Fig. 20).
Fig. 20. CD2 domain: (0) absorbing conditions, (1) source R0, (2) TRM probes Ri, (3) metallicplate.
192 Trends in Electromagnetism – From Fundamentals to Applications
www.intechopen.com

Time Reversal for Electromagnetism: Applications in Electromagnetic Compatibility 17
The goal here is to take advantage of reflections due to the presence of the metal plate. TheFig. 21a confirms the expectation about the presence of a diffracting object: we see that thesignal received by a probe of the TRM (component x of the electric field Ex) in a complexenvironment contains more information. Indeed, the waves due to the PEC reflectionsimprove the maximum magnitude of focusing (Fig. 21b).
0 0.5 1 1.5 2 2.5 3 3.5 4 4.5
x 10−8
−5
−4
−3
−2
−1
0
1
2
3
4
5x 10
−3
Time (s)
Ex (
V/m
)
Free space + PEC plate
Free space
(a)
−2.5 −2 −1.5 −1 −0.5 0 0.5 1 1.5 2 2.5
x 10−8
−1.5
−1
−0.5
0
0.5
1
1.5x 10
−3
Time (s)
Ma
gn
itu
de
(V
/m)
ETRx
(t,R0) : Free space + PEC plate
ERTx
(t,R0) : Free space
(b)
Fig. 21. (a) Electric field Ex received by a TRM. (b) The temporal focusing on the source pointin both cases (free space + metallic plate and free space) for an excitation along Ex, Ey, and Ez
using a TRM.
Following this idea, we can easily imagine that suitable media to apply the TR are thereverberating environments, supporting the interests of its application in the MSRC. Indeed,the multiple reflections suffered by the wave on the metal walls of the chamber will allow usto replace the TRM by a limited number of probes.
5.3 Time reversal in a reverberant environment (reverberation chamber)
In this section, the previous configuration CD2 is preserved with a 8-probes TRM andexcitations along Ex, Ey and Ez. The purpose of this part is to show the benefits of TRapplication in the MSRC across different test cases:
• the "free space" data will be compared to a reverberant environment,
• the duration of the TR window, in other words duration of the reversed signal, is studiedlooking the STN ratio and the link with the modal density of the chamber,
• intrinsic properties of the wave propagation in the cavity will be treated by focusing on therandomness of the probes location,
• and finally, we will study the influence of the excitation source parameters in terms of thefocal spot size.
5.3.1 Comparison with free space
The presence of perfectly metallic boundary conditions replacing absorbing conditionsimplies that the impulse response (Fig. 22a) received by one of the 8 probes of the TRM iscomposed of several reflections that never decrease, unlike free space case (Fig. 21a). It isimportant to note that real losses are not included in this section. As a result, the numericalenergy injected after time reversal appears comparatively higher in RC than with absorbingconditions. This improves the focusing quality in terms of maximum focusing magnitude:6.10−4 V/m with 51 probes as TRM in free space (Fig. 19a) and 0.04 V/m with a TRM of 8probes in RC (Fig. 22b).
193Time Reversal for Electromagnetism: Applications in Electromagnetic Compatibility
www.intechopen.com

18 Will-be-set-by-IN-TECH
0 0.1 0.2 0.3 0.4 0.5 0.6 0.7 0.8 0.9 1
x 10−6
−6
−4
−2
0
2
4
6
x 10−3
Time (s)
Ma
gn
itu
de
(V
/m)
(a)
−2.5 −2 −1.5 −1 −0.5 0 0.5 1 1.5 2 2.5
x 10−8
−0.05
−0.04
−0.03
−0.02
−0.01
0
0.01
0.02
0.03
0.04
0.05
Time (s)
Ma
gn
itu
de
(V
/m)
ETRx
(t, R0)
ETRy
(t, R0)
ETRz
(t, R0)
(b)
Fig. 22. (a) Electric field Ex received by a probe of the TRM in RC. (b) Temporal focusing byTR in RC.
To investigate the spatial focusing by studying the focal spot size in all directions and checkthe temporal focusing using the delay spread criterion (τRMS), we recorded the total electricfield around the focusing point along x, y and z axis. On the one hand, results given in Fig. 23ashow that focusing is symmetrical and is λ fc
/2 order (dimension of the focal spot = 0.25 m =λ fc
/2).
−1 −0.8 −0.6 −0.4 −0.2 0 0.2 0.4 0.6 0.8 10
0.2
0.4
0.6
0.8
1
Distance to the focusing point (m)
No
rma
lize
d m
ag
nitu
de
(V
/m)
along x axis
along y axis
along z axis
(a)
−1 −0.8 −0.6 −0.4 −0.2 0 0.2 0.4 0.6 0.8 1
2.5
2.6
2.7
2.8
2.9
3
3.1
3.2
3.3x 10
−8
Distance to the focusing point (m)
τR
MS (
s)
along x axis
along y axis
along z axis
(b)
Fig. 23. (a) Total electric field (ETR(r, t = 0)) and (b) delay spread (τRMS) with respect to thedistance to the focusing point.
On the other hand in Fig. 23b, the delay spread criterion is implemented. Indeed, the signalsare sent back on the principle of first wave arrived last broadcast, so that all waves arrivesimultaneously at the focusing point. The criterion τRMS measures the arrival time betweenfirst and last wave. Therefore, the smaller this parameter is over a given point in space, betterthe focusing is (in terms of agreement between time and space). For this we can see in Fig. 23bthe smallest value of τRMS (along x, y, and z axis around R0) corresponds to the point source.This means that TR has reduced the echoes and the excitation pulse was reconstructed even ifwe are in a reverberant environment.
The last studied parameter in this section is the propagation matrix K (section 3.3). This matrixcan be constructed numerically in a simple way. To do this, an array of 24 point sources(i = 1 to 24) separated by 23 cm from each other is placed on one side of the domain andthe same number of probes (j = 1 to 24) is used on the other side. We measure the 576inter-element impulse responses (kij(t)) in both free space and RC. After a Fourier transformof each kij(t), the propagation matrix K is known to the whole spectrum of the excitationpulse. For each frequency a singular value decomposition is applied. The singular values
194 Trends in Electromagnetism – From Fundamentals to Applications
www.intechopen.com

Time Reversal for Electromagnetism: Applications in Electromagnetic Compatibility 19
of K in both cases are shown in Fig. 24. Note that in the case of RC the number of singularvalues is much more representative than the free space case so the matrix K has a higherrank. For the central frequency fc = 600 MHz, we see that we have 20 singular values forthe RC case and only 5 in free space (with a −32 dB threshold relatively to the first singularvalue). Physically the number of significant singular values is approximately the number ofindependent probes whose recorded impulse responses are not correlated, which is a crucialpoint in the application of TR in a reverberant environment, as we will see later in this chapter.
(a) (b)
Fig. 24. Singular value decomposition of the propagation matrix K in (a) free space and (b)RC.
5.3.2 Influence of simulation duration
To study the influence of the reversed signal duration, in other words, the influence of thesimulation duration on the STN ratio, different numerical tests were processed by varyingthe duration Δt and conserving one probe as TRM. To see more representative average data,each simulation of the second phase of TR is repeated nine times and at each time the receivingprobe is placed in a different position of the chamber.
0 1 2 3 4 5 6
x 10−6
20
40
60
80
100
120
140
160
180
Δt (s)
ST
N
Fig. 25. STN ratio with respect to simulation duration (case 1:fc = 400 MHz/ΔΩ = 260 MHz: blue circles markers, case 2:fc = 800 MHz/ΔΩ = 260 MHz: red squares markers).
On Fig. 25, we plotted for each studied case the STN ratio, numerically calculated from (14),averaged over the nine positions of the TRM probe, with respect to the simulation duration Δt.We note that the STN ratio increases with the central frequency of the excitation signal, alsothis ratio becomes stable after a given time called Heisenberg time (ΔH). From (13), wheren(ω) is deduced numerically by counting the resonant modes in the bandwidth (see later
195Time Reversal for Electromagnetism: Applications in Electromagnetic Compatibility
www.intechopen.com

20 Will-be-set-by-IN-TECH
in this section), we obtain the Heisenberg time value. These results are verified numericallyin Fig. 25 (e.g. in case 1, the Heisenberg time value ΔH = 0.3 μs given by (13) is verifiednumerically).
3.35 3.4 3.45 3.5 3.55 3.6 3.65 3.7 3.75 3.8
x 108
0
0.2
0.4
0.6
0.8
1
1.2
Frequency (Hz)
Norm
aliz
ed m
agnitude (
V/m
)
Theoretical resonant frequencies
Received signal spectrum for Δt>>ΔH
Received signal spectrum for Δt<<ΔH
Fig. 26. Impulse response spectrum.
This behavior of STN saturation has been experimentally explained in terms of "informationgrains" and used in (de Rosny, 2000). In this model the impulse response of the systemwith 1/τ as frequency width (τ: time duration of the modulated Gaussian), can be linkedto a succession of uncorrelated information grains whose frequency width is around 1/Δt.From Fig. 26, we see that the STN saturation seems to be a consequence of the existence ofa finite number of resonant frequencies in the impulse response spectrum. Thus, for shorttime simulation durations, one information grain covers several frequencies (eigenmodes ofthe chamber). In this case, the number of information grains is equal to Δt/τ, and the STNratio increases with time. However, for longer durations, the number of information grainsthat can not be set only on the resonance frequencies stabilizes (number of information grainsis equal to 1/(τδ f ) with δ f : average distance between two successive eigenmodes); all thefrequencies of the chamber are being resolved. The STN ratio becomes independent of thesimulation duration (Fig. 25). This was predicted by the theoretical formula of STN ratio (12).
0 1 2 3 4 5 6
x 10−6
0
50
100
150
200
250
Δt (s)
Eig
enm
odes n
um
ber
Fig. 27. Eigenmodes number with respect to simulation duration (case 1:fc = 400 MHz/ΔΩ = 260 MHz: blue circles markers, case 2:fc = 800 MHz/ΔΩ = 260 MHz: red squares markers).
This ratio depends on the product ΔHΔΩ which is simply the number of eigenmodes. ThusFig. 27 illustrates this saturation phenomenon: the evolution of the eigenmodes number ofthe RC in the bandwidth ΔΩ is plotted as a function of simulation duration. The direct
196 Trends in Electromagnetism – From Fundamentals to Applications
www.intechopen.com

Time Reversal for Electromagnetism: Applications in Electromagnetic Compatibility 21
estimation of the number of resonance modes from Weyl theoretical formula (Liu et al., 1983)does not take into account the numerical characteristics of temporal simulation. As such,the eigenmodes number is defined from the mean total electric field spectrum recorded bythe nine positions of the receiving probe: numerical calculation is achieved by counting theresonance peaks in the spectrum (Fig. 27). Note that the eigenmodes number stabilizes forduration greater than the corresponding Heisenberg time, which verifies the saturation of theSTN ratio (Fig. 25).
5.3.3 Contribution of random receivers locations and number
Arnaud Derode has proved in (Derode et al., 1999) that the STN ratio increases with theroot of the number of used probes, and this is caused by the fact that each supplementaryprobe brings an additional information uncorrelated with known information. In the RC case,uncorrelated information are the eigenmodes of the chamber. To study the influence of probenumber in the TRM on the STN ratio, Various FDTD simulations are achieved for the casewhere fc = 400 MHz and ΔΩ = 260 MHz using different numbers of probes (from 1 to 20)located randomly inside the CD (except on source and PEC boundaries). In order to computemean values of outputs, each previous experiment is repeated 50 times for each number ofprobes (i.e. 50 random draws following a uniform law for 1 probe, then 50 for 2 probes, . . . ).We chose a TR window Δt = 65 ns much smaller than the corresponding Heisenberg time(ΔH = 300 ns).
The Fig. 28a shows that the maximum magnitude of focusing increases linearly withthe number of probes. Contrary to maximum output, the use of STN criterion (morerepresentative for a RC studies according to multiple reflections on PEC and thus to multiplesources) seems more relevant to characterize the quality of focusing. From the Fig. 28b (resultsobtained from the temporal STN ratio) and assuming a given number np of receiving probes(np ∼= 8 or 9), focusing may appear independent from the probes number and the STN ratiostabilizes and does not follow the root law observed in (Derode et al., 1999). Indeed, afteran increase, the STN ratio shows a level of saturation and the mean trend seems to reach alimit as a function of the probes number (from 10 to 20 probes in this case). This is due to thefact that the new probes do not provide any additional information since the eigenmodes ofthe RC are already resolved. To a weaker extent, the positions of the receiving probes needparticular care. This result may provide great interests for MSRC studies since it is far moreconvenient to repeat some measurements using less probes for a given time than multiplyingthe number of field sensors for a shorter duration. Obviously, taking advantage of multiplescattering in RC, the use of a single TR probe needs a sufficient time of experiment to provideenough information (in comparison with a multi-probes setup).
5.3.4 Spatial resolution
In EMC tests, sometimes we need to obtain a field distribution following a focal spot assmall as possible. In order to study the influence of the excitation pulse parameters in thefocal spot, we computed the normalized total electric field as a function of the distance to R0along x axis by varying the central frequency and the bandwidth of the modulated Gaussian.We note (Fig. 29) that the size of the focal spot (as defined in section 4.1.2) decreases byincreasing the central frequency and the bandwidth of the excitation pulse. Our interest is,for TR experiences in RC, to increase fc and ΔΩ to excite more resonant modes in the RC andinfluence the STN ratio quality.
197Time Reversal for Electromagnetism: Applications in Electromagnetic Compatibility
www.intechopen.com

22 Will-be-set-by-IN-TECH
0 2 4 6 8 10 12 14 16 18 200
0.005
0.01
0.015
0.02
0.025
0.03
0.035
0.04
Number of probes
Ma
xim
um
ma
gn
itu
de
of
focu
sin
g (
V/m
)
(a)
0 2 4 6 8 10 12 14 16 18 200
10
20
30
40
50
60
70
80
90
100
Number of probes
ST
N
(b)
Fig. 28. (a) Maximum magnitude of focusing. (b) STN ratio, importance of focusing from 1 to20 probes: regarding 50 random draws of probes locations each time (stars markers) andmean trend (plain line).
−30 −20 −10 0 10 20 300
0.1
0.2
0.3
0.4
0.5
0.6
0.7
0.8
0.9
1
x (cm)
No
rma
lize
d m
ag
nitu
de
(V
/m)
fc=800 MHz − ΔΩ=260 MHz
fc=600 MHz − ΔΩ=260 MHz
fc=400 MHz − ΔΩ=260 MHz
(a)
−30 −20 −10 0 10 20 300
0.1
0.2
0.3
0.4
0.5
0.6
0.7
0.8
0.9
1
x (cm)
No
rma
lize
d m
ag
nitu
de
(V
/m)
fc= 600 MHz − ΔΩ= 700 MHz
fc= 600 MHz − ΔΩ= 520 MHz
fc= 600 MHz − ΔΩ= 260 MHz
(b)
Fig. 29. Normalized total electric field as a function of the distance to R0 along x: variationsaround (a) fc and (b) ΔΩ.
In the final part of this chapter, the TR is numerically applied in the LASMEA (LAboratoiredes Sciences et Matériaux pour l’Électronique et d’Automatique, Clermont Université) MSRC(for impulsive susceptibility test and selective focusing).
6. EMC application and selective focusing
Since 2001, a MSRC has been available for the EMC research & applications of LASMEA.Its dimensions and an internal view are given on Fig. 30. Historically, studies and tests in
198 Trends in Electromagnetism – From Fundamentals to Applications
www.intechopen.com

Time Reversal for Electromagnetism: Applications in Electromagnetic Compatibility 23
the MSRC were made in the frequency domain to provide an internal volume (WV) wherethe characteristics of the electromagnetic field illuminating the EUT are given with the sameprobability. A statistically uniform and homogeneous distribution of the electromagnetic fieldin MSRC means that the same part of energy attacks the EUT from all directions and with allpolarizations (when averaged over the number of stirrer positions, i.e. over a full rotation ofit). Nevertheless, this means that the illumination is statistically the same for the whole EUT,which can be a disadvantage, especially if the reliability is not the same for all components ofthe EUT.
Fig. 30. Inner view of LASMEA MSRC (6.7 × 8.4 × 3.5 m3). Characteristics: (0) walls, (1)emitting and (2) receiving antennas, (3) field’s probe, (4) mechanical stirrer, (5) workingvolume.
The application of the TR technique allows us to bring time techniques for EMC studies inMSRC. One of these intended applications is the impulsive susceptibility test and selectivefocusing that will be considered as a solution of the problem described above. To do this,we will use the commercial software CST MICROWAVE STUDIO to numerically treat thiscase. In the next section, we will point to this software and the numerical set up used.
6.1 Numerical configuration
CST MICROWAVE STUDIO is a specialist tool for the 3-D electromagnetic simulation.Inspired by the characteristics of LASMEA MSRC, the Fig. 31 shows the configuration ofour example. Simulations are performed with a spatial discretization of 0.65 cm and 4 cmrespectively corresponding to the smallest and largest mesh, and a time step of 24.4 ps.
The walls of the MSRC are modeled with a conductivity of Sc = 1.1 106 S/m, furthermorethe stirrer has a conductivity of 2.74 107 S/m. The support table and the EUT are maderespectively of wood and aluminum (Sc = 3.56 107 S/m). In this application, we wish to focusseparately on the three components of the EUT modeled by dipoles (1, 2, and 3 in Fig. 31). Theexcitation signal is a Gaussian modulated sine pattern with a central frequency of 250 MHzand a bandwidth of 300 MHz calculated at −20 dB. The TRM is composed of two 60 cmhalf-wavelength antennas.
199Time Reversal for Electromagnetism: Applications in Electromagnetic Compatibility
www.intechopen.com

24 Will-be-set-by-IN-TECH
Fig. 31. LASMEA MSRC modeled by CST MICROWAVE STUDIO : (a) walls, (b)mechanical stirrer, (c) EUT, (1)(2)(3) EUT three components.
6.2 Preliminary study
To justify the choice of the TRM antenna number, the duration of the TR window (Δt), andthe ability to choose the polarization of the focused signal, a preliminary study is carriedout maintaining the configuration of the Fig. 31 without the table and the EUT; but, here,an isotropic probe will be used to check focusing properties. Based upon TR principles,and because the simulator does not allow exciting probes and there are not designated tobroadcast, necessary signals for the second phase of TR may be obtained directly by injectingexcitation signal straightforward on the TRM antennas one by one. The three Cartesianscomponents of these impulse responses are recorded by an isotropic field probe, and thenback propagated from the TRM. Indeed, during the first phase, the isotropic probe recordsthe electric field Eα (with α = x, y or z: Cartesian component of the field). We can choosethe polarization α of the focused signal (ETRα) from back-propagating by the TRM recordedsignal corresponding either to x, y or z without changing the polarization of the TRM antennas(Fig. 32).
−1 −0.5 0 0.5 1
x 10−7
−1
0
1
Norm
aliz
ed m
agnitude (
V/m
)
−1 −0.5 0 0.5 1
x 10−7
−1
0
1
Time (s)
−1 −0.5 0 0.5 1
x 10−7
−1
0
1
ETRx
ETRy
ETRz
Fig. 32. Polarization control of the focused signal.
200 Trends in Electromagnetism – From Fundamentals to Applications
www.intechopen.com

Time Reversal for Electromagnetism: Applications in Electromagnetic Compatibility 25
To determine the TR window duration (Δt), we need to calculate the Heisenberg time.Thus, we plotted on Fig. 33a the evolution of the STN ratio as a function of Δt for a TRMcomposed of a single antenna. Already mentioned above, we note that the STN ratiostabilizes after a certain duration, we can deduce that the Heisenberg time is about 8 μs.However an 8 μs simulation in comparison with the large dimensions of the LASMEA MSRCis disadvantageous in terms of computing time, so we chose to reduce simulation time byincreasing the TRM antenna number. Fig. 33b shows that for Δt = 0.75μs the STN ratiostabilizes for a number of antenna greater than 8.
0 0.2 0.4 0.6 0.8 1 1.2 1.4 1.6
x 10−5
20
21
22
23
24
25
26
27
28
Δt (s)
ST
N (
dB
)
(a)
0 2 4 6 8 10 12 14 16 18
18
20
22
24
26
28
Number of antennasS
TN
(d
B)
(b)
Fig. 33. STN ratio evolution: (a) as a function of the TR window for a TRM composed of 1antenna, (b) as a function of the TRM antenna number with a TR windows of Δt = 0.75 μs.
The number of antennas needed for a TR experience is given by the ratio ΔH/Δt, hence wechose the duration Δt = 4 μs with 2 antennas as TRM.
6.3 Selective focusing
In this section, we will check the possibility to focus the electric field on one of the threecomponents of the EUT, while others are aggressed by lower levels (noise). To do this, weconsider the example where the values 15 V/m, 70 V/m and 40 V/m correspond respectivelyto the three components threshold that should not be exceeded by the electric field. Afterrecording the impulse responses kij(t) with 1 ≤ i ≤ 2: number of TRM antennas and1 ≤ j ≤ 3: number of components of the EUT, and given the linearity of the system, we canfocus on any component with any desired focusing magnitude by a simple post-processing.Indeed, if for example we want to focus on the component number 2 (Figs. 34c, 34d),we will back-propagate through the first antenna of the TRM the signal pk12(−t) and thesignal pk22(−t) by the second antenna, where p is the weight corresponding to the neededamplification. The p coefficient stands for the focusing magnitude control offered by TR (thefocusing peak may be increased or decreased throughout the number of TRM antennas, theTR window duration, or an external amplification weight). We plotted in Fig. 34 temporaland spatial focusing corresponding to the "on demand" desired peak magnitude separatelyon each of the three components. The spatial focusing of the field corresponds to the absolutemaximum value recorded over the entire simulation for each cell of the slice plan).
We note that for the different cases, the maximum of the field corresponds to the desiredspatial location of each component. In addition, we note that for the second case, for example,we have focused on the component 2 (Figs. 34c, 34d) while respecting the threshold of thefirst component (component 1 was aggressed by a field whose numerical value is smaller than15 V/m), same for the third case. To achieve this desired focusing magnitude on component 2
201Time Reversal for Electromagnetism: Applications in Electromagnetic Compatibility
www.intechopen.com

26 Will-be-set-by-IN-TECH
−3 −2 −1 0 1 2 3
x 10−7
−15
−10
−5
0
5
10
15
Time (s)
Ma
gn
itu
de
(V
/m)
component 1
component 2
component 3
(a) (b)
−3 −2 −1 0 1 2 3
x 10−7
−60
−40
−20
0
20
40
60
Time(s)
Ma
gn
itu
de
(V
/m)
component 1
component 2
component 3
(c) (d)
−3 −2 −1 0 1 2 3
x 10−7
−40
−30
−20
−10
0
10
20
30
40
Time (s)
Ma
gn
itu
de
(V
/m)
component 1
component 2
component 3
(e) (f)
Fig. 34. Temporal focusing of the electric field on: (a) component 1 with p = 1, (c) component2 with p = 5, (e) component 3 with p = 3. Spatial focusing corresponding to the absolutemaximum value of the electric field: (b) component 1 with p = 1, (d) component 2 withp = 5, (f) component 3 with p = 3.
(64 V/m) smaller than the corresponding threshold (70 V/m), the impulse responses k12(−t)and k22(−t) were multiplied by the weight p = 5; so we notice that following this way we cancontrol the time, location, and magnitude of focusing (by the weight p).Finally, if we wish, for example, to focus on the first and third components with respectivemagnitude of 13 V/m and 35 V/m, we sum and back-propagate the needed impulse responses(on the first TRM antenna we back-propagate the signal p1k11(−t) + p3k13(−t) with p1 = 1and p3 = 3, on the second TRM antenna we back-propagate the signal p1k21(−t) + p3k23(−t)).The Fig. 35 justifies this approach and shows the ability of selective focusing by TR.
202 Trends in Electromagnetism – From Fundamentals to Applications
www.intechopen.com

Time Reversal for Electromagnetism: Applications in Electromagnetic Compatibility 27
(a) (b)
(c)
Fig. 35. Cutting plan (z = 1.4 m) of the absolute maximum value of the electric field obtainedon the: (a) component 1 with p = 1, (b) component 3 with p = 3, (c) two componentstogother, 1 with p = 1 and 3 with p = 3.
7. Conclusions
In this chapter, the TR method was presented in electromagnetism for applications concerningthe EMC domain in a reverberating environment. Based upon the equivalence betweenbackward propagation and reversibility of the wave equation, many TR experiments were ledsuccessfully in acoustics. In this chapter, after an introduction explaining the physical context,the theoretical principles of TR were described and illustrated numerically using the FDTDmethod. The use of the CST MICROWAVE STUDIO commercial software laid emphasis onthe industrial interest of TR for EMC test devices. First, the TR technique was applied in freespace using a TRC and a TRM, and then the importance of the complexity of the medium wasdemonstrated. Relying on intrinsic RC behavior and due to multiple reflections, the resultsobtained by applying TR in a reverberating cavity were clearly improved; the aim was toaccurately describe the influence of various parameters above focusing. Thus, a link betweenthe modal density in a cavity and the TR focusing quality was clearly established throughthe STN ratio. A particular interest relies on the number and locations of TR probes andthe excitation pulse parameters impact. Finally we introduced an original way to performan impulsive susceptibility test study based on the MSRC use. We presented the possibilityto choose the polarization of the wave aggressing the EUT, and to perform an "on demand"selective focusing. In further works, it would be interesting to experimentally confirm ournumerical results, so one may expect to proceed to experimental analysis in LASMEA MSRC.At last, considering the characteristics of EMC applications in MSRC, a closer look might beset to the advantages of TR numerical tools for innovating studies in reverberation chambers.
203Time Reversal for Electromagnetism: Applications in Electromagnetic Compatibility
www.intechopen.com

28 Will-be-set-by-IN-TECH
8. References
Bonnet, P.; Vernet, R.; Girard, S. & Paladian, F. (2005). FDTD modelling of reverberationchamber, Electronics Letters, Vol. 41, No. 20, 2005, 1101-1102, ISSN 0013-5194.
Corona, P.; Ladbury, J. & Latmiral, G. (2002). Reverberation-chamber research - thenand now: A review of early work and comparison with current understanding,IEEE Transactions on Electromagnetic Compatibility, Vol. 44, No. 1, 2002, 87-94, ISSN0018-9375.
Cozza, A. & Moussa, H. (2009). Enforcing deterministic polarization in a reverberatingenvironment, Electronics Letters, Vol. 45, No. 25, 2009, ISSN 0013-5194.
Davy, M.; de Rosny, J. & Fink, M. (2009). Focalisation et amplification d’ondesélectromagnétiques par retournement temporel dans une chambre réverbérante,Journées scientifiques d’URSI, Propagation et Télédétection, pp. 13-20, France, 2009.
de Rosny, J. (2000). Milieux réverbérants et réversibilité, PhD thesis, Paris VI - Pierre et MarieCURIE University, 2000.
de Rosny, J. & Fink, M. (2002). Overcoming the diffraction limit in wave physics using atime-reversal mirror and a novel acoustic sink, Physical Review Letters, Vol. 89, No.12, 2002, ISSN 1079-7114.
de Rosny, J.; Lerosey, G.; Tourin, A. & Fink, M. (2007). Time reversal of electromagnetic waves,Modeling and computations in electromagnetics, Springer Berlin Heidelberg, Vol. 59, 2007,187-202, ISBN 3540737774.
Derode, A.; Tourin, A. & Fink, M. (1999). Ultrasonic pulse compression with one-bit timereversal through multiple scattering, Journal of Applied Physics, Vol. 85, No. 9, 1999,6343-6352, ISSN 0021-8979.
Derode, A.; Tourin, A.; de Rosny, J.; Tanter, M.; Yon, S. & Fink, M. (2003). Taking advantageof multiple scattering to communicate with time-reversal antennas, Physical ReviewLetters, Vol. 90, No. 1, 2003, ISSN 1079-7114.
Directive 89/336/CEE (1989). Guide d’application de la Directive 89/336/CEE du Conseildu 3 mai 1989 concernant le rapprochement des législations des États membresrelatives à la compatibilité électromagnétique. URL: http : //cmrt.centrale −marseille. f r/electromagnetisme/veille/guide89336.pd f
Edelmann, G. F. (2005). An overview of time-reversal acoustic communications, Proceedings ofTICA 2005, 2005.
El Baba, I.; Lalléchère, S. & Bonnet, P. (2009). Electromagnetic time-reversal for reverberationchamber applications using FDTD, Proceedings of ACTEA 2009, InternationalConference on Advances in Computational Tools for Engineering Applications, pp. 157-167,ISBN: 978-1-4244-3833-4, Lebanon, 2009.
El Baba, I.; Patier, L., Lalléchère, S. & Bonnet, P. (2010). Numerical contribution for timereversal process in reverberation chamber, Proceedings of APS-URSI 2010, IEEEAntennas and Propagation Society International Symposium, ISBN: 978-1-4244-4967-5,Canada, 2010.
Emerson, W. (1973). Electromagnetic wave absorbers and anechoic chambers through theyears, IEEE Transactions on Antennas and Propagation, Vol. 21, No. 4, 1973, 484-490,ISSN 0018-926X.
Fink, M. (1992). Time reversal of ultrasonic fields - Part I: Basic principles, IEEE Transactionson Ultrasonics, Ferroelectrics, and Frequency Control, Vol. 39, No. 5, 1992, 555-566, ISSN0885-3010.
204 Trends in Electromagnetism – From Fundamentals to Applications
www.intechopen.com

Time Reversal for Electromagnetism: Applications in Electromagnetic Compatibility 29
Hill, D.A. (1998). Plane wave integral representation for fields in reverberation chambers,IEEE Transactions on Electromagnetic Compatibility, Vol. 40, No. 3, 1998, 209-217, ISSN0018-9375.
Jackson, J.D. (1998). Classical Electrodynamics Third Edition, John Wiley and Sons Inc, 1998.Lerosey, G.; de Rosny, J.; Tourin, A.; Derode, A.; Montaldo, G. & Fink, M. (2004). Time
reversal of electromagnetic waves, Physical Review Letters, Vol. 92, No. 19, 2004, ISSN1079-7114.
Liu, B.H & Chang, D.C (1983). Eigenmodes and the composite quality factor of a reverberatingchamber, National Bureau of Standards, USA, Technical Note, 1983.
Liu, D.; Kang, G.; Li, L.; Chen, Y.; Vasudevan, S.; Joines, W.; Liu, Q.H.; Krolik, J. & Carin, L.(2005). Electromagnetic time-reversal imaging of a target in a cluttered environment,IEEE Transactions on Antennas and Propagation, Vol. 53, No. 9, 2005, 3058-3066, ISSN0018-926X.
Maaref, N.; Millot, P. & Ferrières, X. (2008). Electromagnetic imaging method based ontime reversal processing applied to through-the-wall target localization, Progress InElectromagnetics Research M, Vol. 1, 2008, 59-67, ISSN 1937-8726.
Moussa, H.; Cozza, A. & Cauterman, M. (2009a). A novel way of using reverberation chambersthrough time-reversal, Proceedings of ESA 2009, ESA Workshop on Aerospace EMC, Italy,2009.
Moussa, H.; Cozza, A. & Cauterman, M. (2009b). Directive wavefronts inside a time reversalelectromagnetic chamber, Proceedings of EMC 2009, IEEE International Symposium onElectromagnetic Compatibility, pp. 159-164, ISBN: 978-1-4244-4266-9, USA, 2009.
Mur, G. (1981). Absorbing boundary conditions for the finite-difference approximation ofthe time-domain electromagnetic-field equations, IEEE Transactions on ElectromagneticCompatibility, Vol. EMC-23, No. 4, 1981, 377-382, ISSN 0018-9375.
Neyrat, M.; Guiffaut, C. & Reineix, A. (2008). Reverse time migration algorithm for detectionof buried objects in time domain, Proceedings of APS 2008, IEEE Antennas andPropagation Society International symposium, ISBN: 978-1-4244-2041-4, USA, 2008.
Neyrat, M. (2009). Contribution à l’étude de G.P.R. (Ground Penetrating Radar) multicapteurs.Méthodes directes et inverses en temporel, PhD thesis, Limoges University, 2009.
Prada, C. & Fink, M. (1994). Eigenmodes of the time reversal operator: A solution to selectivefocusing in multiple-target media, Wave Motion, Elsevier, Kidlington, Vol. 20, No. 2,1994, 151-163, ISSN 0165-2125.
Quieffin, N. (2004). Etude du rayonnement acoustique de structures solides : vers un systèmed’imagerie haute résolution, PhD thesis, Paris VI - Pierre et Marie CURIE University,2004.
Sorrentino, R.; Roselli, L. & Mezzanotte, P. (1993). Time reversal in finite difference timedomain method, IEEE Microwave and Guided Wave Letters, Vol. 3, No. 11, 1993, 402-404,ISSN 1051-8207.
Yavuz, M. & Teixeira, F. (2006). Full time-domain DORT for ultrawideband electromagneticfields in dispersive, random inhomogeneous media, IEEE Transactions on Antennasand Propagations, Vol. 54, No. 8, 2006, 2305-2315, ISSN 0018-926X.
Yee, K. S. (1966). Numerical solution of initial boundary value problems involving Maxwell’sequations in isotropic media, IEEE Transactions on Antennas and Propagation, Vol.Ap-14, No. 3, 1966, 302-307, ISSN 0018-926X.
205Time Reversal for Electromagnetism: Applications in Electromagnetic Compatibility
www.intechopen.com

30 Will-be-set-by-IN-TECH
Ziadé, Y.; Wong, M. & Wiart, J. (2008). Reverberation chamber and indoor measurementsfor time reversal application, Proceedings of APS 2008, IEEE Antennas and PropagationSociety International Symposium, ISBN: 978-1-4244-2041-4, USA, 2008.
206 Trends in Electromagnetism – From Fundamentals to Applications
www.intechopen.com

Trends in Electromagnetism - From Fundamentals to ApplicationsEdited by Dr. Victor Barsan
ISBN 978-953-51-0267-0Hard cover, 290 pagesPublisher InTechPublished online 23, March, 2012Published in print edition March, 2012
InTech EuropeUniversity Campus STeP Ri Slavka Krautzeka 83/A 51000 Rijeka, Croatia Phone: +385 (51) 770 447 Fax: +385 (51) 686 166www.intechopen.com
InTech ChinaUnit 405, Office Block, Hotel Equatorial Shanghai No.65, Yan An Road (West), Shanghai, 200040, China
Phone: +86-21-62489820 Fax: +86-21-62489821
Among the branches of classical physics, electromagnetism is the domain which experiences the mostspectacular development, both in its fundamental and practical aspects. The quantum corrections whichgenerate non-linear terms of the standard Maxwell equations, their specific form in curved spaces, whosepredictions can be confronted with the cosmic polarization rotation, or the topological model ofelectromagnetism, constructed with electromagnetic knots, are significant examples of recent theoreticaldevelopments. The similarities of the Sturm-Liouville problems in electromagnetism and quantum mechanicsmake possible deep analogies between the wave propagation in waveguides, ballistic electron movement inmesoscopic conductors and light propagation on optical fibers, facilitating a better understanding of thesetopics and fostering the transfer of techniques and results from one domain to another. Industrial applications,like magnetic refrigeration at room temperature or use of metamaterials for antenna couplers and covers, areof utmost practical interest. So, this book offers an interesting and useful reading for a broad category ofspecialists.
How to referenceIn order to correctly reference this scholarly work, feel free to copy and paste the following:
Ibrahim El Baba, Sébastien Lalléchère and Pierre Bonnet (2012). Time Reversal for Electromagnetism:Applications in Electromagnetic Compatibility, Trends in Electromagnetism - From Fundamentals toApplications, Dr. Victor Barsan (Ed.), ISBN: 978-953-51-0267-0, InTech, Available from:http://www.intechopen.com/books/trends-in-electromagnetism-from-fundamentals-to-applications/time-reversal-for-electromagnetism-applications-in-electromagnetic-compatibility

© 2012 The Author(s). Licensee IntechOpen. This is an open access articledistributed under the terms of the Creative Commons Attribution 3.0License, which permits unrestricted use, distribution, and reproduction inany medium, provided the original work is properly cited.