tiling the genome into consistently named subsequences ... · tiling the genome into consistently...
TRANSCRIPT
Tiling the Genome into Consistently NamedSubsequences Enables Precision Medicineand Machine Learning with Millions ofComplex Individual Data-SetsSarah Guthrie1,*, Abram Connelly1,*,2, Peter Amstutz1, Adam Berrey1,Nicolas Cesar1, Jiahua Chen1,3, Radhika Chippada1, Tom Clegg1,2, BryanCosca1, Jiayong Li1, Nancy Ouyang1,2, Jonathan Sheffi1, Brett Smith1,Ward Vandewege1,2, and Alexander Wait Zaranek1,2,**
1Curoverse Inc., Somerville, MA, USA2Harvard Personal Genome Project, Boston, MA, USA3University of Massachusetts Boston, Boston, MA, USA*We consider these authors to have contributed equally to this work.**Senior author and Corresponding author: [email protected]
ABSTRACT
The scientific and medical community is reaching an era of inexpensive whole genome sequencing,opening the possibility of precision medicine for millions of individuals. Here we present tiling: a flexiblerepresentation of whole genome sequences that supports simple and consistent names, annotation,queries, machine learning, and clinical screening. We partitioned the genome into 10,655,006 tiles:overlapping, variable-length sequences that begin and end with unique 24-base tags. We tiled andannotated 680 public whole genome sequences from the 1000 Genomes Project Consortium (1KG) andHarvard Personal Genome Project (PGP) using ClinVar database information. These genomes cover14.13 billion tile sequences (4.087 trillion high quality bases and 0.4321 trillion low quality bases) and251 phenotypes spanning ICD-9 code ranges 140-289, 320-629, and 680-759. We used these data tobuild a Global Alliance for Genomics and Health Beacon and graph database. We performed principalcomponent analysis (PCA) on the 680 public whole genomes, and by projecting the tiled genomes ontotheir first two principal components, we replicated the 1KG principle component separation by populationethnicity codes. Interestingly, we found the PGP self reported ethnicities cluster consistently with 1KGethnicity codes. We built a set of support-vector ABO blood-type classifiers using 75 PGP participantswho had both a whole genome sequence and a self-reported blood type. Our classifier predicts Aantigen presence to within 1% of the current state-of-the art for in silico A antigen prediction. Finally,we found six PGP participants with previously undiscovered pathogenic BRCA variants, and using ourtiling, gave them simple, consistent names, which can be easily and independently re-derived. Giventhe near-future requirements of genomics research and precision medicine, we propose the adoption oftiling and invite all interested individuals and groups to view, rerun, copy, and modify these analyses athttps://curover.se/su92l-j7d0g-swtofxa2rct8495.
Keywords: precision medicine, clinical screening, human genetics, machine learning
INTRODUCTIONPrecision medicine requires a collaboration between researchers, clinicians, and patients (Brenner, 2007;Kohane, 2015). Clinicians must incorporate genetic findings made by a community of scientists andother clinicians to inform diagnoses and treatments (Foley et al., 2015; Lee et al., 2015; Ellingford et al.,2015; Soden et al., 2014). Patients must be able to understand their genetic diagnoses and treatmentrecommendations. Researchers should be able to generate, agree with, or dispute genetic findings guidingthese recommendations (Rehm et al., 2015; Landrum et al., 2014). For millions of genomes, they shouldbe able to drill down into specific locations, examine whole genomes, and separate the population based
PeerJ PrePrints | https://dx.doi.org/10.7287/peerj.preprints.1426v1 | CC-BY 4.0 Open Access | rec: 12 Oct 2015, publ: 12 Oct 2015

on phenotypic data and intrinsic data discovered by machine learning algorithms. Extensive progresshas been made to foster these connections, leading to the creation of resources such as ClinGen (Rehmet al., 2015), COSMIC (Forbes et al., 2015), LOVD (Fokkema et al., 2011), the UCSC Genome Browser(Karolchik et al., 2014), and EMBL-EBI (Brooksbank et al., 2014). However, as we are poised to receivegenomic datasets on an unprecedented scale, there is an opportunity to revisit the representation of thegenome and ensure it enables all the aforementioned use cases.
We feel this representation must be open and public, since public solutions encourage reproducibilityand collaboration (Buck, 2015; McNutt, 2014; Angrist and Cook-Deegan, 2014; GA4GH, 015a; Collinsand Varmus, 2015). In addition, we feel this solution must be built using individual human genomicdata. It should be able to represent all types of genomes well, including somatic and germline (Levyet al., 2007; Chaisson et al., 2015; Zhang et al., 2011). It must have a good machine representationthat can support standardized queries and machine learning techniques. Standardized queries, such asthose implemented by the Global Alliance for Genomics and Health (GA4GH) Beacon Project(GA4GH,015b) and GA4GH Matchmaker Exchange (MatchmakerExchange, 2015), are gaining importance asdata volumes increase and more organizations are using these data in clinical settings. Machine learningtechniques on genome sequences are used to predict phenotype (Gonzalez-Recio and Forni, 2011; Ornellaet al., 2014; Yoon et al., 2012), generate disease prognoses (Abraham et al., 2012; Kourou et al., 2014),strengthen genome-wide association studies (Botta et al., 2014; Mittag et al., 2012; Pirooznia et al., 2012;Roshan et al., 2011), and elucidate ancestry (Hajiloo et al., 2013). Finally, we feel this whole genomerepresentation must be consistent: two researchers or clinicians, given the same called genome, shouldbe able to generate the same representation of that genome. Consistency vastly reduces the likelihoodof error, and thus simplifies collaboration, annotation aggregation, comparison between genomes, andanalyses that span multiple studies (Sboner and Elemento, 2015).
The VCF-like representation for called genomes, which includes variant call format files (Daneceket al., 2011) (VCF) and genome variation format files (Reese et al., 2010) (GVF), stores the places wherethe called genome differs from a mostly linear reference. This type of representation is excellent atstoring annotations both on specific variants (such as allele frequency or predicted effects on proteinsequence) and on genomic regions (such as introns and exons). It also represents quality and readdepth for called genomes well. With additional software and pre-processing, these files can be used forqueries and machine learning techniques. Unfortunately, this representation has unstandardized variantrepresentations, so one variant can be represented many different ways (Danecek et al., 2011; github,2015). This lack of standardization complicates machine learning, requiring a greater number of samplesto find an effect. Finally, the use of a linear reference genome does not effectively represent highlyvariable regions, such as the major histocompatibility complex and cancer genomes (Church et al., 2015;Dilthey et al., 2015).
Graphical representations are being developed to address these issues, including representing highlyvariant regions (Dilthey et al., 2015). Graph-based designs are effective at conceptualizing and imple-menting pan-genomes, the genomes of entire species (Church et al., 2015; Marcus et al., 2014). Graphicalrepresentations will, over time, support queries and machine learning; however, the additional complexityof using graphs will slow adoption.
We propose tiling, a new representation of whole genome sequences, as a genomic abstraction forprecision medicine. Tiling is designed to be a compromise between the VCF-like and graph representationsthat includes basic quality and phasing information. It provides identical subsequences with uniqueidentical names, supports clinical analysis, and simplifies machine learning. Additionally, tiling allowsus to define an individual’s genome more rigorously (Text S3), providing a probabilistic estimate of thecompatibility of two genomes generated from the same sample. Here, as a demonstration of the tilingabstraction’s use in precision medicine, we tiled 680 public genomes, and expressed them in a preliminaryGA4GH graphical representation and a GA4GH beacon query engine. We analyzed these 680 genomesusing supervised and unsupervised machine learning, found 14 pathogenic BRCA variations, and giveeach variation a simple, consistent name. The open nature of our approach and data allows researchers touse tiling to assign variants consistent names in any gene or region of interest.
RESULTSAll results described here may be found, replicated, and rerun on different data using Arvados athttp://curover.se/su92l-j7d0g-swtofxa2rct8495.
2/15
PeerJ PrePrints | https://dx.doi.org/10.7287/peerj.preprints.1426v1 | CC-BY 4.0 Open Access | rec: 12 Oct 2015, publ: 12 Oct 2015

Tiling the GenomeTiling abstracts a called genome by partitioning it into overlapping shorter segments, termed tiles. Here wechose each tile to be at least 250 reference bases long, with the beginning and ending 24 bases overlappingwith adjacent tiles. These overlapping 24-mers are termed “tags” and are chosen to be unique: they areat least a 2 base distance from anywhere in the genome. Our choice of tags partitioned the GRCh37human reference genome into 10,655,006 tiles, composed of 3.1 billion bases (an average of 314.5 basesper tile). Each tile is labeled with an MD5 hash digest of the sequence it contains, which we term its“variant value” and which serves as an unique, reproducible identifier for that tile. Since tags are unique,identical sub-sequences from different tile positions in the genome are guaranteed different unique names.Additionally, each tile is labeled with the number of tiles before it, which we term its “tile position”. Onetile position can have multiple tile variants - one for each sequence observed at that position. We term thepan-genome of all tile variants for all tile positions a “tile library”. Note that choosing a different set ofunique 24-mer tags would result in a different tiling. Therefore, each tile is also labeled with the set oftags used to create it, which we term a “tag set”. Detailed methods for tiling genomes are described inText S1.
Tiling 680 public genomes from the 1000 Genomes Project and the Harvard Personal Genome Project(PGP) covered 14.13 billion tiles (4.519 trillion bases), resulting in a tile library containing 1.246 billiontile variants (0.656 trillion bases, 116.9 tile variants per tile position). On average, each new genomeadded 0.1719 new tile variants per position. 68.66% of these tile variants had no genomic variants butcontained at least one uncalled base, which we consider to be a poorly sequenced region. By representingpoorly sequenced regions outside the tile library, the tile library will take, at the most, 0.3904 billion tilevariants (0.299 trillion bases, 36.64 tile variants per tile position, 0.0539 new tile variants per position pergenome). The predicted growth of the tile library for one million tiled genomes is discussed in Text S2.
An individual called genome can be easily represented as an array referencing the tile library. Eachposition in the array corresponds to a tile position and points to the tile variant observed at that positionfor that individual. Since the variant value is the hash of the sequence observed at the tile position, thevariant value and the tag set used to generate the tile may be used to unambiguously refer to subsectionsof the genome. This property provides consistency and reproducibility when representing genomes andimportant variants.
Annotations may be added to the tile library for both tile positions and tile variants. Each tile positionmay be annotated with its chromosome location to support translation between reference genomes andqueries defined by chromosomal loci. Additionally, tile positions may be annotated with gene names,introns, and exons. Tile variants may be annotated similarly to variants in VCF-like representations.Annotations are added to and stored in the tile library, which is population-wide. Since individualsequences use pointers to tile variants in the tile library, all individuals with a pointer to a tile variant in anannotated library will be annotated identically with all tile variant and tile position annotations.
After tiling the 680 public genomes, we annotated all tiles with ClinVar database information, exomeaggregation consortium (ExAC) database information, and the annotations produced from the clinicalannotation of variants (CAVA) tool (Muenz et al., 2015). We also expressed the BRCA1 and BRCA2regions for the PGP whole genome sequences in the GA4GH graphical representation (Fig. 1), andexposed them in a query engine.
Organizing the PGP Phenotype dataWe collected the PGP reported and predicted phenotypes, organized them into an SQLite3 database,and exposed them using Arvados at http://curover.se/su92l-j7d0g-k6xjjk9g0l5pmqh.This information is recollected periodically to produce snapshots of the PGP data. Each snapshot is about200 MB, and included in this database snapshot are pointers, often in the form of a URL, to the wholegenome files, user uploaded files, and reports for each. A snapshot is also included in the Arvados projectassociated with this paper (http://curover.se/su92l-j7d0g-swtofxa2rct8495).
Unsupervised Learning - Principal Component AnalysisWe performed PCA on well-sequenced positions in the autosomal chromosomes for our 680 wholegenomes. Our tiling contains 10,080,498 tile positions per phase for the autosomal chromosomes(20,160,996 total). We defined a tile position to be well sequenced if all tile variants at that position werefree of no-calls for the entire population. This definition is very stringent, since 680 genomes, each withrandomly distributed single-base no-calls in only 1% of tile positions, would be expected to have 11,867
3/15
PeerJ PrePrints | https://dx.doi.org/10.7287/peerj.preprints.1426v1 | CC-BY 4.0 Open Access | rec: 12 Oct 2015, publ: 12 Oct 2015

Figure 1. Tile library built from the Harvard Personal Genome Project participants’ wholegenomes for exon 11 of BRCA2, with the sequence of participant hu92C40A highlighted. The tilelibrary is shown in the context of the UCSC Genome Browser (Karolchik et al., 2014). Participanthu92C40A has self-reported breast cancer and has a BRCA2 frameshift mutation. The two phases ofparticipant hu92C40A are highlighted (one with a red dashed line and one with an orange solid line) andtheir sequences are shown - this participant is homozygous for all tile positions except 00.247.0b2e. Tilevariants are ordered into columns by tile position. Tags are the smaller rectangles and tile variants are thelarger ones. The zoomed-in tile variant is labeled with its tile position, tile variant value (which is theMD5 digest of the start tag, the variant sequence, and the end tag), and the HGVS labels for the genomicvariation present in the tile. The number of haplotypes containing each tile variant are shown inparenthesis.
well sequenced tile positions. At 2.5% no tile positions would be expected to be well sequenced. In ourdata, only 29,366 (0.146%) of the autosomal tile positions were well sequenced for all 680 whole genomesequences.
We then projected the 680 tiled sequences onto the first two principal components obtained fromPCA (Fig. 2). The projection of the 502 1000 Genomes sequences results in clusters correspondingto ethnic background of the participants (Fig. S1). This replicates the ethnic clustering from the1000 Genomes Consortium in 2012, who projected SNP data onto the first two principal components(1000GenomesProjectConsortium, 2012). The projection of the 178 PGP whole genome sequences alsoclusters the population based on ethnic background (Fig. S2). Colors shown in Fig. 2 for the PGP datawere obtained by examining both the PGP reported ethnicities and their reported grandparent country oforigin. Any participant reporting to be white and having at least one grandparent with a European countryof origin is colored magenta. Three participants (hu38168C, hu92FD55, and huCA017E, coloredolive) reported themselves to be Asian and have grandparents exclusively from China. One participant(huEA4EE5, colored dark orange) reported being Hispanic or Latino and has grandparents exclusivelyfrom Columbia. Finally, one participant (hu49F623, colored black) reported being Black or AfricanAmerican and has grandparents exclusively from Ethiopia.
Supervised Learning - ABO Blood Type Classifiers75 of the 178 PGP called genomes had self-reported ABO blood types as follows: Type O (32), Type A(30), Type B (13), and Type AB (0). We trained two support vector machines (SVMs), one to predict A
4/15
PeerJ PrePrints | https://dx.doi.org/10.7287/peerj.preprints.1426v1 | CC-BY 4.0 Open Access | rec: 12 Oct 2015, publ: 12 Oct 2015
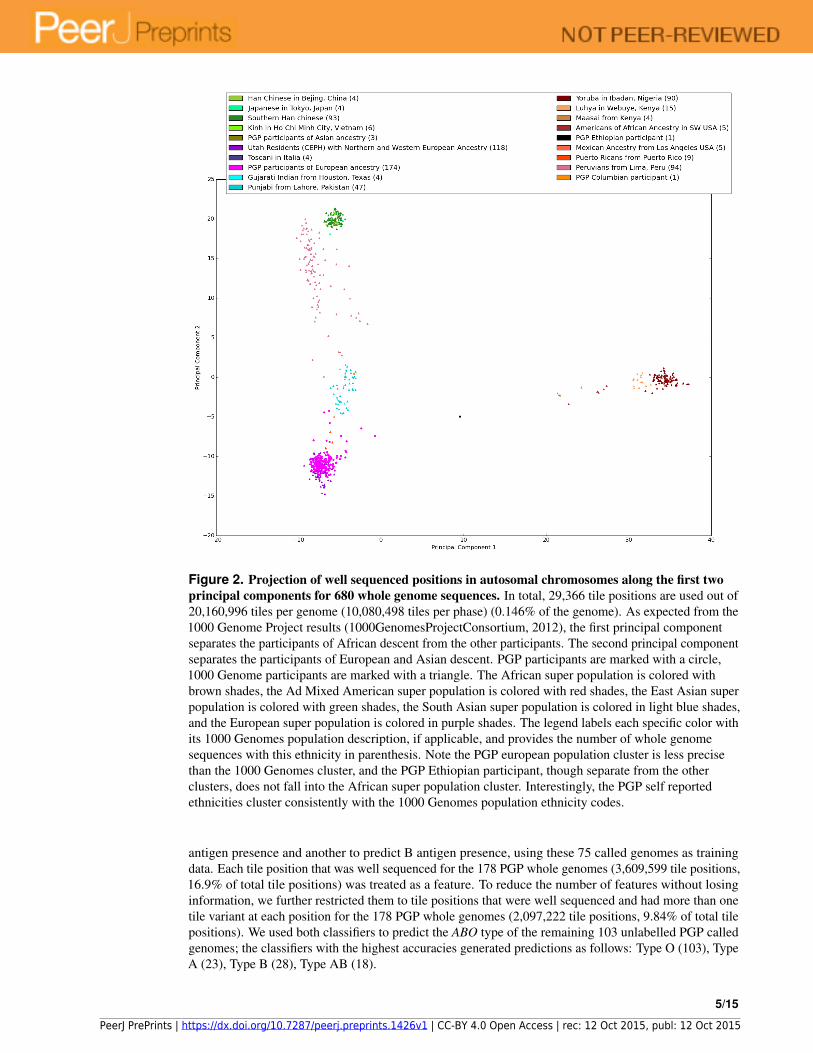
Figure 2. Projection of well sequenced positions in autosomal chromosomes along the first twoprincipal components for 680 whole genome sequences. In total, 29,366 tile positions are used out of20,160,996 tiles per genome (10,080,498 tiles per phase) (0.146% of the genome). As expected from the1000 Genome Project results (1000GenomesProjectConsortium, 2012), the first principal componentseparates the participants of African descent from the other participants. The second principal componentseparates the participants of European and Asian descent. PGP participants are marked with a circle,1000 Genome participants are marked with a triangle. The African super population is colored withbrown shades, the Ad Mixed American super population is colored with red shades, the East Asian superpopulation is colored with green shades, the South Asian super population is colored in light blue shades,and the European super population is colored in purple shades. The legend labels each specific color withits 1000 Genomes population description, if applicable, and provides the number of whole genomesequences with this ethnicity in parenthesis. Note the PGP european population cluster is less precisethan the 1000 Genomes cluster, and the PGP Ethiopian participant, though separate from the otherclusters, does not fall into the African super population cluster. Interestingly, the PGP self reportedethnicities cluster consistently with the 1000 Genomes population ethnicity codes.
antigen presence and another to predict B antigen presence, using these 75 called genomes as trainingdata. Each tile position that was well sequenced for the 178 PGP whole genomes (3,609,599 tile positions,16.9% of total tile positions) was treated as a feature. To reduce the number of features without losinginformation, we further restricted them to tile positions that were well sequenced and had more than onetile variant at each position for the 178 PGP whole genomes (2,097,222 tile positions, 9.84% of total tilepositions). We used both classifiers to predict the ABO type of the remaining 103 unlabelled PGP calledgenomes; the classifiers with the highest accuracies generated predictions as follows: Type O (103), TypeA (23), Type B (28), Type AB (18).
5/15
PeerJ PrePrints | https://dx.doi.org/10.7287/peerj.preprints.1426v1 | CC-BY 4.0 Open Access | rec: 12 Oct 2015, publ: 12 Oct 2015
The classifier that predicted A antigen presence with the highest accuracy (93.3% ± 24.9%), measuredby leave-one-out cross-validation, was an SVM with a linear kernel, l1 regularization, and an error penaltyof 0.01. This classifier had one non-zero coefficient, weighting the second phase tile position 00.1c4.038c,which is in Intron 1 in the ABO gene (chr9:136,149,787-136,150,036). This classifier misclassified 5A antigen positive called genomes in the training set as A antigen negative. It predicted 43 of the 103unlabeled called genomes to have the A antigen phenotype.
The classifier that predicted B antigen presence with the highest accuracy (84.0% ± 36.7%) was anSVM with a linear kernel. This classifier had 1,786,803 non-zero coefficients (85.2% of the availabletile positions). The largest coefficient magnitude was 2.11∗10−5, 4 orders of magnitude less than thecoefficients of the A antigen classifiers. This classifier did not misclassify any of the training calledgenomes, and it predicted 44 out of 103 called genomes have the B antigen phenotype. An in-depthsummary of the classifier parameterization results are in Text S5.
Clinical Analysis of the BRCA regionsWe found 6 PGP participants with confidently called pathogenic tile variants, which we associated withtheir simple, consistent tile variant values (Tables 1 and 2). All 6 variations were predicted by CAVAto have a severe impact. We considered a tile variant pathogenic if it contains a variation generatinga premature termination codon in BRCA1 or BRCA2, excluding variations that generate a prematuretermination codon in exon 27 after codon 3010 of BRCA2 (Rebbeck et al., 2015). Tile variants containinggenomic variants that result in large in-frame deletions spanning 1 or more exons or that delete transcriptionregulatory regions would also be considered pathogenic tile variants; however, we did not observe anysuch tile variants in our population. 4 of the 6 pathogenic tile variants contained variations in ClinVarthat were classified as pathogenic by multiple submitters. We submitted the two new variants to ClinVar,along with the Harvard PGP identifiers associated with the genomic sequences containing these variants.
We added an evaluation of these variants to GET-Evidence, a community-edited database of variantswhere researchers, the general public, and PGP participants can learn about and discuss the significanceof variants in a public, collaborative forum (Ball et al., 2012). We informed the Harvard PGP staffof our findings. The PGP tracks the recommendations of the regulatory and ethical standards of theGA4GH and, thus, simplifies the process of adhering with these recommendations. Additionally, by usingGET-Evidence, researchers can be assured that PGP participants will be notified of new findings in theirgenomes once they are well supported by evidence. The open nature of these methods and data allowsresearchers to evaluate their own genes and regions of interest.
First, we found participant huFFB09D is heterozygous for a BRCA2 Asn1198Lys frameshift variant inexon 11, which is not in ClinVar. huFFB09D is a female in her 40’s with no self-reports relating to cancer,though she reports Hashimoto’s thyroiditis. GET-Evidence reports she is also heterozygous for variantCASP10-V410I, which is documented by GET-Evidence to have a dominant, likely protective effecton breast cancer. Second, we found participant hu92C40A is heterozygous for a BRCA2 Phe1866Leuframeshift variant in exon 11, which is also not in ClinVar. hu92C40A is a 71 year-old female whoreports having had breast cancer and breast biopsies in 2010. Third, we found participant huD3A569is heterozygous for a BRCA2 Ser1982Arg frameshift variant in exon 11, which ClinVar associateswith familial breast-ovarian cancer, complementation group D1 fanconi anemia, and pancreatic cancer.huD3A569 is a male in his 40’s. He reports having 2 skin cancer incidents that occurred in his 30’sand a mother who has had 20+ occurrences of skin cancer. Fourth, we found participant hu72C17Ais heterozygous for a BRCA2 Lys3084Asn frameshift variant and/or splice region variant in exon 24.ClinVar associates this variant with familial breast-ovarian cancer. hu72C17A is a male in his 50’s withno self-reports relating to cancer. Participant hu72C17A has a cell line, GM24077, available from Coriell.Fifth, we found participant hu82436A is heterozygous for a BRCA1 Asp1162Val frameshift variant inexon 10, which ClinVar associates with familial breast-ovarian cancer. hu82436A is a 29 year-old malewith no self-reports relating to cancer. Finally, we found participant huCD380F is heterozygous for aBRCA1 Val340Gly frameshift variant in exon 10, which ClinVar associates with familial breast-ovariancancer. huCD380F is a 33 year-old female with no self-reports relating to cancer, though she reportsHashimoto’s thyroiditis. Further details about all participants are in Text S4.
No PGP participants in our population reported having fanconi anemia, ovarian cancer, or pancreaticcancer, so we did not perform Fisher’s exact tests for these phenotypes. Unsurprisingly, we did not find asignificant correlation between BRCA frameshift presence and breast cancer in our relatively young cohort
6/15
PeerJ PrePrints | https://dx.doi.org/10.7287/peerj.preprints.1426v1 | CC-BY 4.0 Open Access | rec: 12 Oct 2015, publ: 12 Oct 2015
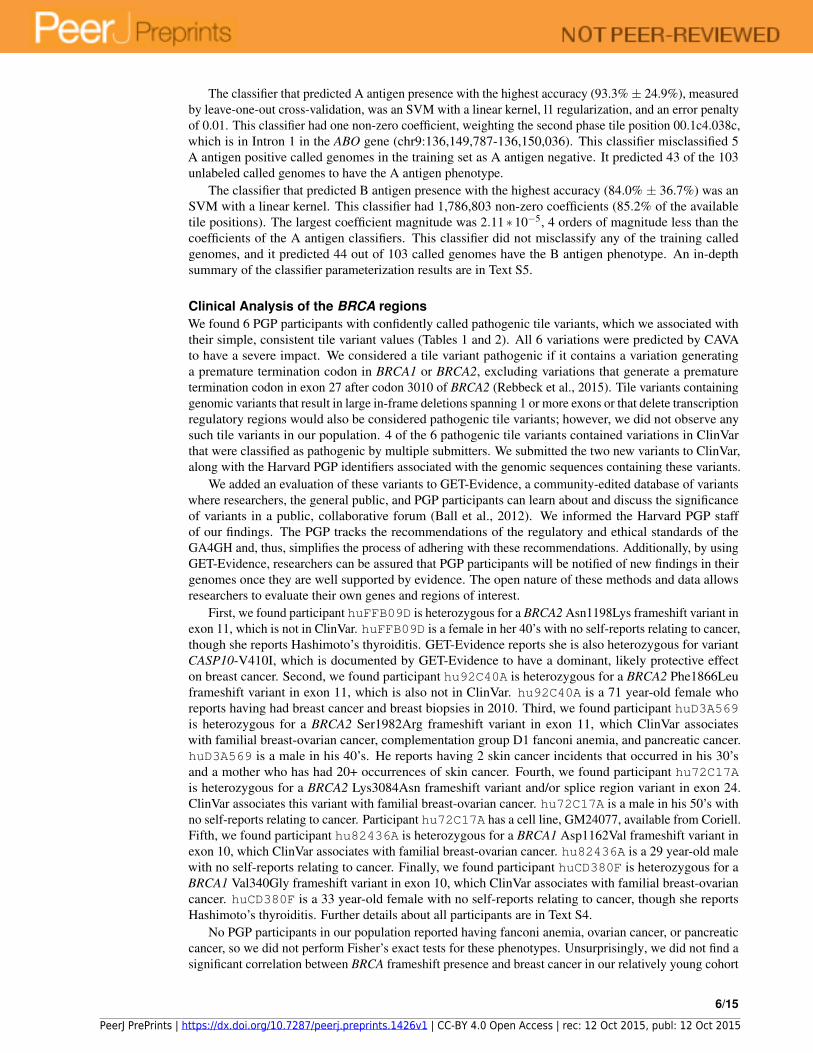
Table 1. Details about the pathogenic tile variants. Tile variants are named by their tile position, which is separated into tag set,“paths” , and “steps” , and the MD5 digest of their sequence (see Text S1 for the description of path and step). Each tile variant isshown with variations from the GRCh37 reference genome. All genomic variations contained within a pathogenic tile are shownregardless of the genomic variant’s likely pathogenicity. The predicted protein change was produced by CAVA (Muenz et al., 2015)and GET-Evidence (Ball et al., 2012). Harvard PGP ids of the Harvard PGP participants who have these variants are shown, as wellas their genotype for the tile (heterozygous is abbreviated to het; homozygous is abbreviated to hom). All loci use 0-based GRCh37coordinates.
Tile position, Variant Value Loci Cov-ered by TileVariant
HarvardPGP IDs
Genomic Variants in Tile PredictedProteinChange
PredictedStop-GainVariant
00.247.0b24,91e94cf32f709225f17f37c159930451
chr13:32,911,657 -32,912,133
huFFB09D(het)
32,911,887 SNP A→G - -
32,912,080 INDEL -→A BRCA2N1198Kfs
BRCA21199
00.247.0b2e,3552b9fc68c47f5e7783addc4c2877a2
chr13:32,913,918 -32,914,167
hu92C40A(het)
32,914,086 INDEL AT→C BRCA2F1866Lfs
BRCA21873
00.247.0b30,b0ee262cb5737ac19d609912fa2f0d40
chr13:32,914,368 -32,914,617
huD3A569(het)
32,914,437 INDEL T→- BRCA2S1982Rfs
BRCA22003
00.247.0bc8,d16d51ee6d027ae066ea827dc181d038
chr13:32,954,218 -32,954,467
hu72C17A(het)
32,954,277 INDEL AACA→TT BRCA2K3084Nfsa
BRCA23086
00.2c5.04c0,84fa1b2665461533586d77aa8c21393e
chr17:41,243,883 -41,244,132
hu82436A(het)
41,243,999 SNP T→C BRCA1K1183R
-
41,244,062 INDEL T→- BRCA1D1162Vfsb
BRCA11209
00.2c5.04cb,e318e2ddb54bb3d6cc3a5ca6749482c5
chr17:41,246,365 -41,246,614
huCD380F(het)
41,246,531 INDEL -→T BRCA1V340Gfs
BRCA1 345
aThis frameshift results in a stop-gain variant at BRCA2 3086 and removes the exon-splice site in Exon 24.bThis frameshift results in the next variant changing from BRCA1 Lys1183Arg to Lys1183Glu and inserts a stop-gain variant atBRCA1 1209. Next variant will change if the phasing called in the GFF file is accurate.
7/15
PeerJ PrePrints | https://dx.doi.org/10.7287/peerj.preprints.1426v1 | CC-BY 4.0 Open Access | rec: 12 Oct 2015, publ: 12 Oct 2015
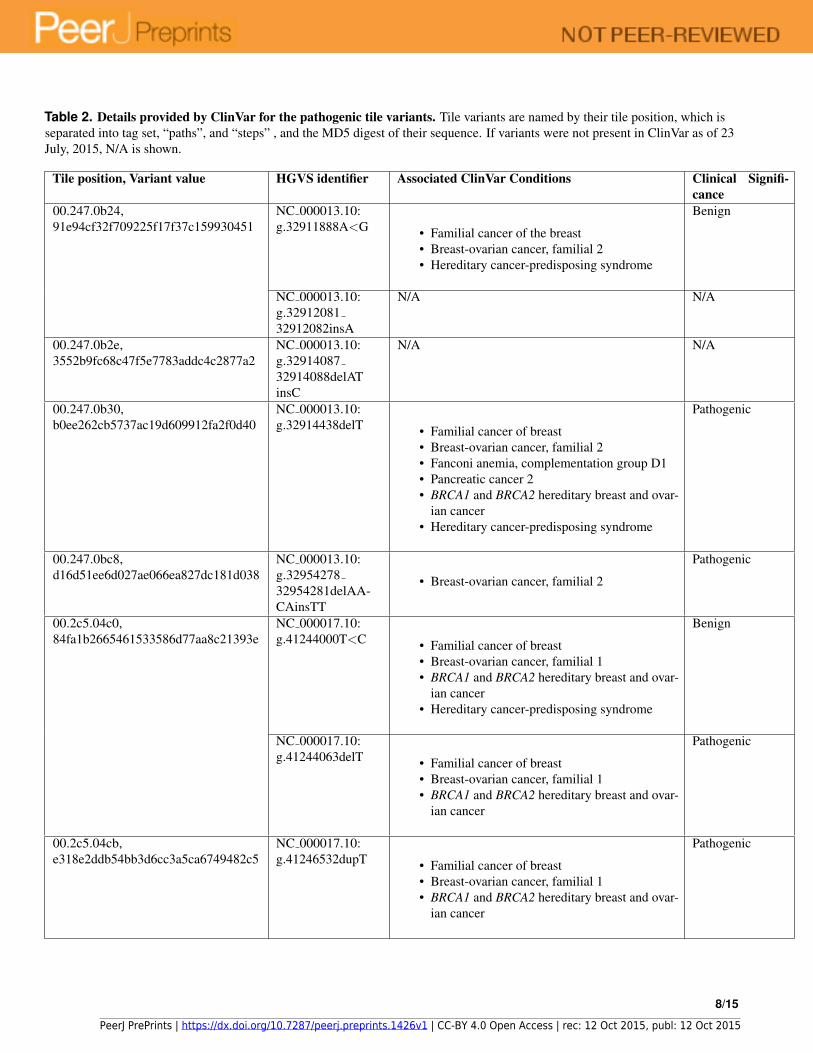
Table 2. Details provided by ClinVar for the pathogenic tile variants. Tile variants are named by their tile position, which isseparated into tag set, “paths”, and “steps” , and the MD5 digest of their sequence. If variants were not present in ClinVar as of 23July, 2015, N/A is shown.
Tile position, Variant value HGVS identifier Associated ClinVar Conditions Clinical Signifi-cance
00.247.0b24,91e94cf32f709225f17f37c159930451
NC 000013.10:g.32911888A<G • Familial cancer of the breast
• Breast-ovarian cancer, familial 2• Hereditary cancer-predisposing syndrome
Benign
NC 000013.10:g.3291208132912082insA
N/A N/A
00.247.0b2e,3552b9fc68c47f5e7783addc4c2877a2
NC 000013.10:g.3291408732914088delATinsC
N/A N/A
00.247.0b30,b0ee262cb5737ac19d609912fa2f0d40
NC 000013.10:g.32914438delT • Familial cancer of breast
• Breast-ovarian cancer, familial 2• Fanconi anemia, complementation group D1• Pancreatic cancer 2• BRCA1 and BRCA2 hereditary breast and ovar-
ian cancer• Hereditary cancer-predisposing syndrome
Pathogenic
00.247.0bc8,d16d51ee6d027ae066ea827dc181d038
NC 000013.10:g.3295427832954281delAA-CAinsTT
• Breast-ovarian cancer, familial 2
Pathogenic
00.2c5.04c0,84fa1b2665461533586d77aa8c21393e
NC 000017.10:g.41244000T<C • Familial cancer of breast
• Breast-ovarian cancer, familial 1• BRCA1 and BRCA2 hereditary breast and ovar-
ian cancer• Hereditary cancer-predisposing syndrome
Benign
NC 000017.10:g.41244063delT • Familial cancer of breast
• Breast-ovarian cancer, familial 1• BRCA1 and BRCA2 hereditary breast and ovar-
ian cancer
Pathogenic
00.2c5.04cb,e318e2ddb54bb3d6cc3a5ca6749482c5
NC 000017.10:g.41246532dupT • Familial cancer of breast
• Breast-ovarian cancer, familial 1• BRCA1 and BRCA2 hereditary breast and ovar-
ian cancer
Pathogenic
8/15
PeerJ PrePrints | https://dx.doi.org/10.7287/peerj.preprints.1426v1 | CC-BY 4.0 Open Access | rec: 12 Oct 2015, publ: 12 Oct 2015

(Table S2). Since two participants with a BRCA frameshift mutation reported Hashimoto’s thyroiditis, weperformed a Fisher’s exact test to test the association between Hashimoto’s thyroiditis and having a BRCAframeshift variant. This test yielded a significant p-value of 0.0125 (n = 151), uncorrected for multiplehypothesis testing (Table S1).
DISCUSSIONSeveral authors have shown that human genomes can be compactly represented and queried usingreference-based compression(Layer et al., 2015; Purcell et al., 2007; Christley et al., 2009; Glusman et al.,2011; Deorowicz and Grabowski, 2013, 2011; Kelleher et al., 2013; Wittelsbuerger et al., 2014; Rahnet al., 2014; Durbin, 2014; Fritz et al., 2011). Tiling allows for a compact representation and enablesfast queries without decompression. By storing these compact representations in random access memory(RAM), extremely fast queries can be achieved. Given ten racks of standard hardware with 32 nodes, eachwith 256 GiB of RAM, we can store 1 million genomes in RAM if we use less than 84 MB per genome.We can already encode 680 ethnically diverse genomes in less than 84 MB per genome, and we estimatetiled genomes to be compressible to a few megabytes. A typical node costs about $8000, has a three yearlifetime, and requires power, cooling, space and maintenance. Consequently, this encoding enables a fullyamortized operating cost, supporting a variety of analyses and queries, of just $2.4 per genome per yearfor a million genome data warehouse. This cost is 10 times better than reported previously (Haussleret al., 2012) and does not take into account another order of magnitude in potential improvement withbetter tiling encodings (Text S2).
Public domain data is ideally suited to demonstrate tiling because it facilitates openness and collabora-tion (Buck, 2015; McNutt, 2014; Angrist and Cook-Deegan, 2014; GA4GH, 015a; Collins and Varmus,2015). We focus on the PGP data for clinical analysis, despite its ethnic homogeneity (Fig. S2), becauseit is associated with extensive phenotypes. Using the PGP data allowed us to submit variants alongsidePGP IDs to ClinVar. Having both of these identifiers enhances the accuracy of variation frequency reports,since the variants associated with participant identifiers will not be overrepresented when other researchersobserve the same variant and have no way to tell it is from the same individual. Although we chooseto implement tiling on public data and publish the entire resulting library, this is not the only privacymodel enabled by tiling. The simple, consistent hashes tiling uses provides a mechanism to easily extendpublic tile libraries. These extensions on the tile library may be kept private, fostering as much scientificcollaboration as possible without compromising patient privacy.
Graphical genome abstractions are gaining popularity, partially due to their ability to represent highlyvariable regions well (Church et al., 2015; Dilthey et al., 2015). They are better suited than linear referencegenomes to represent the genome of a species (Church et al., 2015; Marcus et al., 2014). Graphicalgenomes are particularly suited for cancer encodings (Oesper et al., 2012), with chromosome-scaleinsertions, deletions, and inversions, which are one of the most anticipated areas of precision medicine(Collins and Varmus, 2015). A genome tiling can naturally support these use cases, since it can be simplyconverted to a graphical genome representation. To demonstrate that tiling is compatible with graphicalencoding, we encoded the BRCA1 and BRCA2 region tilings for the PGP genomes into the preliminaryGA4GH graphical database specification required for the HGVR pilot project.
Most clinicians and researchers rely on linear genome abstractions to hold annotation information.Unfortunately, reasoning about graphical coordinate systems, annotations on these coordinates, andannotations on specific sequences will require considerable deliberation by the clinical community. Thesimplest solution, and one that will be useful for the adoption of a new genome representation, is the abilityto convert tiling into VCF-like genome representations, which we implemented for tiling. Convertinga tile to a VCF-like genome representation can be done by aligning a tile variant sequence against thetile variant sequence of the desired reference. Both of these sequences are about 250 bases long, havethe same 24 starting bases, and have the same 24 ending bases. Additionally, we can annotate specifictile variants to indicate they are a reference sequence. Therefore, we can obtain multiple standardizedVCF-like genome representations, including GVF, VCF, and gVCF, by precomputing an inexpensiveglobal alignment on a tile variant sequence against the tile variant associated with GRCh38 or GRCh37 atthe same tile position.
Tiling’s use of tile positions enables many common use cases, such as annotation and querying,without requiring conversion to VCF-like representations. We demonstrated tiling supports common toolsby annotating the BRCA1 and BRCA2 region tilings for 680 genomes with CAVA, an open-source variant
9/15
PeerJ PrePrints | https://dx.doi.org/10.7287/peerj.preprints.1426v1 | CC-BY 4.0 Open Access | rec: 12 Oct 2015, publ: 12 Oct 2015
annotator, and with information aggregated from ExAC and ClinVar. Since tile positions and tile variantsare annotated at a population level via the tile library, these annotations apply to all 680 called genomesidentically, removing the possibility of conflicting annotations within the same population as a source ofambiguity and error.
We demonstrate tiling enables machine learning by replicating the 1000 Genomes principal componentresults (1000GenomesProjectConsortium, 2012), and extending those results to the PGP data. Interestingly,we found the PGP self reported ethnicities cluster consistently with the 1000 Genomes population ethnicitycodes. This clustering demonstrates that self-reported data can be of sufficient quality for at least somemachine learning applications in genomics. Since VCF-like and graph abstractions of whole genomesequences can represent one sequence in multiple ways (Danecek et al., 2011; Dilthey et al., 2015), datagathered from multiple studies using multiple tools can be hard to combine without ambiguity. Thisambiguity further reduces the power of machine learning, requiring more samples to discover an effect.Tiling’s simplicity, naming consistency, and native matrix representation is extremely advantageous formachine learning applications.
As an example of tiling’s use in supervised machine learning, we built an ABO classifier on the PGPtiled genomes. Currently, in silico ABO blood type classifiers use known variants associated with ABOblood type phenotype to build their predictions. BOOGIE, a predictor using SNV databases, predicts theABO blood type group with 94.2% accuracy for well sequenced whole genome sequences (Giollo et al.,2015). Our A antigen classifier was given 75 labeled whole genomes with no prior knowledge, and itselected, out of over 2 million tile positions across the genome, a position in the ABO gene. This classifierprovides an accuracy of 93%, about one percent less than the BOOGIE ABO classifier, which relies onSNP-blood type databases. Our B antigen classifier did not have enough participants with the B antigenphenotype to accurately train the classifier.
We believe that adding feature selection, along with a larger and more varied training set, will increasethe accuracies of our ABO blood type classifiers, since our current classifiers have a very large discrepancybetween the number of features and the number of training sets. The Harvard PGP is currently in theprocess of releasing a blood type survey to participants and making their responses publicly available. Weplan to incorporate these responses and grow our training set. Additionally, developing a less exclusivemechanism that incorporates poorly sequenced regions might allow the classifiers access to the underlyingvariants producing the ABO phenotype, which might also increase the accuracies of our classifiers.Finally, including known phenotypes, such as ethnicity, could strengthen the predictive accuracies of ourclassifiers.
We identified previously undetected, pathogenic BRCA mutations in 6 persons in the PGP. Using tiling,we provided simple, consistent identifiers of these variations, which we converted into human-friendlyVCF-like representations and HGVS identifiers. We submitted the previously new variations to ClinVar,and added relevant clinical evidence to GET-Evidence, enabling the PGP to inform these 6 participants.We note that 6 participants with pathogenic BRCA mutations out of a total of 178 is a higher numberof pathogenic mutations than the expected 2.67 participants in randomly selected, non-Jewish, healthypopulation (Frank et al., 2002). We hypothesize this high incidence rate results from the self-selectionprocess of joining the PGP. One might think the PGP is enriched for the worried well; however, the highnumber of BRCA frameshifts found here might indicate participants are indeed ill.
Of the six PGP participants with BRCA frameshift mutations, three are male and three are female.The oldest female participant, hu92C40, reports having breast cancer at the age of 66. The secondoldest female participant, huFFB09D, does not report breast cancer. Participant huFFB09D is alsoheterozygous for CASP10-V410I, which is reported to have a dominant, likely protective effect on breastcancer (Frank et al., 2006), but is reported to not protect against BRCA frameshift mutations (Engel et al.,2010). The youngest female participant, huCD380F, who is 33 years old, also does not report breastcancer. This 2:1 ratio of healthy to cancerous patients can be expected, given the ages of the two healthyparticipants (Levy-Lahad and Friedman, 2007), and the fact that one also has a possibly protective variant.Of the three males, two report no cancers, which also can be expected, given that BRCA variants havea greater increase of cancer risk in females than males (Levy-Lahad and Friedman, 2007). The otherparticipant, huD3A569, reports multiple occurrences of skin cancer before the age of 40 and reports hismother, at age 72, has had over 20 basal cell carcinomas and squamous cell carcinomas on her head andface. He is a carrier of a BRCA2 variant, which is reported to strongly increase the likelihood of skincancers (Levy-Lahad and Friedman, 2007; Ginsburg et al., 2010).
10/15
PeerJ PrePrints | https://dx.doi.org/10.7287/peerj.preprints.1426v1 | CC-BY 4.0 Open Access | rec: 12 Oct 2015, publ: 12 Oct 2015
The two Fisher’s exact tests we performed examined the correlation between breast cancer and havinga BRCA frameshift variant (Table S2) and the correlation between Hashimoto’s thyroiditis and having aBRCA frameshift variant (Table S1). We did not observe a significant correlation between breast cancerand having a BRCA frameshift variant. Given the small size of our cohort (Table S1), the young age of theparticipants with the BRCA frameshift variants, and the number of factors contributing to breast cancer,we are not surprised by these results. We estimate 131 females need to join the PGP to achieve a power of95% with Fisher’s exact test (current power is 48%). We observed a significantly increased likelihood ofpresenting with Hashimoto’s thyroiditis if the patient has a BRCA frameshift variant. This correlation hasboth supporting (Chen et al., 2013) and contradicting (Sarlis et al., 2002) evidence, and we suggest furtherinvestigation into the effect BRCA frameshift variants have on Hashimoto’s thyroiditis and possibly otherdiseases.
Tiling, by using sequence hashes, provides a consistent and unambiguous representation of genomicsequences. Because tiling uses the hash of the sequence to refer to the sequence, tiling reduces variantnaming ambiguities. A tile variant’s sequence allows anyone to generate a simple and identical identifierof that sequence, which can then be associated with more human-friendly names provided by HGVSor other standards bodies. While a VCF-like representation (Danecek et al., 2011) can give the sameunderlying sequence a variety of names, tiling vastly simplifies information aggregation and collaborationby using a tag set to give each sequence exactly one name.
Finally, tiling is, to our knowledge, the first decomposition of a genome into smaller pieces thatcan be easily verified by molecular biology techniques. Exome capture (Hodges et al., 2007) and tilingarrays (Mockler and Ecker, 2005) have already demonstrated the promise of using tag-like sequences ingenomics. Our 24-base tags were inspired by PCR primers. Therefore, we postulate that in the process ofdesigning an optimal tag set, we may consider the utility of these tags as PCR primers for high-throughputamplification and sequencing. Thus, one tag set may represent a called genome and be used to biologicallyquery a sequence.
We have demonstrated tiling can support clinical screening, supervised machine learning, and un-supervised machine learning on the whole genome. Furthermore, this approach is scalable to millionsof individual complex data-sets and can, thus, enable population-wide precision medicine and genomicscreening. We hope our open approach to tiling, in addition to collaborations with the GA4GH and thewider genomics community, will ensure tiling addresses the problems faced by the scientific and medicalcommunities. We invite all interested individuals and groups to contribute to the open-source project athttp://github.com/curoverse/lightning.
METHODSTilingWe tiled 680 called, whole genome sequences, aligned to GRCh37. 178 of these called genomeswere tiled using the Harvard Personal Genome Project (PGP) CGI-var files (obtained at http://curover.se/su92l-j7d0g-nf54gdds5jj03tc via Arvados). 69 of these genomes were tiledusing the 1000 Genomes Project CGI-var files (obtained from Complete Genomics at ftp://ftp2.completegenomics.com/vcf_files/Build37_2.0.0/), and 433 were tiled using the 1000Genomes Project CGI-var files (obtained from NCBI at ftp://ftp-trace.ncbi.nih.gov/1000genomes/ftp/data/). In total, 502 called genomes are from the 1000 Genomes and 178called genomes are from the Harvard Personal Genome Project (PGP). All CGI-var files were converted toGFF (general feature format) files, which we tiled as described in Text S1. We preserved the phase calledby Complete Genomics, found in each GFF file. Further details, source code for tiling, and source codefor other custom functions can be found at https://github.com/curoverse/lightning andhttp://curover.se/su92l-j7d0g-swtofxa2rct8495.
Pythonic Tiling Representation for Machine LearningFor use in supervised and unsupervised machine learning, we converted the 680 tiled called genomes intopython numpy arrays: with one row per called genome in the population and one column per tile position.To preserve space, we hashed each tile variant value with a non-negative integer for each tile position. Allphase A variant calls were placed on the left half of the array, and phase B variant calls were placed onthe right half. Tile variants that spanned multiple tile positions (described in Text S1) were assigned anon-negative integer greater than their position to ensure tiles spanning into a different position would not
11/15
PeerJ PrePrints | https://dx.doi.org/10.7287/peerj.preprints.1426v1 | CC-BY 4.0 Open Access | rec: 12 Oct 2015, publ: 12 Oct 2015

be mistaken as a different tile variant starting at that different position. We also generated a second set ofnumpy arrays where the variant value was set to -1 if the tile variant contained a poorly sequenced region.We define a tile position as well sequenced if the tile is free of no-calls. The two resulting matrices wereused for machine learning, specifically principal component analysis (PCA) and classification.
Unsupervised Learning - Principal Component AnalysisTo avoid capturing the noise generated by sequencing artifacts, we ran PCA only on tile positions whereall 680 called genomes were well sequenced. Spanning tiles (described in Text S1) that contained a no callremoved all tile positions it spans from being well-sequenced. The numpy arrays were then encoded usinga one-hot encoding scheme (Snoek et al., 2012). The resulting matrix was used as input for principal com-ponent analysis, implemented by scikit-learn (Pedregosa et al., 2011), and projected onto the first two prin-cipal components. The 502 callsets from the 1000 Genomes Project were colored based on their assignedpopulation ethnicities (obtained from the 1000 Genomes Project at ftp://ftp.1000genomes.ebi.ac.uk/vol1/ftp/technical/working/20130606_sample_info/20130606_sample_info.xlsx). The 178 PGP callsets were colored after visually examining their PCA projection, whilecross-validating using their reported ethnicity and ancestry.
Supervised Learning - ABO Blood Type ClassifiersTo avoid capturing the noise generated by sequencing artifacts, we removed tile positions with any poorlysequenced tile variants in any of the 178 genomes. Since each tile position is considered a feature, weremoved all tile positions where the variant value was the same in all 178 genomes, since the genomicsequence is identical for those 178 genomes in that small region. To avoid training on random noise,we used the scikit-learn (Pedregosa et al., 2011) StandardScaler functionality to transform the data bycentering all tile variant values around zero and dividing non-constant features by their standard deviation.We fit on (found the mean and standard deviation of) the training data and transformed both the trainingand unlabeled data. Blood types for the PGP participants were scraped from the Harvard PGP site onApril 29, 2015 using scrapy. 75 PGP participants have self-reported blood types associated with theiraccount; their whole genome sequence, including mitochondrial DNA and sex chromosomes, were usedas training inputs to the classifiers.
Due to the low number of training callsets, we used leave-one-out cross-validation to determinethe optimal classifier type and parameter values for the A-antigen and B-antigen classifiers. We testeddifferent parameters for three types of classifiers implemented by scikit-learn (Pedregosa et al., 2011):SVC (linear and radial basis function kernels, varying C), NuSVC (linear and radial basis functionkernels, varying nu), and LinearSVC (l1 or l2 penalty, varying C). SVC implements C-Support VectorClassification, where C is the penalty parameter of the error term. NuSVC implements Nu-Support VectorClassification, where nu is an upper bound on the fraction of training errors and a lower bound of thefraction of support vectors. LinearSVC implements C-Support Vector Classification with a linear kernel,where C is the penalty parameter of the error, and allows the user to specify the norm used in penalization.Using the classifier and the parameter which provided the highest accuracy (as measured by leave-one-outcross-validation), we predicted the blood type for the remaining unlabeled 103 PGP callsets.
Personalized Medicine and Clinical Analysis of the BRCA regionWe chose to examine the BRCA regions for possible pathogenic variants in our 680 called genomes.We used the definition of a clearly pathogenic BRCA1/2 mutations used by Rebbeck et al. (2015).Each tile variant falling in these regions was aligned back to GRCh37 and converted to gVCF, thenannotated using CAVA (Clinical Annotation of Variants) (Muenz et al., 2015), an open-source variantannotation tool, downloaded from the Oxford Genomics Centre on March 30, 2015. The default impactdefinitions, ensembl file, dbsnp, and GRCh37 reference provided by CAVA were used. Additionalannotations from ExAC and ClinVar were imported using custom-built open-source software that canbe accessed at https://github.com/curoverse/lightning. When called genomes fromthe PGP were found to contain a pathogenic variant of high quality, the variant existence was firstconfirmed by converting the called genome to VCF using cgatools and comparing them with ExACand ClinVar using bcftools isec (Details in Text S6). Then, if this variant was not already reportedby GET-Evidence (Genome-Environment-Trait Evidence) (Ball et al., 2012), the variant was added andannotated, the relevant PGP reports were updated, and PGP participants were informed. Additionally, weperformed Fisher’s exact tests for any phenotype reported by two or more participants with pathogenic
12/15
PeerJ PrePrints | https://dx.doi.org/10.7287/peerj.preprints.1426v1 | CC-BY 4.0 Open Access | rec: 12 Oct 2015, publ: 12 Oct 2015
mutations in BRCA1/2 and for any phenotype associated with a ClinVar condition for a pathogenic variant,with the exception of hereditary cancer-predisposing syndrome. We were unable to test for hereditarycancer-predisposing syndrome given the little familial information in the PGP dataset.
ACKNOWLEDGMENTSWe thank all members of the Personal Genome Project, Berkeley AMPLab, Global Alliance for Genomicsand Health (GA4GH), and Curoverse communities for their help and advice. In particular Madeleine PriceBall, Pete Estep, Frank Nothaft, Dave Patterson, Deanna Church and Heidi Rehm provided invaluablecomments and discussion that improved the manuscript.
REFERENCES1000GenomesProjectConsortium (2012). An integrated map of genetic variation from 1,092 human
genomes. Nature, 491:56–65.Abraham, G., Kowalczyk, A., Zobel, J., and Inouye, M. (2012). Performance and robustness of penalized
and unpenalized methods for genetic prediction of complex human disease. Genet Epidemiol, 37:184–195.
Angrist, M. and Cook-Deegan, R. (2014). Distributing the future: The weak justifications for keepinghuman genomic databases secret and the challenges and opportunities in reverse engineering them.Appl Transl Genom, 3:124–127.
Ball, M., Thakuria, J., Zaranek, A., Clegg, T., Rosenbaum, AM Wu, X., and et al (2012). A publicresource facilitating clinical use of genomes. Proc Natl Acad Sci USA, 109:11920–11927.
Botta, V., Louppe, G., Guerts, P., and Wehenkel, L. (2014). Exploiting snp correlations within randomforest for genome-wide association studies. PLoS One, 9:e93379.
Brenner, S. (2007). Common sense for our genomes. Nature, 449:783–784.Brooksbank, C., Bergman, M., Apweiler, R., Birney, E., and Thornton, J. (2014). The european bioinfor-
matics institute’s data resources 2014. Nucleic Acids Res, 42:D18–D25.Buck, S. (2015). Solving reproducibility. Science, 6242:1403.Chaisson, M., Huddleston, J., Dennis, M., Sudmant, P., Malig, M., Hormozdiari, F., and et al (2015).
Resolving the complexity of the human genome using single-molecule sequencing. Nature, 517:608–611.
Chen, Y.-K., Lin, C.-L., Cheng, F.-F., Sung, F.-C., and Kao, C.-H. (2013). Cancer risk in patients withhashimoto’s thyroiditis: a nationwide cohort study. Br J Cancer, 109:2496–2501.
Christley, S., Lu, Y., Li, C., and Xie, X. (2009). Human genomes as email attachments. Bioinformatics,25:274–275.
Church, D., Schneider, V., Steinberg, K., Schatz, M., Quinlan, A., Chin, C., and et al (2015). Extendingreference assembly models. Genome Biol.
Collins, F. and Varmus, H. (2015). A new initiative on precision medicine. N Engl J Med, 372:793–795.Danecek, P., Auton, A., Abecasis, G., Albers, C., Banks, E., DePristo, M., and et al (2011). The variant
call format and vcftools. Bioinformatics, 27:2156–2158.Deorowicz, S. and Grabowski, S. (2011). Robust relative compression of genomes with random access.
Bioinformatics, 27:2979–2986.Deorowicz, S. and Grabowski, S. (2013). Data compression for sequencing data. Algorithms Mol Biol.Dilthey, A., Cox, C., Iqbal, Z., Nelson, M., and McVean, G. (2015). Improved genome inference in the
mhc using a population reference graph. Nat Genet, 47:682–688.Durbin, R. (2014). Efficient haplotype matching and storage using the positional burrows-wheeler
transform (pbwt). Bioinformatics, 30:1266–1272.Ellingford, J., Sergouniotis, P., Lennon, R., Bhaskar, S., Williams, S., Hillman, K., and et al. (2015).
Pinpointing clinical diagnosis through whole exome sequencing to direct patient care: a case ofsenior-loken syndrome. Lancet, 385:1916.
Engel, C., Versmold, B., Wappenschmidt, B., Simard, J., Easton, D., Peock, S., and et al (2010).Association of the variants casp8 d302h and casp10 v410i with breast and ovarian cancer risk in brca1and brca2 mutation carriers. Cancer Epidemiol Biomarkers Prev, 19:2859–2868.
Fokkema, I., Taschner, P., Schaafsma, G., Celli, J., Laros, J., and Dunnen, J. (2011). Lovd v.2.0: The nextgeneration in gene variant databases. Hum Mutat, 32:557–563.
13/15
PeerJ PrePrints | https://dx.doi.org/10.7287/peerj.preprints.1426v1 | CC-BY 4.0 Open Access | rec: 12 Oct 2015, publ: 12 Oct 2015
Foley, S., Rios, J., Mgbemena, V., Robinson, L., Hampel, H., Toland, A., and et al (2015). Use of wholegenome sequencing for diagnosis and discovery in the cancer genetics clinic. EBioMedicine, 2:74–81.
Forbes, S., Beare, D., Gunasekaran, P., Leung, K., Bindal, N., Boutselakis, H., and et al (2015). Cosmic:exploring the world’s knowledge of somatic mutations in human cancer. Nucleic Acids Res, 43:D805–D811.
Frank, B., Hemminki, K., Wappenschmidt, B., Meindl, A., Klaes, R., Schmutzler, R., and et al (2006).Association of the casp10 v410i variant with reduced familial breast cancer risk and interaction withthe casp8 d302h variant. Carcinogenesis, 27:606–609.
Frank, T., Deffenbaugh, A., Reid, J., Hulick, M., Ward, B., Lingenfelter, B., and et al (2002). Clinical char-acteristics of individuals with germline mutations in brca1 and brca2: Analysis of 10,000 individuals. JClin Oncol, 20:1480–1490.
Fritz, M., Leinonen, R., Cochrane, G., and Birney, E. (2011). Efficient storage of high throughput dnasequencing data using reference-based compression. Genome Res, 21:734–740.
GA4GH (2015a). Ga4gh data working group [internet, cited 2015 july 13].GA4GH (2015b). Ga4gh beacon project [internet, cited 2015 july 16].Ginsburg, O., Kim-Sing, C., Foulkes, W., Ghadirian, P., Lynch, H., Sun, P., and et al (2010). Brca1 and
brca2 families and the risk of skin cancer. Fam Cancer, 9:489–493.Giollo, M., Minervini, G., Scalzotto, M., Leonardi, E., Ferrari, C., and Tosatto, S. (2015). Boogie:
Predicting blood groups from high throughput sequencing data. PLoS One, 10:e0124579.github (2015). Ga4gh schemas, issue 333 [internet, cited 2015 july 13].Glusman, G., Caballero, J., Mauldin, D., Hood, L., and Roach, J. (2011). Kaviar: an accessible system
for testing snv novelty. Bioinformatics, 27:3216–3217.Gonzalez-Recio, O. and Forni, S. (2011). Genome-wide prediction of discrete traits using bayesian
regressions and machine learning. Genet Sel Evol.Hajiloo, M., Sapkota, Y., Mackey, J., Robson, P., Greiner, R., and Damaraju, S. (2013). Ethnopred: a
novel machine learning method for accurate continental and sub-continental ancestry identification andpopulation stratification correction. BMC Bioinformatics, 14:61.
Haussler, D., Patterson, D., Diekhans, M., Fox, A., Jordan, M., Joseph, A., and et al (2012). A millioncancer genome warehouse. Technical Report UCB/EECS-2012-2011, EECS at University of Californiaat Berkeley.
Hodges, E., Xuan, Z., Balija, V., Kramer, M., Molla, M., Smith, S., and et al (2007). Genome-wide in situexon capture for selective resequencing. Nat Genet, 39:1522–1527.
Karolchik, D., Barber, G., Casper, J., Clawson, H., Cline, M., Diekhans, M., and et al (2014). The ucscgenome browser database: 2014 update. Nucleic Acids Res, 42:D764–D770.
Kelleher, J., Ness, R., and Halligan, D. (2013). Processing genome scale tabular data with wormtable.BMC Bioinformatics, 14.
Kohane, I. (2015). Ten things we have to do to achieve precision medicine. Science, 6243:37–38.Kourou, K., Exarchos, T., Exarchos, K., Karamouzis, M., and Fotiadis, D. (2014). Machine learning
applications in cancer prognosis and prediction. Comput Struct Biotechnol J, 13:8–17.Landrum, M., Lee, J., Riley, G., Jang, W., Rubinstein, W., Church, D., and et al (2014). Clinvar:
public archive of relationships among sequence variation and human phenotype. Nucleic Acids Res,42:D980–D985.
Layer, R., Kindlon, N., Karczewski, K., Exome Aggregation Consortium, E., and Quinlan, A. (2015).Efficient compression and analysis of large genetic variation datasets.
Lee, S., Park, S., Kim, H., Kim, J., Yu, D., and Lee, Y. (2015). Genomic diagnosis by whole genomesequencing in a korean family with atypical progeroid syndrome. J Dermatol.
Levy, S., Sutton, G., Ng, P., Feuk, L., Halpern, A., Walenz, B., and et al (2007). The diploid genomesequence of an individual human. PLoS Biol, 5:e254.
Levy-Lahad, E. and Friedman, E. (2007). Cancer risks among brca1 and brca2 mutation carriers. Br JCancer, 96:11–15.
Marcus, S., Lee, H., and Schatz, M. (2014). Splitmem: A graphical algorithm for pan-genome analysiswith suffix skips. Bioinformatics.
MatchmakerExchange (2015). Matchmaker exchange [internet, cited 2015 july 23].McNutt, M. (2014). Journals unite for reproducibility. Science, 6210:679.Mittag, F., Buechel, F., Saad, M., Jahn, A., Schulte, C., Bochdanovits, Z., and et al (2012). Use of
14/15
PeerJ PrePrints | https://dx.doi.org/10.7287/peerj.preprints.1426v1 | CC-BY 4.0 Open Access | rec: 12 Oct 2015, publ: 12 Oct 2015
support vector machines for disease risk prediction in genome-wide association studies: Concerns andopportunities. Hum Mutat, 33:1708–1718.
Mockler, T. and Ecker, J. (2005). Applications of dna tiling arrays for whole-genome analysis. Genomics,85:1–15.
Muenz, M., Ruark, E., Renwick, A., Ramsay, E., Clarke, M., Mahamdallie, S., and et al (2015). Csn andcava: variant annotation tools for rapid, robust next-generation sequencing analysis in the clinic.
Oesper, L., Ritz, A., Aerni, S., Drebin, R., and Raphael, B. (2012). Reconstructing cancer genomes frompaired-end sequencing data. BMC Bioinformatics, 13:S10.
Ornella, L., Perez, P., Tapia, E., Gonzalez-Camacho, J., Burgueno, J., Zhang, X., and et al (2014).Genomic-enabled prediction with classification algorithms. Heredity (Edinb), 112:616–626.
Pedregosa, F., Varoquaux, G., Gramfort, A., Michel, V., Thirion, B., Grisel, O., and et al (2011). Scikit-learn: Machine learning in python. J Mach Learn Res, 12:2825–2830.
Pirooznia, M., Seifuddin, F., Judy, J., Mahon, P., Consortium, T. B. G. S. B., Potash, J., and et al (2012).Data mining approaches for genome-wide association of mood disorders. Psychiatr Genet, 22:55–61.
Purcell, S., Neale, B., Todd-Brown, K., Thomas, L., Ferreira, M., Bender, D., and et al (2007). Plink:a toolset for whole-genome association and population-based linkage analysis. Am J Hum Genet,81:559–575.
Rahn, R., Weese, D., and Reinert, K. (2014). Journaled string tree - a scalable data structure for analyzingthousands of similar genomes on your laptop. Bioinformatics, 30:3499–3505.
Rebbeck, T., Mitra, N., Wan, F., Sinilnikova, O., Healey, S., McGuffog, L., and et al (2015). Associationof type and location of brca1 and brca2 mutations with risk of breast and ovarian cancer. JAMA,313:1347–1361.
Reese, M., Moore, B., Batchelor, C., Salas, F., Cunningham, F., Marth, G., and et al (2010). A standardvariation file format for human genome sequences. Genome Biol, 11:R88.
Rehm, H., Berg, J., Brooks, L., Bustamante, C., Evans, J., Landrum, M., and et al (2015). Clingen – theclinical genome resource. N Engl J Med, 372:2235–2242.
Roshan, U., Chikkagoudar, S., Wei, Z., Wang, K., and Hakonarson, H. (2011). Ranking causal variantsand associated regions in genome-wide association studies by the support vector machine and randomforest. Nucleic Acids Res, 39:e62.
Sarlis, N., Gourgiotis, L., Pucino, F., and Tolis, G. (2002). Lack of association between hashimoto’sthyroiditis and breast cancer: a quantitative research synthesis. Hormones (Athens), 1:35–41.
Sboner, A. and Elemento, O. (2015). A primer on precision medicine informatics. Brief Bioinform.Snoek, J., Adams, R., and Larochelle, H. (2012). Nonparametric guidance of autoencoder representations
using label information. J Mach Learn Res, 13:2567–2588.Soden, S., Saunders, C., Willig, L., Farrow, E., Smith, L., Petrikin, J., and et al (2014). Effectiveness
of exome and genome sequencing guided by acuity of illness for diagnosis of neurodevelopmentaldisorders. Sci Transl Med.
Wittelsbuerger, U., Pfeifer, B., and Lercher, M. (2014). Whopgenome: high-speed access to whole-genomevariation and sequence data in r. Bioinformatics.
Yoon, D., Kim, Y., and Park, T. (2012). Phenotype prediction from genome-wide association studies:application to smoking behaviors. BMC Syst Biol.
Zhang, J., Baran, J., Cros, A., Guberman, J., Haider, S., Hsu, J., and et al (2011). International cancergenome consortium data portal–a one-stop shop for cancer genomics data. Database (Oxford).
15/15
PeerJ PrePrints | https://dx.doi.org/10.7287/peerj.preprints.1426v1 | CC-BY 4.0 Open Access | rec: 12 Oct 2015, publ: 12 Oct 2015