tier 3 mesocosms brock - european food safety authority
TRANSCRIPT
I t d ti t th Ti 3 ff t d i kIntroduction to the Tier 3 effect and risk assessment (model ecosystem approach) in
the new Aquatic Guidance DocumentTheo Brock Alterra Wageningen UR (PPR Panel Member)Theo Brock, Alterra, Wageningen UR (PPR Panel Member)
1Info Session on Aquatic Guidance 6/7 November 2013

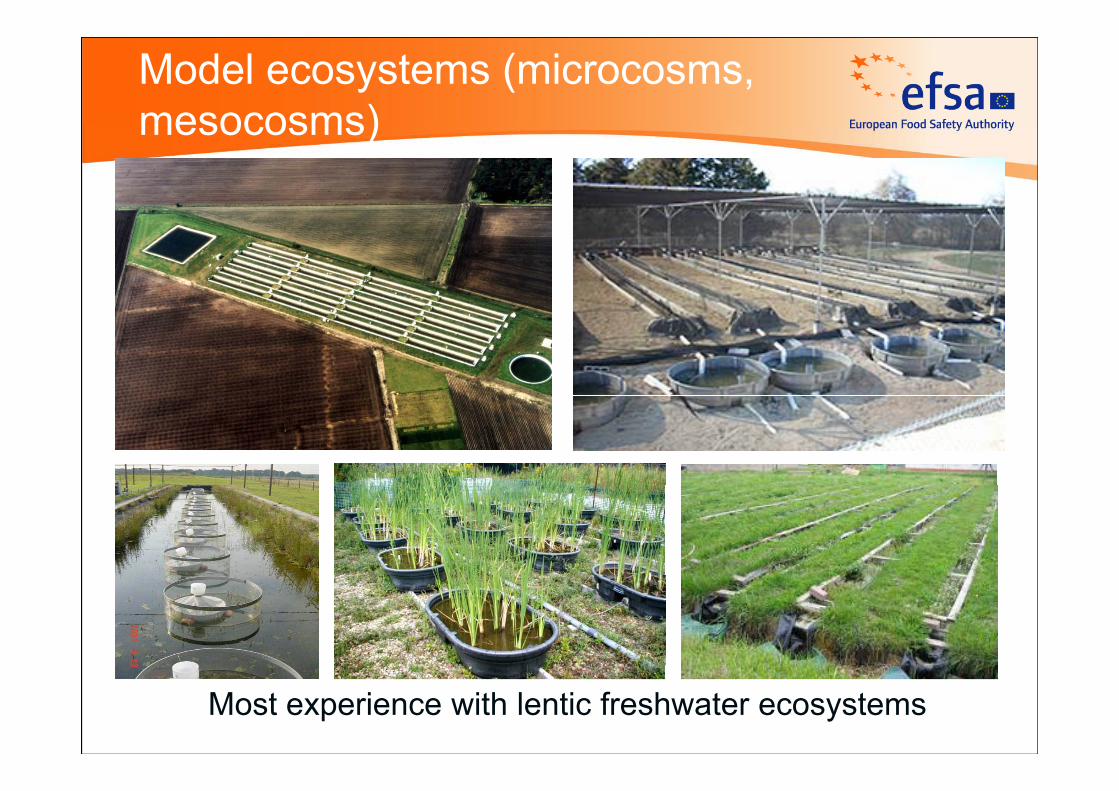
Model ecosystems (microcosms, mesocosms)
• Constructed artificially with samples from, or
mesocosms)
portions of, natural ecosystems
• Housed in artificial containers or enclosuresHoused in artificial containers or enclosures
• Reduction in size and complexity when d ith t l tcompared with natural ecosystems
• Include an assemblage of organismsInclude an assemblage of organisms representing several trophic levels (primary producers, herbivores, carnivores, decomposers)
• Community should be “adapted” to and in “equilibrium” with its ambient environmentequilibrium with its ambient environment
2
Model ecosystems (microcosms, mesocosms)mesocosms)
3Most experience with lentic freshwater ecosystems

Model ecosystems versus natural ecosystemsecosystems
PROS• Experimental control and replication (exclusion
confounding factors; statistical evaluation)• Their flexibility make them useful to study the fate and
effects of different types of PPPs and exposure regimes• Less ethical to perform tests in natural ecosystemsCONS• No perfect analogs of edge-of-field ecosystems (e.g. lack
of larger predators; wall effects)• A microcosm/mesocosm test systems represent one
type of edge-of-field community only
4

Cause-and-effect relationships in micro/mesocosmsmicro/mesocosms
5

Cause-and-effect relations in micro/mesocosmsmicro/mesocosms
Direct or primary effects• Toxicological effects on abundance/biomass of potentiallyToxicological effects on abundance/biomass of potentially
sensitive populations (link to protection goals)• Laboratory toxicity tests facilitate the interpretation (link to lower
tiers)Indirect or secondary effect• Ecosystem/community changes that result from a reduction of
(toxicant) susceptible populations (link to food web ecology)Delayed effects and biological recoveryDelayed effects and biological recovery• Long-term observations to monitor possible chronic effects
(including latency) effects and recovery of affected populations(including latency) effects and recovery of affected populations (link to protection goals)
Community level responses
6• Functional endpoints• Multivariate or trait-based approaches

Herbicide example (Brock et al 2004)
Functional endpoint more sensitive and indirect effects more persistent

Designing mico-/mesocosm experimentsexperiments
1. Establishment of a representative aquatic p qcommunity
2. The appropriate exposure regime to simulate2. The appropriate exposure regime to simulate3. Exposure regime and replicate test systems per
treatmenttreatment4. Selection of measurement endpoints5. Statistical and ecological evaluation
G id th d t d i t t ti f iGuidance on the conduct and interpretation of micro-/mesocom tests: SETAC (Arnold et al 1991; Hill et al. 1993; Campbell et al 1999; Giddings et al 2002) OECD (2006)Campbell et al. 1999; Giddings et al 2002), OECD (2006) and RIVM (De Jong et al. 2008) 8

Aquatic community in mesocosms (new requirements)(new requirements)Ecological Threshold Option• ≥ 8 different populations of sensitive taxonomic
group(s) present, for which statistical evaluation is possible (MDD)
Identification of sensitive taxonomic group(s):Identification of sensitive taxonomic group(s):• Lower Tier information• Read-across information for substances with a
similar MoA– Insecticides (insects; crustaceans)– Herbicides (algae; macrophytes)– Fungicides (often wide array of taxa)
9

Aquatic community in mesocosms (new requirements)(new requirements)Ecological Recovery Option• Populations of sensitive taxonomic group(s) for
which statistical evaluation is possible also comprise vulnerable taxa
Identification of vulnerable taxa• Requires ecological scenarios for edge-of-field
surface waterssurface waters– Length life cycle (e.g. univoltine insects)– Low dispersal ability (e g macro-crustaceans in– Low dispersal ability (e.g. macro-crustaceans in
isolated experimental ponds) – Slow growth rate (e.g. certain rooted submergedSlow growth rate (e.g. certain rooted submerged
macrophytes) 10

Chlorpyrifos exp.: sensitivity and recovery (Van den Brink et al 1996)recovery (Van den Brink et al. 1996)
11Rate of recovery is affected by number of generations per year (Appendix D of AGD provides life cycle information)

Selecting the appropriate exposure regime (lessons from ELINK)regime (lessons from ELINK)• The exposure regime
i l t d i t t tsimulated in test system should be realistic to worst-case relative to predictedcase relative to predicted exposure profile (e.g. FOCUS sw))
• A repeated pulse exposure needs to be tested if the predicted pulses in the field exposure profile are considered to be toxicologically dependent
• Minimum number of pulses to be tested may be informed by the duration of the chronic test of the Tier-1 species that triggered the risk (time to onset of effects)E i t l d i ith f bl
12
• Exposure-response experimental design with preferably five or more concentrations (to derive ETO & ERO RAC)

Statistical evaluation (new requirements)(new requirements)
Minimum Detectable Difference (MDD) should be ( )reported in concert with NOEC/LOEC values
Geometric mean abundance of Daphnia galeata
day Controls 2 µg/L 6 µg/L 18 µg/L 54 µg/L 162 µg/L Williams MDD% ‐5 94.3 93.3 88.8 139.3 86.2 108.5 ‐ NOEC>=162 µg/L (incr.) 40.9 3 121 1 131 2 97 2 158 7 87 9 16 0 * NOEC=54 µg/L (decr ) 42 63 121.1 131.2 97.2 158.7 87.9 16.0 NOEC=54 µg/L (decr.) 42.6 9 114.0 107.4 32.9 49.2 26.4 1.1 * NOEC=18 µg/L (decr.) 70.5
23 98.1 142.1 143.6 147.9 36.4 2.6 * NOEC=18 µg/L (decr.) 44.4 37 50.2 44.0 49.7 49.2 42.7 10.0 * NOEC=54 µg/L (decr.) 68.4 51 35.0 50.2 28.3 45.4 43.2 16.6 ‐ NOEC>=162 µg/L (decr.) 57.6 65 35.0 87.9 29.2 32.9 108.5 18.6 ‐ NOEC>=162 µg/L (decr.) 67.2 79 54.9 122.3 39.1 66.4 218.5 45.8 ‐ NOEC>=162 µg/L (decr.) 82.9
The MDD needs to be below 100% to allow a statistical evaluation on treatment-related declines in abundance, and subsequent recovery
13
and subsequent recovery.The lower the MDD the larger is the power of the test.

Statistical evaluation (new requirements)(new requirements)
Minimum Detectable Difference (MDD)( )Geometric mean abundance of Stylaria lacustris
day Controls 2 µg/L 6 µg/L 18 µg/L 54 µg/L 162 µg/L Williams MDD% y µg/ µg/ µg/ µg/ µg/‐5 7.9 5.0 13.8 15.3 6.1 6.2 ‐ NOEC>=162 µg/L (incr.) 94.0 9 2.5 2.6 2.1 2.0 1.6 1.4 ‐ NOEC>=162 µg/L (decr.) 107.1
23 5.3 4.5 5.3 6.0 3.8 2.4 * NOEC>=18 µg/L (decr.) 71.9 37 2.1 3.1 3.2 4.2 2.3 2.0 ‐ NOEC>=162 µg/L (decr.) 104.9 51 0.5 1.0 1.5 2.2 0.5 0.0 ‐ NOEC>=162 µg/L (decr.) 173.2 65 1.7 0.4 1.7 1.0 6.0 0.0 ‐ NOEC>=162 µg/L (decr.) 114.8 79 0 8 1 0 1 5 0 4 5 2 1 4 NOEC> 162 µg/L (incr ) 144 2
If the MDD is consistently larger than 100% the statistical
79 0.8 1.0 1.5 0.4 5.2 1.4 ‐ NOEC>=162 µg/L (incr.) 144.2
power is too low to derive firm conclusions on concentration-response relationships, including recovery
14
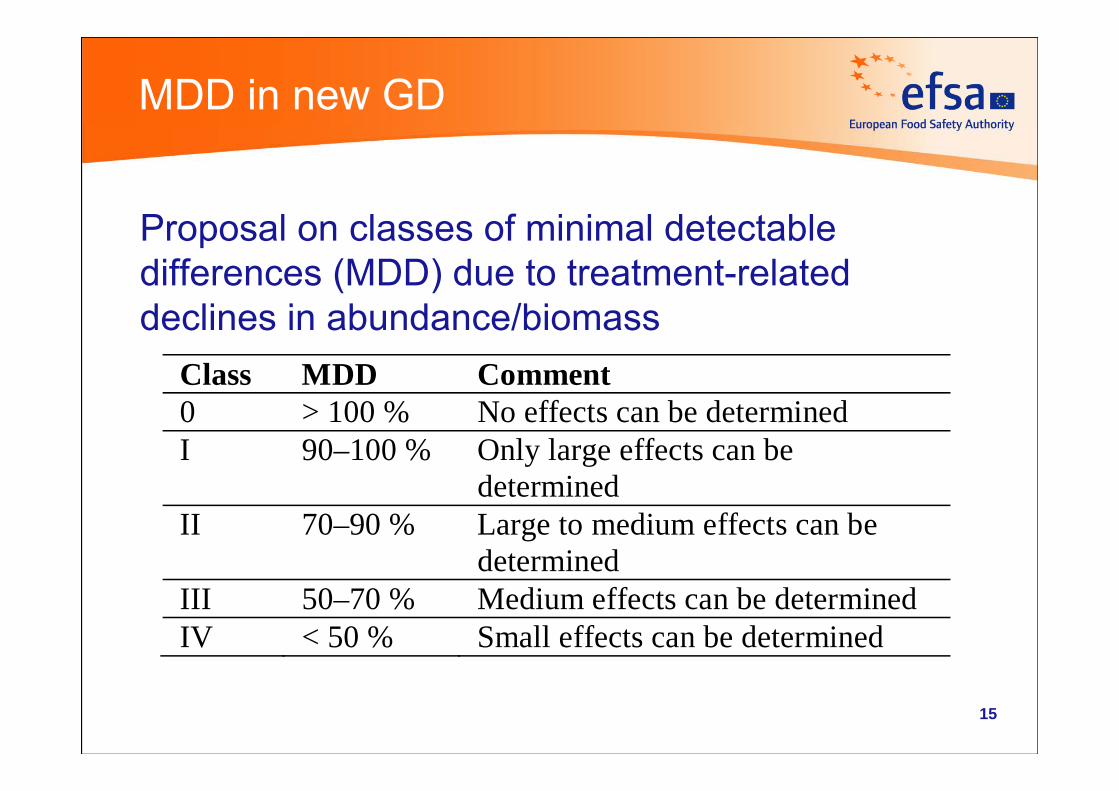
MDD in new GD
P l l f i i l d t t blProposal on classes of minimal detectable differences (MDD) due to treatment-related d li i b d /bideclines in abundance/biomass
Class MDD Comment 0 > 100 % No effects can be determinedI 90–100 % Only large effects can be
determineddetermined II 70–90 % Large to medium effects can be
determined III 50–70 % Medium effects can be determined IV < 50 % Small effects can be determined
15

New Effect class 0 in AGDEvaluation of different measurement endpoints
Effect class 0: Treatment effects cannot be evaluatedEffect class 1: No treatment-related effects demonstratedEffect class 2: Slight effects (LOEC on individual sampling)Effect class 3A: Pronounced short term effects (< 8 weeks)Effect class 3B: Pronounced effects and recovery within 8
weeks post last applicationEffect class 4: Pronounced effect in short-term studyEffect class 5A: Pronounced long-term effects followed by
recoveryEffect class 5B: Pronounced long-term effects no recoveryOverall assessment on basis of most sensitive endpoints
16

RAC derivation from micro-/mesocosms/mesocosms
Ecological threshold optionAF for ETO-RAC derivation
Field exposure concentration to ith th RACRACsw derivation compare with the RACsw
Effect class 1 concentration
2 Acute risk: PECsw;maxChronic risk: PEC or PECconcentration Chronic risk: PECsw;max or PECsw;twa
Effect class 2 concentration
2 – 3 Acute risk: PECsw;maxChronic risk: PEC or PEC tconcentration Chronic risk: PECsw;max or PECsw;twa
Effect class 1 = no treatment-related effect on sensitive endpointsEffect class 2 = slight effect (isolated sampling) on most sensitive endpointg ( p g) p
AF for ERO-RAC d i ti
Field exposure concentration to Ecological recovery option
RACsw derivation compare with the RACsw
Effect class 3A t ti
3 – 4 Acute risk: PECsw;maxCh i i k PEC PEC
1717
concentration Chronic risk: PECsw;max or PECsw;twa
Effect class 3A = pronounced short-term effect on most sensitive endpoint, total effect period < 8 weeks

Motivation of AFs (Appendix E)
E Eff t Eff t Eff t Eff t T f t t R f
Chronic exposure to carbendazimExposureregime
Effectclass 1
Effectclass 2
Effectclass 3
Effectclass 4
Type of test system
Reference;Country
Chronic 3 3 - - 33 0 Indoor Cuppen et alChronic 3.3μg/L
33.0μg/L
Indoor microcosms
Cuppen et al. 2000; Van den Brink et al. 2000; NL
Chronic 2.6μg/L
- - 26.4μg/L
Outdoor microcosms
Daam et al. 2009aThailandThailand
Chronic 2.2μg/L
- - 20.7μg/L
Outdoor mesocosms
Slijkerman et al. 2004, NL
Effect class 1 concentrations of most sensitive endpoint18
Effect class 1 concentrations of most sensitive endpoint fairly similar between different micro-/mesocosms studies

Motivation of AFs (Appendix E)
LocationType of test systemClass 3AClass 2Class 1Application LocationType of test systemClass 3AClass 2Class 1Application
Short-term exposure to chlorpyrifos
AustraliaPusey et al. 1994
Experimental streams(5.0 μg/L)-0.1 μg/L6 h pulse
LocationReference
Type of test systemClass 3A LOEC
Class 2LOEC
Class 1NOEC
Application regime
AustraliaPusey et al. 1994
Experimental streams(5.0 μg/L)-0.1 μg/L6 h pulse
LocationReference
Type of test systemClass 3A LOEC
Class 2LOEC
Class 1NOEC
Application regime
NetherlandsVan den Brink et al 1996
Experimental ditches<0.9 μg/L 0.1 μg/L-Single
USA, KansasBieveret al. 1994
Outdoor microcosms1.0 μg/L 0.3 μg/L 0.1 μg/L Single
NetherlandsVan den Brink et al 1996
Experimental ditches<0.9 μg/L Single
USA, KansasBieveret al. 1994
Outdoor microcosms1.0 μg/L 0.3 μg/L 0.1 μg/L Single
NetherlandsLab microcosms Warm,<1.0 μg/L-0.1 μg/LSingle
NetherlandsVan Wijngaarden et al. 2005
Lab microcosms Cool, Mesotr.
1.0 μg/L-0.1 μg/LSingleVan den Brink et al. 1996
NetherlandsLab microcosms Warm,<1.0 μg/L-0.1 μg/LSingle
NetherlandsVan Wijngaarden et al. 2005
Lab microcosms Cool, Mesotr.
1.0 μg/L-0.1 μg/LSingleVan den Brink et al. 1996
SpainLópez-Mancisidoret al. 2005
Outdoor mesocosms1.0 μg/L-0.1 μg/LSingle
NetherlandsVan Wijngaarden et al. 2005
Lab microcosms Warm, Eutrophic
1.0 μg/L0.1 μg/LSingle
SpainLópez-Mancisidoret al. 2005
Outdoor mesocosms1.0 μg/L-0.1 μg/LSingle
NetherlandsVan Wijngaarden et al. 2005
Lab microcosms Warm, Eutrophic
1.0 μg/L0.1 μg/LSingle
USA, MinnesotaSiefertet al 1989
Pond enclosures0.5 μg/L --Single
ThailandDaamet al. 2008
Outdoor microcosms 1.0 μg/L-0.1 μg/LSingle
USA, MinnesotaSiefertet al 1989
Pond enclosures0.5 μg/L --Single
ThailandDaamet al. 2008
Outdoor microcosms 1.0 μg/L-0.1 μg/LSingle
19
Siefertet al. 1989Siefertet al. 1989
Threshold levels for effects can be extrapolated with lower uncertainty than responses caused by higher exposures

ERO-RAC derivation
If study addressed lower number of l th t i fi ldpulse exposures than present in field
exposure profile• Plot ETO-RAC and provisional p
ERO-RAC on field exposure profile
• Consider exposure period above• Consider exposure period above ETO-RAC (ecological threshold)
• Assess the total effect period that might be expected for the taxa at risk
• If effect period is acceptable,If effect period is acceptable, upgrade the provisional ERO-RAC to an official ERO-RAC
20

Thank you !
21Info Session on Aquatic Guidance 6/7 November 2013