tidy data with - amelia mcnamara · adapted from master the tidyverse, cc by rstudio 2. composable...
TRANSCRIPT

Adapted from Master the Tidyverse, CC BY RStudio
Tidy Data with
Hadley Wickham &Garrett Grolemund
R for Data Science VISUALIZE, MODEL, TRANSFORM, TIDY, AND IMPORT DATA
In R4DS
Tidy Data

Recovering from Git(Hub) failure Scenario: You pull and get a merge conflict.
What's the problem?GitHub can't figure out how to reconcile diffs.
Resolve the conflicts. Or abort ... and come back later.

Let's create this situation. Make sure local Git pane is clear. Make sure local and remote are synced (push, pull).

Edit 05-Tidy.Rmd in your RStudio (change my name to your name). Save your change and commit it . Go to Github and make a conflicting edit to 05-Tidy.Rmd (delete the line with the name). Save your change and commit on Gitub. Try to push. You will fail. Try to pull. You will fail. All is fail.


Adapted from Master the Tidyverse, CC BY RStudio
Import Tidy
Visualize
Transform
Model Communicate
Program
(Applied) Data Science

Tidy tools

Adapted from Master the Tidyverse, CC BY RStudio
Tidy tools
Functions are easiest to use when they are:
1. Simple - They do one thing, and they do it well 2. Composable - They can be combined with other functions
for multi-step operations 3. Smart - They can use R objects as input.
Tidy functions do these things in a specific way.

Adapted from Master the Tidyverse, CC BY RStudio
1. Simple - They do one thing, and they do it well
filter() - extract cases arrange() - reorder cases group_by() - group cases select() - extract variables mutate() - create new variables summarise() - summarise variables / create cases

Adapted from Master the Tidyverse, CC BY RStudio
2. Composable - They can be combined with other functions for multi-step operations
%>%
babynames mutate( , percent = prop * 100)
Each dplyr function takes a data frame as its first argument and returns a data frame. As a result, you can directly pipe the output of one function into the next.

"Data are not just numbers, they are numbers with a context."
- George Cobb and David Moore (1997)

ConsiderWhat are the variables in this data set?
table1

ConsiderWhat are the variables in this data set?
table2

table2 isn't tidy contains two variables

"Data comes in many formats, but R prefers just one: tidy data. "
- Garrett Grolemund

Tidy datacountry year cases pop
Afghanistan 1999 745 19987071
Afghanistan 2000 2666 20595360
Brazil 1999 37737 172006362
Brazil 2000 80488 174504898
China 1999 212258 1272915272
China 2000 213766 1280428583
A data set is tidy iff:
1. Each variable is in its own column
2. Each case is in its own row
3. Each value is in its own cell

Your Turn 1
Is bp_systolic tidy? What are the variables?

Your Turn 1
Is bp_systolic tidy? What are the variables?
Variables:• subject• time• systolic blood pressure

Adapted from Master the Tidyverse, CC BY RStudio
bp_systolic2 is tidy

Your Turn 2
Using bp_systolic2 with group_by() and summarise():
• Find the average systolic blood pressure for each subject
• Find the last time each subject was measured

Adapted from Master the Tidyverse, CC BY RStudio
bp_systolic2 %>% group_by(subject_id) %>% summarise(avg_sys = mean(systolic), last_measurement = max(time))
# A tibble: 3 x 3 subject_id avg_sys last_measurement <dbl> <dbl> <dbl>1 1 120. 32 2 128 23 3 141 1

"Tidy data sets are all alike; but every messy data set is messy in its own way."
- Hadley Wickham

tidyr

Adapted from Master the Tidyverse, CC BY RStudio
tidyr
A package that reshapes the layout of tabular data.
Adapted from Master the Tidyverse, CC BY RStudio
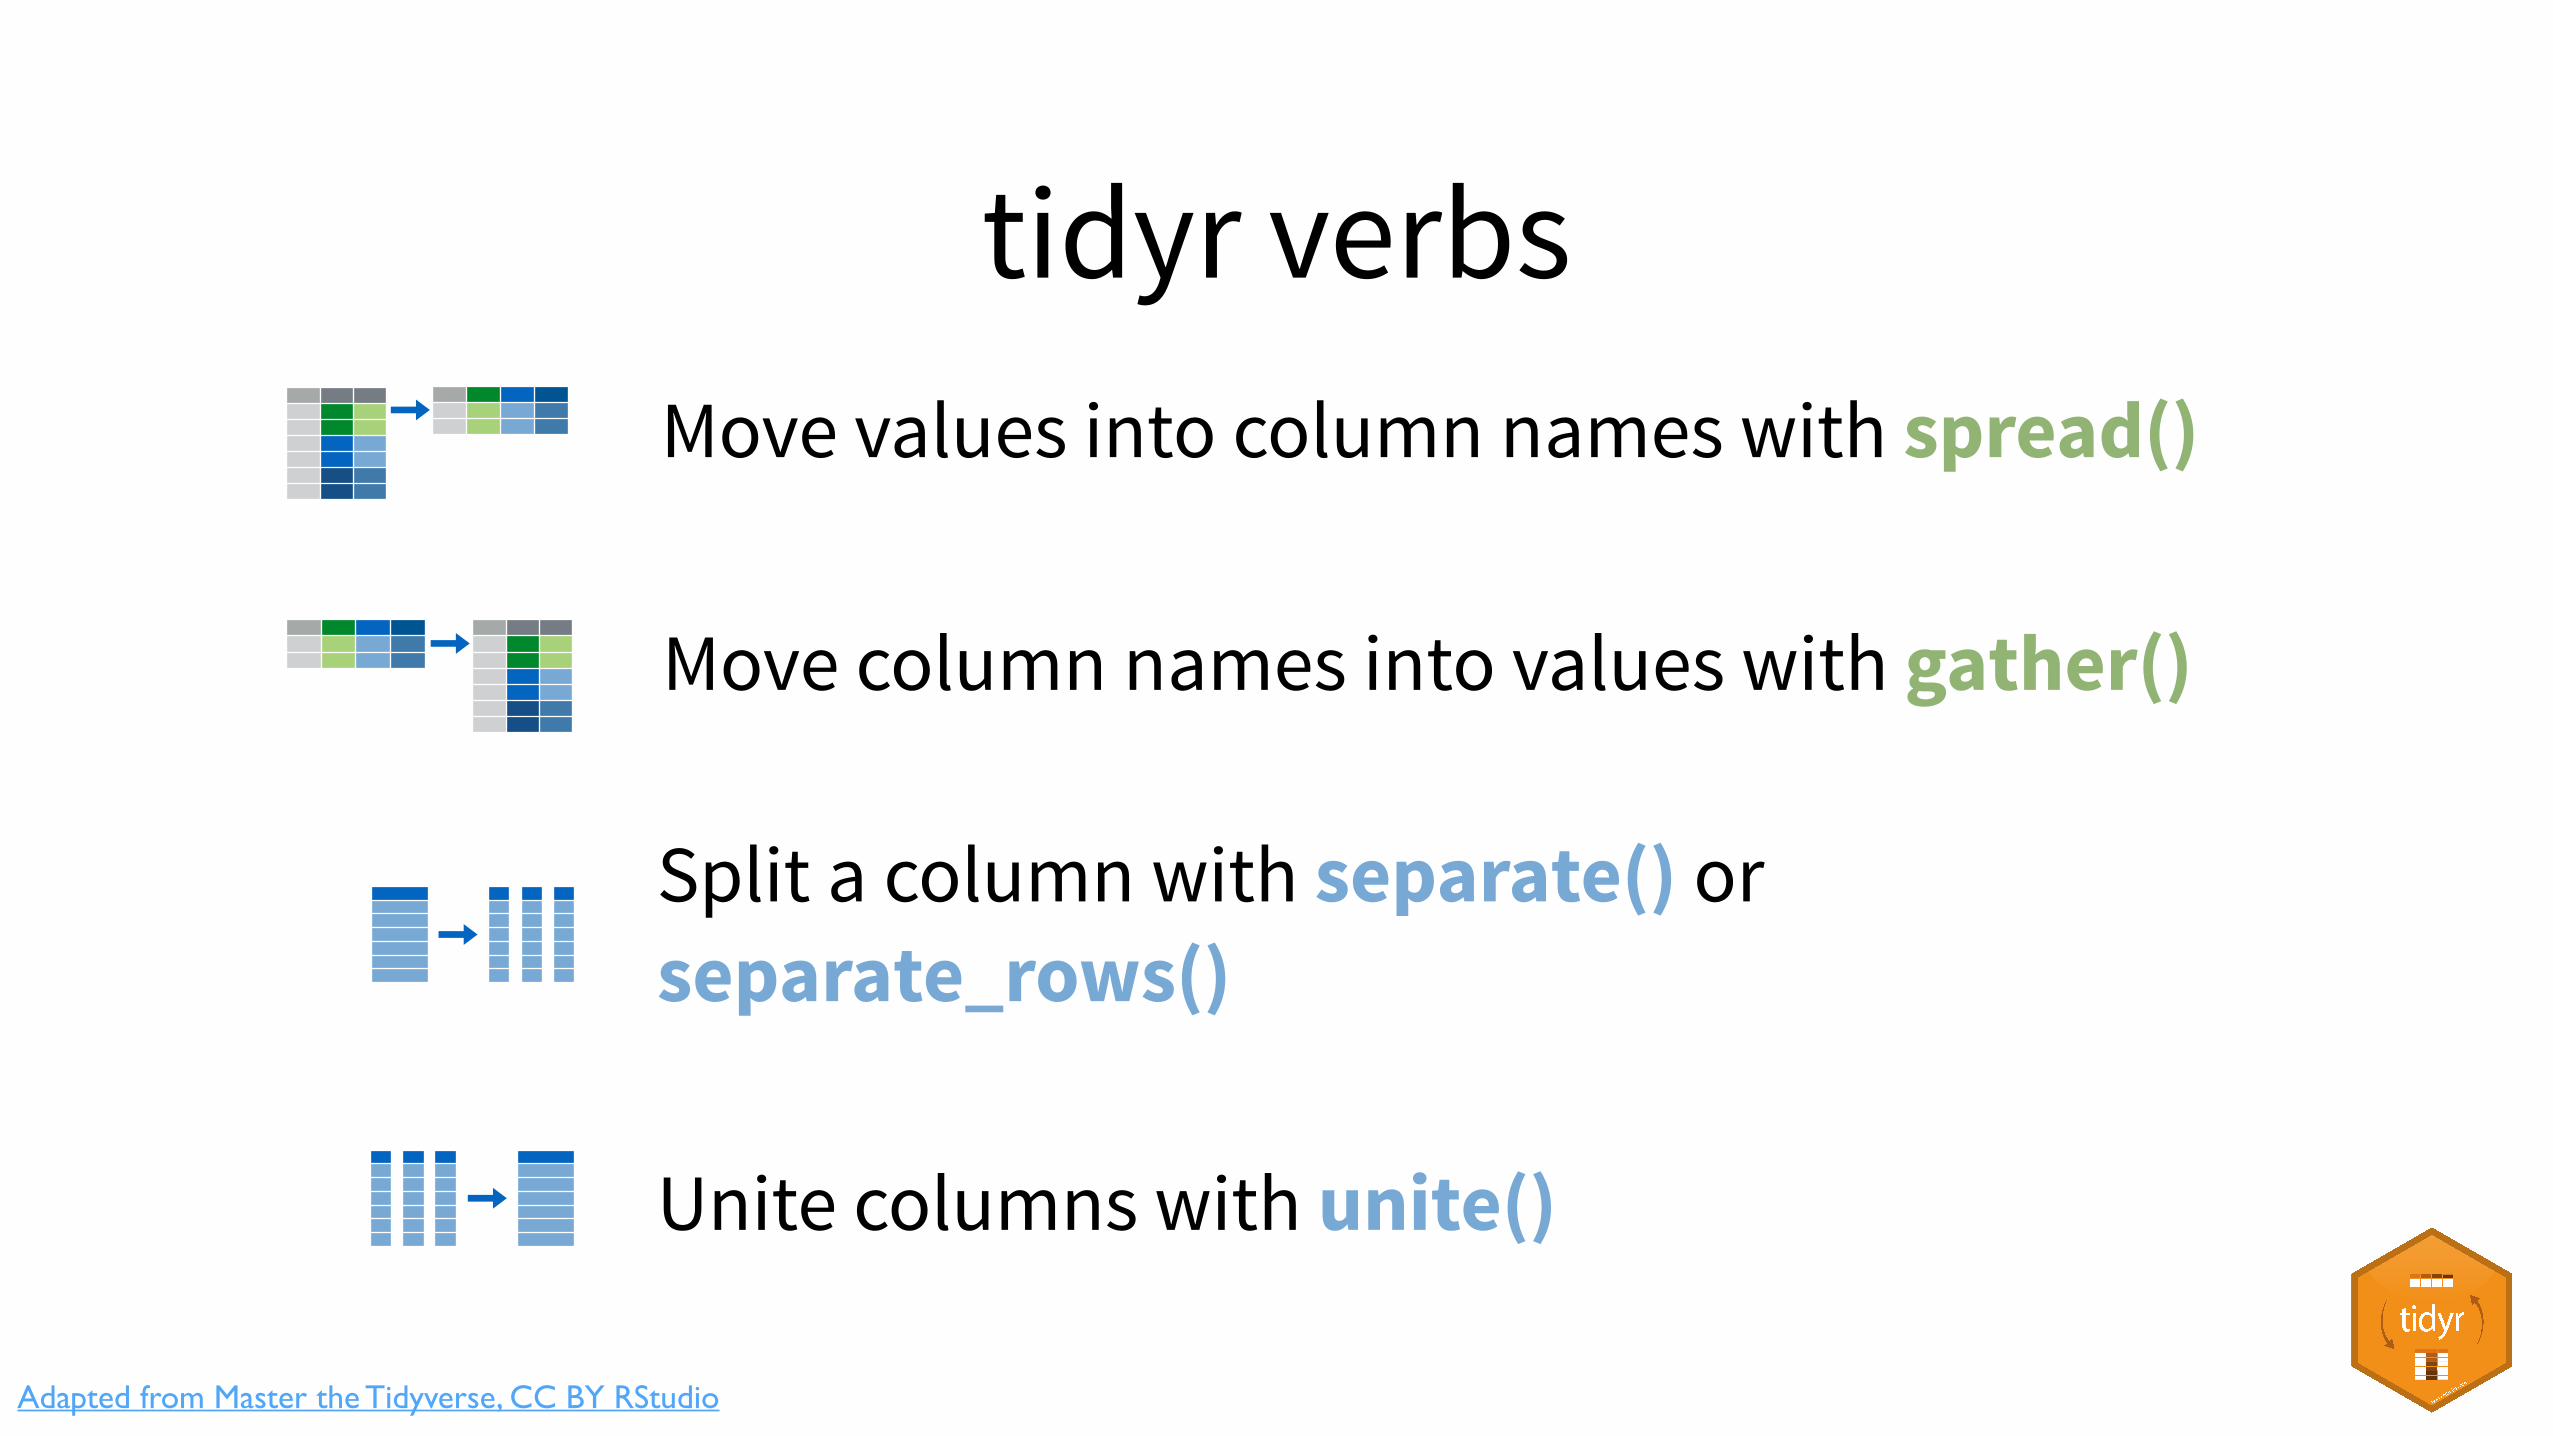
tidyr verbs
p10071009 wwp1009p1009A1005A1013A1010A1010Move column names into values with gather()
p10071009wwp1009p1009A1005A1013A1010A1010Move values into column names with spread()
Split a column with separate() or separate_rows()
w100510051005100510051005w100510051005100510051005w100510051005100510051005w100510051005100510051005
Unite columns with unite()w100510051005100510051005w100510051005100510051005w100510051005100510051005w100510051005100510051005

gather()

Adapted from Master the Tidyverse, CC BY RStudio
Toy data

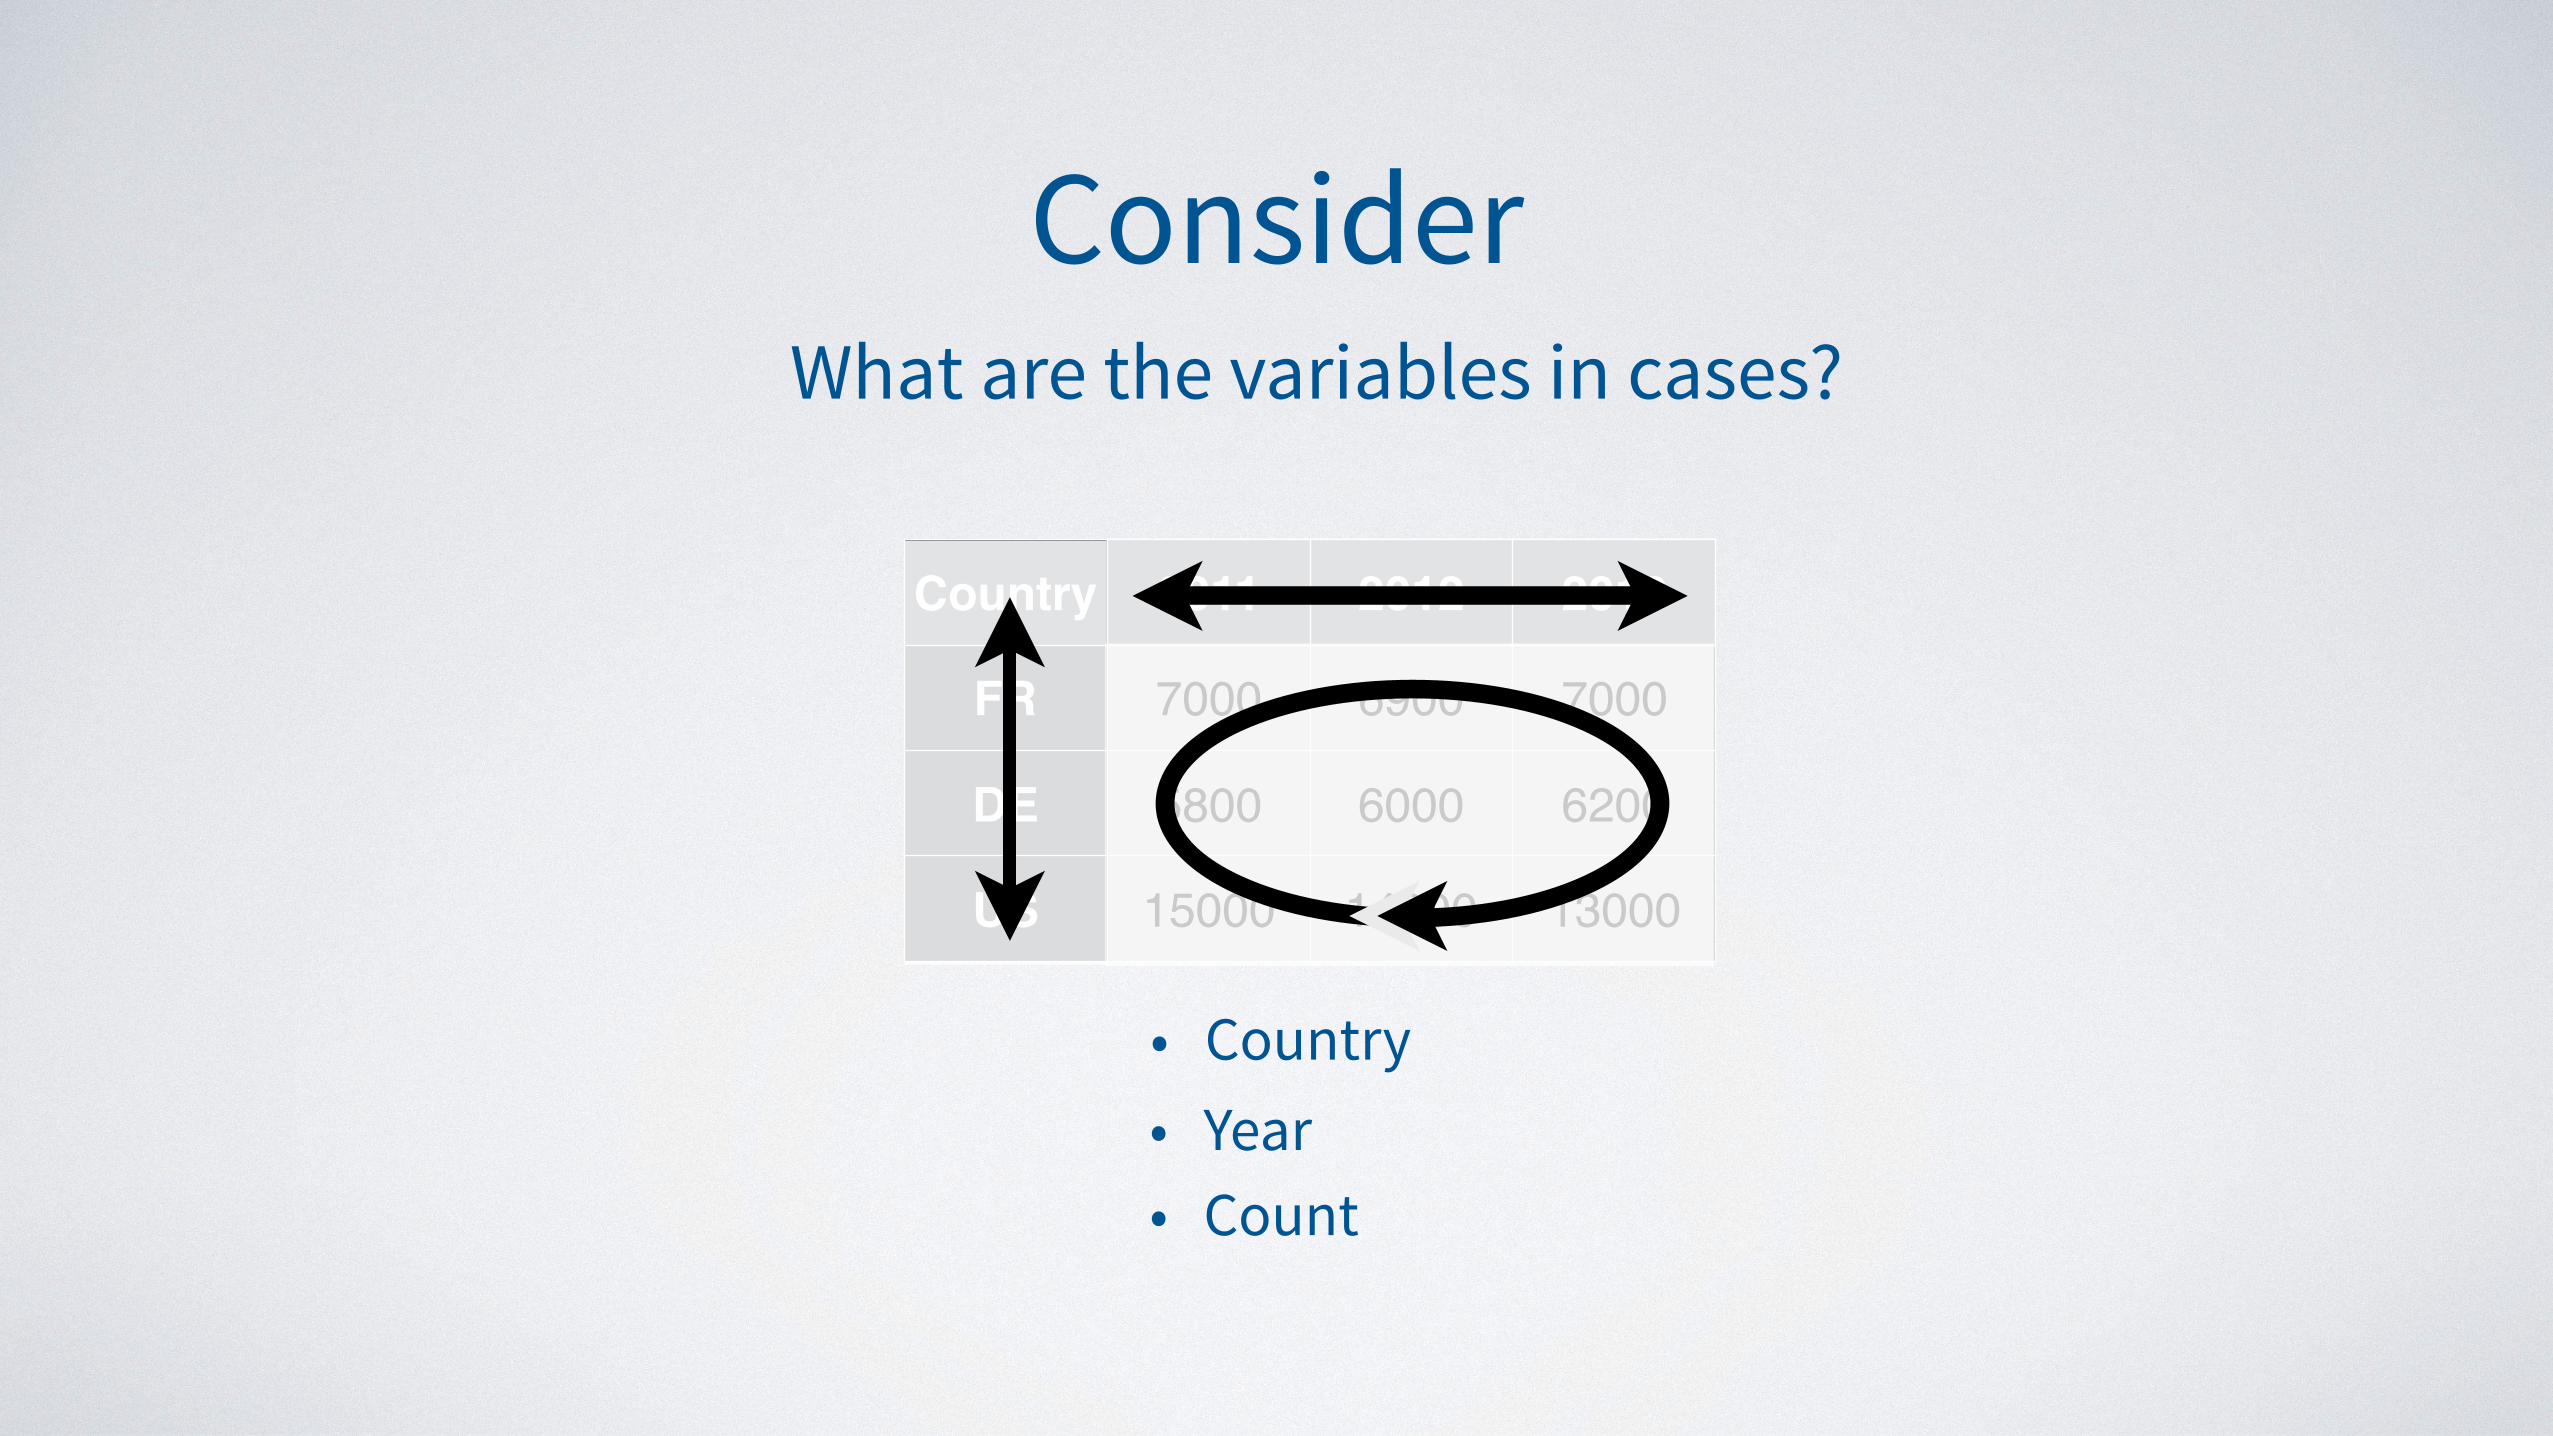
ConsiderWhat are the variables in cases?
Country 2011 2012 2013
FR 7000 6900 7000
DE 5800 6000 6200
US 15000 14000 13000
ConsiderWhat are the variables in cases?
Country 2011 2012 2013
FR 7000 6900 7000
DE 5800 6000 6200
US 15000 14000 13000
• Country• Year• Count

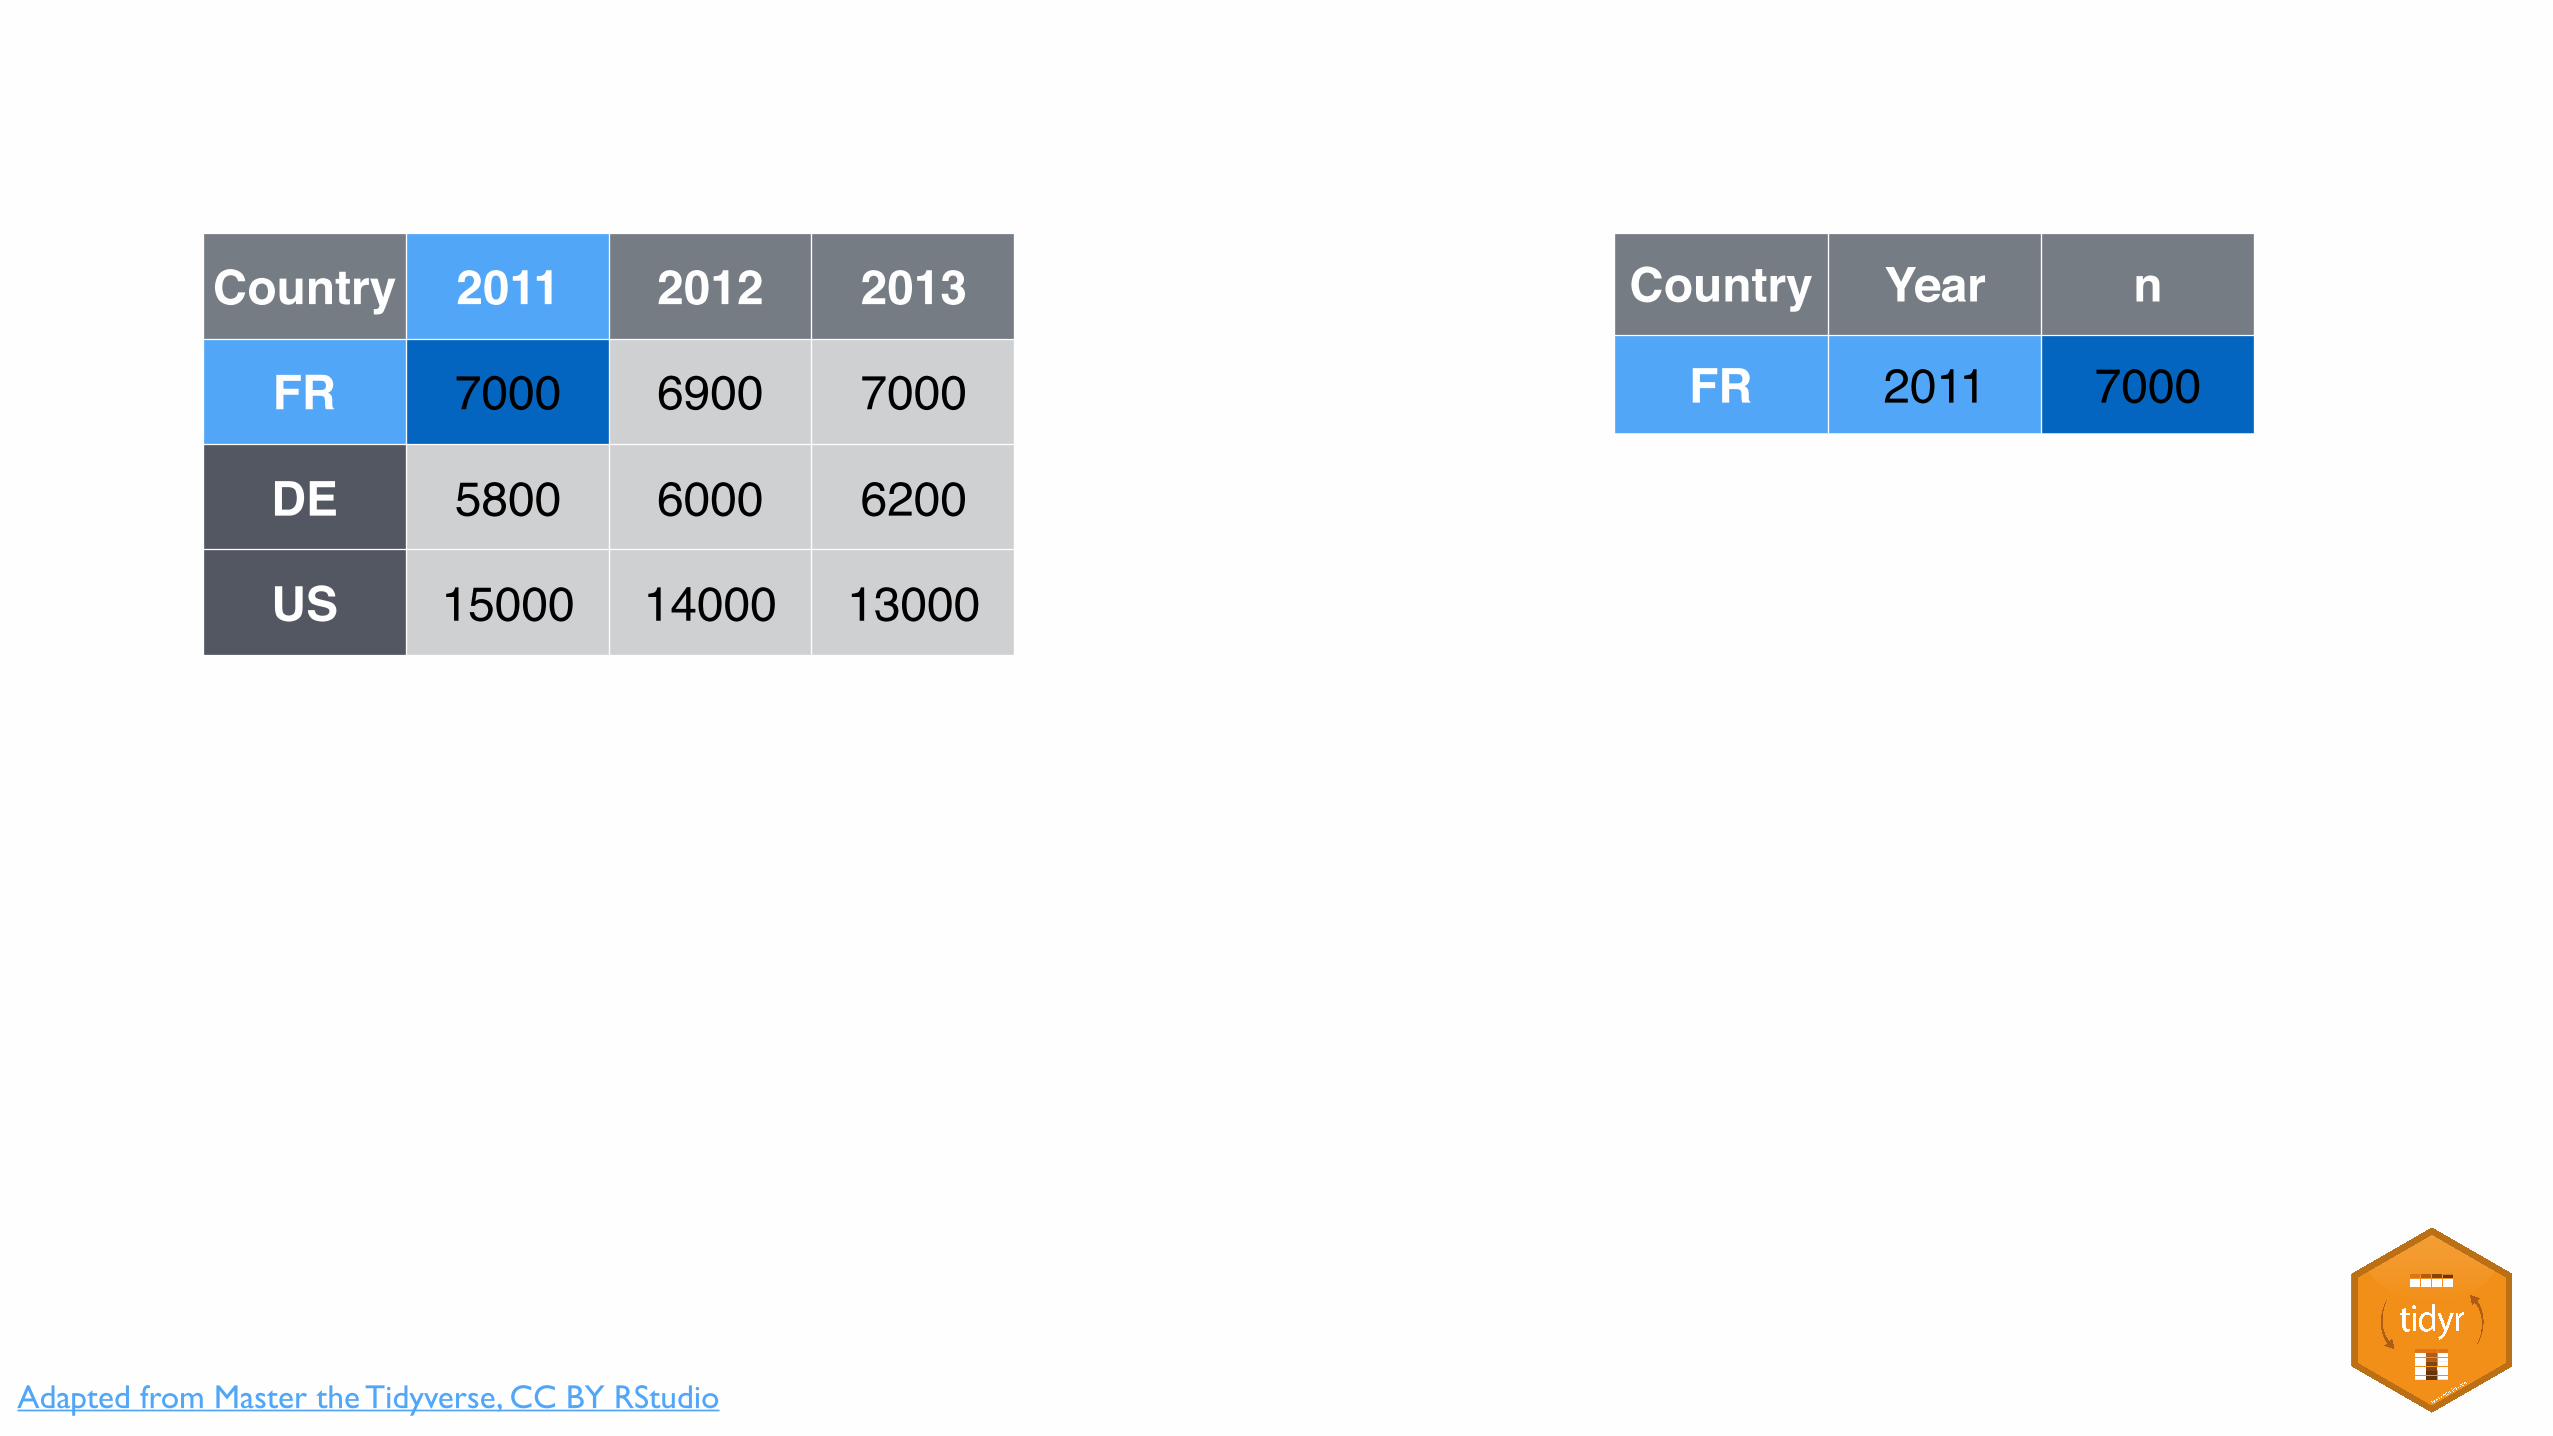
Your Turn 3On a sheet of paper, draw how the cases data set would look if it had the same values grouped into three columns: country, year, n
Country 2011 2012 2013
FR 7000 6900 7000
DE 5800 6000 6200
US 15000 14000 13000

Adapted from Master the Tidyverse, CC BY RStudio
Country 2011 2012 2013
FR 7000 6900 7000
DE 5800 6000 6200
US 15000 14000 13000

Adapted from Master the Tidyverse, CC BY RStudio
Country 2011 2012 2013
FR 7000 6900 7000
DE 5800 6000 6200
US 15000 14000 13000
Country Year n
FR 2011 7000
DE 2011 5800
US 2011 15000
FR 2012 6900
DE 2012 6000
US 2012 14000
FR 2013 7000
DE 2013 6200
US 2013 13000
Adapted from Master the Tidyverse, CC BY RStudio
Country 2011 2012 2013
FR 7000 6900 7000
DE 5800 6000 6200
US 15000 14000 13000
Country Year n
FR 2011 7000
DE 2011 5800
US 2011 15000
FR 2012 6900
DE 2012 6000
US 2012 14000
FR 2013 7000
DE 2013 6200
US 2013 13000

Adapted from Master the Tidyverse, CC BY RStudio
Country 2011 2012 2013
FR 7000 6900 7000
DE 5800 6000 6200
US 15000 14000 13000
Country Year n
FR 2011 7000
DE 2011 5800
US 2011 15000
FR 2012 6900
DE 2012 6000
US 2012 14000
FR 2013 7000
DE 2013 6200
US 2013 13000

Adapted from Master the Tidyverse, CC BY RStudio
Country 2011 2012 2013
FR 7000 6900 7000
DE 5800 6000 6200
US 15000 14000 13000
Country Year n
FR 2011 7000
DE 2011 5800
US 2011 15000
FR 2012 6900
DE 2012 6000
US 2012 14000
FR 2013 7000
DE 2013 6200
US 2013 13000

Adapted from Master the Tidyverse, CC BY RStudio
Country 2011 2012 2013
FR 7000 6900 7000
DE 5800 6000 6200
US 15000 14000 13000
Country Year n
FR 2011 7000
DE 2011 5800
US 2011 15000
FR 2012 6900
DE 2012 6000
US 2012 14000
FR 2013 7000
DE 2013 6200
US 2013 13000

Adapted from Master the Tidyverse, CC BY RStudio
Country 2011 2012 2013
FR 7000 6900 7000
DE 5800 6000 6200
US 15000 14000 13000
Country Year n
FR 2011 7000
DE 2011 5800
US 2011 15000
FR 2012 6900
DE 2012 6000
US 2012 14000
FR 2013 7000
DE 2013 6200
US 2013 13000

Adapted from Master the Tidyverse, CC BY RStudio
Country 2011 2012 2013
FR 7000 6900 7000
DE 5800 6000 6200
US 15000 14000 13000
Country Year n
FR 2011 7000
DE 2011 5800
US 2011 15000
FR 2012 6900
DE 2012 6000
US 2012 14000
FR 2013 7000
DE 2013 6200
US 2013 13000

Adapted from Master the Tidyverse, CC BY RStudio
Country 2011 2012 2013
FR 7000 6900 7000
DE 5800 6000 6200
US 15000 14000 13000
Country Year n
FR 2011 7000
DE 2011 5800
US 2011 15000
FR 2012 6900
DE 2012 6000
US 2012 14000
FR 2013 7000
DE 2013 6200
US 2013 13000

Adapted from Master the Tidyverse, CC BY RStudio
Country 2011 2012 2013
FR 7000 6900 7000
DE 5800 6000 6200
US 15000 14000 13000
Country Year n
FR 2011 7000
DE 2011 5800
US 2011 15000
FR 2012 6900
DE 2012 6000
US 2012 14000
FR 2013 7000
DE 2013 6200
US 2013 13000

Adapted from Master the Tidyverse, CC BY RStudio
Country 2011 2012 2013
FR 7000 6900 7000
DE 5800 6000 6200
US 15000 14000 13000
Country Year n
FR 2011 7000
DE 2011 5800
US 2011 15000
FR 2012 6900
DE 2012 6000
US 2012 14000
FR 2013 7000
DE 2013 6200
US 2013 13000

Adapted from Master the Tidyverse, CC BY RStudio
Country 2011 2012 2013
FR 7000 6900 7000
DE 5800 6000 6200
US 15000 14000 13000
Country Year n
FR 2011 7000
DE 2011 5800
US 2011 15000
FR 2012 6900
DE 2012 6000
US 2012 14000
FR 2013 7000
DE 2013 6200
US 2013 13000

Adapted from Master the Tidyverse, CC BY RStudio
Country 2011 2012 2013
FR 7000 6900 7000
DE 5800 6000 6200
US 15000 14000 13000
Country Year n
FR 2011 7000
DE 2011 5800
US 2011 15000
FR 2012 6900
DE 2012 6000
US 2012 14000
FR 2013 7000
DE 2013 6200
US 2013 13000
gather()

Adapted from Master the Tidyverse, CC BY RStudio
Country 2011 2012 2013
FR 7000 6900 7000
DE 5800 6000 6200
US 15000 14000 13000
Country Year n
FR 2011 7000
DE 2011 5800
US 2011 15000
FR 2012 6900
DE 2012 6000
US 2012 14000
FR 2013 7000
DE 2013 6200
US 2013 13000
1 2

Adapted from Master the Tidyverse, CC BY RStudio
Country 2011 2012 2013
FR 7000 6900 7000
DE 5800 6000 6200
US 15000 14000 13000
Country Year n
FR 2011 7000
DE 2011 5800
US 2011 15000
FR 2012 6900
DE 2012 6000
US 2012 14000
FR 2013 7000
DE 2013 6200
US 2013 13000
key (former column names)

Adapted from Master the Tidyverse, CC BY RStudio
Country 2011 2012 2013
FR 7000 6900 7000
DE 5800 6000 6200
US 15000 14000 13000
Country Year n
FR 2011 7000
DE 2011 5800
US 2011 15000
FR 2012 6900
DE 2012 6000
US 2012 14000
FR 2013 7000
DE 2013 6200
US 2013 13000
key value (former cells)
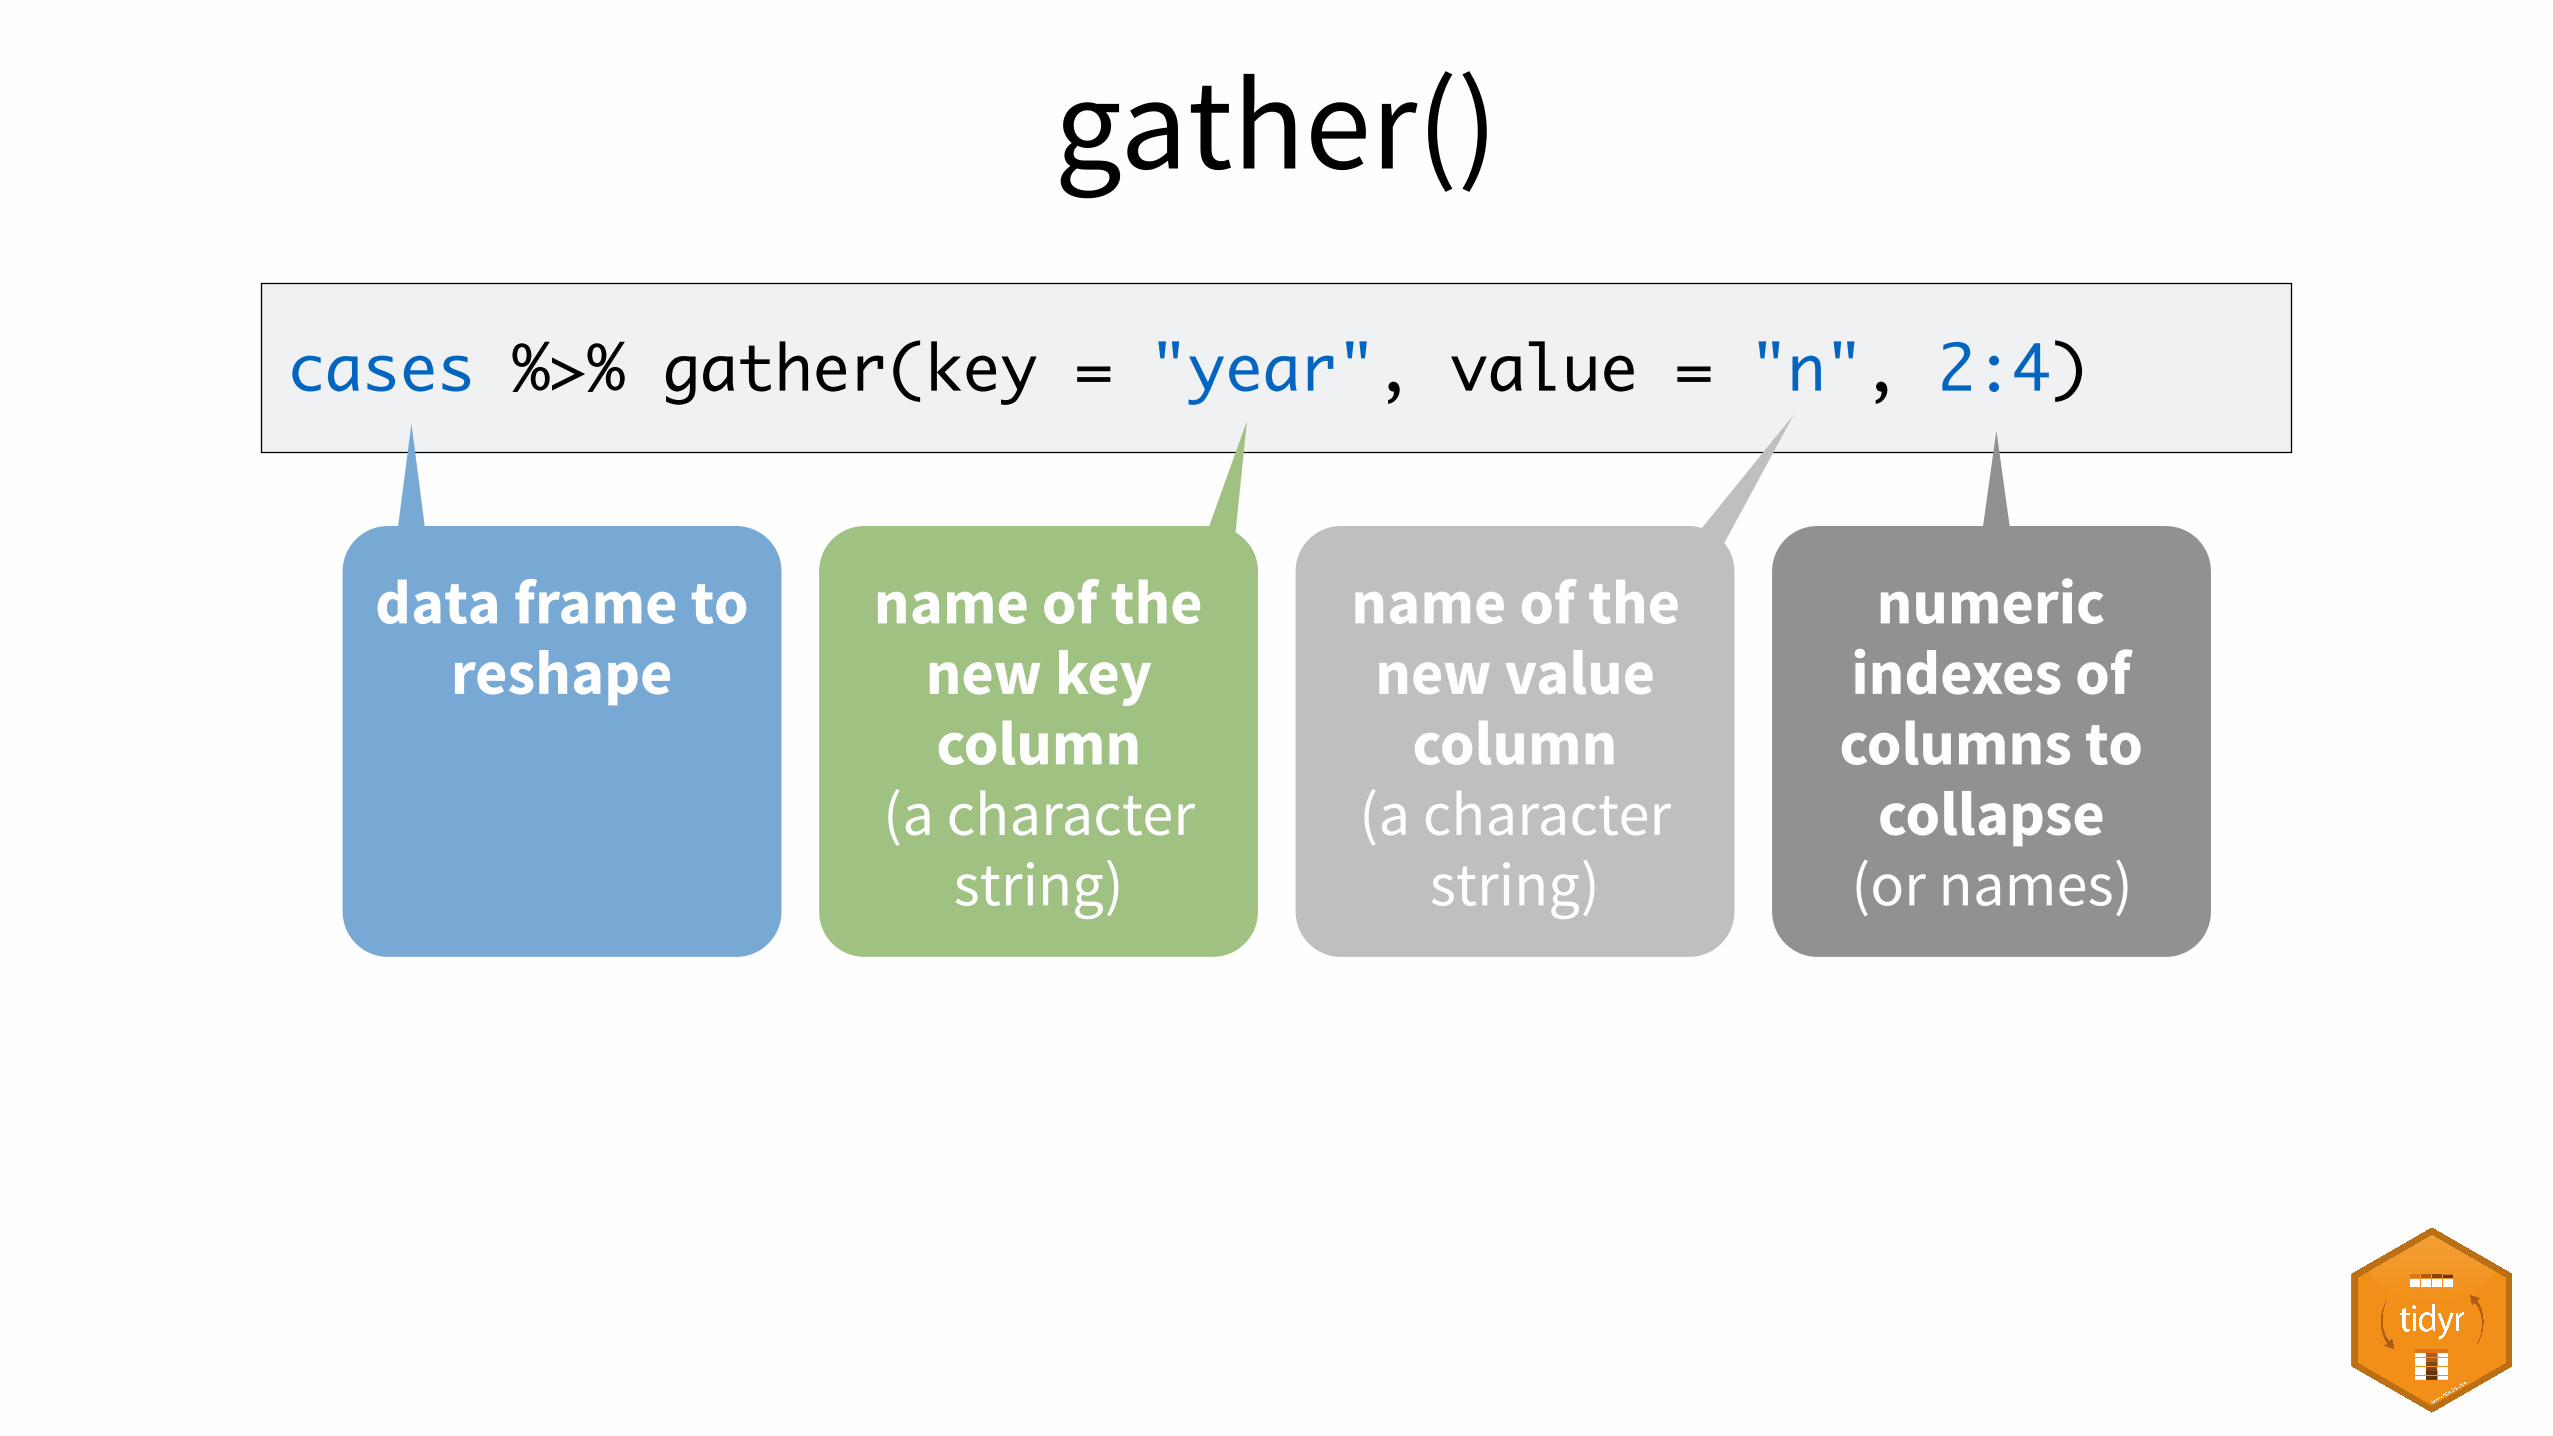
gather()
cases %>% gather(key = "year", value = "n", 2:4)
name of the new key column
(a character string)
data frame to reshape
name of the new value
column (a character
string)
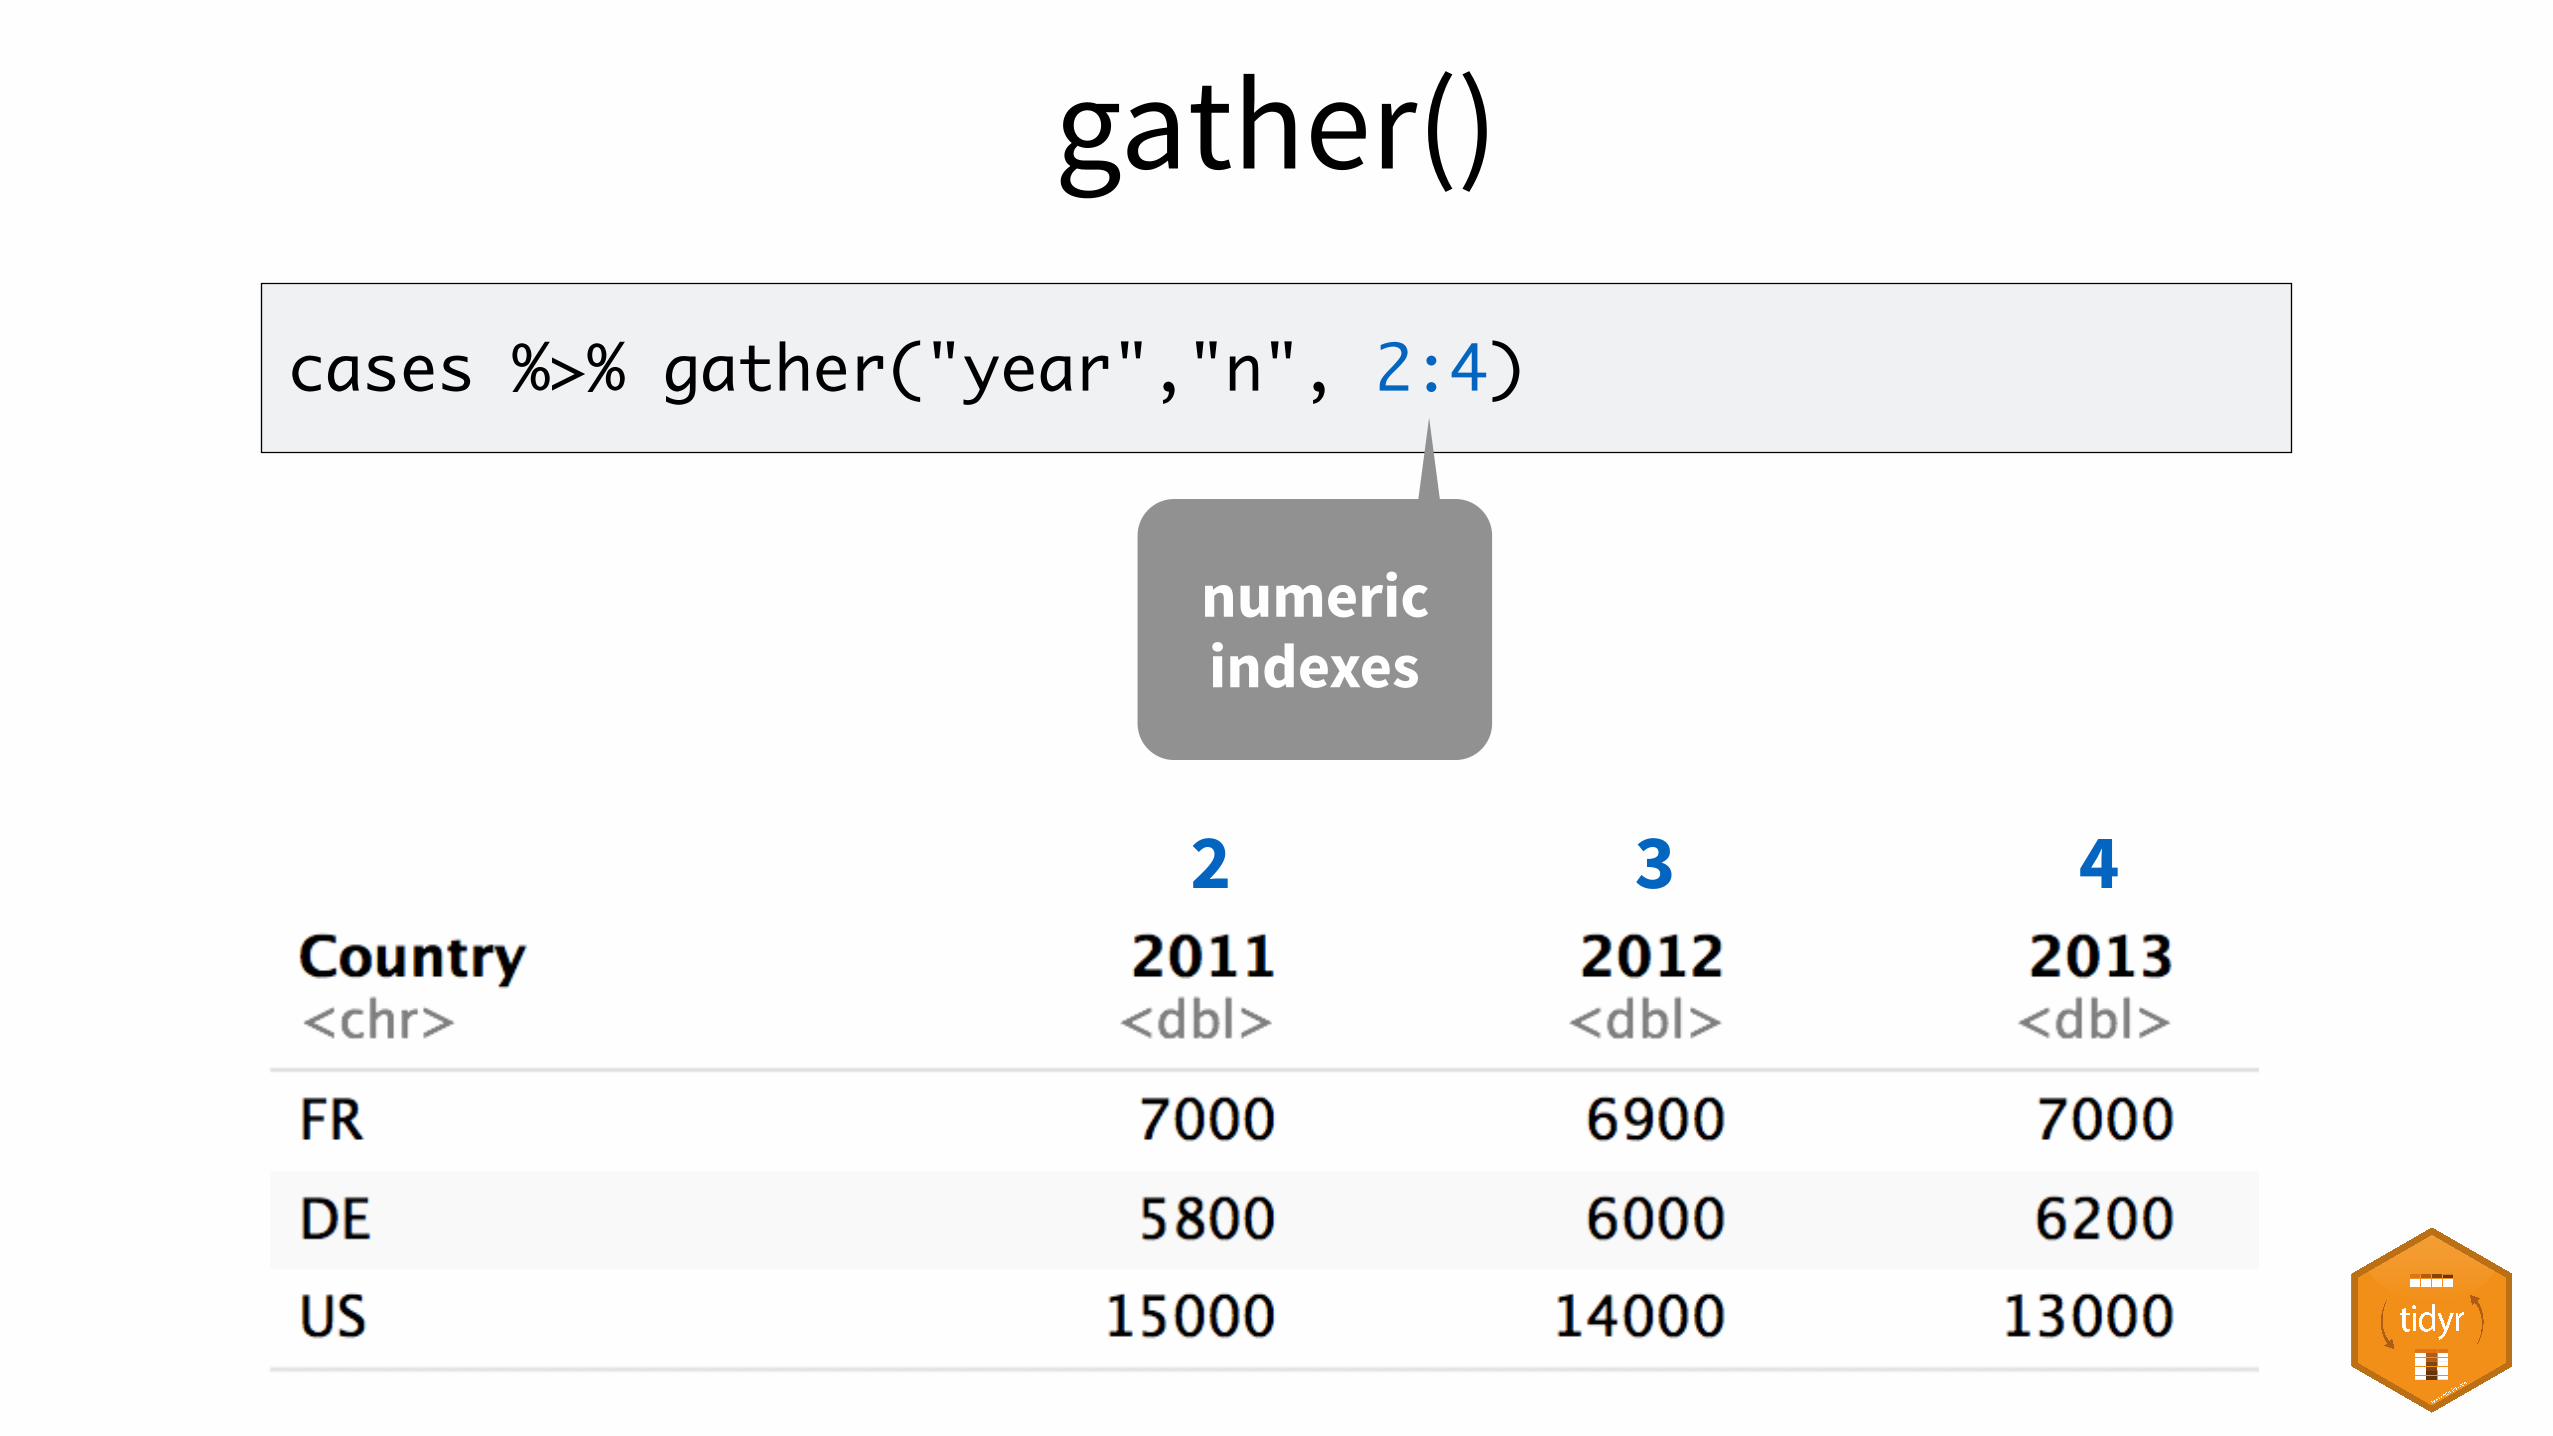
numeric indexes of columns to
collapse (or names)
gather()
cases %>% gather("year","n", 2:4)
numeric indexes
2 3 4

gather()
cases %>% gather("year","n", "2011", "2012", "2013")
2011 2012 2013
names

gather()
cases %>% gather("year","n", -Country)
Not Country Not Country Not Country
Everything except…

Your Turn 4Use gather() to reorganize table4a into three columns: country, year, and cases.

table4a %>% gather(key = "year", value = "n", 2:3)

table4a %>% gather(key = "year", value = "n", 2:3, convert = TRUE)

spread()

Adapted from Master the Tidyverse, CC BY RStudio
Toy data

ConsiderWhat are the variables in pollution?
city particlesize
amount (µg/m3)
New York large 23New York small 14
London large 22London small 16Beijing large 121
Beijing small 56
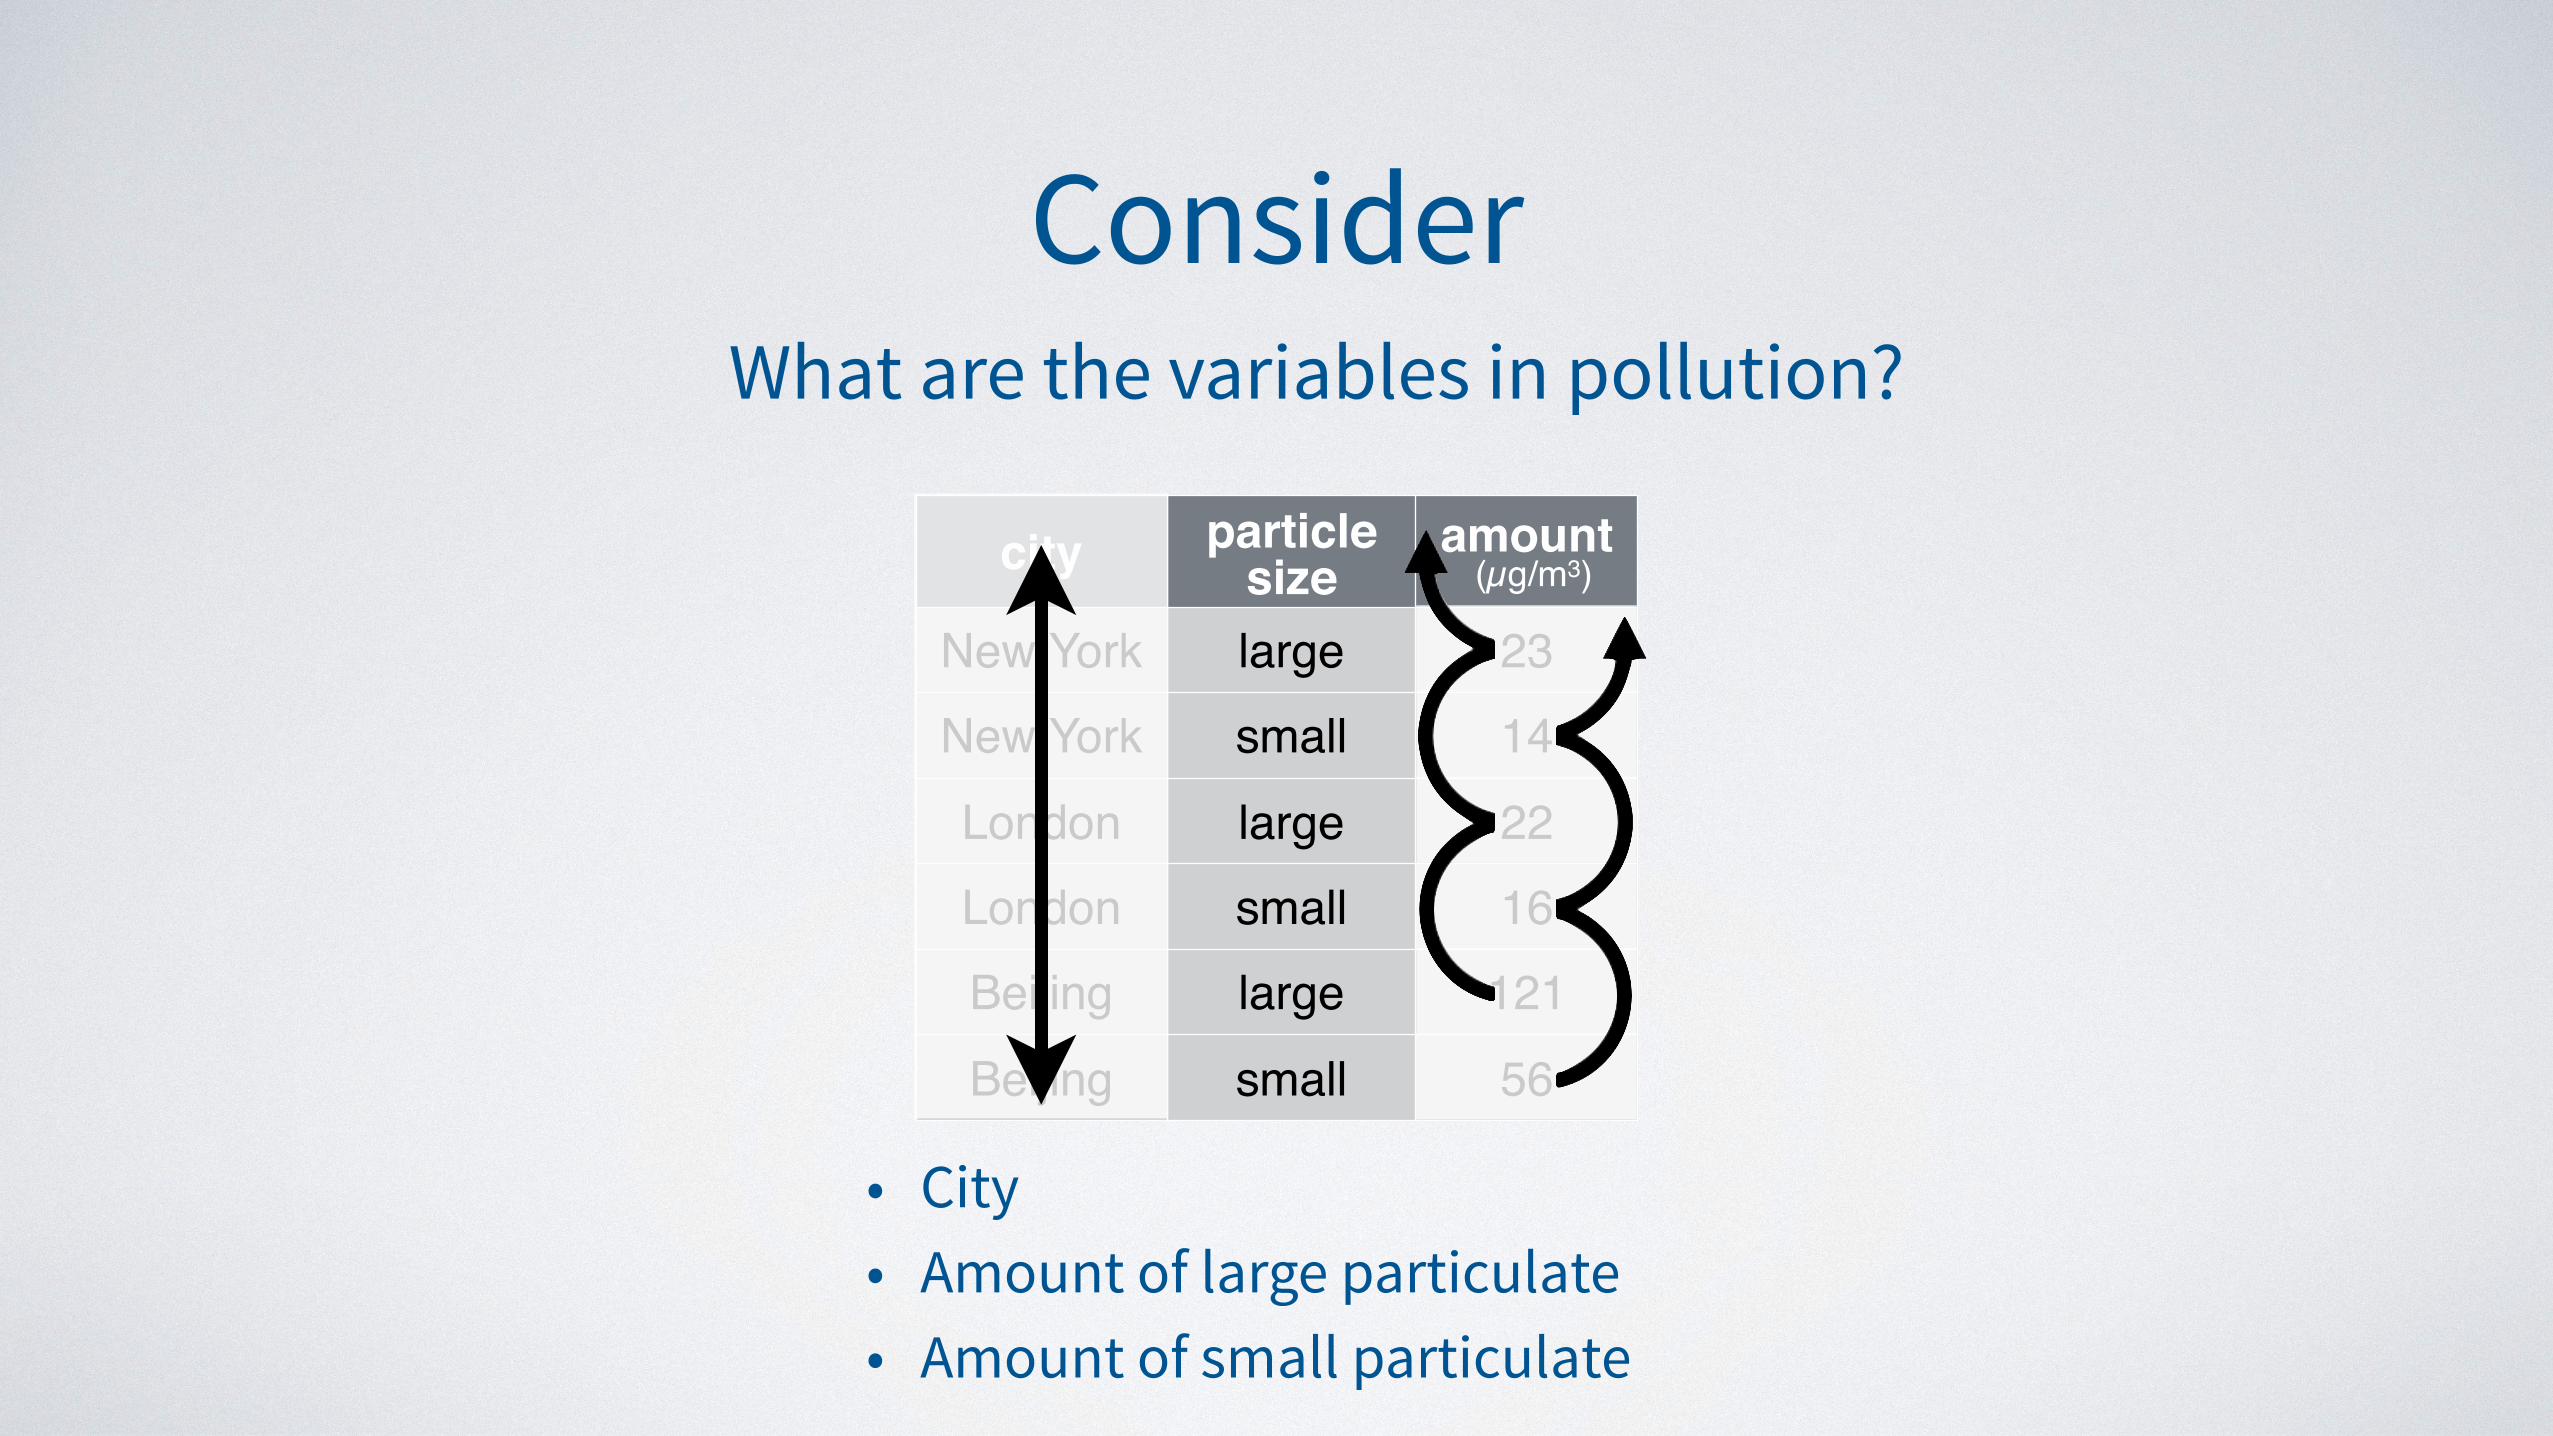
ConsiderWhat are the variables in pollution?
city particlesize
amount (µg/m3)
New York large 23New York small 14
London large 22London small 16Beijing large 121
Beijing small 56
• City• Amount of large particulate• Amount of small particulate

city size amount
New York large 23New York small 14London large 22London small 16Beijing large 121Beijing small 56
Your Turn 5On a sheet of paper, draw how this data set would look if it had the same values grouped into three columns: city, large, small

Adapted from Master the Tidyverse, CC BY RStudio
city size amount
New York large 23New York small 14
London large 22London small 16Beijing large 121
Beijing small 56

Adapted from Master the Tidyverse, CC BY RStudio
city size amount
New York large 23New York small 14
London large 22London small 16Beijing large 121
Beijing small 56
city large small
New York 23 14London 22 16Beijing 121 56

Adapted from Master the Tidyverse, CC BY RStudio
city size amount
New York large 23New York small 14
London large 22London small 16Beijing large 121
Beijing small 56
city large small
New York 23 14London 22 16Beijing 121 56

Adapted from Master the Tidyverse, CC BY RStudio
city size amount
New York large 23New York small 14
London large 22London small 16Beijing large 121
Beijing small 56
city large small
New York 23 14London 22 16Beijing 121 56

Adapted from Master the Tidyverse, CC BY RStudio
city size amount
New York large 23New York small 14
London large 22London small 16Beijing large 121
Beijing small 56
city large small
New York 23 14London 22 16Beijing 121 56

Adapted from Master the Tidyverse, CC BY RStudio
city size amount
New York large 23New York small 14
London large 22London small 16Beijing large 121
Beijing small 56
city large small
New York 23 14London 22 16Beijing 121 56

Adapted from Master the Tidyverse, CC BY RStudio
city size amount
New York large 23New York small 14
London large 22London small 16Beijing large 121
Beijing small 56
city large small
New York 23 14London 22 16Beijing 121 56

Adapted from Master the Tidyverse, CC BY RStudio
city size amount
New York large 23New York small 14
London large 22London small 16Beijing large 121
Beijing small 56
city large small
New York 23 14London 22 16Beijing 121 56

Adapted from Master the Tidyverse, CC BY RStudio
city size amount
New York large 23New York small 14
London large 22London small 16Beijing large 121
Beijing small 56
city large small
New York 23 14London 22 16Beijing 121 56

Adapted from Master the Tidyverse, CC BY RStudio
city size amount
New York large 23New York small 14
London large 22London small 16Beijing large 121
Beijing small 56
city large small
New York 23 14London 22 16Beijing 121 56
spread()

Adapted from Master the Tidyverse, CC BY RStudio
city size amount
New York large 23New York small 14
London large 22London small 16Beijing large 121
Beijing small 56
city large small
New York 23 14London 22 16Beijing 121 56
1 2

Adapted from Master the Tidyverse, CC BY RStudio
city size amount
New York large 23New York small 14
London large 22London small 16Beijing large 121
Beijing small 56
city large small
New York 23 14London 22 16Beijing 121 56
key (new column names)

Adapted from Master the Tidyverse, CC BY RStudio
city size amount
New York large 23New York small 14
London large 22London small 16Beijing large 121
Beijing small 56
city large small
New York 23 14London 22 16Beijing 121 56
key value (new cells)

spread()
pollution %>% spread(key = size, value = amount)
column to use for keys (becomes new
column names)
data frame to reshape
column to use for values (becomes new column cells)

pollution %>% spread(size, amount)
city size amount1 New York large 232 New York small 143 London large 224 London small 165 Beijing large 1216 Beijing small 56
city large small1 Beijing 121 562 London 22 163 New York 23 14

Your Turn 6Use spread() to reorganize table2 into four columns: country, year, cases, and population.

table2 %>% spread(key = type, value = count)

Adapted from Master the Tidyverse, CC BY RStudio
tidyr verbs
p10071009 wwp1009p1009A1005A1013A1010A1010Move column names into values with gather()
p10071009wwp1009p1009A1005A1013A1010A1010Move values into column names with spread()
Split a column with separate() or separate_rows()
w100510051005100510051005w100510051005100510051005w100510051005100510051005w100510051005100510051005
Unite columns with unite()w100510051005100510051005w100510051005100510051005w100510051005100510051005w100510051005100510051005

Adapted from Master the Tidyverse, CC BY RStudio
Tidy Data with