thy for joc si - the royal society of chemistry 90 95 100 105 110 115 120 125 m/z 0 5 10 15 20 25 30...
TRANSCRIPT

Supplementary Information
Miniolins A–C, Novel Isomeric Furanones Induced by Epigenetic
Manipulation on Penicillium minioluteum
Hao-Yu Tang,‡ Qiang Zhang,‡ Yu-Qi Gao, An-Ling Zhang, and Jin-Min Gao*
‡ H.-Y. Tang and Q. Zhang contributed equally
* Corresponding Author, [email protected]
CONTENTS
Figure S1. HPLC profiles of culture extracts from P. minioluteum cultivated in PD media (upper) and PD
media with 500 μM Aza (bottom) ....................................................................................................................... 1
Figure S2. LC/MS2 analysis of oxidation products of compounds 1-3 .......................................................... 2
(1) HPLC Profile of oxidation products from compounds 1-3 on an Agilent TC-18 column ............................................. 2
(2) Full MS and MS/MS of peak 1 from negative ESI source............................................................................................ 2
(3) Proposed MS/MS fragmentation pathway of the methylsuccinic acid.......................................................................... 2
Figure S3. 1H NMR of 1 in CDCl3 (500 MHz) .............................................................................................. 3
Figure S4. 13C NMR and DEPT of 1 in CDCl3 (125 MHz) ........................................................................... 4
Figure S5. HSQC spectrum of 1..................................................................................................................... 5
Figure S6. 1H-1H COSY spectrum of 1 .......................................................................................................... 6
Figure S7. HMBC spectrum of 1 ................................................................................................................... 7
Figure S8. NOESY spectrum of 1 ................................................................................................................ 10
Figure S9. Positive ESIMS spectrum of 1.................................................................................................... 11
Figure S10. HR ESIMS spectrum of 1 ........................................................................................................... 12
Figure S11. IR spectrum of 1 ......................................................................................................................... 13
Figure S12. UV and CD spectra of 1.............................................................................................................. 14
Figure S13. 1H NMR spectrum of 2 in CDCl3 (500 MHz) ............................................................................ 15
Figure S14. 13C NMR and DEPT of 2 in CDCl3 (125 MHz) ......................................................................... 16
Electronic Supplementary Material (ESI) for RSC Advances.This journal is © The Royal Society of Chemistry 2014

Figure S15. HSQC spectrum of 2................................................................................................................... 17
Figure S16. 1H-1H COSY spectrum of 2 ........................................................................................................ 18
Figure S17. HMBC spectrum of 2 ................................................................................................................. 19
Figure S18. NOESY spectrum of 2 ................................................................................................................ 22
Figure S19. Positive ESIMS spectrum of 2.................................................................................................... 23
Figure S20. HR ESIMS spectrum of 2 ........................................................................................................... 24
Figure S21. IR spectrum of 2 ......................................................................................................................... 25
Figure S22. UV and CD spectra of 2.............................................................................................................. 26
Figure S23. 1H NMR spectrum of 3 in CDCl3 (500 MHz) ............................................................................ 27
Figure S24. 13C NMR and DEPT spectrum of 3 in CDCl3 (125 MHz).......................................................... 28
Figure S25. HSQC spectrum of 3................................................................................................................... 29
Figure S26. 1H-1H COSY spectrum of 3 ........................................................................................................ 30
Figure S27. HMBC spectrum of 3 ................................................................................................................. 31
Figure S28. NOESY spectrum of 3 ................................................................................................................ 34
Figure S29. Positive ESIMS spectrum of 3.................................................................................................... 35
Figure S30. HR ESIMS spectrum of 3 ........................................................................................................... 36
Figure S31. IR spectrum of 3 ......................................................................................................................... 37
Figure S32. UV and CD spectra of 3.............................................................................................................. 38
Figure S33. 1H NMR spectrum of 4 in CDCl3 (400 MHz) ............................................................................ 39
Figure S34. 13C NMR spectrum of 4 in CDCl3 (100 MHz) ........................................................................... 40
Figure S35. IR spectrum of 4 ......................................................................................................................... 41
Figure S36. UV spectrum of 4 ....................................................................................................................... 42
Figure S37. ESIMS of 4 ................................................................................................................................. 43
Figure S38. CD of 4 ....................................................................................................................................... 44

1
Figure S1. HPLC profiles of culture extracts from P. minioluteum cultivated in PD media (upper) and PD media with 500 μM Aza (bottom)
50454035302520151050
PD+Aza
PD (control)
3
4
1 2
Retention time

2
Figure S2. LC/MS2 analysis of oxidation products of compounds 1-3
(1) HPLC Profile of oxidation products from compounds 1-3 on an Agilent TC-18 column
24222018161412108Retention Time (min)
12
3
standard methylsuccinic acid
peak 1
Column: Agilent TC-18 column 250×4.6 mm; Elution solvent: 10% MeOH/H2O with 0.1% TFA; Temperature: 25
OC; Detector: UV @210nm
(2) Full MS and MS/MS of peak 1 from negative ESI source
ZH-25 oxidation MSn #12-16 RT: 0.19-0.26 AV: 5 NL: 3.94E1T: ITMS - c ESI Full ms [50.00-2000.00]
70 80 90 100 110 120 130 140m/z
0
5
10
15
20
25
30
35
40
45
50
55
60
65
70
75
80
85
90
95
100
Rel
ativ
e A
bund
ance
110.74
130.79112.77
86.81
95.72131.8596.75
THY SU-di-COOH_0000 #128-171 RT: 2.44-3.27 AV: 42 NL: 1.65E-1T: ITMS - c ESI Full ms2 [email protected] [50.00-2000.00]
85 90 95 100 105 110 115 120 125m/z
0
5
10
15
20
25
30
35
40
45
50
55
60
65
70
75
80
85
90
95
100
Rel
ativ
e A
bund
ance
86.79
112.78
(3) Proposed MS/MS fragmentation pathway of the methylsuccinic acid

S3
Figure S3. 1H NMR of 1 in CDCl3 (500 MHz)
7.0 6.5 6.0 5.5 5.0 4.5 4.0 3.5 3.0 2.5 2.0 1.5 1.0 0.5 0
Miniolin A (1)
6.0 5.5 5.0 4.5 4.0 3.5 3.0
2.5 2.0 1.5 1.0 0.5 0
O O
OO
O
OO
O

S4
Figure S4. 13C NMR and DEPT of 1 in CDCl3 (125 MHz)
180 160 140 120 100 80 60 40 20 0
Miniolin A (1)
O O
OO
O
OO
O
180 160 140 120 100 80 60 40 20 0

S5
Figure S5. HSQC spectrum of 1
6.0 5.5 5.0 4.5 4.0 3.5 3.0 2.5 2.0 1.5 1.0 0.5 0
20
40
60
80
100
120
O O
OO
O
OO
O
Miniolin A (1)

S6
Figure S6. 1H-1H COSY spectrum of 1
6.5 6.0 5.5 5.0 4.5 4.0 3.5 3.0 2.5 2.0 1.5 1.0 0.5
0.5
1.0
1.5
2.0
2.5
3.0
3.5
4.0
4.5
5.0
5.5
6.0
O O
OO
O
OO
O
Miniolin A (1)

S7
Figure S7. HMBC spectrum of 1
2.0 1.5 1.0
20
40
60
80
100
120
140
160
180
200
O O
OO
O
OO
O
Miniolin A (1)

S8
3.9 3.8 3.7 3.6 3.5 3.4 3.3 3.2 3.1 3.0
20
40
60
80
100
120
140
160
180
200
O O
OO
O
OO
O
Miniolin A (1)
HMBC
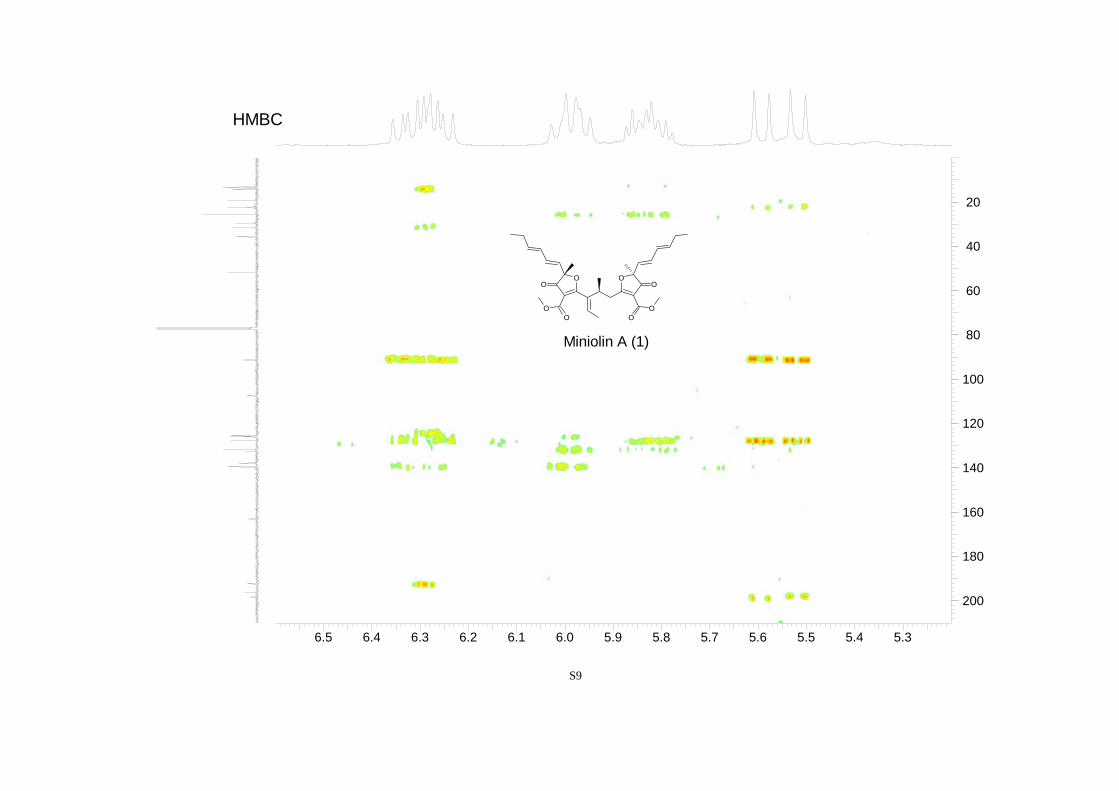
S9
6.5 6.4 6.3 6.2 6.1 6.0 5.9 5.8 5.7 5.6 5.5 5.4 5.3
20
40
60
80
100
120
140
160
180
200
O O
OO
O
OO
O
Miniolin A (1)
HMBC

S10
Figure S8. NOESY spectrum of 1
6.5 6.0 5.5 5.0 4.5 4.0 3.5 3.0 2.5 2.0 1.5 1.0 0.5
1.0
1.5
2.0
2.5
3.0
3.5
4.0
4.5
5.0
5.5
6.0
O O
OO
O
OO
O
Miniolin A (1)

S11
Figure S9. Positive ESIMS spectrum of 1
ZH-25 #84-104 RT: 0.36-0.45 AV: 21 NL: 1.65E4T: ITMS + c ESI Full ms [50.00-2000.00]
200 400 600 800 1000 1200 1400 1600 1800 2000m/z
0
5
10
15
20
25
30
35
40
45
50
55
60
65
70
75
80
85
90
95
100
Rel
ativ
e A
bund
ance
1126.71
553.00
575.27
278.89 612.01180.55 1046.62847.94312.07 1230.37536.56 680.81 1369.56 1533.65 1650.48 1840.50 1998.02

S12
Figure S10. HR ESIMS spectrum of 1

S13
Figure S11. IR spectrum of 1
3500 3000 2500 2000 1500 1000 500Wavenumber (cm-1)
3444.78
2922.09
1732.041716.61703.11685.741651.031635.61458.151384.86

S14
Figure S12. UV and CD spectra of 1
350300250200Wavelength (nm)
0
0.25
0.50
0.75
1.00
Abs
orba
nce
231
350300250200Wavelength (nm)
-10
-8
-6
-4
-2
0
2UVCD
Δε(cm
-1M
-1)

S15
Figure S13. 1H NMR spectrum of 2 in CDCl3 (500 MHz)
7.0 6.5 6.0 5.5 5.0 4.5 4.0 3.5 3.0 2.5 2.0 1.5 1.0 0.5 0
6.0 5.5 5.0 4.5 4.0 3.5
2.3 2.2 2.1 2.0 1.9 1.8 1.7 1.6 1.5 1.4 1.3 1.2 1.1 1.0 0.9 0.8
O O
OO
O
OO
O
Miniolin B (2)

S16
Figure S14. 13C NMR and DEPT of 2 in CDCl3 (125 MHz)
O O
OO
O
OO
O
Miniolin B (2)
200 180 160 140 120 100 80 60 40 20 0
200 180 160 140 120 100 80 60 40 20 0

S17
Figure S15. HSQC spectrum of 2
6.5 6.0 5.5 5.0 4.5 4.0 3.5 3.0 2.5 2.0 1.5 1.0
20
40
60
80
100
120
140
O O
OO
O
OO
O
Miniolin B (2)

S18
Figure S16. 1H-1H COSY spectrum of 2
6.0 5.5 5.0 4.5 4.0 3.5 3.0 2.5 2.0 1.5 1.0
1
2
3
4
5
6
O O
OO
O
OO
O
Miniolin B (2)

S19
Figure S17. HMBC spectrum of 2
2.0 1.5 1.0
20
40
60
80
100
120
140
160
180
O O
OO
O
OO
O
Miniolin B (2)

S20
4.1 4.0 3.9 3.8 3.7 3.6 3.5 3.4 3.3 3.2
20
40
60
80
100
120
140
160
180
O O
OO
O
OO
O
Miniolin B (2)
HMBC

S21
6.5 6.0 5.5 5.0
20
40
60
80
100
120
140
160
180
O O
OO
O
OO
O
Miniolin B (2)
HMBC

S22
Figure S18. NOESY spectrum of 2
6.0 5.5 5.0 4.5 4.0 3.5 3.0 2.5 2.0 1.5 1.0 0.5
1
2
3
4
5
6
O O
OO
O
OO
O
Miniolin B (2)

S23
Figure S19. Positive ESIMS spectrum of 2
ZH-26 #17-20 RT: 0.07-0.08 AV: 4 NL: 1.28E4T: ITMS + c ESI Full ms [50.00-2000.00]
200 400 600 800 1000 1200 1400 1600 1800 2000m/z
0
5
10
15
20
25
30
35
40
45
50
55
60
65
70
75
80
85
90
95
100
Rel
ativ
e A
bund
ance
1126.67
552.97
575.28
591.24278.95652.01318.42180.61 825.63 1092.67 1195.23540.68 1387.63 1773.281511.79 1905.08

S24
Figure S20. HR ESIMS spectrum of 2

S25
Figure S21. IR spectrum of 2
3500 3000 2500 2000 1500 1000 500Wavenumber (cm-1)
1384.861440.791560.371579.661651.031716.6
2850.722922.092956.8
3446.71

S26
Figure S22. UV and CD spectra of 2
350300250200Wavelength (nm)
0
0.25
0.50
0.75A
bsor
banc
e
233
350300250200Wavelength (nm)
-20
-15
-10
-5
0
5UV CD
Δε(cm
-1M
-1)

S27
Figure S23. 1H NMR spectrum of 3 in CDCl3 (500 MHz)
7.0 6.5 6.0 5.5 5.0 4.5 4.0 3.5 3.0 2.5 2.0 1.5 1.0 0.5 0
6.0 5.5 5.0 4.5 4.0 3.5 3.0
3.0 2.5 2.0 1.5 1.0 0.5 0
O O
OO
O
OO
O
Miniolin C (3)

S28
Figure S24. 13C NMR and DEPT spectrum of 3 in CDCl3 (125 MHz)
O O
OO
O
OO
O
Miniolin C (3)
200 180 160 140 120 100 80 60 40 20 0
200 180 160 140 120 100 80 60 40 20 0

S29
Figure S25. HSQC spectrum of 3
6.0 5.5 5.0 4.5 4.0 3.5 3.0 2.5 2.0 1.5 1.0
20
40
60
80
100
120
O O
OO
O
OO
O
Miniolin C (3)

S30
Figure S26. 1H-1H COSY spectrum of 3
6.0 5.5 5.0 4.5 4.0 3.5 3.0 2.5 2.0 1.5 1.0
1
2
3
4
5
6
O O
OO
O
OO
O
Miniolin C (3)

S31
Figure S27. HMBC spectrum of 3
2.0 1.5 1.0
20
40
60
80
100
120
140
160
180
O O
OO
O
OO
O
Miniolin C (3)

S32
4.5 4.0 3.5 3.0
20
40
60
80
100
120
140
160
180
O O
OO
O
OO
O
Miniolin C (3)
HMBC

S33
6.0 5.5 5.0
20
40
60
80
100
120
140
160
180
O O
OO
O
OO
O
Miniolin C (3)
HMBC

S34
Figure S28. NOESY spectrum of 3
6.5 6.0 5.5 5.0 4.5 4.0 3.5 3.0 2.5 2.0 1.5 1.0 0.5 0
0
1
2
3
4
5
6
O O
OO
O
OO
O
Miniolin C (3)

S35
Figure S29. Positive ESIMS spectrum of 3
ZH28 #9-13 RT: 0.03-0.05 AV: 5 NL: 1.21E4T: ITMS + c ESI sid=35.00 Full ms [50.00-2000.00]
200 300 400 500 600 700 800 900 1000m/z
0
5
10
15
20
25
30
35
40
45
50
55
60
65
70
75
80
85
90
95
100
Rel
ativ
e A
bund
ance
574.91552.64
590.87
606.80274.14 488.79622.74520.75
302.23472.78 654.65
440.90319.07 694.74246.19 360.81 734.58 925.27 966.19824.99

S36
Figure S30. HR ESIMS spectrum of 3

S37
Figure S31. IR spectrum of 3
3500 3000 2500 2000 1500 1000 500Wavenumber (cm-1)
3446.71
2954.882920.162850.72
1733.96
1651.031577.73
1458.151377.14

S38
Figure S32. UV and CD spectra of 3
UV CD
Δε(cm
-1M
-1)
350300250200Wavelength (nm)
0
0.25
0.50
0.75
1.00
Abs
orba
nce
213195
350300250200Wavelength (nm)
-10
-8
-6
-4
-2
0
2

S39
Figure S33. 1H NMR spectrum of 4 in CDCl3 (400 MHz)
7.5 7.0 6.5 6.0 5.5 5.0 4.5 4.0 3.5 3.0 2.5 2.0 1.5 1.0 0.5 0
O
OO
O
Aspertetronin A (4)

S40
Figure S34. 13C NMR spectrum of 4 in CDCl3 (100 MHz)
180 160 140 120 100 80 60 40 20 0
O
OO
O
Aspertetronin A (4)

S41
Figure S35. IR spectrum of 4
3500 3000 2500 2000 1500 1000 500Wavenumber (cm-1)
3423.57
2962.59
1743.611706.961645.241556.521438.861396.43
1201.621132.191051.18991.39

S42
Figure S36. UV spectrum of 4
400380360340320300280260240220200Wavelength (nm)
0
0.1
0.2
0.3
0.4
0.5
0.6
0.7
Abs
orba
nce
301
231

S43
Figure S37. ESIMS of 4
Gao Jining ZH-2 #27-31 RT: 0.07-0.08 AV: 5 NL: 3.71E5T: ITMS + c ESI Full ms [80.00-1000.00]
250 300 350 400 450 500 550 600 650 700m/z
0
5
10
15
20
25
30
35
40
45
50
55
60
65
70
75
80
85
90
95
100
Rel
ativ
e A
bund
ance
277.00
574.91
569.78
590.68
293.63 606.88245.10 434.48 553.23309.13 637.05375.94335.90 667.59 701.82521.97454.86

S44
Figure S38. CD of 4
400380360340320300280260240220200Wavelength (nm)
-30
-25
-20
-15
-10
-5
0
5
10CD
Δε(cm
-1M
-1)