thursday, april 16, 2020 12:59 pm norlite modeling report
TRANSCRIPT

1
Kornak, Kate F (DEC)
From: Knight, Prince <[email protected]>Sent: Thursday, April 16, 2020 12:59 PMTo: Kornak, Kate F (DEC); Prunier, Denise (DEC); Potter, Benjamin J (DEC); DeSantis, Steve (DEC); Schmitt,
Victoria M (DEC); Hadersbeck, Joseph E (DEC)Cc: Maguffin, David; LaGrimas, Tita; Nusimovich, Ivan; Brian Noel; Simone WallaceSubject: Norlite, LLC - DEC ID: 4-0103-00016 - Air Modeling Report - Project DeltaAttachments: Norlite_Modeling Report 2020-0331.pdf
ATTENTION: This email came from an external source. Do not open attachments or click on links from unknown senders or
unexpected emails.
Good Afternoon Ms. Kornak, Please find attached the Final Air Modeling Report required by Norlite’s Current Title V permit for the Project Delta Modifications. The report was prepared by Trinity Consultants. They will be supplying the CD and supporting electronic files separately. If hard copies of the report are needed, please let us know and we can have them prepared. Otherwise, this will be the only submission of the report. Please contact us if there are any questions. Sincerely,
Knight, Prince Environmental & Regulatory Compliance Manager Tradebe Environmental Services, LLC 628 South Saratoga Street Cohoes, NY 12047 United States Office: 518-235-0401 x 4049 Fax: +1 (518) 235-0233 Cell: +1 518-857-2969 www.tradebeusa.com
Before printing this message, make sure that it's necessary. The environment is in our hands.
This e-mail and any attachments may be confidential or legally privileged. If you have received this e-mail in error or are not the intended recipient, please notify the sender immediately and delete the e-mail. Any unauthorized copying, distribution or use of the information in this e-mail or any attachments is strictly prohibited.
T IRADIEBE

Environmental solutions delivered uncommonly well
NEW YORK STATE DEPARTMENT OF ENVIRONMENTAL CONSERVATION –
PROJECT DELTA MODELING REPORT
Norlite, LLC A Division of Tradebe Environmental Services, LLC
Cohoes, NY
Prepared For:
Norlite, LLC DEC ID: 4‐0103‐00016
Prepared By:
TRINITY CONSULTANTS 4 Springhurst Drive, Suite 107
East Greenbush, New York 12061 (518) 205-9000
April 2020
Tt . . ~
n_ nor 1tyl!... \.JJnsu rants

Tradebe Environmental Services, LLC – Norlite, LLC | Modeling Report Trinity Consultants i
TABLE OF CONTENTS
1. INTRODUCTION 1-1 1.1. Project Description ............................................................................................................................................... 1-1 1.2. Site Description ...................................................................................................................................................... 1-2
2. REGULATORY STANDARDS 2-1 2.1. Criteria Pollutant Modeling ................................................................................................................................ 2-1 2.2. State Toxics Permitting and Modeling ............................................................................................................ 2-3
3. AIR DISPERSION MODELING METHODOLOGY 3-1 3.1. Dispersion Model Selection and Building Downwash Analysis .............................................................. 3-1 3.2. Treatment of Terrain ........................................................................................................................................... 3-2 3.3. Meteorological Data .............................................................................................................................................. 3-3 3.4. Coordinate System ................................................................................................................................................ 3-3 3.5. Receptor Grids ........................................................................................................................................................ 3-3
Cartesian Receptor Grid ......................................................................................................................................................... 3-3 Fence Line Receptors ............................................................................................................................................................... 3-4 Sensitive Receptors ................................................................................................................................................................... 3-5
3.6. Source Types and Stack Parameters ............................................................................................................... 3-6 3.7. GEP Stack Height Analysis .................................................................................................................................. 3-7
4. AIR DISPERSION MODELING RESULTS 3-9 4.1. NAAQS Analysis Results ....................................................................................................................................... 3-9 4.2. Air Toxics Analysis Results .............................................................................................................................. 3-11 4.3. Unitized Modeling Analysis ............................................................................................................................. 3-12 4.4. Summary of Results ........................................................................................................................................... 3-15
ATTACHMENT A: FACILITY SITE LAYOUT
ATTACHMENT B: MODELED TOXICS
ATTACHMENT C: MODEL CD
3.5.1. 3.5.2. 3.5.3.

Tradebe Environmental Services, LLC – Norlite, LLC | Modeling Report Trinity Consultants ii
LIST OF TABLES
Table 2-1. Applicable NAAQS for Criteria Air Pollutants 2-1
Table 2-2. Criteria Pollutant Emission Rates 2-2
Table 2-3. Background Concentrations 2-3
Table 2-4. New York State’s SGC/AGC for Part 212 Compounds 2-4
Table 3-1. Building Locations 3-2
Table 3-2. Source Locations 3-6
Table 3-3. Point Source Parameters 3-7
Table 3-4. Volume Source Parameters 3-7
Table 4-1. Modeling Results – PM10 24-Hour 3-9
Table 4-2. Modeling Results – PM2.5 24-Hour 3-9
Table 4-3. Modeling Results – PM2.5 Annual 3-9
Table 4-4. Modeling Results – NO2 1-Hour 3-9
Table 4-5. Modeling Results – NO2 Annual 3-10
Table 4-6. Modeling Results – SO2 1-Hour 3-10
Table 4-7. Modeling Results – SO2 3-Hour 3-10
Table 4-8. Modeling Results – SO2 24-Hour 3-10
Table 4-9. Modeling Results – SO2 Annual 3-10
Table 4-10. Modeling Results – CO 1-Hour 3-10
Table 4-11. Modeling Results –CO 8-Hour 3-11
Table 4-12: Short-term Toxics Results 3-11
Table 4-13: Long-term Toxics Results 3-11
........................................................................................................................................................................................................................................................................ ,

Tradebe Environmental Services, LLC – Norlite, LLC | Modeling Report Trinity Consultants 1-1
1. INTRODUCTION
On behalf of Norlite, LLC, a division of Tradebe Environmental Services, LLC (Norlite), Trinity Consultants, Inc. (Trinity) is submitting this modeling report to the New York State Department of Environmental Conservation (NYSDEC). Norlite operates two hazardous waste-burning lightweight aggregate rotary kilns and accepts off-site liquid waste for energy recovery at their facility in the city of Cohoes, Albany County, New York. The facility is classified as a major source for hazardous air pollutants (HAPs) and certain criteria pollutants which subjects the facility to the Title V permit process. Operations at this facility are authorized under a Title V Operating Permit 4-0103-00016/00048, Mod 6, issued on October 7, 2019 and a Part 373 permit 4-0103-00016/00016 which went into effect on January 1, 2016.
1.1. PROJECT DESCRIPTION
Located in the city of Cohoes, NY at 628 South Saratoga Street, Norlite is bordered by residential areas and commercial operations. The facility manufactures lightweight, porous ceramic material produced by expanding and vitrifying select shale in two rotary industrial furnaces. The fuel source for kiln heating is an alternate fuel source made up of spent solvents and petroleum products from various industrial sources. Norlite has been engaged in a two to three year project (Project Delta) to upgrade the Air Pollution Control (APC) equipment associated with both kilns. Once fully implemented, Project Delta will replace the two existing venturi-based wet scrubbers with two new semi-dry technology scrubbers employing hydrated lime as the sorbent material. As required as part of the air permit application submitted in 2018 and to satisfy condition 6-2 of the Mod 6 permit, the following air dispersion modeling analysis was required:
6 New York Codes, Rules and Regulations (CRR-NY) Part 212: Part 212 applies to process emission sources (non-combustion sources) associated with a process operation upon issuance of a new, modified, or renewal permit/registration for a facility;
A Toxic Impact Assessment required for High Toxicity Air Contaminants (HTACs) emitted from sources subject to National Emission Standards for Hazardous Air Pollutants (NESHAPs) as required by § 212-1.5(e)(2);
National Ambient Air Quality Standards (NAAQS) compliance evaluation for criteria pollutants; and Unitized modeling analysis comparison for proposed scrubbers and existing scrubbers.
Norlite’s modeling protocol was approved by NYSDEC on February 12, 2019. The remainder of this modeling report is organized as follows:
Section 1 provides a brief description of the facility and the project; Section 2 lists NYSDEC standards that apply to the proposed project; Section 3 describes the choice of air dispersion model, modeling procedures, meteorological data, and
methodology for analyzing building downwash, terrain, and other model parameters; and, Section 4 provides the model results with comparison to the Annual/ Short-term Guideline Concentrations
(AGC/SGC), NAAQS, and Unit Analysis.
The proposed modeling methods described in this modeling protocol are consistent with United States (U.S.) Environmental Protection Agency’s (EPA’s) User’s Guide for the EPA Regulatory Model – AERMOD (AERMOD User’s Guide)1, New York State Division of Air Resources (DAR) DAR-1 titled “Guidelines for the Evaluation and
1 U.S. EPA, User’s Guide for the AMS/EPA Regulatory Model – AERMOD, EPA-454/B-19-027, August 2019.
>
>
> >
> > >
>

Tradebe Environmental Services, LLC – Norlite, LLC | Modeling Report Trinity Consultants 1-2
Control of Ambient Air Contaminants under Part 212” 2, and DAR-10 titled “NYSDEC Guidelines on Dispersion Modeling Procedures for Air Quality Impact Analysis”3.
1.2. SITE DESCRIPTION
Norlite Facility is located in Cohoes, NY (Albany County). Figure 1-1 presents an aerial map of the existing Norlite Facility. A site layout is included in Attachment A. The facility is located at the following address:
628 Saratoga St, Cohoes, NY 12047
Following is the contact information for Norlite: Air Permit Contact
Prince Knight Environmental & Regulatory Compliance Manager 628 Saratoga St, Cohoes, NY 12047 Office Phone: (518) 235-0401
Facility Contact
David Maguffin Plant Manager Office Phone: (518) 235-0401
2 NYSDEC DAR-1 Guidance: http://www.dec.ny.gov/docs/air_pdf/dar1.pdf
3 NYSDEC DAR-10 Guidance: http://www.dec.ny.gov/docs/air_pdf/dar10.pdf

Tradebe Environmental Services, LLC – Norlite, LLC | Modeling Report Trinity Consultants 1-3
Figure 1-1. Aerial Map of Norlite

Tradebe Environmental Services, LLC – Norlite, LLC | Modeling Report Trinity Consultants 2-1
2. REGULATORY STANDARDS
The objective of this modeling analysis is to show compliance of Norlite’s operations with NAAQS and Part 212 requirements.
2.1. CRITERIA POLLUTANT MODELING
The emissions of criteria pollutants associated with Project Delta were modeled to show that this project does not result in offsite impacts which exceed the NAAQS. The NAAQS are the maximum concentration ceilings, measured in terms of total concentration of a pollutant in the atmosphere, which define the “levels of air quality which the U.S. EPA judges are necessary, with an adequate margin of safety, to protect the public health”.4 The NAAQS addressed in this air dispersion modeling analysis are shown in Table 2-1.
Table 2-1. Applicable NAAQS for Criteria Air Pollutants
Pollutant
Averaging
Period
NAAQS
(µg/m3)
CO 1-hour
8-hour
40,000 (35 ppm)1
10,000 (9 ppm)1
SO2 3 1-hour 196 (0.075 ppm)2
3-hour 1,300 (0.5 ppm)
24-hour 365 (0.14 ppm)
Annual 80 (0.03 ppm)
NO2 1-hour
Annual
188 (100 ppb)5
100 (0.053 ppm)4
PM10 24-hour 1506
PM2.5 24-hour
Annual
357
128 1 Not to be exceeded more than once per year.
2 The 3-year average of the 99th percentile of the daily maximum 1-hr average.
3 Effective August 23, 2010 U.S. EPA revoked the 24-hr and Annual SO2 NAAQS (75 FR 35520, Primary National Ambient Air Quality Standards for Sulfur Dioxide, June 22, 2010), however, they remain in place until the state implementation plans are approved.
4 Annual arithmetic average.
5 The 3-year average of the 98th percentile of the daily maximum 1-hr average.
6 Not to be exceeded more than once per year on average over a 3-year period. 7 The 3-year average of the 98th percentile 24-hour average concentration. 8 The 3-year average of the annual arithmetic average concentration.
4 40 CFR §50.2(b).

Tradebe Environmental Services, LLC – Norlite, LLC | Modeling Report Trinity Consultants 2-2
The sum of the facility’s maximum modeled concentration and the background concentration were evaluated against NAAQS and are presented in Section 4. This criteria pollutant analysis was evaluated for emission sources which may be impacted by Project Delta, pollutants, averaging periods, and emission rates as included in Table 2-2. The background concentrations can be found in Table 2-3.
Table 2-2. Criteria Pollutant Emission Rates
AERMOD
ID Description
PM10
(lb/hr)
PM2.5
(lb/hr)
NO2
(lb/hr)
SO2
(lb/hr)
CO
(lb/hr)
Short-Term Long-Term Short-Term
New_SCB1 New Scrubber for Kiln #1 5.94 4.48 4.48 22.4 28.0 1.67
New_SCB2 New Scrubber for Kiln #2 5.94 4.48 4.48 22.4 28.0 1.67
CC1_New Clinker Cooler #1 4.94 2.35 2.35 -- -- --
CC2_New Clinker Cooler #2 4.94 2.35 2.35 -- -- --
FPC Finishing Plant Crusher 0.33 0.08 0.22 -- -- --
PSH_New Shale Storage Silo 6.01E-03 2.13E-04 9.10E-04 -- -- --
KFR_1new New Rim Seal & Loading
Location Kiln 1 1.76E-03 2.66E-04 2.66E-04
-- --
--
KFR_2new New Rim Seal & Loading
Location Kiln 2 1.76E-03 2.66E-04 2.66E-04
-- --
--

Tradebe Environmental Services, LLC – Norlite, LLC | Modeling Report Trinity Consultants 2-3
Table 2-3. Background Concentrations
Pollutant
Averaging
Period
Monitor
Background
Concentration
(g/m3)
Metric Source Monitor Location
NO2
1-hour 65.50 3-yr average of 98th percentile EPA AirData AQS Site ID 50-021-0002
(Rutland VT)
Annual 14.14 Maximum annual average from
the last three years
EPA AirData AQS Site ID 50-021-0002
(Rutland VT)
SO2
1-hour 13.02 3-yr average of 99th percentile NYSDEC 2017 Air
Quality Report
AQS Site ID 36-001-0012
(Loudonville NY)
3-hour 13.02 Not to be exceeded more than
once per calendar year
Conservative
Assumption based
on 1-hour standard
AQS Site ID 36-001-0012
(Loudonville NY)
24-hour 13.02 Not to be exceeded more than
once per calendar year
Conservative
Assumption based
on 1-hour standard
AQS Site ID 36-001-0012
(Loudonville NY)
Annual 3.40 Maximum annual average from
the last three years.
NYSDEC 2017 Air
Quality Report
AQS Site ID 36-001-0012
(Loudonville NY)
PM2.5
24-hr 15.9 98th percentile averaged over
the last three years
NYSDEC 2017 Air
Quality Report
AQS Site ID 36-001-0012
(Loudonville NY)
Annual 6.1 Annual average, averaged over
the last three years
NYSDEC 2017 Air
Quality Report
AQS Site ID 36-001-0012
(Loudonville NY)
PM10 24-hour 35 Maximum second maximum
value over the last three years.
EPA AirData AQS Site ID 50-021-0002
(Rutland VT)
CO
1-hour 343.5 Maximum second maximum
value over the last three years.
NYSDEC 2017 Air
Quality Report
AQS Site ID 36-001-0012
(Loudonville NY)
8-hour 229.0 Maximum second maximum
value over the last three years.
NYSDEC 2017 Air
Quality Report
AQS Site ID 36-001-0012
(Loudonville NY)
2.2. STATE TOXICS PERMITTING AND MODELING
The emissions from each toxic air contaminant known to be emitted from the kilns and other Part 212-subject process emission sources on site have been calculated as presented in Attachment B. For consistency, the Emissions of Toxic Air Contaminants section of Attachment B of the Project Delta Air Permit Application submitted in December 2018 is incorporated into Attachment B of this modeling protocol directly. For each of those process emission sources and compounds, an evaluation was completed to determine if modeling was required for the emission of each individual contaminant from process emission sources subject to Part 212. The evaluation included consideration of the following special cases for which modeling may not be required:
Site-wide potential to emit (PTE) of HTAC below the Mass Emission Limit (MEL) in §212-2.2 Table 2. For compounds that meet these criteria, Part 212 is satisfied per §212-2.1(a). • For these compounds, no further evaluation is required under Part 212.
HTAC regulated by an applicable National Emission Standards for Hazardous Air Pollutants (NESHAP) for which the facility is in compliance.
>
>
Tradebe Environmental Services, LLC – Norlite, LLC | Modeling Report Trinity Consultants 2-4
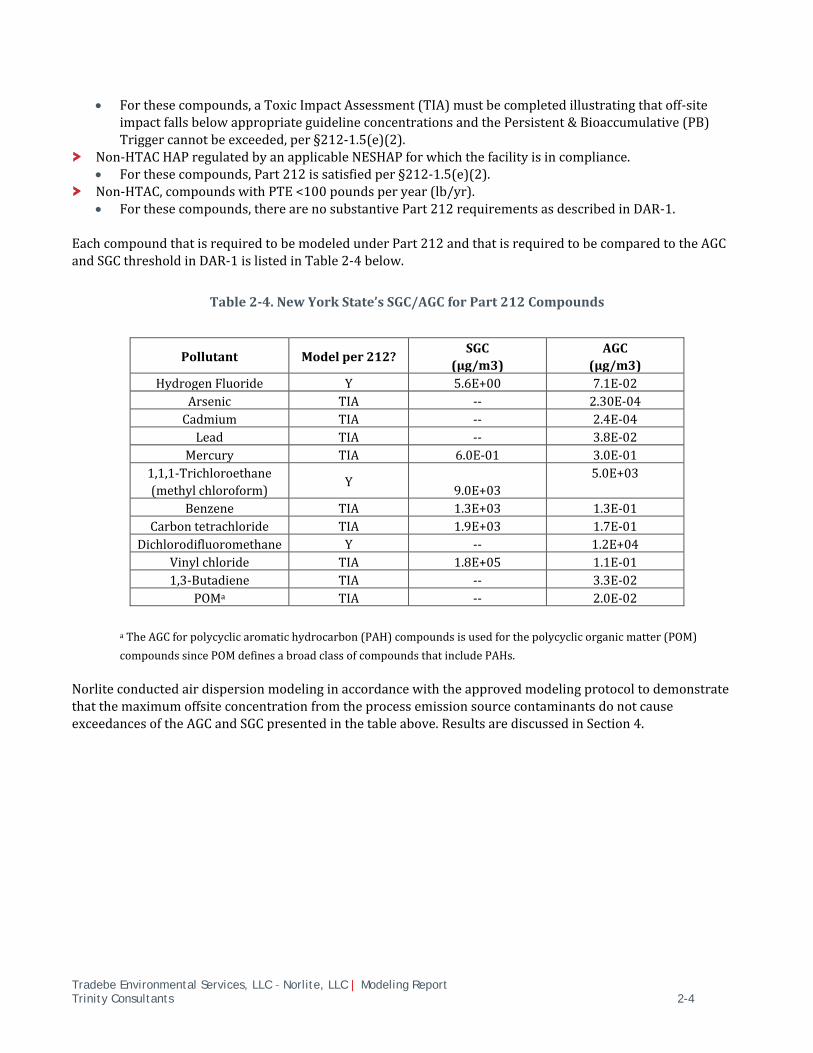
• For these compounds, a Toxic Impact Assessment (TIA) must be completed illustrating that off-site impact falls below appropriate guideline concentrations and the Persistent & Bioaccumulative (PB) Trigger cannot be exceeded, per §212-1.5(e)(2).
Non-HTAC HAP regulated by an applicable NESHAP for which the facility is in compliance. • For these compounds, Part 212 is satisfied per §212-1.5(e)(2).
Non-HTAC, compounds with PTE <100 pounds per year (lb/yr). • For these compounds, there are no substantive Part 212 requirements as described in DAR-1.
Each compound that is required to be modeled under Part 212 and that is required to be compared to the AGC and SGC threshold in DAR-1 is listed in Table 2-4 below.
Table 2-4. New York State’s SGC/AGC for Part 212 Compounds
Pollutant Model per 212? SGC
(µg/m3)
AGC
(µg/m3)
Hydrogen Fluoride Y 5.6E+00 7.1E-02
Arsenic TIA -- 2.30E-04
Cadmium TIA -- 2.4E-04
Lead TIA -- 3.8E-02
Mercury TIA 6.0E-01 3.0E-01
1,1,1-Trichloroethane
(methyl chloroform) Y
9.0E+03
5.0E+03
Benzene TIA 1.3E+03 1.3E-01
Carbon tetrachloride TIA 1.9E+03 1.7E-01
Dichlorodifluoromethane Y -- 1.2E+04
Vinyl chloride TIA 1.8E+05 1.1E-01
1,3-Butadiene TIA -- 3.3E-02
POMa TIA -- 2.0E‐02
a The AGC for polycyclic aromatic hydrocarbon (PAH) compounds is used for the polycyclic organic matter (POM)
compounds since POM defines a broad class of compounds that include PAHs.
Norlite conducted air dispersion modeling in accordance with the approved modeling protocol to demonstrate that the maximum offsite concentration from the process emission source contaminants do not cause exceedances of the AGC and SGC presented in the table above. Results are discussed in Section 4.
>
>
Tradebe Environmental Services, LLC – Norlite, LLC | Modeling Report Trinity Consultants 3-1
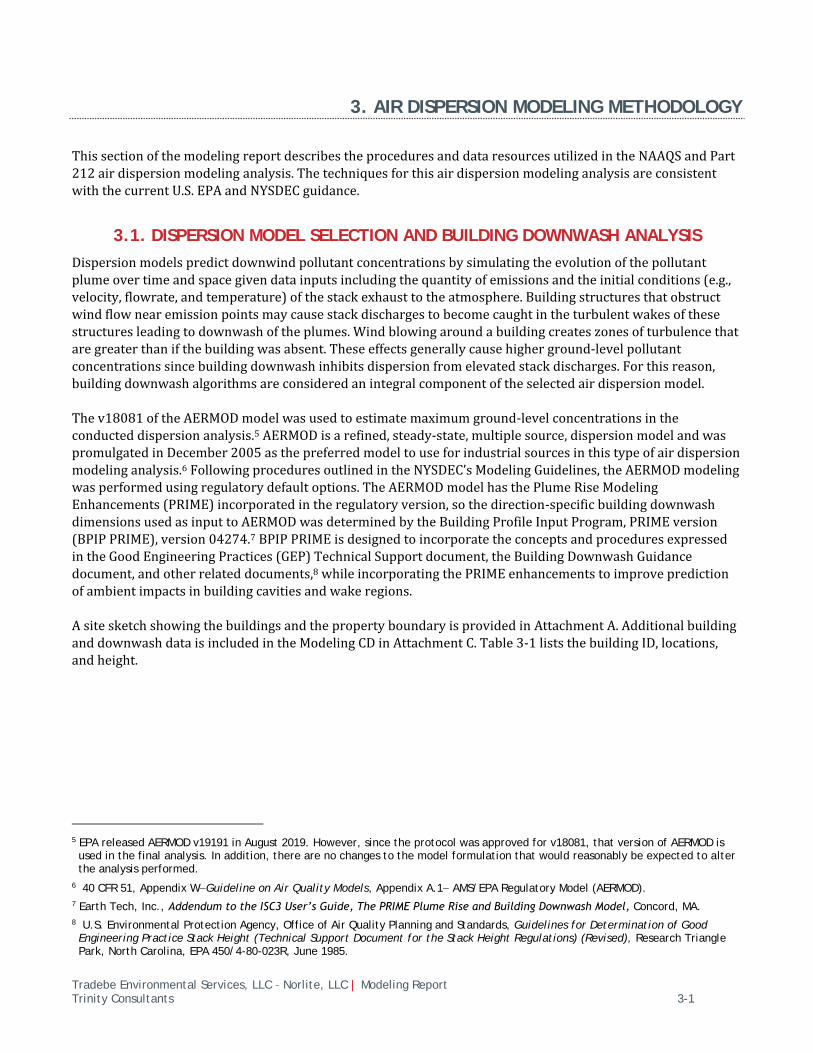
3. AIR DISPERSION MODELING METHODOLOGY
This section of the modeling report describes the procedures and data resources utilized in the NAAQS and Part 212 air dispersion modeling analysis. The techniques for this air dispersion modeling analysis are consistent with the current U.S. EPA and NYSDEC guidance.
3.1. DISPERSION MODEL SELECTION AND BUILDING DOWNWASH ANALYSIS
Dispersion models predict downwind pollutant concentrations by simulating the evolution of the pollutant plume over time and space given data inputs including the quantity of emissions and the initial conditions (e.g., velocity, flowrate, and temperature) of the stack exhaust to the atmosphere. Building structures that obstruct wind flow near emission points may cause stack discharges to become caught in the turbulent wakes of these structures leading to downwash of the plumes. Wind blowing around a building creates zones of turbulence that are greater than if the building was absent. These effects generally cause higher ground-level pollutant concentrations since building downwash inhibits dispersion from elevated stack discharges. For this reason, building downwash algorithms are considered an integral component of the selected air dispersion model. The v18081 of the AERMOD model was used to estimate maximum ground-level concentrations in the conducted dispersion analysis.5 AERMOD is a refined, steady-state, multiple source, dispersion model and was promulgated in December 2005 as the preferred model to use for industrial sources in this type of air dispersion modeling analysis.6 Following procedures outlined in the NYSDEC’s Modeling Guidelines, the AERMOD modeling was performed using regulatory default options. The AERMOD model has the Plume Rise Modeling Enhancements (PRIME) incorporated in the regulatory version, so the direction-specific building downwash dimensions used as input to AERMOD was determined by the Building Profile Input Program, PRIME version (BPIP PRIME), version 04274.7 BPIP PRIME is designed to incorporate the concepts and procedures expressed in the Good Engineering Practices (GEP) Technical Support document, the Building Downwash Guidance document, and other related documents,8 while incorporating the PRIME enhancements to improve prediction of ambient impacts in building cavities and wake regions. A site sketch showing the buildings and the property boundary is provided in Attachment A. Additional building and downwash data is included in the Modeling CD in Attachment C. Table 3-1 lists the building ID, locations, and height.
5 EPA released AERMOD v19191 in August 2019. However, since the protocol was approved for v18081, that version of AERMOD is used in the final analysis. In addition, there are no changes to the model formulation that would reasonably be expected to alter the analysis performed.
6 40 CFR 51, Appendix W−Guideline on Air Quality Models, Appendix A.1− AMS/EPA Regulatory Model (AERMOD).
7 Earth Tech, Inc., Addendum to the ISC3 User’s Guide, The PRIME Plume Rise and Building Downwash Model, Concord, MA.
8 U.S. Environmental Protection Agency, Office of Air Quality Planning and Standards, Guidelines for Determination of Good Engineering Practice Stack Height (Technical Support Document for the Stack Height Regulations) (Revised), Research Triangle Park, North Carolina, EPA 450/4-80-023R, June 1985.

Tradebe Environmental Services, LLC – Norlite, LLC | Modeling Report Trinity Consultants 3-2
Table 3-1. Building Locations
Modeling
ID
X Coordinate
(m)
Y Coordinate
(m)
Elevation
(m)
Height
(m)
B1 606106.8 4734523.1 18.57 5.49
B2 606105.5 4734510.7 17.15 5.49
B3 606097.2 4734451.9 14.25 5.49
B4 606070.6 4734433.8 20.67 12.19
B5 606071.0 4734448.2 21.04 6.10
B6 606054.8 4734433.2 20.99 7.01
B7 606046.7 4734427.8 20.57 5.79
B8 606051.3 4734393.1 17.76 3.66
B9 606042.0 4734392.9 17.39 2.74
B10 606115.9 4734415.2 13.96 4.27
B11 606113.4 4734382.6 15.88 3.35
B12 605949.6 4734223.5 18.04 11.89
B13 606166.2 4734229.7 10.82 15.85
B14 606029.0 4734196.3 14.33 4.88
B15 606030.7 4734196.1 14.13 7.92
B17 606060.7 4734256.8 13.56 4.57
B18 606050.1 4734283.7 15.23 8.53
B19 606049.6 4734271.2 14.86 10.06
B20 606073.3 4734300.0 11.85 3.96
B22 606213.7 4734306.2 9.42 9.14
B23 606026.6 4734266.1 17.90 26.52
B24 606066.6 4734298.2 12.33 12.19
B25 606062.0 4734298.5 12.97 12.19
B26 606031.9 4734288.8 17.74 18.29
APC_ 606029.5 4734288.9 17.89 27.00
STRG 606021.3 4734241.5 17.58 4.88
3.2. TREATMENT OF TERRAIN
Through the use of the AERMOD terrain preprocessor (AERMAP), AERMOD incorporates not only the receptor heights, but also an effective height (hill height scale) that represents the significant terrain features surrounding a given receptor that could lead to plume recirculation and other terrain interaction.9 Receptor, building and source terrain elevations input to the model were interpolated from 1/3 arc-second National Elevation Dataset (NED) data obtained from the U.S. Geological Survey (USGS) from datum year 1983. The array elevations were interpolated using the version 18081 of AERMAP. AERMAP searches all NED points for the terrain height and location that has the greatest influence on each receptor to determine the hill height scale for that receptor.
9 EPA, Users Guide for the AERMOD Terrain Preprocessor (AERMAP), EPA-454/B-03-003, Research Triangle Park, NC.
Tradebe Environmental Services, LLC – Norlite, LLC | Modeling Report Trinity Consultants 3-3
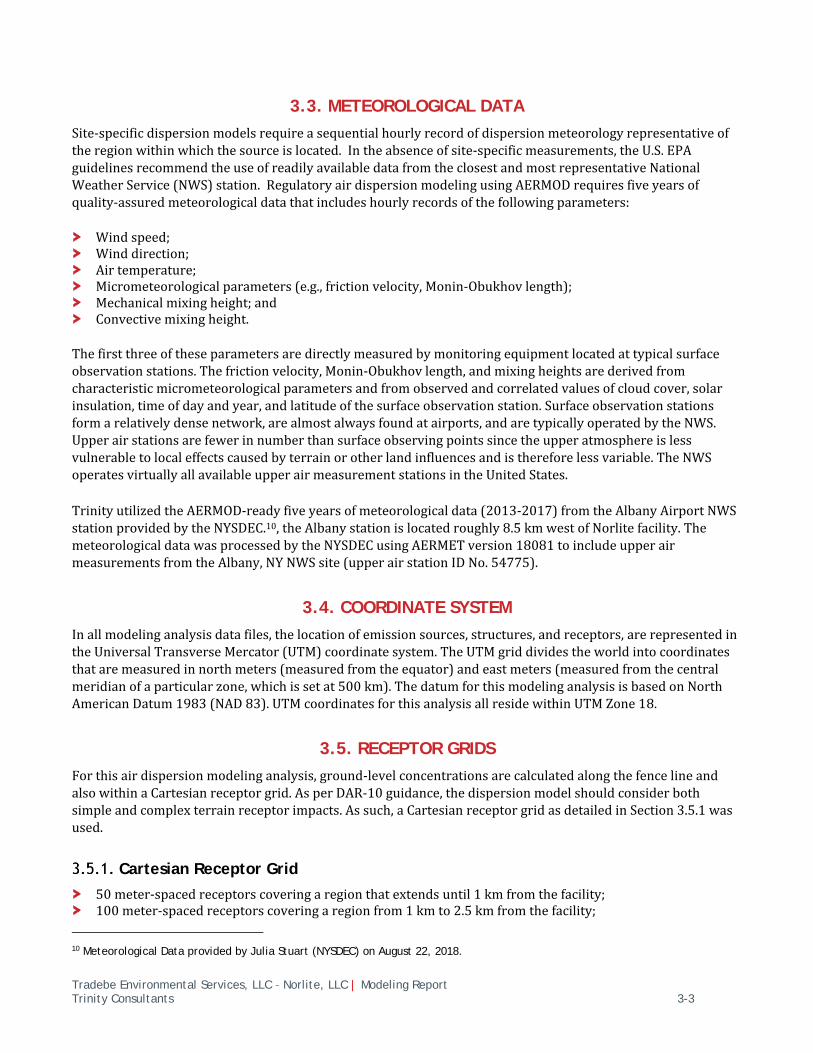
3.3. METEOROLOGICAL DATA
Site-specific dispersion models require a sequential hourly record of dispersion meteorology representative of the region within which the source is located. In the absence of site-specific measurements, the U.S. EPA guidelines recommend the use of readily available data from the closest and most representative National Weather Service (NWS) station. Regulatory air dispersion modeling using AERMOD requires five years of quality-assured meteorological data that includes hourly records of the following parameters:
Wind speed; Wind direction; Air temperature; Micrometeorological parameters (e.g., friction velocity, Monin-Obukhov length); Mechanical mixing height; and Convective mixing height.
The first three of these parameters are directly measured by monitoring equipment located at typical surface observation stations. The friction velocity, Monin-Obukhov length, and mixing heights are derived from characteristic micrometeorological parameters and from observed and correlated values of cloud cover, solar insulation, time of day and year, and latitude of the surface observation station. Surface observation stations form a relatively dense network, are almost always found at airports, and are typically operated by the NWS. Upper air stations are fewer in number than surface observing points since the upper atmosphere is less vulnerable to local effects caused by terrain or other land influences and is therefore less variable. The NWS operates virtually all available upper air measurement stations in the United States.
Trinity utilized the AERMOD-ready five years of meteorological data (2013-2017) from the Albany Airport NWS station provided by the NYSDEC.10, the Albany station is located roughly 8.5 km west of Norlite facility. The meteorological data was processed by the NYSDEC using AERMET version 18081 to include upper air measurements from the Albany, NY NWS site (upper air station ID No. 54775).
3.4. COORDINATE SYSTEM
In all modeling analysis data files, the location of emission sources, structures, and receptors, are represented in the Universal Transverse Mercator (UTM) coordinate system. The UTM grid divides the world into coordinates that are measured in north meters (measured from the equator) and east meters (measured from the central meridian of a particular zone, which is set at 500 km). The datum for this modeling analysis is based on North American Datum 1983 (NAD 83). UTM coordinates for this analysis all reside within UTM Zone 18.
3.5. RECEPTOR GRIDS
For this air dispersion modeling analysis, ground-level concentrations are calculated along the fence line and also within a Cartesian receptor grid. As per DAR-10 guidance, the dispersion model should consider both simple and complex terrain receptor impacts. As such, a Cartesian receptor grid as detailed in Section 3.5.1 was used.
Cartesian Receptor Grid
50 meter-spaced receptors covering a region that extends until 1 km from the facility; 100 meter-spaced receptors covering a region from 1 km to 2.5 km from the facility;
10 Meteorological Data provided by Julia Stuart (NYSDEC) on August 22, 2018.
> > > > > >
3.5.1.
> >

Tradebe Environmental Services, LLC – Norlite, LLC | Modeling Report Trinity Consultants 3-4
250 meter-spaced receptors covering a region from 2.5 km to 5 km from the facility; and 500 meter-spaced receptors covering a region from 5km to 10 km from the facility.
The receptor grid is presented in Figure 3-1.
Figure 3-1. Facility Receptor Grid
Fence Line Receptors
Receptors were placed along the length of the property line spaced at 25-meter-intervals. The fence line is shown in Figure 3-2 as the purple outline.
> >
3.5.2.

Tradebe Environmental Services, LLC – Norlite, LLC | Modeling Report Trinity Consultants 3-5
Figure 3-2. Facility Fence line
Sensitive Receptors
In evaluating the surrounding 2 km area of the Norlite facility in Google Earth™, Trinity did not visually locate any hospitals within this area. However, there are several residences within this area. In addition, both schools and nursing homes that may be considered sensitive receptors were identified within the 2 km area. Those that were identified are listed below. The tightly-spaced receptor grid near the facility will represent the ambient model concentration for the neighborhoods in this area. Schools within this area are as follows:
Heatly School Watervliet Elementary School Abram Lansing School Cohoes Middle School Cohoes High School Harmony Hill School Page Avenue Elementary School Troy School
3.5.3.
> > > > > > > >

Tradebe Environmental Services, LLC – Norlite, LLC | Modeling Report Trinity Consultants 3-6
Van Schaick Island School Maplewood School
Nursing homes within this area are as follows:
OD Heck-Watervliet Home Eddy Visiting Nurse and Rehab Association
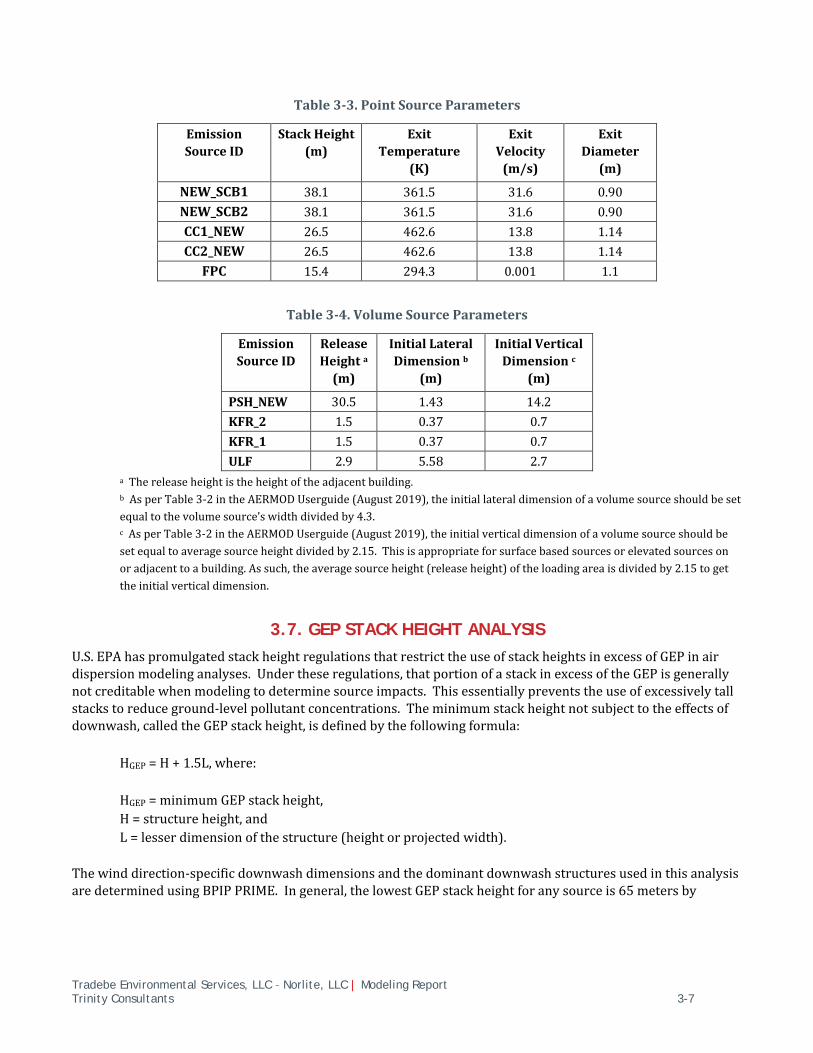
3.6. SOURCE TYPES AND STACK PARAMETERS
The AERMOD dispersion model allows for emission units to be represented as point, area, or volume sources. In this modeling analysis, the new kilns and the new clinker coolers are represented as point sources. Truck unloading (ULF) is represented as a volume source. Only the kilns are included in the 1-hr NO2 and 1-hr SO2 modeling analysis per discussion with NYSDEC. Table 3-2 presents the modeled source locations at Norlite. The coordinates are expressed in UTM NAD83, Zone 18 coordinates.
Table 3-2. Source Locations
Emission
Source ID
Emission Source Description Elevation
(m)
UTM East
(m)
UTM North
(m)
NEW_SCB1 New Scrubber for Kiln #1 18.1 606017.7 4734280.2
NEW_SCB2 New Scrubber for Kiln #2 18.1 606021.0 4734291.3
CC1_NEW Clinker Cooler #1 11.7 606119.5 4734258.3
CC2_NEW Clinker Cooler #2 11.9 606120.9 4734275.2
FPC Finishing Plant Crusher 10.8 606161.3 4734217.8
PSH_NEW Shale Storage Silo (New Source) 17.9 606026.3 4734266.2
KFR_2 New Rim Seal and Loading
Location Kiln 2
15.4 606048.3 4734280.7
KFR_1 New Rim Seal and Loading
Location Kiln 1
15.1 606046.6 4734269.0
ULF Alternate Fuel Unloading 18.5 606045.4 4734408.8
The source parameters for the point and volume emission sources are listed in Table 3-3 and Table 3-4 respectively. The site layout in Attachment A depicts the approximate location of all the sources on site, including the modeled volume and point sources to be used to model at Norlite.
> >
> >
Tradebe Environmental Services, LLC – Norlite, LLC | Modeling Report Trinity Consultants 3-7
Table 3-3. Point Source Parameters
Emission
Source ID
Stack Height
(m)
Exit
Temperature
(K)
Exit
Velocity
(m/s)
Exit
Diameter
(m)
NEW_SCB1 38.1 361.5 31.6 0.90
NEW_SCB2 38.1 361.5 31.6 0.90
CC1_NEW 26.5 462.6 13.8 1.14
CC2_NEW 26.5 462.6 13.8 1.14
FPC 15.4 294.3 0.001 1.1
Table 3-4. Volume Source Parameters
Emission
Source ID
Release
Height a
(m)
Initial Lateral
Dimension b
(m)
Initial Vertical
Dimension c
(m)
PSH_NEW 30.5 1.43 14.2
KFR_2 1.5 0.37 0.7
KFR_1 1.5 0.37 0.7
ULF 2.9 5.58 2.7
a The release height is the height of the adjacent building. b As per Table 3-2 in the AERMOD Userguide (August 2019), the initial lateral dimension of a volume source should be set
equal to the volume source’s width divided by 4.3. c As per Table 3-2 in the AERMOD Userguide (August 2019), the initial vertical dimension of a volume source should be
set equal to average source height divided by 2.15. This is appropriate for surface based sources or elevated sources on
or adjacent to a building. As such, the average source height (release height) of the loading area is divided by 2.15 to get
the initial vertical dimension.
3.7. GEP STACK HEIGHT ANALYSIS
U.S. EPA has promulgated stack height regulations that restrict the use of stack heights in excess of GEP in air dispersion modeling analyses. Under these regulations, that portion of a stack in excess of the GEP is generally not creditable when modeling to determine source impacts. This essentially prevents the use of excessively tall stacks to reduce ground-level pollutant concentrations. The minimum stack height not subject to the effects of downwash, called the GEP stack height, is defined by the following formula:
HGEP = H + 1.5L, where:
HGEP = minimum GEP stack height,
H = structure height, and
L = lesser dimension of the structure (height or projected width).
The wind direction-specific downwash dimensions and the dominant downwash structures used in this analysis are determined using BPIP PRIME. In general, the lowest GEP stack height for any source is 65 meters by

Tradebe Environmental Services, LLC – Norlite, LLC | Modeling Report Trinity Consultants 3-8
default.11 The actual stack height of the scrubbers and clinker coolers are less than the GEP height, therefore their actual height was modeled. GEP stack height does not apply to volume sources.
11 40 CFR §51.100(ii).

Tradebe Environmental Services, LLC – Norlite, LLC | Modeling Report Trinity Consultants 3-9
4. AIR DISPERSION MODELING RESULTS
This section presents the results of the NAAQS, toxics, and unitized modeling analyses performed, following the procedures outlined in Sections 2 and 3. CD’s for all AERMOD model runs are provided as Attachment C.
4.1. NAAQS ANALYSIS RESULTS
Emissions from the sources at Norlite were modeled and compared to the NAAQS. The results of the NAAQS analysis are presented in Tables 4-1 through 4-11.
Table 4-1. Modeling Results – PM10 24-Hour
H6H Modeled Concentration
(μg/m3)
Background
(μg/m3)
Total
Concentration
(μg/m3)
NAAQS
(μg/m3)
Below
NAAQS?
2013 2014 2015 2016 2017 Max.
10.87 9.20 9.53 9.57 8.97 10.87 35 45.87 150 Yes
Table 4-2. Modeling Results – PM2.5 24-Hour
5-year Average
H8H Modeled
Concentration
(μg/m3)
Background
(μg/m3)
Total
Concentration
(μg/m3)
NAAQS
(μg/m3)
Below
NAAQS?
6.13 15.9 22.03 35 Yes
Table 4-3. Modeling Results – PM2.5 Annual
5-year Average
Modeled
Concentration
(μg/m3)
Background
(μg/m3)
Total
Concentration
(μg/m3)
NAAQS
(μg/m3)
Below
NAAQS?
1.10 6.1 7.2 12 Yes
Table 4-4. Modeling Results – NO2 1-Hour
5-year Average
H8H Modeled
Concentration
(μg/m3)
Background
(μg/m3)
Total
Concentration
(μg/m3)
NAAQS
(μg/m3)
Below
NAAQS?
177.20 Included12 177.20 188 Yes
12 A background concentration of 65.5 ug/m3 was included in the AERMOD file as an annual background concentration. Therefore, the presented H8H modeled concentration includes this background value in the result.
I I I

Tradebe Environmental Services, LLC – Norlite, LLC | Modeling Report Trinity Consultants 3-10
Table 4-5. Modeling Results – NO2 Annual
1st High Modeled Concentration
(μg/m3)
Background
(μg/m3)
Total
Concentration
(μg/m3)
NAAQS
(μg/m3)
Below
NAAQS?
2013 2014 2015 2016 2017 Max.
3.21 3.00 3.02 3.30 2.93 3.30 14.14 17.44 100 Yes
Table 4-6. Modeling Results – SO2 1-Hour
5-year Average
H4H Modeled
Concentration
(μg/m3)
Background
(μg/m3)
Total
Concentration
(μg/m3)
NAAQS
(μg/m3)
Below
NAAQS?
173.81 13.02 186.83 196 Yes
Table 4-7. Modeling Results – SO2 3-Hour
2nd High Modeled Concentration
(μg/m3)
Background
(μg/m3)
Total
Concentration
(μg/m3)
NAAQS
(μg/m3)
Below
NAAQS?
2013 2014 2015 2016 2017 Max.
97.04 81.35 100.49 86.55 94.66 100.49 13.02 113.51 1300 Yes
Table 4-8. Modeling Results – SO2 24-Hour
2nd High Modeled Concentration
(μg/m3)
Background
(μg/m3)
Total
Concentration
(μg/m3)
NAAQS
(μg/m3)
Below
NAAQS?
2013 2014 2015 2016 2017 Max.
23.12 29.04 28.23 30.71 25.69 30.71 13.02 43.73 365 Yes
Table 4-9. Modeling Results – SO2 Annual
1st High Modeled Concentration
(μg/m3)
Background
(μg/m3)
Total
Concentration
(μg/m3)
NAAQS
(μg/m3)
Below
NAAQS?
2013 2014 2015 2016 2017 Max.
4.46 4.16 4.20 4.58 4.07 4.58 3.40 7.98 80 Yes
Table 4-10. Modeling Results – CO 1-Hour
H2H Modeled Concentration
(μg/m3)
Background
(μg/m3)
Total
Concentration
(μg/m3)
NAAQS
(μg/m3)
Below
NAAQS?
2013 2014 2015 2016 2017 Max.
11.20 11.36 11.47 10.62 10.52 11.47 343.5 354.97 40,000 Yes
I I I I I I I I I I
I I I I I I I I I I
I I I I I I I I I I I
I I I I I I I I I I I

Tradebe Environmental Services, LLC – Norlite, LLC | Modeling Report Trinity Consultants 3-11
Table 4-11. Modeling Results –CO 8-Hour
H2H Modeled Concentration
(μg/m3)
Background
(μg/m3)
Total
Concentration
(μg/m3)
NAAQS
(μg/m3)
Below
NAAQS?
2013 2014 2015 2016 2017 Max.
2.55 2.29 2.61 2.40 2.35 2.61 229.0 231.61 10,000 Yes
4.2. AIR TOXICS ANALYSIS RESULTS
Emissions from the sources at Norlite were modeled and compared to the AGC and SGC. The results of the air toxics analysis are presented in Tables 4-12 and 4-13.
Table 4-12: Short-term Toxics Results
Pollutant CAS
Number
SGC
(µg/m3)
2013-2017
(µg/m3)
Below
SGC?
Hydrogen Fluoride 07664‐39‐3 5.6 1.26 Yes
Mercury 07439‐97‐6 0.6 0.03 Yes
1,1,1-
Trichloroethane 00071‐55‐6 9000 24.73 Yes
Benzene 00071‐43‐2 1300 18.17 Yes
Carbon tetrachloride 00056‐23‐5 1900 25.96 Yes
Vinyl chloride 00075‐01‐4 180000 1.13 Yes
Table 4-13: Long-term Toxics Results
Pollutant CAS
Number
AGC
(µg/m3)
2013
(µg/m3)
2014
(µg/m3)
2015
(µg/m3)
2016
(µg/m3)
2017
(µg/m3)
MAX
(µg/m3)
Below
AGC?
Hydrogen
Fluoride
07664‐
39‐3 7.1E-02 0.02867 0.02677 0.02698 0.02946 0.02615 0.02946 Yes
Arsenic 07440‐
38‐2 2.3E-04 0.00003 0.00003 0.00003 0.00003 0.00003 0.00003 Yes
Cadmium 07440‐
43‐9 2.4E-04 0.00004 0.00004 0.00004 0.00005 0.00004 0.00005 Yes
Lead 07439‐
92‐1 3.8E-02 0.00050 0.00047 0.00047 0.00051 0.00046 0.00051 Yes
Mercury 07439‐
97‐6 3.0E-01 0.00074 0.00069 0.00070 0.00076 0.00068 0.00076 Yes
1,1,1-
Trichloroethane
00071‐
55‐6 5.0E+03 0.07315 0.06471 0.07032 0.06888 0.06645 0.07315 Yes
Benzene 00071‐
43‐2 1.3E-01 0.05375 0.04760 0.05172 0.05061 0.04888 0.05375 Yes
Carbon
tetrachloride
00056‐
23‐5 1.7E-01 0.07684 0.06797 0.07386 0.07236 0.06980 0.07684 Yes
Dichlorodifluoro
methane
00075‐
71‐8 1.2E+04 0.02581 0.02410 0.02428 0.02652 0.02353 0.02652 Yes
I I I

Tradebe Environmental Services, LLC – Norlite, LLC | Modeling Report Trinity Consultants 3-12
Pollutant CAS
Number
AGC
(µg/m3)
2013
(µg/m3)
2014
(µg/m3)
2015
(µg/m3)
2016
(µg/m3)
2017
(µg/m3)
MAX
(µg/m3)
Below
AGC?
Vinyl chloride 00075‐
01‐4 1.1E-01 0.02565 0.02395 0.02413 0.02635 0.02339 0.02635 Yes
1,3-Butadiene 00106‐
99‐0 3.3E-02 0.02549 0.02380 0.02398 0.02619 0.02324 0.02619 Yes
POMb 0.02 0.00001 0.00001 0.00001 0.00001 0.00001 0.00001 Yes
4.3. UNITIZED MODELING ANALYSIS
During the pre-modeling meeting on August 21, 2018, NYSDEC personnel requested that a comparison between the modeled offsite impact of the existing kilns and the Project Delta kilns be completed as part of this modeling effort. To streamline this approach and demonstrate the difference between the proposed new scrubbers and existing scrubbers, a unitized modeling analysis was performed. This air dispersion modeling includes modeling an equal emission rate (i.e. one pound per hour) from each of the two existing stacks and two Project Delta stacks for 1-hour and annual averaging periods. This approach demonstrates that the ground level concentration impacts of the Project Delta scrubbers will be less than the existing scrubbers. The new scrubbers have different dispersion characteristics and a different stack height which result in lower concentrations downwind. Therefore, from a dispersion perspective, the new scrubbers result in a lower offsite impact. Figures 4-1 through 4-4 on the next two pages demonstrate the side-by-side impacts of the new proposed scrubber and the existing counterpart. Figures 4-1 and 4-2 present scrubber 1 and scrubber 2, respectively, at the 1-hour averaging period. The teal color represents concentrations of 1 ug/m3 and the dark blue color represents concentrations of 2 ug/m3. Since these are unitized, the concentration values are used to demonstrate order of magnitude and do not have any implications with respect to the AGC or SCG of any particular compound. The figure on the left represents the Project Delta scrubbers and the figure on the right represents the existing scrubbers.

Tradebe Environmental Services, LLC – Norlite, LLC | Modeling Report Trinity Consultants 3-13
Figure 4-1. Scrubber 1: 1-hour Averaging Period
Figure 4-2. Scrubber 2: 1-hour Averaging Period
Figures 4-3 and 4-4 present scrubber 1 and scrubber 2, respectively, at the annual averaging period. The teal color represents concentrations of 0.05 ug/m3 and the dark blue color represents concentrations of 0.10 ug/m3. Since these are unitized, the concentration values are used to demonstrate order of magnitude and do not have
New Scrubber Old Scrubber
New Scrubber Old Scrubber

Tradebe Environmental Services, LLC – Norlite, LLC | Modeling Report Trinity Consultants 3-14
any implications with respect to the AGC or SCG of any particular compound. The figure on the left represents the proposed new scrubber and the figure on the right represents the existing scrubber.
Figure 4-3. Scrubber 1: Annual Averaging Period
Figure 4-4. Scrubber 2: Annual Averaging Period
New Scrubber Old Scrubber
New Scrubber Old Scrubber

Tradebe Environmental Services, LLC – Norlite, LLC | Modeling Report Trinity Consultants 3-15
As illustrated in Figures 4-1 through 4-4, in all cases releases from the new Project Delta scrubbers result in a reduced impact area when compared to the existing scrubbers that have been in use at Norlite. Overall the net effect of Project Delta is beneficial with respect to off site impact.
4.4. SUMMARY OF RESULTS
Norlite is supplying this written air dispersion modeling report to provide the NYSDEC. Modeling files can be found on a CD as part of Attachment C. Norlite requests a written response to this report at NYSDEC’s earliest convenience.

Tradebe Environmental Services, LLC – Norlite, LLC | Modeling Report Trinity Consultants
ATTACHMENT A: FACILITY SITE LAYOUT
........................................................................................................................................................................................................................................................................ ,

Tradebe Environmental Services, LLC – Norlite, LLC | Modeling Report Trinity Consultants

Tradebe Environmental Services, LLC – Norlite, LLC | Modeling Report Trinity Consultants
ATTACHMENT B: MODELED TOXICS ........................................................................................................................................................................................................................................................................ ,
Norlite, LLC; Project Delta
Permit ID: 4‐0103‐00016/00048
Air Permit Application Appendix B
Revised December 2018
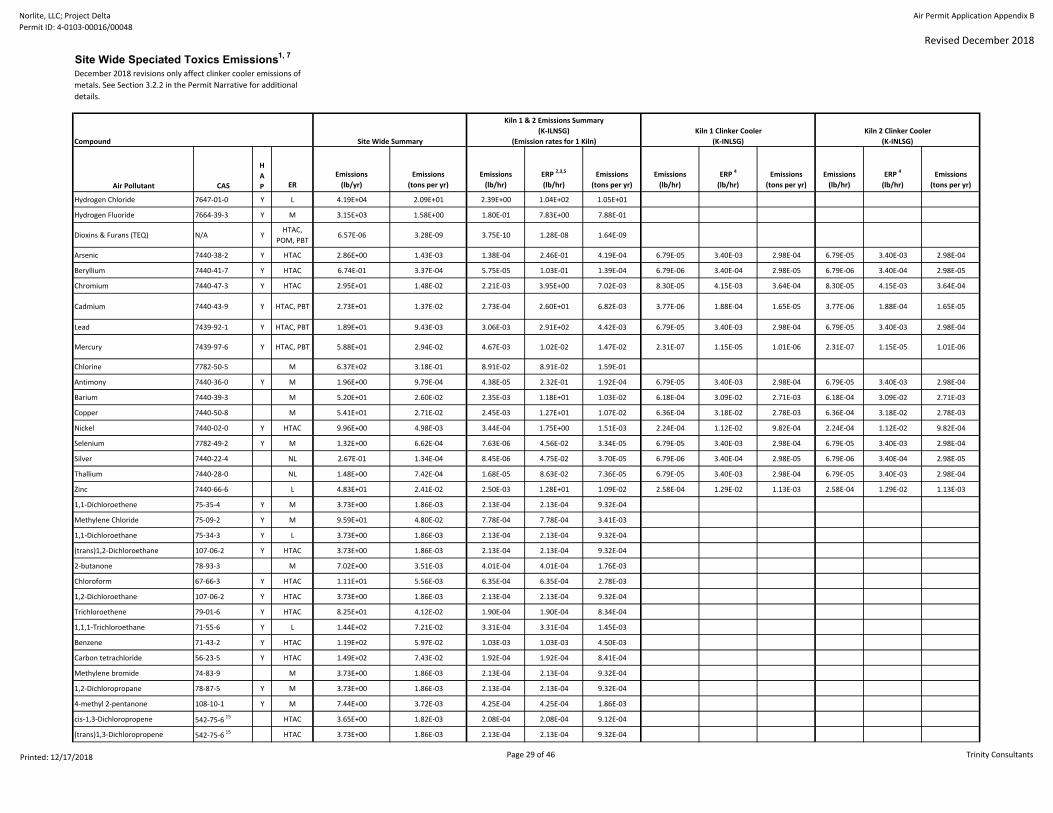
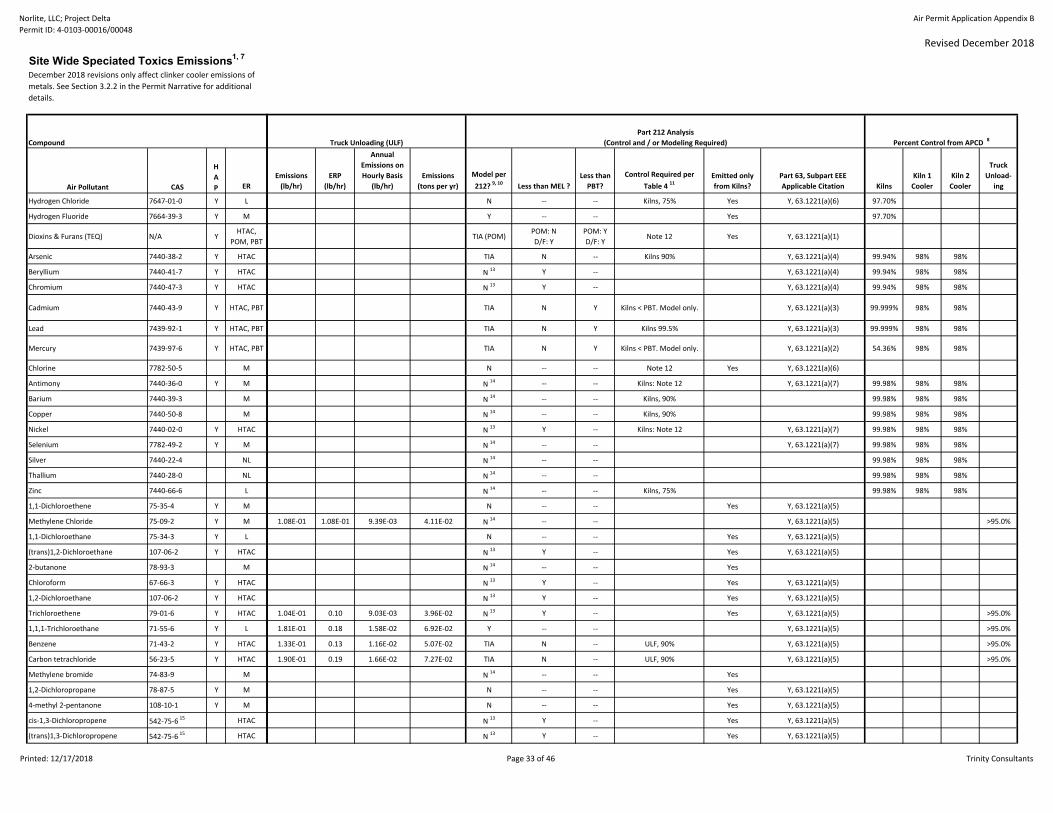
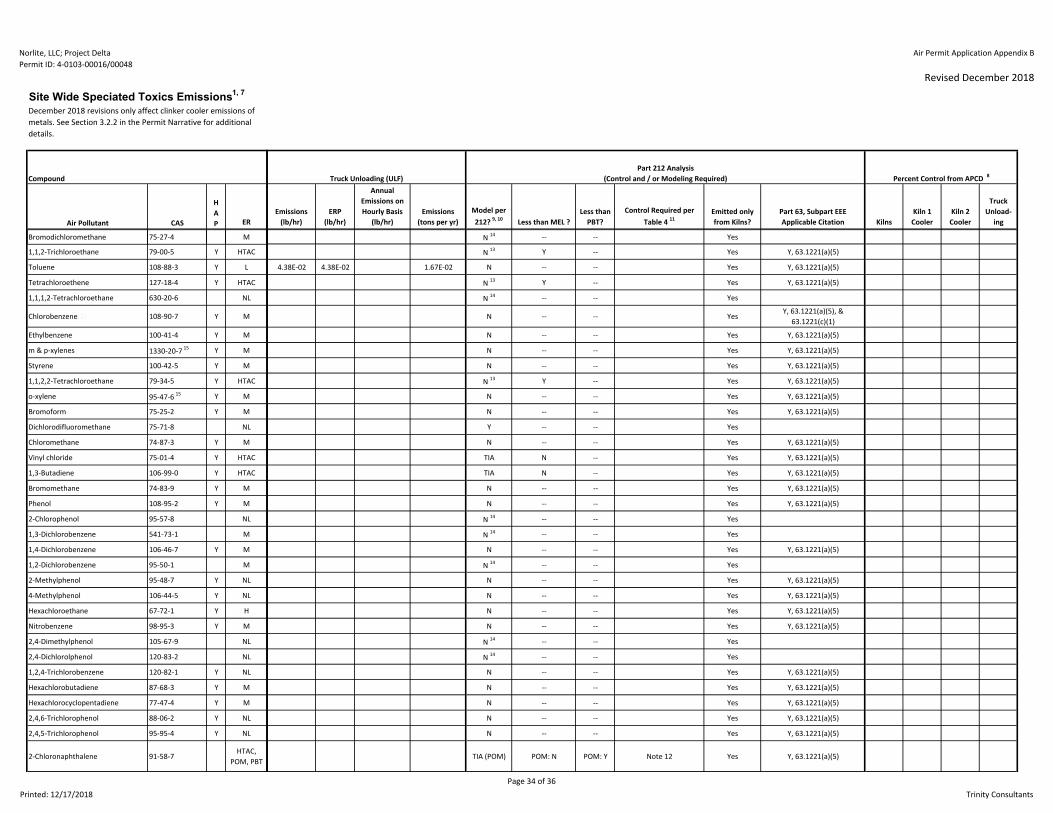
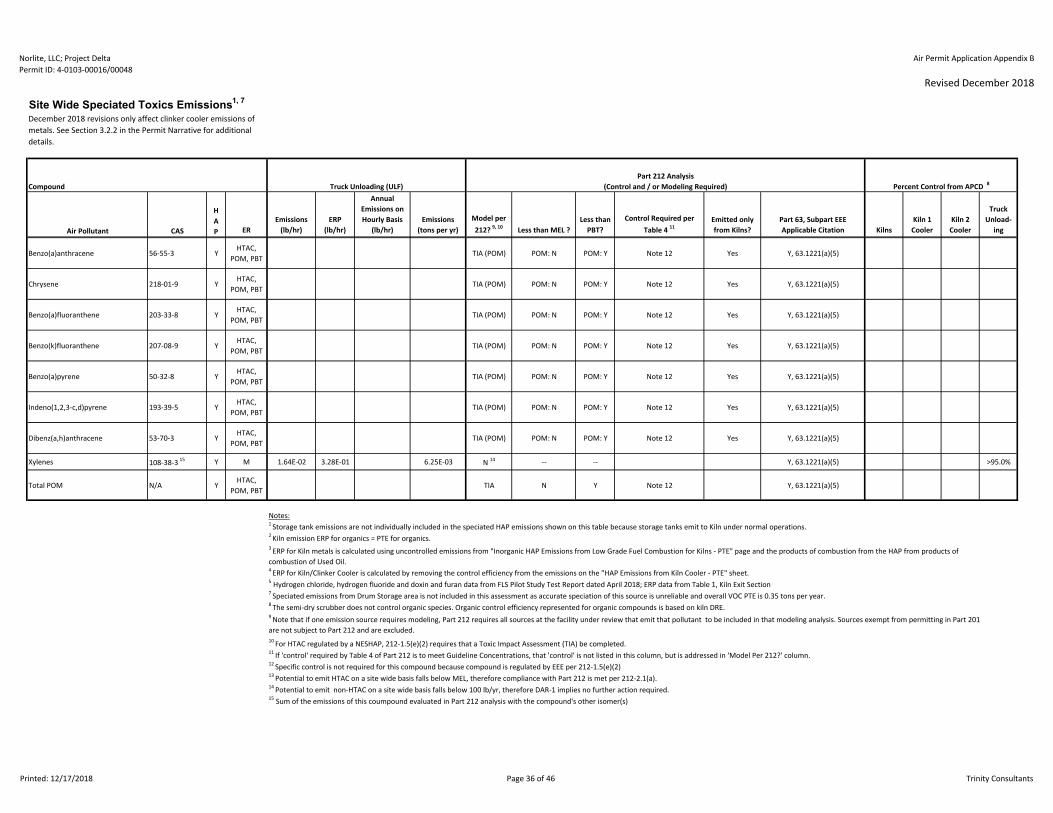
Site Wide Speciated Toxics Emissions1, 7
Air Pollutant CAS
H
A
P ER
Emissions
(lb/yr)
Emissions
(tons per yr)
Emissions
(lb/hr)
ERP 2,3,5
(lb/hr)
Emissions
(tons per yr)
Emissions
(lb/hr)
ERP 4
(lb/hr)
Emissions
(tons per yr)
Emissions
(lb/hr)
ERP 4
(lb/hr)
Emissions
(tons per yr)
Hydrogen Chloride 7647‐01‐0 Y L 4.19E+04 2.09E+01 2.39E+00 1.04E+02 1.05E+01
Hydrogen Fluoride 7664‐39‐3 Y M 3.15E+03 1.58E+00 1.80E‐01 7.83E+00 7.88E‐01
Dioxins & Furans (TEQ) N/A YHTAC,
POM, PBT6.57E‐06 3.28E‐09 3.75E‐10 1.28E‐08 1.64E‐09
Arsenic 7440‐38‐2 Y HTAC 2.86E+00 1.43E‐03 1.38E‐04 2.46E‐01 4.19E‐04 6.79E‐05 3.40E‐03 2.98E‐04 6.79E‐05 3.40E‐03 2.98E‐04
Beryllium 7440‐41‐7 Y HTAC 6.74E‐01 3.37E‐04 5.75E‐05 1.03E‐01 1.39E‐04 6.79E‐06 3.40E‐04 2.98E‐05 6.79E‐06 3.40E‐04 2.98E‐05
Chromium 7440‐47‐3 Y HTAC 2.95E+01 1.48E‐02 2.21E‐03 3.95E+00 7.02E‐03 8.30E‐05 4.15E‐03 3.64E‐04 8.30E‐05 4.15E‐03 3.64E‐04
Cadmium 7440‐43‐9 Y HTAC, PBT 2.73E+01 1.37E‐02 2.73E‐04 2.60E+01 6.82E‐03 3.77E‐06 1.88E‐04 1.65E‐05 3.77E‐06 1.88E‐04 1.65E‐05
Lead 7439‐92‐1 Y HTAC, PBT 1.89E+01 9.43E‐03 3.06E‐03 2.91E+02 4.42E‐03 6.79E‐05 3.40E‐03 2.98E‐04 6.79E‐05 3.40E‐03 2.98E‐04
Mercury 7439‐97‐6 Y HTAC, PBT 5.88E+01 2.94E‐02 4.67E‐03 1.02E‐02 1.47E‐02 2.31E‐07 1.15E‐05 1.01E‐06 2.31E‐07 1.15E‐05 1.01E‐06
Chlorine 7782‐50‐5 M 6.37E+02 3.18E‐01 8.91E‐02 8.91E‐02 1.59E‐01
Antimony 7440‐36‐0 Y M 1.96E+00 9.79E‐04 4.38E‐05 2.32E‐01 1.92E‐04 6.79E‐05 3.40E‐03 2.98E‐04 6.79E‐05 3.40E‐03 2.98E‐04
Barium 7440‐39‐3 M 5.20E+01 2.60E‐02 2.35E‐03 1.18E+01 1.03E‐02 6.18E‐04 3.09E‐02 2.71E‐03 6.18E‐04 3.09E‐02 2.71E‐03
Copper 7440‐50‐8 M 5.41E+01 2.71E‐02 2.45E‐03 1.27E+01 1.07E‐02 6.36E‐04 3.18E‐02 2.78E‐03 6.36E‐04 3.18E‐02 2.78E‐03
Nickel 7440‐02‐0 Y HTAC 9.96E+00 4.98E‐03 3.44E‐04 1.75E+00 1.51E‐03 2.24E‐04 1.12E‐02 9.82E‐04 2.24E‐04 1.12E‐02 9.82E‐04
Selenium 7782‐49‐2 Y M 1.32E+00 6.62E‐04 7.63E‐06 4.56E‐02 3.34E‐05 6.79E‐05 3.40E‐03 2.98E‐04 6.79E‐05 3.40E‐03 2.98E‐04
Silver 7440‐22‐4 NL 2.67E‐01 1.34E‐04 8.45E‐06 4.75E‐02 3.70E‐05 6.79E‐06 3.40E‐04 2.98E‐05 6.79E‐06 3.40E‐04 2.98E‐05
Thallium 7440‐28‐0 NL 1.48E+00 7.42E‐04 1.68E‐05 8.63E‐02 7.36E‐05 6.79E‐05 3.40E‐03 2.98E‐04 6.79E‐05 3.40E‐03 2.98E‐04
Zinc 7440‐66‐6 L 4.83E+01 2.41E‐02 2.50E‐03 1.28E+01 1.09E‐02 2.58E‐04 1.29E‐02 1.13E‐03 2.58E‐04 1.29E‐02 1.13E‐03
1,1‐Dichloroethene 75‐35‐4 Y M 3.73E+00 1.86E‐03 2.13E‐04 2.13E‐04 9.32E‐04
Methylene Chloride 75‐09‐2 Y M 9.59E+01 4.80E‐02 7.78E‐04 7.78E‐04 3.41E‐03
1,1‐Dichloroethane 75‐34‐3 Y L 3.73E+00 1.86E‐03 2.13E‐04 2.13E‐04 9.32E‐04
(trans)1,2‐Dichloroethane 107‐06‐2 Y HTAC 3.73E+00 1.86E‐03 2.13E‐04 2.13E‐04 9.32E‐04
2‐butanone 78‐93‐3 M 7.02E+00 3.51E‐03 4.01E‐04 4.01E‐04 1.76E‐03
Chloroform 67‐66‐3 Y HTAC 1.11E+01 5.56E‐03 6.35E‐04 6.35E‐04 2.78E‐03
1,2‐Dichloroethane 107‐06‐2 Y HTAC 3.73E+00 1.86E‐03 2.13E‐04 2.13E‐04 9.32E‐04
Trichloroethene 79‐01‐6 Y HTAC 8.25E+01 4.12E‐02 1.90E‐04 1.90E‐04 8.34E‐04
1,1,1‐Trichloroethane 71‐55‐6 Y L 1.44E+02 7.21E‐02 3.31E‐04 3.31E‐04 1.45E‐03
Benzene 71‐43‐2 Y HTAC 1.19E+02 5.97E‐02 1.03E‐03 1.03E‐03 4.50E‐03
Carbon tetrachloride 56‐23‐5 Y HTAC 1.49E+02 7.43E‐02 1.92E‐04 1.92E‐04 8.41E‐04
Methylene bromide 74‐83‐9 M 3.73E+00 1.86E‐03 2.13E‐04 2.13E‐04 9.32E‐04
1,2‐Dichloropropane 78‐87‐5 Y M 3.73E+00 1.86E‐03 2.13E‐04 2.13E‐04 9.32E‐04
4‐methyl 2‐pentanone 108‐10‐1 Y M 7.44E+00 3.72E‐03 4.25E‐04 4.25E‐04 1.86E‐03
cis‐1,3‐Dichloropropene 542‐75‐6 15 HTAC 3.65E+00 1.82E‐03 2.08E‐04 2.08E‐04 9.12E‐04
(trans)1,3‐Dichloropropene 542‐75‐6 15 HTAC 3.73E+00 1.86E‐03 2.13E‐04 2.13E‐04 9.32E‐04
December 2018 revisions only affect clinker cooler emissions of
metals. See Section 3.2.2 in the Permit Narrative for additional
details.
Site Wide Summary
Kiln 1 Clinker Cooler
(K‐INLSG)Compound
Kiln 2 Clinker Cooler
(K‐INLSG)
Kiln 1 & 2 Emissions Summary
(K‐ILNSG)
(Emission rates for 1 Kiln)
Printed: 12/17/2018 Page 29 of 46 Trinity Consultants

Norlite, LLC; Project Delta
Permit ID: 4‐0103‐00016/00048
Air Permit Application Appendix B
Revised December 2018
Site Wide Speciated Toxics Emissions1, 7
Air Pollutant CAS
H
A
P ER
Emissions
(lb/yr)
Emissions
(tons per yr)
Emissions
(lb/hr)
ERP 2,3,5
(lb/hr)
Emissions
(tons per yr)
Emissions
(lb/hr)
ERP 4
(lb/hr)
Emissions
(tons per yr)
Emissions
(lb/hr)
ERP 4
(lb/hr)
Emissions
(tons per yr)
December 2018 revisions only affect clinker cooler emissions of
metals. See Section 3.2.2 in the Permit Narrative for additional
details.
Site Wide Summary
Kiln 1 Clinker Cooler
(K‐INLSG)Compound
Kiln 2 Clinker Cooler
(K‐INLSG)
Kiln 1 & 2 Emissions Summary
(K‐ILNSG)
(Emission rates for 1 Kiln)
Bromodichloromethane 75‐27‐4 M 4.18E+00 2.09E‐03 2.38E‐04 2.38E‐04 1.04E‐03
1,1,2‐Trichloroethane 79‐00‐5 Y HTAC 3.73E+00 1.86E‐03 2.13E‐04 2.13E‐04 9.32E‐04
Toluene 108‐88‐3 Y L 8.78E+01 4.39E‐02 3.10E‐03 3.10E‐03 1.36E‐02
Tetrachloroethene 127‐18‐4 Y HTAC 4.26E+00 2.13E‐03 2.43E‐04 2.43E‐04 1.07E‐03
1,1,1,2‐Tetrachloroethane 630‐20‐6 NL 3.73E+00 1.86E‐03 2.13E‐04 2.13E‐04 9.32E‐04
Chlorobenzene(2) 108‐90‐7 Y M 1.77E+01 8.84E‐03 1.10E+00 1.10E+00 4.42E‐03
Ethylbenzene 100‐41‐4 Y M 4.28E+00 2.14E‐03 2.44E‐04 2.44E‐04 1.07E‐03
m & p‐xylenes 1330‐20‐7 15 Y M 3.62E+00 1.81E‐03 2.07E‐04 2.07E‐04 9.05E‐04
Styrene 100‐42‐5 Y M 2.96E+00 1.48E‐03 1.69E‐04 1.69E‐04 7.40E‐04
1,1,2,2‐Tetrachloroethane 79‐34‐5 Y HTAC 3.73E+00 1.86E‐03 2.13E‐04 2.13E‐04 9.32E‐04
o‐xylene 95‐47‐6 15 Y M 3.73E+00 1.86E‐03 2.13E‐04 2.13E‐04 9.32E‐04
Bromoform 75‐25‐2 Y M 4.18E+00 2.09E‐03 2.38E‐04 2.38E‐04 1.04E‐03
Dichlorodifluoromethane 75‐71‐8 NL 2.84E+03 1.42E+00 1.62E‐01 1.62E‐01 7.11E‐01
Chloromethane 74‐87‐3 Y M 2.79E+03 1.39E+00 1.59E‐01 1.59E‐01 6.97E‐01
Vinyl chloride 75‐01‐4 Y HTAC 2.82E+03 1.41E+00 1.61E‐01 1.61E‐01 7.06E‐01
1,3‐Butadiene 106‐99‐0 Y HTAC 2.79E+03 1.40E+00 1.60E‐01 1.60E‐01 6.99E‐01
Bromomethane 74‐83‐9 Y M 2.81E+03 1.40E+00 1.60E‐01 1.60E‐01 7.02E‐01
Phenol 108‐95‐2 Y M 3.65E+00 1.82E‐03 2.08E‐04 2.08E‐04 9.12E‐04
2‐Chlorophenol 95‐57‐8 NL 2.45E+00 1.22E‐03 1.40E‐04 1.40E‐04 6.12E‐04
1,3‐Dichlorobenzene 541‐73‐1 M 3.25E+00 1.62E‐03 1.85E‐04 1.85E‐04 8.12E‐04
1,4‐Dichlorobenzene 106‐46‐7 Y M 2.00E+00 9.98E‐04 1.14E‐04 1.14E‐04 4.99E‐04
1,2‐Dichlorobenzene 95‐50‐1 M 3.57E+00 1.79E‐03 2.04E‐04 2.04E‐04 8.93E‐04
2‐Methylphenol 95‐48‐7 Y NL 2.76E+00 1.38E‐03 1.58E‐04 1.58E‐04 6.90E‐04
4‐Methylphenol 106‐44‐5 Y NL 3.33E+00 1.66E‐03 1.90E‐04 1.90E‐04 8.32E‐04
Hexachloroethane 67‐72‐1 Y H 4.89E‐01 2.45E‐04 2.79E‐05 2.79E‐05 1.22E‐04
Nitrobenzene 98‐95‐3 Y M 4.89E‐01 2.45E‐04 2.79E‐05 2.79E‐05 1.22E‐04
2,4‐Dimethylphenol 105‐67‐9 NL 2.45E+00 1.22E‐03 1.40E‐04 1.40E‐04 6.12E‐04
2,4‐Dichlorolphenol 120‐83‐2 NL 2.45E+00 1.22E‐03 1.40E‐04 1.40E‐04 6.12E‐04
1,2,4‐Trichlorobenzene 120‐82‐1 Y NL 5.92E+00 2.96E‐03 3.38E‐04 3.38E‐04 1.48E‐03
Hexachlorobutadiene 87‐68‐3 Y M 4.89E‐01 2.45E‐04 2.79E‐05 2.79E‐05 1.22E‐04
Hexachlorocyclopentadiene 77‐47‐4 Y M 9.80E+00 4.90E‐03 5.59E‐04 5.59E‐04 2.45E‐03
2,4,6‐Trichlorophenol 88‐06‐2 Y NL 7.09E+00 3.55E‐03 4.05E‐04 4.05E‐04 1.77E‐03
2,4,5‐Trichlorophenol 95‐95‐4 Y NL 2.45E+00 1.22E‐03 1.40E‐04 1.40E‐04 6.12E‐04
2‐Chloronaphthalene 91‐58‐7HTAC,
POM, PBT4.89E‐01 2.45E‐04 2.79E‐05 2.79E‐05 1.22E‐04
Printed: 12/17/2018 Page 30 of 46 Trinity Consultants

Norlite, LLC; Project Delta
Permit ID: 4‐0103‐00016/00048
Air Permit Application Appendix B
Revised December 2018
Site Wide Speciated Toxics Emissions1, 7
Air Pollutant CAS
H
A
P ER
Emissions
(lb/yr)
Emissions
(tons per yr)
Emissions
(lb/hr)
ERP 2,3,5
(lb/hr)
Emissions
(tons per yr)
Emissions
(lb/hr)
ERP 4
(lb/hr)
Emissions
(tons per yr)
Emissions
(lb/hr)
ERP 4
(lb/hr)
Emissions
(tons per yr)
December 2018 revisions only affect clinker cooler emissions of
metals. See Section 3.2.2 in the Permit Narrative for additional
details.
Site Wide Summary
Kiln 1 Clinker Cooler
(K‐INLSG)Compound
Kiln 2 Clinker Cooler
(K‐INLSG)
Kiln 1 & 2 Emissions Summary
(K‐ILNSG)
(Emission rates for 1 Kiln)
2‐Nitroaniline 88‐74‐4 NL 4.89E+00 2.45E‐03 2.79E‐04 2.79E‐04 1.22E‐03
Dimethyl Phthalate 131‐11‐3 Y NL 2.45E+00 1.22E‐03 1.40E‐04 1.40E‐04 6.12E‐04
2,6‐Dinitrotoluene 25321‐14‐6 H 2.45E+00 1.22E‐03 1.40E‐04 1.40E‐04 6.12E‐04
4‐Nitrophenol 100‐02‐7 Y NL 9.80E+00 4.90E‐03 5.59E‐04 5.59E‐04 2.45E‐03
2,4‐Dinitrotoluene 121‐14‐2 Y H 2.45E+00 1.22E‐03 1.40E‐04 1.40E‐04 6.12E‐04
Diethyl Phthalate 84‐66‐2 M 1.92E+00 9.59E‐04 1.10E‐04 1.10E‐04 4.80E‐04
Hexachlorobenzene 118‐74‐1 Y HTAC, PBT 3.09E+00 1.54E‐03 0.000176179 1.76E‐04 7.72E‐04
Pentachlorophenol 87‐86‐5 Y M 9.80E+00 4.90E‐03 5.59E‐04 5.59E‐04 2.45E‐03
Di‐n‐butyl phthalate 84‐74‐2 Y NL 2.45E+00 1.22E‐03 1.40E‐04 1.40E‐04 6.12E‐04
Butylbenzylphthalate 85‐68‐7 M 2.45E+00 1.22E‐03 1.40E‐04 1.40E‐04 6.12E‐04
Bis(2‐ethylhexyl)phthalate 117‐81‐7 Y NL 6.53E+00 3.26E‐03 3.73E‐04 3.73E‐04 1.63E‐03
Di‐n‐octyl phthalate 117‐81‐7 M 2.45E+00 1.22E‐03 1.40E‐04 1.40E‐04 6.12E‐04
Naphthalene 91‐20‐3 Y M 1.14E+01 5.69E‐03 6.49E‐04 6.49E‐04 2.84E‐03
2‐Methylnaphthalane 91‐57‐6 NL 7.16E‐02 3.58E‐05 4.09E‐06 4.09E‐06 1.79E‐05
Acenaphthylene 208‐96‐8 YHTAC,
POM, PBT6.39E‐02 3.19E‐05 3.65E‐06 3.65E‐06 1.60E‐05
Acenaphthene 83‐32‐9 YHTAC,
POM, PBT1.91E‐01 9.56E‐05 1.09E‐05 1.09E‐05 4.78E‐05
Fluorene 86‐73‐7 YHTAC,
POM, PBT8.32E‐02 4.16E‐05 4.75E‐06 4.75E‐06 2.08E‐05
Phenanthrene 85‐01‐8 YHTAC,
POM, PBT1.77E‐01 8.87E‐05 1.01E‐05 1.01E‐05 4.44E‐05
Anthracene 120‐12‐7 YHTAC,
POM, PBT2.54E‐02 1.27E‐05 1.45E‐06 1.45E‐06 6.34E‐06
Fluoranthene 206‐44‐0 YHTAC,
POM, PBT7.18E‐02 3.59E‐05 4.10E‐06 4.10E‐06 1.80E‐05
Pyrene 129‐00‐0 YHTAC,
POM, PBT5.78E‐02 2.89E‐05 3.30E‐06 3.30E‐06 1.45E‐05
Benzo(e)pyrene 192‐97‐2 YHTAC,
POM, PBT6.12E‐03 3.06E‐06 3.50E‐07 3.50E‐07 1.53E‐06
Perylene 198‐55‐0 YHTAC,
POM, PBT1.53E‐03 7.65E‐07 8.73E‐08 8.73E‐08 3.82E‐07
Benzo(g,h,i)perylene 191‐24‐2 YHTAC,
POM, PBT2.42E‐02 1.21E‐05 1.38E‐06 1.38E‐06 6.05E‐06
Printed: 12/17/2018 Page 31 of 46 Trinity Consultants

Norlite, LLC; Project Delta
Permit ID: 4‐0103‐00016/00048
Air Permit Application Appendix B
Revised December 2018
Site Wide Speciated Toxics Emissions1, 7
Air Pollutant CAS
H
A
P ER
Emissions
(lb/yr)
Emissions
(tons per yr)
Emissions
(lb/hr)
ERP 2,3,5
(lb/hr)
Emissions
(tons per yr)
Emissions
(lb/hr)
ERP 4
(lb/hr)
Emissions
(tons per yr)
Emissions
(lb/hr)
ERP 4
(lb/hr)
Emissions
(tons per yr)
December 2018 revisions only affect clinker cooler emissions of
metals. See Section 3.2.2 in the Permit Narrative for additional
details.
Site Wide Summary
Kiln 1 Clinker Cooler
(K‐INLSG)Compound
Kiln 2 Clinker Cooler
(K‐INLSG)
Kiln 1 & 2 Emissions Summary
(K‐ILNSG)
(Emission rates for 1 Kiln)
Benzo(a)anthracene 56‐55‐3 YHTAC,
POM, PBT1.49E‐04 7.44E‐08 8.49E‐09 8.49E‐09 3.72E‐08
Chrysene 218‐01‐9 YHTAC,
POM, PBT2.09E‐02 1.04E‐05 1.19E‐06 1.19E‐06 5.21E‐06
Benzo(a)fluoranthene 203‐33‐8 YHTAC,
POM, PBT1.20E‐03 6.01E‐07 6.86E‐08 6.86E‐08 3.01E‐07
Benzo(k)fluoranthene 207‐08‐9 YHTAC,
POM, PBT1.61E‐05 8.06E‐09 9.21E‐10 9.21E‐10 4.03E‐09
Benzo(a)pyrene 50‐32‐8 YHTAC,
POM, PBT1.79E‐03 8.97E‐07 1.02E‐07 1.02E‐07 4.48E‐07
Indeno(1,2,3‐c,d)pyrene 193‐39‐5 YHTAC,
POM, PBT1.71E‐04 8.55E‐08 9.76E‐09 9.76E‐09 4.28E‐08
Dibenz(a,h)anthracene 53‐70‐3 YHTAC,
POM, PBT1.22E‐03 6.12E‐07 6.98E‐08 6.98E‐08 3.06E‐07
Xylenes 108‐38‐3 15 Y M 1.25E+01 6.25E‐03
Total POM N/A YHTAC,
POM, PBT1.22E+00 6.95E‐05
Printed: 12/17/2018 Page 32 of 46 Trinity Consultants
Norlite, LLC; Project Delta
Permit ID: 4‐0103‐00016/00048
Air Permit Application Appendix B
Revised December 2018
Site Wide Speciated Toxics Emissions1, 7
Air Pollutant CAS
H
A
P ER
Hydrogen Chloride 7647‐01‐0 Y L
Hydrogen Fluoride 7664‐39‐3 Y M
Dioxins & Furans (TEQ) N/A YHTAC,
POM, PBT
Arsenic 7440‐38‐2 Y HTAC
Beryllium 7440‐41‐7 Y HTAC
Chromium 7440‐47‐3 Y HTAC
Cadmium 7440‐43‐9 Y HTAC, PBT
Lead 7439‐92‐1 Y HTAC, PBT
Mercury 7439‐97‐6 Y HTAC, PBT
Chlorine 7782‐50‐5 M
Antimony 7440‐36‐0 Y M
Barium 7440‐39‐3 M
Copper 7440‐50‐8 M
Nickel 7440‐02‐0 Y HTAC
Selenium 7782‐49‐2 Y M
Silver 7440‐22‐4 NL
Thallium 7440‐28‐0 NL
Zinc 7440‐66‐6 L
1,1‐Dichloroethene 75‐35‐4 Y M
Methylene Chloride 75‐09‐2 Y M
1,1‐Dichloroethane 75‐34‐3 Y L
(trans)1,2‐Dichloroethane 107‐06‐2 Y HTAC
2‐butanone 78‐93‐3 M
Chloroform 67‐66‐3 Y HTAC
1,2‐Dichloroethane 107‐06‐2 Y HTAC
Trichloroethene 79‐01‐6 Y HTAC
1,1,1‐Trichloroethane 71‐55‐6 Y L
Benzene 71‐43‐2 Y HTAC
Carbon tetrachloride 56‐23‐5 Y HTAC
Methylene bromide 74‐83‐9 M
1,2‐Dichloropropane 78‐87‐5 Y M
4‐methyl 2‐pentanone 108‐10‐1 Y M
cis‐1,3‐Dichloropropene 542‐75‐6 15 HTAC
(trans)1,3‐Dichloropropene 542‐75‐6 15 HTAC
December 2018 revisions only affect clinker cooler emissions of
metals. See Section 3.2.2 in the Permit Narrative for additional
details.
Compound
Emissions
(lb/hr)
ERP
(lb/hr)
Annual
Emissions on
Hourly Basis
(lb/hr)
Emissions
(tons per yr)
Model per
212? 9, 10 Less than MEL ?
Less than
PBT?
Control Required per
Table 4 11Emitted only
from Kilns?
Part 63, Subpart EEE
Applicable Citation Kilns
Kiln 1
Cooler
Kiln 2
Cooler
Truck
Unload‐
ing
N ‐‐ ‐‐ Kilns, 75% Yes Y, 63.1221(a)(6) 97.70%
Y ‐‐ ‐‐ Yes 97.70%
TIA (POM)POM: N
D/F: Y
POM: Y
D/F: YNote 12 Yes Y, 63.1221(a)(1)
TIA N ‐‐ Kilns 90% Y, 63.1221(a)(4) 99.94% 98% 98%
N 13 Y ‐‐ Y, 63.1221(a)(4) 99.94% 98% 98%
N 13 Y ‐‐ Y, 63.1221(a)(4) 99.94% 98% 98%
TIA N Y Kilns < PBT. Model only. Y, 63.1221(a)(3) 99.999% 98% 98%
TIA N Y Kilns 99.5% Y, 63.1221(a)(3) 99.999% 98% 98%
TIA N Y Kilns < PBT. Model only. Y, 63.1221(a)(2) 54.36% 98% 98%
N ‐‐ ‐‐ Note 12 Yes Y, 63.1221(a)(6)
N 14 ‐‐ ‐‐ Kilns: Note 12 Y, 63.1221(a)(7) 99.98% 98% 98%
N 14 ‐‐ ‐‐ Kilns, 90% 99.98% 98% 98%
N 14 ‐‐ ‐‐ Kilns, 90% 99.98% 98% 98%
N 13 Y ‐‐ Kilns: Note 12 Y, 63.1221(a)(7) 99.98% 98% 98%
N 14 ‐‐ ‐‐ Y, 63.1221(a)(7) 99.98% 98% 98%
N 14 ‐‐ ‐‐ 99.98% 98% 98%
N 14 ‐‐ ‐‐ 99.98% 98% 98%
N 14 ‐‐ ‐‐ Kilns, 75% 99.98% 98% 98%
N ‐‐ ‐‐ Yes Y, 63.1221(a)(5)
1.08E‐01 1.08E‐01 9.39E‐03 4.11E‐02 N 14 ‐‐ ‐‐ Y, 63.1221(a)(5) >95.0%
N ‐‐ ‐‐ Yes Y, 63.1221(a)(5)
N 13 Y ‐‐ Yes Y, 63.1221(a)(5)
N 14 ‐‐ ‐‐ Yes
N 13 Y ‐‐ Yes Y, 63.1221(a)(5)
N 13 Y ‐‐ Yes Y, 63.1221(a)(5)
1.04E‐01 0.10 9.03E‐03 3.96E‐02 N 13 Y ‐‐ Yes Y, 63.1221(a)(5) >95.0%
1.81E‐01 0.18 1.58E‐02 6.92E‐02 Y ‐‐ ‐‐ Y, 63.1221(a)(5) >95.0%
1.33E‐01 0.13 1.16E‐02 5.07E‐02 TIA N ‐‐ ULF, 90% Y, 63.1221(a)(5) >95.0%
1.90E‐01 0.19 1.66E‐02 7.27E‐02 TIA N ‐‐ ULF, 90% Y, 63.1221(a)(5) >95.0%
N 14 ‐‐ ‐‐ Yes
N ‐‐ ‐‐ Yes Y, 63.1221(a)(5)
N ‐‐ ‐‐ Yes Y, 63.1221(a)(5)
N 13 Y ‐‐ Yes Y, 63.1221(a)(5)
N 13 Y ‐‐ Yes Y, 63.1221(a)(5)
Percent Control from APCD 8Part 212 Analysis
(Control and / or Modeling Required)Truck Unloading (ULF)
Printed: 12/17/2018 Page 33 of 46 Trinity Consultants
Norlite, LLC; Project Delta
Permit ID: 4‐0103‐00016/00048
Air Permit Application Appendix B
Revised December 2018
Site Wide Speciated Toxics Emissions1, 7
Air Pollutant CAS
H
A
P ER
December 2018 revisions only affect clinker cooler emissions of
metals. See Section 3.2.2 in the Permit Narrative for additional
details.
Compound
Bromodichloromethane 75‐27‐4 M
1,1,2‐Trichloroethane 79‐00‐5 Y HTAC
Toluene 108‐88‐3 Y L
Tetrachloroethene 127‐18‐4 Y HTAC
1,1,1,2‐Tetrachloroethane 630‐20‐6 NL
Chlorobenzene(2) 108‐90‐7 Y M
Ethylbenzene 100‐41‐4 Y M
m & p‐xylenes 1330‐20‐7 15 Y M
Styrene 100‐42‐5 Y M
1,1,2,2‐Tetrachloroethane 79‐34‐5 Y HTAC
o‐xylene 95‐47‐6 15 Y M
Bromoform 75‐25‐2 Y M
Dichlorodifluoromethane 75‐71‐8 NL
Chloromethane 74‐87‐3 Y M
Vinyl chloride 75‐01‐4 Y HTAC
1,3‐Butadiene 106‐99‐0 Y HTAC
Bromomethane 74‐83‐9 Y M
Phenol 108‐95‐2 Y M
2‐Chlorophenol 95‐57‐8 NL
1,3‐Dichlorobenzene 541‐73‐1 M
1,4‐Dichlorobenzene 106‐46‐7 Y M
1,2‐Dichlorobenzene 95‐50‐1 M
2‐Methylphenol 95‐48‐7 Y NL
4‐Methylphenol 106‐44‐5 Y NL
Hexachloroethane 67‐72‐1 Y H
Nitrobenzene 98‐95‐3 Y M
2,4‐Dimethylphenol 105‐67‐9 NL
2,4‐Dichlorolphenol 120‐83‐2 NL
1,2,4‐Trichlorobenzene 120‐82‐1 Y NL
Hexachlorobutadiene 87‐68‐3 Y M
Hexachlorocyclopentadiene 77‐47‐4 Y M
2,4,6‐Trichlorophenol 88‐06‐2 Y NL
2,4,5‐Trichlorophenol 95‐95‐4 Y NL
2‐Chloronaphthalene 91‐58‐7HTAC,
POM, PBT
Emissions
(lb/hr)
ERP
(lb/hr)
Annual
Emissions on
Hourly Basis
(lb/hr)
Emissions
(tons per yr)
Model per
212? 9, 10 Less than MEL ?
Less than
PBT?
Control Required per
Table 4 11Emitted only
from Kilns?
Part 63, Subpart EEE
Applicable Citation Kilns
Kiln 1
Cooler
Kiln 2
Cooler
Truck
Unload‐
ing
Percent Control from APCD 8Part 212 Analysis
(Control and / or Modeling Required)Truck Unloading (ULF)
N 14 ‐‐ ‐‐ Yes
N 13 Y ‐‐ Yes Y, 63.1221(a)(5)
4.38E‐02 4.38E‐02 1.67E‐02 N ‐‐ ‐‐ Yes Y, 63.1221(a)(5)
N 13 Y ‐‐ Yes Y, 63.1221(a)(5)
N 14 ‐‐ ‐‐ Yes
N ‐‐ ‐‐ YesY, 63.1221(a)(5), &
63.1221(c)(1)
N ‐‐ ‐‐ Yes Y, 63.1221(a)(5)
N ‐‐ ‐‐ Yes Y, 63.1221(a)(5)
N ‐‐ ‐‐ Yes Y, 63.1221(a)(5)
N 13 Y ‐‐ Yes Y, 63.1221(a)(5)
N ‐‐ ‐‐ Yes Y, 63.1221(a)(5)
N ‐‐ ‐‐ Yes Y, 63.1221(a)(5)
Y ‐‐ ‐‐ Yes
N ‐‐ ‐‐ Yes Y, 63.1221(a)(5)
TIA N ‐‐ Yes Y, 63.1221(a)(5)
TIA N ‐‐ Yes Y, 63.1221(a)(5)
N ‐‐ ‐‐ Yes Y, 63.1221(a)(5)
N ‐‐ ‐‐ Yes Y, 63.1221(a)(5)
N 14 ‐‐ ‐‐ Yes
N 14 ‐‐ ‐‐ Yes
N ‐‐ ‐‐ Yes Y, 63.1221(a)(5)
N 14 ‐‐ ‐‐ Yes
N ‐‐ ‐‐ Yes Y, 63.1221(a)(5)
N ‐‐ ‐‐ Yes Y, 63.1221(a)(5)
N ‐‐ ‐‐ Yes Y, 63.1221(a)(5)
N ‐‐ ‐‐ Yes Y, 63.1221(a)(5)
N 14 ‐‐ ‐‐ Yes
N 14 ‐‐ ‐‐ Yes
N ‐‐ ‐‐ Yes Y, 63.1221(a)(5)
N ‐‐ ‐‐ Yes Y, 63.1221(a)(5)
N ‐‐ ‐‐ Yes Y, 63.1221(a)(5)
N ‐‐ ‐‐ Yes Y, 63.1221(a)(5)
N ‐‐ ‐‐ Yes Y, 63.1221(a)(5)
TIA (POM) POM: N POM: Y Note 12 Yes Y, 63.1221(a)(5)
Printed: 12/17/2018
Page 34 of 36Trinity Consultants

Norlite, LLC; Project Delta
Permit ID: 4‐0103‐00016/00048
Air Permit Application Appendix B
Revised December 2018
Site Wide Speciated Toxics Emissions1, 7
Air Pollutant CAS
H
A
P ER
December 2018 revisions only affect clinker cooler emissions of
metals. See Section 3.2.2 in the Permit Narrative for additional
details.
Compound
2‐Nitroaniline 88‐74‐4 NL
Dimethyl Phthalate 131‐11‐3 Y NL
2,6‐Dinitrotoluene 25321‐14‐6 H
4‐Nitrophenol 100‐02‐7 Y NL
2,4‐Dinitrotoluene 121‐14‐2 Y H
Diethyl Phthalate 84‐66‐2 M
Hexachlorobenzene 118‐74‐1 Y HTAC, PBT
Pentachlorophenol 87‐86‐5 Y M
Di‐n‐butyl phthalate 84‐74‐2 Y NL
Butylbenzylphthalate 85‐68‐7 M
Bis(2‐ethylhexyl)phthalate 117‐81‐7 Y NL
Di‐n‐octyl phthalate 117‐81‐7 M
Naphthalene 91‐20‐3 Y M
2‐Methylnaphthalane 91‐57‐6 NL
Acenaphthylene 208‐96‐8 YHTAC,
POM, PBT
Acenaphthene 83‐32‐9 YHTAC,
POM, PBT
Fluorene 86‐73‐7 YHTAC,
POM, PBT
Phenanthrene 85‐01‐8 YHTAC,
POM, PBT
Anthracene 120‐12‐7 YHTAC,
POM, PBT
Fluoranthene 206‐44‐0 YHTAC,
POM, PBT
Pyrene 129‐00‐0 YHTAC,
POM, PBT
Benzo(e)pyrene 192‐97‐2 YHTAC,
POM, PBT
Perylene 198‐55‐0 YHTAC,
POM, PBT
Benzo(g,h,i)perylene 191‐24‐2 YHTAC,
POM, PBT
Emissions
(lb/hr)
ERP
(lb/hr)
Annual
Emissions on
Hourly Basis
(lb/hr)
Emissions
(tons per yr)
Model per
212? 9, 10 Less than MEL ?
Less than
PBT?
Control Required per
Table 4 11Emitted only
from Kilns?
Part 63, Subpart EEE
Applicable Citation Kilns
Kiln 1
Cooler
Kiln 2
Cooler
Truck
Unload‐
ing
Percent Control from APCD 8Part 212 Analysis
(Control and / or Modeling Required)Truck Unloading (ULF)
N 14 ‐‐ ‐‐ Yes
N ‐‐ ‐‐ Yes Y, 63.1221(a)(5)
N 14 ‐‐ ‐‐ Yes
N ‐‐ ‐‐ Yes Y, 63.1221(a)(5)
N ‐‐ ‐‐ Yes Y, 63.1221(a)(5)
N 14 ‐‐ ‐‐ Yes
N 13 Y Y Yes Y, 63.1221(a)(5)
N ‐‐ ‐‐ Yes Y, 63.1221(a)(5)
N ‐‐ ‐‐ Yes Y, 63.1221(a)(5)
N 14 ‐‐ ‐‐ Yes
N ‐‐ ‐‐ Yes Y, 63.1221(a)(5)
N 14 ‐‐ ‐‐ Yes
N ‐‐ ‐‐ Yes Y, 63.1221(a)(5)
N 14 ‐‐ ‐‐ Yes
TIA (POM) POM: N POM: Y Note 12 Yes Y, 63.1221(a)(5)
TIA (POM) POM: N POM: Y Note 12 Yes Y, 63.1221(a)(5)
TIA (POM) POM: N POM: Y Note 12 Yes Y, 63.1221(a)(5)
TIA (POM) POM: N POM: Y Note 12 Yes Y, 63.1221(a)(5)
TIA (POM) POM: N POM: Y Note 12 Yes Y, 63.1221(a)(5)
TIA (POM) POM: N POM: Y Note 12 Yes Y, 63.1221(a)(5)
TIA (POM) POM: N POM: Y Note 12 Yes Y, 63.1221(a)(5)
TIA (POM) POM: N POM: Y Note 12 Yes Y, 63.1221(a)(5)
TIA (POM) POM: N POM: Y Note 12 Yes Y, 63.1221(a)(5)
TIA (POM) POM: N POM: Y Note 12 Yes Y, 63.1221(a)(5)
Printed: 12/17/2018 Page 35 of 46 Trinity Consultants
Norlite, LLC; Project Delta
Permit ID: 4‐0103‐00016/00048
Air Permit Application Appendix B
Revised December 2018
Site Wide Speciated Toxics Emissions1, 7
Air Pollutant CAS
H
A
P ER
Emissions
(lb/hr)
ERP
(lb/hr)
Annual
Emissions on
Hourly Basis
(lb/hr)
Emissions
(tons per yr)
Model per
212? 9, 10 Less than MEL ?
Less than
PBT?
Control Required per
Table 4 11Emitted only
from Kilns?
Part 63, Subpart EEE
Applicable Citation Kilns
Kiln 1
Cooler
Kiln 2
Cooler
Truck
Unload‐
ing
December 2018 revisions only affect clinker cooler emissions of
metals. See Section 3.2.2 in the Permit Narrative for additional
details.
Compound Percent Control from APCD 8Part 212 Analysis
(Control and / or Modeling Required)Truck Unloading (ULF)
Benzo(a)anthracene 56‐55‐3 YHTAC,
POM, PBTTIA (POM) POM: N POM: Y Note 12 Yes Y, 63.1221(a)(5)
Chrysene 218‐01‐9 YHTAC,
POM, PBTTIA (POM) POM: N POM: Y Note 12 Yes Y, 63.1221(a)(5)
Benzo(a)fluoranthene 203‐33‐8 YHTAC,
POM, PBTTIA (POM) POM: N POM: Y Note 12 Yes Y, 63.1221(a)(5)
Benzo(k)fluoranthene 207‐08‐9 YHTAC,
POM, PBTTIA (POM) POM: N POM: Y Note 12 Yes Y, 63.1221(a)(5)
Benzo(a)pyrene 50‐32‐8 YHTAC,
POM, PBTTIA (POM) POM: N POM: Y Note 12 Yes Y, 63.1221(a)(5)
Indeno(1,2,3‐c,d)pyrene 193‐39‐5 YHTAC,
POM, PBTTIA (POM) POM: N POM: Y Note 12 Yes Y, 63.1221(a)(5)
Dibenz(a,h)anthracene 53‐70‐3 YHTAC,
POM, PBTTIA (POM) POM: N POM: Y Note 12 Yes Y, 63.1221(a)(5)
Xylenes 108‐38‐3 15 Y M 1.64E‐02 3.28E‐01 6.25E‐03 N
14 ‐‐ ‐‐ Y, 63.1221(a)(5) >95.0%
Total POM N/A YHTAC,
POM, PBTTIA N Y Note 12 Y, 63.1221(a)(5)
Notes:1 Storage tank emissions are not individually included in the speciated HAP emissions shown on this table because storage tanks emit to Kiln under normal operations.2 Kiln emission ERP for organics = PTE for organics.
4 ERP for Kiln/Clinker Cooler is calculated by removing the control efficiency from the emissions on the "HAP Emissions from Kiln Cooler ‐ PTE" sheet.5 Hydrogen chloride, hydrogen fluoride and doxin and furan data from FLS Pilot Study Test Report dated April 2018; ERP data from Table 1, Kiln Exit Section7 Speciated emissions from Drum Storage area is not included in this assessment as accurate speciation of this source is unreliable and overall VOC PTE is 0.35 tons per year.8 The semi‐dry scrubber does not control organic species. Organic control efficiency represented for organic compounds is based on kiln DRE.
10 For HTAC regulated by a NESHAP, 212‐1.5(e)(2) requires that a Toxic Impact Assessment (TIA) be completed.11 If 'control' required by Table 4 of Part 212 is to meet Guideline Concentrations, that 'control' is not listed in this column, but is addressed in 'Model Per 212?' column.12 Specific control is not required for this compound because compound is regulated by EEE per 212‐1.5(e)(2)13 Potential to emit HTAC on a site wide basis falls below MEL, therefore compliance with Part 212 is met per 212‐2.1(a).14 Potential to emit non‐HTAC on a site wide basis falls below 100 lb/yr, therefore DAR‐1 implies no further action required.15 Sum of the emissions of this coumpound evaluated in Part 212 analysis with the compound's other isomer(s)
3 ERP for Kiln metals is calculated using uncontrolled emissions from "Inorganic HAP Emissions from Low Grade Fuel Combustion for Kilns ‐ PTE" page and the products of combustion from the HAP from products of
combustion of Used Oil.
9 Note that if one emission source requires modeling, Part 212 requires all sources at the facility under review that emit that pollutant to be included in that modeling analysis. Sources exempt from permitting in Part 201
are not subject to Part 212 and are excluded.
Printed: 12/17/2018 Page 36 of 46 Trinity Consultants

Tradebe Environmental Services, LLC – Norlite, LLC | Modeling Report Trinity Consultants
ATTACHMENT C: MODEL CD ........................................................................................................................................................................................................................................................................ ,