thunder bay + area food strategy community food security...
TRANSCRIPT
An agency of the Government of Ontario.Un organisme du gouvernement de l’Ontario.
Thunder Bay + Area Food Strategy
Community Food Security Report Card2 0 1 5
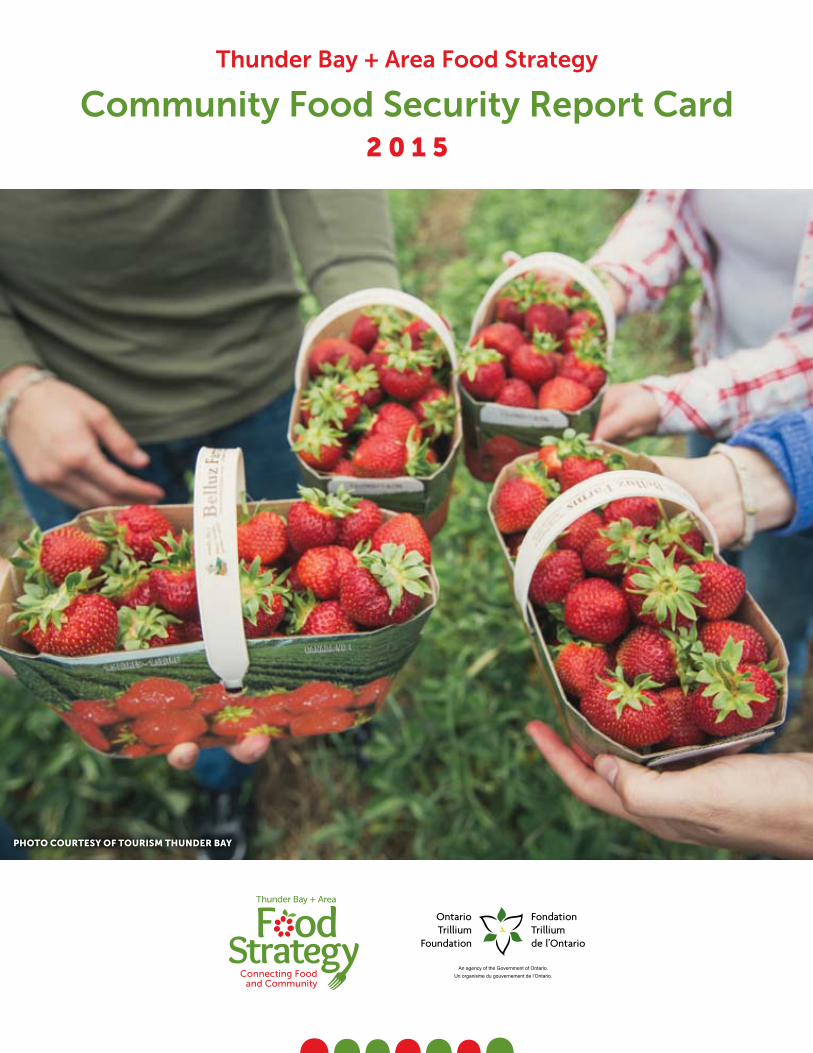
PHOTO COURTESY OF TOURISM THUNDER BAY

2
MOVING FORWARD ON COMMUNITY FOOD SECURITY Food is intimately tied to our health, as well as the well-being of our communities, economies, and environments. Access to food and the knowledge of how to prepare healthy food is the basis for preventing chronic disease and ensuring healthy growth and development. Food is at the center of healthy and vibrant communities because of its power to bring people together and to enliven and enrich public spaces. Food is intimately tied to culture and is part of a region’s identity and heritage. Food is a key part of the economy, representing the second largest sector of Ontario’s economy and employing one in eight people in Canada.1 Practices around food production, processing, distribution, and waste can also have enormous repercussions for the environment and our ability to produce food into the future.
While food is a critical component of healthy and sustainable communities, decisions relating to food have for decades been driven by commodity markets, global economic trends and fragmented government policy that considers parts instead of the whole. Government food policies and programs tend to be disjointed, take place in silos, and fail to take into account the broader role that food plays in being a centerpiece of healthy and vibrant cities and rural landscapes.
In recent years, public awareness of local food issues has blossomed and the number of passionate individuals, government entities, non-profit organizations, and businesses working towards a healthy and sustainable food system has increased dramatically. Community leaders from various backgrounds have undertaken efforts to address issues of hunger, farmer financial struggles, loss of basic cooking skills, a dwindling processing and distribution infrastructure, and the increasing incidence of diet-related illnesses.
In 2014, The Thunder Bay and Area Food Strategy was developed by local food movement leaders and endorsed by the City of Thunder Bay and the Municipality of Oliver Paipoonge, O’Connor Township, the Township of Gillies, the Municipality of Shuniah, Conmee Township and the Municipality of Neebing, as well as the Thunder Bay District Social Services Administration Board, and the Thunder Bay District Board of Health. The Food Strategy is a strategic action plan to carry forward the Thunder Bay Food Charter, which was endorsed in 2008 by 33 local governments, businesses, organizations, and individuals. The strength of the Food Charter and Food Strategy is that they are rooted in the community and have a commitment to community food security.
WHAT IS A FOOD SYSTEM? Food systems include the economic, environmental and social factors involved in food production, distribution, processing, retail, consumption, and waste.
Decisions about food tend to be disjointed and do not take into account the role of food in shaping healthy environments and strong communities.
A healthy and sustainable food system:
• protects and nourishes the environment
• improves health and access to food
• fosters local and diverse economic development
• encourages community involvement
WHAT IS COMMUNITY FOOD SECURITY?Community food security is an approach to understanding issues related to food. It is comprehensive because it integrates all components of the food system, from production to consumption. It emphasizes the health of individuals, the environment, and local economies while supporting regional food self-reliance.
WHY A COMMUNITY FOOD SECURITY REPORT CARD?A growing local food scene and strong community support means the time is ripe to take a more coordinated approach to addressing food issues and to designing solutions that protect and nourish the environment, foster local and diverse economic development, build community, improve access to food, and much more.
This Report Card establishes baselines around the 7 pillars of the Thunder Bay and Area Food Strategy so that progress towards a food secure community can be measured. Involvement and support from all sectors of the community will continue to be key in making measurable progress towards community food security.

COMMUNITY FOOD SECURITY REPORT CARD 2015 3
HOW THIS REPORT CARD IS ORGANIZED:The Report Card is broken into 7 chapters that reflect the 7 pillars of the Food Strategy. Each chapter includes an introductory section to provide some context for the indicators, the indicators themselves, some reflections and comments on what the indicators mean, and highlights of initiatives taking place in the community. Note that the highlights sometimes explain programs referenced in the indicators, and other times share additional information that is difficult to capture in an indicator.
HOW DO WE MEASURE COMMUNITY FOOD SECURITY?In this Report Card indicators have been chosen related to each of the 7 pillars of the Food Strategy so that progress or change on issues—from the persistence of hunger, to the state of urban agriculture, and size and strength of the farming sector—can be measured over time. Each piece of information measured is called an indicator.
Many indicators were considered in the early stages of developing the Report Card. Indicators were chosen based on whether they were reflective of the food system in the Thunder Bay area, whether they were reliable pieces of information that were already collected or could be collected easily, whether they were replicable over time, and whether the information would be easily understood.
For every Food Strategy pillar, there is information available that helps paint a picture of how the Thunder Bay area is doing in terms of community food security. The process of developing the Report Card has also made it clear that more information is needed to present a consistently robust understanding of how our area is measuring up. In the case of public sector procurement, for example, buying local is fairly new terrain and public institutions are only just beginning to collect information on their local food spending.
This Report Card relies on 2011 Statistics Canada data where local data is not yet available. With a long form census being administered in 2016, new data will be available for an updated version of the report.
Local data comes from many different kinds of organizations, all of which have different scopes. For this reason, the data in some cases is only available for the Thunder Bay District and in other cases for the City of Thunder Bay. Where possible the indicators reflect the area connected with the Thunder Bay and Area Food Strategy, which includes the City of Thunder Bay, the Municipality of Oliver Paipoonge, O’Connor Township, the Township of Gillies, the Municipality of Shuniah, Conmee Township and the Municipality of Neebing. These 7 municipalities and townships make up the Thunder Bay Census Metropolitan Area, referred to at various points in this document.
Many organizations, schools, local governments, businesses and others in the Thunder Bay area have led efforts to improve community food security for years. This Report Card gives an area-wide picture of how, taken together, all our individual efforts are making healthy food easier to access, building a strong local food economy, and fostering the creation of a more resilient and green place to live.

1971Thunder Bay Federation of Agriculture is established
1988Thunder Bay Farmers Market is established
1991Murillo Fair celebrates its 100th year
1995Our Kids Count is founded and starts a community
garden and community kitchen1995Food Action Network is established to provide a meeting space for people wanting to improve access and education around healthy food
1996Thunder Bay Country Market opens at the Canadian
Lakehead Exhibition grounds1997First Student Nutrition Program is started in Thunder Bay
1999Gleaning program is established by the Thunder Bay
District Health Unit so low income residents can pick food at nearby farms after the main harvest
2003Regional Food Distribution Association (RFDA) is established as the central distribution hub for food banks in the area
2004The Thunder Bay Agricultural Research Station becomes locally driven, saving it from closure when the academic support it received for years from Guelph University was
withdrawn2004Community Food Assessment is completed, giving the first picture of food activity taking place in Thunder Bay
2005Good Food Box program is established, making a box of fruits and vegetables more affordable to people living on
a low income2005First Seedy Saturday event is held in Thunder Bay
2006Food Security Research Network emerges as a research and learning hub at Lakehead University for faculty and
community members interested in sustainable food systems
2007Get Fresh! campaign is launched, which each year publishes a guide listing where local food is available in Thunder Bay
2008Thunder Bay Food Charter is developed and endorsed
by the City of Thunder Bay, District Social Services Administration Board, and 33 other municipalities and
organizations in the Thunder Bay District2008City of Thunder Bay Community Environment Action Plan recommends the development of a community food security strategy
2009Thunder Bay District Agricultural Impact Study is
published, providing a profile of agriculture in the Thunder Bay District and an estimate of the economic
impact of agriculture on the wider economy2009City of Thunder Bay develops a Community Garden Policy
2009Regional Food Distribution Association Paterson
Family Food Centre opens, giving the RFDA a more permanent home and a larger warehouse space
4
TIMELINE

2010Northern Food Connections Conference at Lakehead University includes first farmer/buyer networking event
2010World Town Planning Day focuses on food systems and
includes an event held in Thunder Bay with local land use planners
2011A 3 year initiative—Healthy Eating Makes the Grade—is launched to promote and advocate for nutritious food choices in and around Thunder Bay schools
2011City of Thunder Bay Strategic Plan 2011-2014 identifies
the development of a comprehensive local food strategy as an action item
2011Second Northern Food Connections Conference is held with local food dinner and “meet the farmer” event at Confederation College
2012A community Food Summit identifies the need to
develop a local food strategy2012Hymers Fall Fair celebrates its 100th year
2012City of Thunder Bay is awarded a Greenbelt Fund grant
to assess the ability of institutions in the city to use local food, and that of growers to supply it
2012Roots to Harvest is established to engage youth through local agriculture and cultivate healthy communities
2013Participants at a second Food Summit decide on the 7
pillar areas that later form the local food strategy2013The Pizza Project, an annual event for school children from across the city to learn about where their food comes from, celebrates its 20th year
2013City of Thunder Bay is awarded a second Greenbelt Fund
grant to develop a local food buying model for city-run long-term care facilities and day cares
2014Thunder Bay and Area Food Strategy is endorsed by 7 municipalities and townships in the Thunder Bay area, as well as the District Social Services Administration Board and Thunder Bay District Health Unit
2014Ontario Nature launches a forest food project that
promotes personal harvesting and forest food entrepreneurship
2014CEDC 2014 – 2017 Strategic Plan includes regional food as a strategic priority, raising the profile of food as an economic development tool
2014EarthCare Sustainability Plan food chapter adopts the 7 pillars and goals of the Thunder Bay and Area Food
Strategy2015City of Thunder Bay Strategic Plan (2015-2019) outlines how Administration will support the implementation of the Food Strategy
2015Thunder Bay and Area Food Strategy Implementation
Plan for 2015 identifies 20 priority projects and is presented to Thunder Bay City Council and distributed to
rural municipalities
5

THUNDER BAY AND AREA FOOD STRATEGY6
FOOD ACCESSGOAL: Create a food system in Thunder Bay and Area based on the principle that food is more than a commodity—that it is a human right—and in which all community members have regular access to adequate, affordable, nutritious, safe and culturally appropriate food in a way that maintains dignity.
WHAT ARE THE ISSUES AROUND FOOD ACCESS IN THE THUNDER BAY AREA?Where and how we get food and the kinds of food we are able to obtain is directly connected to our personal health and culture. Food security (having enough to eat) and food sovereignty (having control over our food source) are central to personal well-being, as well as the well-being of our families and communities. Yet many people in Thunder Bay and Area have trouble getting enough to eat and affording healthy and preferred foods.
A wide range of factors impact access to a nutritious diet including poverty, social and geographic isolation, the high cost of fuel, inadequate housing, heating and transportation costs, insufficient welfare and minimum wage rates, lost or fragmented food production and preparation skills, and lack of access to land for traditional hunting and gathering. Because secure access to a healthy and culturally appropriate diet is influenced by so many diverse factors, solutions must be broadly based and grounded in principles of social equity.
According to a national study conducted by Health Canada, household food insecurity is a significant social and public health problem in Canada.1 In 2011, 1.6 million Canadian households, or slightly more than 12%, experienced some level of food insecurity, affecting 1 in every 6 children.2 The rate of food insecurity is also increasing within both urban and rural areas. For instance, food bank and soup kitchen usage increased 3% between 2012 and 2013 within the region.3
A 2013 study found that households with children under age 18 (16%) were more likely to be food insecure than those without children (11%).4 Poor nutrition leads to increased risk of chronic and infectious diseases such as diabetes, cardiovascular disease and cancer, as well as conditions such as low birth weight. In other words, a secure, healthy diet is central to our physical and social well-being, dignity and autonomy.

COMMUNITY FOOD SECURITY REPORT CARD 2015 7
FOOD ACCESS INDICATORS
Measures of Income, Poverty, and Homelessness Indicator Measured Over
Percentage of people living below the poverty line, using the Low Income Measure (after tax) in the Thunder Bay Census Metropolitan Area (CMA) 5
12.8% 2011
Approximate number of people living under the poverty line (using the Low Income Measure) in the Thunder Bay CMA 6
15,100 November 2011
Median total annual family income (after tax) of all low income family types in Thunder Bay 7
$12,970 2011
Unemployment rate in Thunder Bay CMA 8 5.3% November 2015
Households in the Thunder Bay District who receive social assistance benefits (Ontario Works or Ontario Disability) 9
8,466 2015
Social housing vacancy rate in Thunder Bay 10 2.5% 2015
Active households on waitlist for social housing in Thunder Bay 11
939 2015
Number of social housing units in Thunder Bay 12 4,201 2015
Average number of people using emergency shelters in Thunder Bay 13
1,267 2011
WHAT IS LOW INCOME MEASURE?Presently, the Canadian government does not have an official definition of poverty, instead offering a variety of measures based on income-related terms. The Low Income Measure (LIM) is one such indicator of low income, and is used by Thunder Bay’s Poverty Reduction Strategy to determine how many people are living in poverty. It is calculated as 50% of the median income, adjusted for a family size. According to this measure, the LIM is $21,000 a year for a single person. This means that 12.8% or approximately 15,100 individuals in Thunder Bay live in poverty (have income under $21,000 a year). 14
WHAT IS MEDIAN AFTER-TAX INCOME?Median after-tax income means that you take the middle income and look at what that income would be after-tax. For instance, if you looked at incomes (before tax) ranging from $20,000, $35,000, $40,000, $45,000 and $50,000, the median would be $40,000. The median after-tax income would be $40,000 less applicable income taxes.
THUNDER BAY CENSUS METROPOLITAN AREA (CMA) CMA refers to the municipalities of Thunder Bay, Oliver Paipoonge, Neebing, Conmee, O’Connor, Shuniah, Gillies, and Fort William First Nation

THUNDER BAY AND AREA FOOD STRATEGY8
Measures of Consumption and Nutrition Indicator Measured Over
Percentage of citizens over 12 years old living with moderate to severe food insecurity in the Thunder Bay District health region 15
10.2% 2013 - 2014
Percentage of citizens who consume 5 or more fruit and vegetable servings per day in the Thunder Bay District health region 16
34.4% 2013 - 2014
Percentage of children age 12-17 who are overweight or obese in the Thunder Bay District health region 17
25.3% 2013 - 2014
Percentage of adults (18+) who are overweight or obese in the Thunder Bay District health region 18
65.5% 2013 - 2014
Percentage of adults (18+) who have diabetes in the Thunder Bay District health region 19
8.8% 2013 - 2014
Measures of Food Accessibility Indicator Measured Over
Cost of transportation Single Cash Bus Fare 20 $2.61 2015
Monthly Bus Pass 21 $75.50 2015
Monthly cost of a nutritious food basket for a family of four 22 $875/month 2015
Measures of Emergency Food Programs and Usage Indicator Measured Over
Number of food banks 23 19 2015
Average number of people accessing food banks per month 24 3,447 March 2015
Daily emergency meal programs available 25 7 2015
Average number of meals served by emergency meal programs each month 26
9,000 March 2015
COMMUNITY FOOD SECURITY REPORT CARD 2015 9
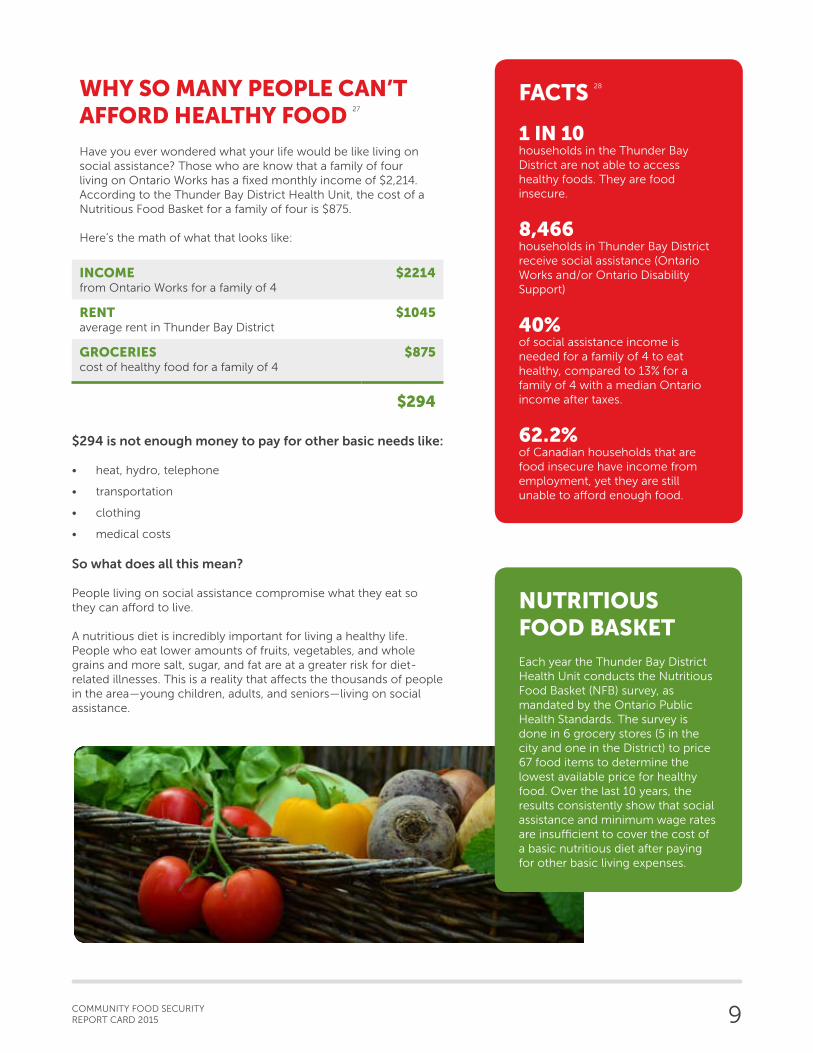
NUTRITIOUS FOOD BASKET Each year the Thunder Bay District Health Unit conducts the Nutritious Food Basket (NFB) survey, as mandated by the Ontario Public Health Standards. The survey is done in 6 grocery stores (5 in the city and one in the District) to price 67 food items to determine the lowest available price for healthy food. Over the last 10 years, the results consistently show that social assistance and minimum wage rates are insufficient to cover the cost of a basic nutritious diet after paying for other basic living expenses.
FACTS 28
1 IN 10households in the Thunder Bay District are not able to access healthy foods. They are food insecure.
8,466households in Thunder Bay District receive social assistance (Ontario Works and/or Ontario Disability Support)
40%of social assistance income is needed for a family of 4 to eat healthy, compared to 13% for a family of 4 with a median Ontario income after taxes.
62.2%of Canadian households that are food insecure have income from employment, yet they are still unable to afford enough food.
WHY SO MANY PEOPLE CAN’T AFFORD HEALTHY FOOD 27
Have you ever wondered what your life would be like living on social assistance? Those who are know that a family of four living on Ontario Works has a fixed monthly income of $2,214. According to the Thunder Bay District Health Unit, the cost of a Nutritious Food Basket for a family of four is $875.
Here’s the math of what that looks like:
INCOMEfrom Ontario Works for a family of 4
$2214
RENTaverage rent in Thunder Bay District
$1045
GROCERIEScost of healthy food for a family of 4
$875
$294
$294 is not enough money to pay for other basic needs like:
• heat, hydro, telephone
• transportation
• clothing
• medical costs
So what does all this mean?
People living on social assistance compromise what they eat so they can afford to live.
A nutritious diet is incredibly important for living a healthy life. People who eat lower amounts of fruits, vegetables, and whole grains and more salt, sugar, and fat are at a greater risk for diet-related illnesses. This is a reality that affects the thousands of people in the area—young children, adults, and seniors—living on social assistance.
THUNDER BAY AND AREA FOOD STRATEGY10
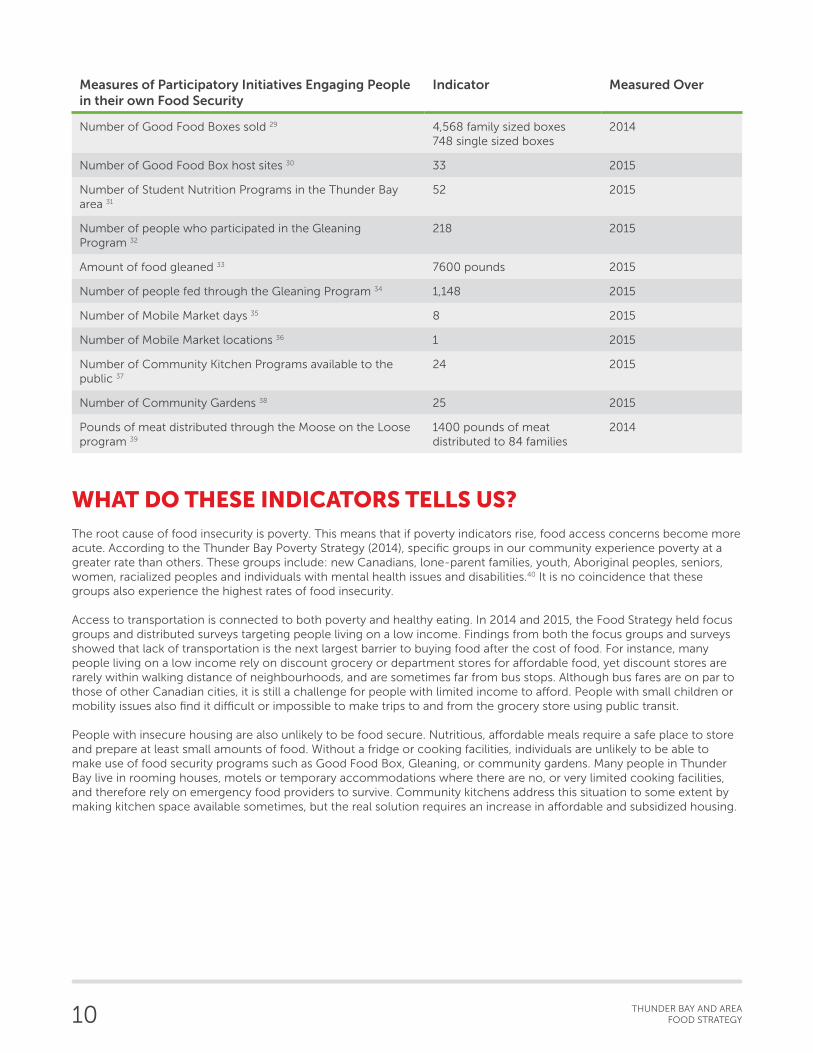
Measures of Participatory Initiatives Engaging People in their own Food Security
Indicator Measured Over
Number of Good Food Boxes sold 29 4,568 family sized boxes 748 single sized boxes
2014
Number of Good Food Box host sites 30 33 2015
Number of Student Nutrition Programs in the Thunder Bay area 31
52 2015
Number of people who participated in the Gleaning Program 32
218 2015
Amount of food gleaned 33 7600 pounds 2015
Number of people fed through the Gleaning Program 34 1,148 2015
Number of Mobile Market days 35 8 2015
Number of Mobile Market locations 36 1 2015
Number of Community Kitchen Programs available to the public 37
24 2015
Number of Community Gardens 38 25 2015
Pounds of meat distributed through the Moose on the Loose program 39
1400 pounds of meat distributed to 84 families
2014
WHAT DO THESE INDICATORS TELLS US?The root cause of food insecurity is poverty. This means that if poverty indicators rise, food access concerns become more acute. According to the Thunder Bay Poverty Strategy (2014), specific groups in our community experience poverty at a greater rate than others. These groups include: new Canadians, lone-parent families, youth, Aboriginal peoples, seniors, women, racialized peoples and individuals with mental health issues and disabilities.40 It is no coincidence that these groups also experience the highest rates of food insecurity.
Access to transportation is connected to both poverty and healthy eating. In 2014 and 2015, the Food Strategy held focus groups and distributed surveys targeting people living on a low income. Findings from both the focus groups and surveys showed that lack of transportation is the next largest barrier to buying food after the cost of food. For instance, many people living on a low income rely on discount grocery or department stores for affordable food, yet discount stores are rarely within walking distance of neighbourhoods, and are sometimes far from bus stops. Although bus fares are on par to those of other Canadian cities, it is still a challenge for people with limited income to afford. People with small children or mobility issues also find it difficult or impossible to make trips to and from the grocery store using public transit.
People with insecure housing are also unlikely to be food secure. Nutritious, affordable meals require a safe place to store and prepare at least small amounts of food. Without a fridge or cooking facilities, individuals are unlikely to be able to make use of food security programs such as Good Food Box, Gleaning, or community gardens. Many people in Thunder Bay live in rooming houses, motels or temporary accommodations where there are no, or very limited cooking facilities, and therefore rely on emergency food providers to survive. Community kitchens address this situation to some extent by making kitchen space available sometimes, but the real solution requires an increase in affordable and subsidized housing.

COMMUNITY FOOD SECURITY REPORT CARD 2015 11
According to the Poverty Strategy, “some of the most significant systemic barriers that influence poverty are the rates of Ontario Works (OW), Ontario Disability Support Program (ODSP), and minimum wage.”41 Ontario Works is a social assistance program designed to assist individuals who are unable to find work, while ODSP is designed to assist individuals with disabilities. Drastic (21.6%) cuts to social assistance rates in Ontario in 1995 left the income of OW and ODSP recipients 40% below the low income cut off. Social assistance rates have not increased appreciably since that time. In 2014, that gap remained almost the same (35-39% for a lone parent with one child, and even higher for single people) resulting in chronic food insecurity, health concerns and inadequate housing among low income people.42 Each year the Thunder Bay District Health Unit conducts the Nutritious Food Basket survey. The survey consists of visiting 5 grocery stores in the city and 1 store in the district to price 67 food items to determine the lowest available price for healthy food at each grocery store. Over the last 10 years in the District of Thunder Bay the results consistently show that people with a low income do not have adequate funds to purchase a nutritious diet after paying for other essentials, such as rent or transportation. Consider the following: in 2015, the total monthly income for an individual on social assistance was only $752. After paying the market rate of $605 rent for a bachelor apartment, only $147 would remain each month for food and other essentials, such as transportation, clothing, heat and hydro. The cost of a nutritious food basket per month is $294 for an average individual.43 In other words, for people living on social assistance, it is nothing short of impossible to afford a healthy diet.
Many studies show that we pay a high price for the levels of poverty and food insecurity that we tolerate. For example, people who have trouble getting food on the table also have been shown to use health care services—such as doctor and emergency room visits—more often. On average, a moderately food insecure household has health care costs that are 32% higher than more food secure households.44 The costs become higher as food insecurity worsens: severely food insecure households cost the health care system an extra $1,092 a year on average.45 It would be more cost effective and just to prevent these conditions, and the social exclusion that may accompany them, by ensuring that people are economically and logistically able to purchase adequate and nutritious foods.
Most agree that an increase in the use of food banks and emergency feeding programs show that hunger and food insecurity have become chronic, as people come to rely on charitable donations to stretch their monthly food budget. The cost of food obviously has a direct effect on those with limited incomes. Not only does this mean that people become more reliant on food banks and feeding programs, but it also means that people are less able to afford healthy food for themselves and their families.
Thunder Bay has developed many independent initiatives to address food insecurity. The Good Food Box, gleaning programs, community kitchens and gardens, and emergency food programs such as food banks and adult meal programs are some examples of community-based approaches to improving access to food. In recent years, the number of organizations with food programs has grown in number.
The existence of food banks and other programs are important and necessary to meet immediate or emergency needs. However, food programs do not address the systemic causes of food insecurity, such as economic inequality. Achieving food secure and food sovereign communities requires that all citizens be engaged in the movement towards an equitable distribution of resources, with the recognition that food security is a basic human right.
Addressing equitable access to food in the context of a larger Food Strategy requires a long-term view. We need to understand how food access is affected by all sectors of the local food system, and integrate the participation and needs of those who may not be able to gain access through economic or other traditional means. The real test of food security should be that all citizens are able to participate in, as well as benefit from the local food system.

THUNDER BAY AND AREA FOOD STRATEGY12
FOOD ACCESS HIGHLIGHTS
GOOD FOOD BOX
The Good Food Box is a non-profit, volunteer supported, community-based food security initiative administered by the Northwestern Ontario Women’s Centre. Customers can order and pick up a box of fresh fruits and vegetables at an affordable price at a host site in their neighbourhood. Prices are $15 for a single sized box and $25 for a family sized box. Over 400 boxes are packed and distributed on one day per month, 12 months of the year, and delivered to 33 host sites. There are over 100 active volunteers. Between 2005 and 2015, the program packed and distributed over 40,000 Good Food Boxes.
GLEANING
The Thunder Bay District Health Unit and Food Action Network have been running a Gleaning Program since 2000. The program provides free bus transportation to area farms to pick produce for people who have difficulty accessing food. Every growing season, after the main harvest, Belluz Farms, Fort William Historical Park and Breukelman’s Farm generously welcome over 200 gleaners to pick more than 7,500 pounds of fresh produce for their families, feeding over 1,000 people a year who otherwise would not have access to fresh-picked vegetables and fruit.
STUDENT NUTRITION PROGRAMS
Administered through the Red Cross since 1997, Student Nutrition Programs offer food programs in 86 of the schools in the District of Thunder Bay and 52 in the Thunder Bay area. The large majority of the programs serve breakfast or a morning snack. The food is distributed to the students of the school, to supplement meals the students are receiving at home. On average, nearly 9,000 children will access the program in the District every month. In November 2015, Student Nutrition Programs in the Thunder Bay District served a total of 133,037 meals and snacks.
MOBILE MARKET
Fresh food is not always easy to find in urban areas or at an affordable price. Since 2013, Roots to Harvest has run a mobile food market to give people living on a low income the ability to purchase high quality, locally grown, fresh produce. Located at the Water Street Bus Terminal, the mobile market operates one day a week in the summer and sells food grown by youth at the Roots to Harvest garden located at Bay and Algoma. The vegetables are picked fresh each market day and are transported using a bicycle cart from the garden to the market. It doesn’t get more green!

COMMUNITY FOOD SECURITY REPORT CARD 2015 13
ANISHAWBE MUSHKIKI
Anishawbe Mushkiki runs a Healthy Eating Active Living (H.E.A.L) program that is similar to the program run out of the Indian Friendship Centre. The After School Program partners with Biwaase’aa and the Lakehead Public School Board and Catholic School Board. There are 10 sessions focusing on healthy lifestyle for children aged 7 to 13. Anishnawbe Mushkiki also runs a youth and elder bi-weekly kitchen program.
NORWEST COMMUNITY HEALTH CENTRES
The centre runs nutrition programs that include cooking demos for people who want to learn how to cook, and wellness programs for people with diabetes or other chronic conditions. The health centres are also a host site for the Good Food Box.
REGIONAL FOOD DISTRIBUTION ASSOCIATION
The RFDA is committed to providing healthy, nourishing food to those who need it most in northwestern Ontario. In addition to being the food distribution hub for 50 food banks in northwestern Ontario, the RFDA encourages food education and supports food security and sovereignty for First Nations communities. Through their feeding programs, the RFDA provides meals to over 14,000 people every month all across the region. The RFDA’s kitchen facility in Thunder Bay is used for children’s cooking classes, small businesses, and for programming to help people learn basic cooking and food preservation skills. Many individuals and groups volunteer at the RFDA as a way to give back to their community by preparing nutritious food for all.
KAKABEKA FOOD CUPBOARD
The Kakabeka Food Cupboard has been in operation for over 15 years, and services a wide range of communities, both organized and unorganized. They provide food services to clients from as far west as Upsala and as far east as Pass Lake. This entirely volunteer-run organization is administered out of Redeemer Lutheran Church in Kakabeka Falls, and provided over 850 hampers to families and individuals in 2015. During that period, they also provided over 2,000 school lunches to students in the region who had no lunch.
SHKODAY ABINOJIIWAK OBIMIWEDOON ABORIGINAL HEAD START, THUNDER BAY
Shkoday is a First Nations organization focused on community-building. Among its initiatives, it undertakes a range of food related programming, including hosting a garden, coordinating a food wagon that serves meals to homeless people, and working with 7 elementary schools to provide healthy meals and snacks to students. Shkoday also partners with the Ministry of Natural Resources (MNR) on the Moose on the Loose project. Through this partnership, the MNR makes confiscated moose and deer available to Shkoday, which pays the butchering costs for the animals. The meat hampers are then distributed through the Regional Food Distribution Association to community members. In 2014, 6 moose were confiscated, making 1,400 pounds of cut and wrapped meat, which was distributed to 84 families.
OUR KIDS COUNT
Our Kids Count runs a multitude of food programming. OKC is a Good Food Box host site, they offer monthly workshops to families called “Cooking with the Good Food Box”, and run a free monthly breakfast program that usually feeds between 80-100 people. Through the Community Kitchen Program, families, children and youth share in menu planning and cooking with peers and take home prepared meals for their family. In the summer of 2015, OKC was involved in the Simpson Street Veggie Garden and had families participate in growing their own food, harvesting it in the fall, and cooking with the produce that was harvested. OKC is designated as an emergency food cupboard location in their neighbourhood and have daily visits from families needing this support. They are also a supporter of the Blessings in a Back Pack program and provide a space for Blessings to store their food, pack their bags and also provide 2 fresh fruit per child to be included into the Back Pack.
INDIAN FRIENDSHIP CENTRE
The Healthy Eating Active Living (H.E.A.L) runs for 10-12 weeks and is a weight management program designed to provide individuals with inspiration and support as they work towards making healthier lifestyle choices. Participants learn practical and hands on approaches to healthy eating and physical activity, and is open to men and women ages 16-65+.
THUNDER BAY AND AREA FOOD STRATEGY14
WHAT ARE THE ISSUES AROUND FOREST AND FRESHWATER FOODS IN THE THUNDER BAY AREA?Forest and freshwater foods—such as blueberries, mushrooms, tea, wild rice, fiddleheads, medicinal plants and wild fish and game—have been integral to the Northwestern Ontario food system for thousands of years. Aboriginal peoples still possess traditional ecological knowledge that enables them to live off the land. This knowledge of forest and freshwater foods played an essential role in the settlement of European communities when fur traders arrived. Today, both Aboriginal and non-Aboriginal peoples continue to depend on local forests and freshwater for food; hunting, fishing and gathering remain an important part of northern culture.
Despite the importance of forest and freshwater foods to our food system, there are a number of challenges to the integrity of this food source. In certain cases, industrial development has negatively impacted fish and wildlife habitats while urban, suburban and rural development encroaches on forests, rivers, and other productive spaces.
Harvesting foods can contribute to a healthy and active lifestyle, foster a stronger connection to nature, maintain cultural traditions, and support intergenerational relationships. Practicing personal harvesting of forest and freshwater foods often comes at a lower cost than store bought food, particularly for plant and mushroom foraging. Communities in the Thunder Bay area live in an eco-zone that hosts a high diversity of plants and animals, many of which can be used for food.
Protecting and promoting forest and freshwater food systems can help overall ecosystem health by reducing greenhouse gas emissions and improving resilience in the face of climate change. The health of forest and freshwater foods systems is also a good indicator of the ecological integrity of ecosystems as a whole. For these reasons, it is imperative to protect boreal forests and watersheds, as these ecosystems are the basis for hunting, fishing and gathering activities.
Nationally and provincially, there is increased demand for forest and freshwater foods. In part this is because they are thought to be fresher and healthier than store bought foods. Within the Thunder Bay area, forest and freshwater foods are harvested in parks, green spaces, and other public and private spaces. Forest and freshwater foods can be found for sale at local farmers’ markets, grocery stores, restaurants, and road-side vendors.
Commercially, forest and freshwater foods present opportunities for high value foods and value-added products. The potential of this industry is great, and is evidenced by the success of forest and freshwater foods sectors in other provinces (BC and Quebec most notably). There is likely limited potential for commercial development on lands within the Thunder Bay area because rural, suburban, and urban development affects the ecology of otherwise productive areas (e.g. forests, lakes, rivers). In terms of commercial opportunities, the Thunder Bay and area population still presents a significant market for commercial producers of forest and freshwater foods, as well as throughout northwestern Ontario. Seizing this opportunity will be advantageous to ensuring a more resilient food system within the region.
FOREST & FRESHWATER FOODSGOAL: Increase our region’s knowledge of available forest and freshwater foods and their sustainable harvest, protect and conserve forest and freshwater food ecosystems, and support a diverse and sustainable forest and freshwater foods economy within the region. This economy includes both harvesting for personal consumption and the development of commercial opportunities.

15
FOREST AND FRESHWATER FOODS INDICATORS
Measures of our region’s knowledge of forest and freshwater foods
Indicator Measured Over
Number of sustainable harvesting workshops 1 27 2015
Number of participants in sustainable harvesting workshops 2 834 2015
Number of groups that run sustainable harvesting workshops 3
4 2015
Measures of protecting and conserving forest and freshwater foods ecosystems
Indicator Measured Over
Number of conservation areas managed by the Lakehead Region Conservation Authority 4
7 2015
Number of forest management properties managed by the Lakehead Region Conservation Authority 5
3 2015
Number of hectares owned by the Lakehead Region Conservation Authority 6
2,500 2015
Number of provincial parks within 200 kilometers of the Thunder Bay area 7
8 2015
Measures of a diverse and sustainable forest and freshwater foods economy
Indicator Measured Over
Number of established forest and freshwater foods businesses 8
8 2015
Number of workshops aimed at forest and freshwater foods entrepreneurs 9
1 2015
Moose population in northwestern Ontario 10 41,000 2014
Estimated number of moose harvested in the Thunder Bay Wildlife Management Unit (WMU, 13) 11
66 2015
Estimated number of white-tailed deer harvested in the Thunder Bay Wildlife Management Unit (WMU, 13) 12
2,184 2014
Estimated number of black bear harvested in the Thunder Bay Wildlife Management Unit (WMU, 13) 13
178 2014
Average yearly catch numbers over the past 5 years for Whitefish in Lake Superior 14
122,450 2011-2015
Average yearly catch numbers over the past 5 years for Cisco (Herring) in Lake Superior 15
212,498 2011-2015

16
food ecosystems on public lands. People are allowed to harvest plants for personal consumption in these areas; however conservation reserves and provincial parks are protected from development.
The Ontario Government collects information on the number of large game—moose, deer, and bear—in order to adjust the number of hunting tags (or permits) that are issued during hunting season. In 2014, there was a 13% decline in the moose population around the Thunder Bay area and a much higher drop around Dryden (60%). The overall population of moose was estimated to be 41,000 in northwestern Ontario in 2014. The serious decline in moose led the Ministry of Natural Resources and Forestry in 2014 to reduce the number of moose tags issued by 22%.16 Predation, harvest pressure, disease or parasites, thermal stress and births are all factors in the declining populations. Fewer moose and tags has a two-fold economic impact. Many people in and around Thunder Bay hunt moose for food. A decline in moose numbers therefore has an economic impact for households. At the same time, moose hunting is a draw for tourists so a drop in the moose population hurts the local tourism sector.
Lake Superior and other lakes in the area are home to many fish species. Some fish is harvested for personal use. Fish are also harvested commercially and exported mainly to the United States. The two most commonly fished species are Lake Whitefish and Lake Cisco (Herring). Both populations have seen consistently good catch and recruitment numbers over the past five years.17 Currently there is only one business that makes Great Lakes fish for sale in the local market.
WHAT DO THESE INDICATORS TELL US?There has been a huge surge of interest among people in the Thunder Bay area in learning about what foods are available in our region and how to harvest them sustainably. In part this has been driven by the efforts of organizations such as Ontario Nature, who have raised awareness about forest foods as a sustainable and nutritionally rich food source. Harvesting workshops often fill up days or weeks in advance, suggesting there is more demand for knowledge than is currently being met. Since areas are so diverse in their vegetation and landscape, and because available forest foods change with the seasons, there are volumes of knowledge that can be shared.
Harvesting forest foods and conserving forests can be done hand in hand. A local business producing birch syrup, for example, has a multi-year lease on a 65-acre birch forest that was once slated to be clear cut. The company produces birch syrup using the same process for maple syrup, conserving the forest since 2006. Harvesting mushrooms also does not hurt production the following year, as harvesting spreads the spores and increases the likelihood of a more abundant harvest the following year.
Forest foods represent an emerging market. Some forest foods are now being sold through grocery stores and restaurants. The number of forest food businesses has also been increasing and diversifying. In addition to seeing jam being made with wild berries like blueberries, fiddleheads, mushrooms, and foraged teas are starting to become more commonplace.
In 2013, the Government of Ontario signed into legislation the Local Food Act, which aims to foster local food economies in Ontario. The Act recognizes forest foods as a local food. Despite this, forest foods are an emerging market and the sector is not well understood by government. The surrounding forests, lakes, and waterways are an important source of food and tend to be overlooked in conversations about land management and “local and sustainable” food systems. Forest foods are generally not recognized by agencies that manage resources, public lands, and water ways, and harvesting food is often second or third on the list next to natural resource management, like timber and mineral extraction.
While there is growing interest in forest harvested foods, there is surprisingly little data on plant populations. There is a need to establish baseline date for monitoring the health of forest foods ecosystems in northwestern Ontario as people become more interested in harvesting foods for personal use and as more entrepreneurs start up businesses selling wild harvested foods. Conservation areas and provincial parks are starting points for measuring the health and viability of forest
PERSONAL, COMMERCIAL AND RECREATIONAL HARVESTING
Personal harvesting is any harvesting activity primarily intended to benefit individuals or households. Personal harvesting can include economic activity as long as it is more or less limited to the household level (i.e. household food economy, food sharing, etc.). An example of personal harvesting could be the harvest of raspberries or fish for personal consumption.
Commercial harvesting is any harvesting activity carried out for the specific purpose of generating economic benefit from the sale or trade of the harvested food. Commercial harvesting tends to occur in greater quantity than personal harvesting, although not always. An example of this could be the harvest and sale of wild blueberries or various varieties of mushroom.
Recreational harvesting includes harvesting activities that are non-commercial in nature, and for a primary purpose other than consumption. Examples of this might include sport fishing or harvesting for educational purposes.

COMMUNITY FOOD SECURITY REPORT CARD 2015 17
FOREST AND FRESHWATER FOODS HIGHLIGHTS
ONTARIO NATURE
Over the past 2 years Ontario Nature has offered harvesting workshops to teach people how to sustainably harvest wild edibles. In 2014, Ontario Nature held 26 workshops in northwestern Ontario with a total of 576 participants. The following year, in 2015, they held 25 workshops that brought out a total of 780 participants in places such as Dryden, Thunder Bay, Red Rock, Nipigon, Terrace Bay, and Sault Ste. Marie. Ontario Nature also ran business workshops in Dryden and Sault Ste. Marie for entrepreneurs looking to start a sustainable forest food harvesting business. Ontario Nature has also developed several resources to help people learn about foraging, such as a Forest Food Foraging Guide.
LOCAL FOOD ACT (2013)
On November 5, 2013, the Ontario Government passed the Local Food Act, which aims to foster local food economies in Ontario. Due to the advocacy efforts of Ontario Nature, the Ontario Government included forest and freshwater foods in the definition of local foods. Ontario Nature was later successful in pursuing a Local Food Fund grant to hold personal harvesting workshops and those geared towards entrepreneurs.
COURT STREET EDIBLE FOOD FOREST
In 2014 Roots to Harvest and the City of Thunder Bay planted the city’s first urban food forest. Located at the parkette on Court Street, the food forest includes a range of fruit trees and berry bushes that, once fully grown, will become a place people can go to pick apples, plums, saskatoons, and other tasty snacks. In addition to making fresh food more available in the city, the food forest will make for a healthier and greener environment.
FOREST FOODS THAT ARE COMMONLY HARVESTED OR HUNTED:
In First Nation cultures, the medicine wheel symbolizes the interconnection of all life, the various cycles of nature, and how life represents a circular journey. The four sacred medicines within this tradition are sweetgrass, tobacco, cedar, and sage. These medicines are used for a range of purposes, such as cleansing, healing, and prayer. All four medicines can be grown or harvested in the Thunder Bay area.
• Blueberries
• Mushrooms (various varieties)
• Fiddleheads
• Chokecherries
• Raspberries
• Strawberries
• Saskatoons
• Highbush Cranberries
• Bunchberries
• Horsetail
• Daisy
• Juniper
• Clover
• Mint
• Cattails
• Sasparilla
• Dandelion
• Lambs Quarters
• Fireweed
• Goldenrod
• Stinging Nettle
• Yarrow
• Plantain
• Camomile
• Wild Rose
• Beaked Hazel
• Willow
• Pine
• Spruce
• Birch
• Moose
• Deer
• Grouse
• Bear
FRESHWATER FOODS THAT ARE COMMONLY FISHED:
• Lake Trout
• Lake Whitefish
• Lake Cisco (also know as Lake Herring)
• Lake Salmon
• Walleye

THUNDER BAY AND AREA FOOD STRATEGY18
WHAT ARE THE ISSUES AROUND FOOD INFRASTRUCTURE IN THE THUNDER BAY AREA?Developing a sustainable food system depends on strong and supportive infrastructure. Food storage, processing, and distribution services are integral parts of the infrastructure that move food from farm to plate.
Only 70 years ago, most food consumed in the cities of Fort William and Port Arthur was grown in backyard gardens or on nearby farms. Farms sold directly at the farm gate, at farmers’ markets, or to distributors who supplied independent food stores. The local food system began to change dramatically in the mid-20th century as the first supermarket opened here in the 1950s and the TransCanada Highway was completed through the area in the 1960s. Today, long-distance truck transportation has become the main means of moving food, as transportation networks, food suppliers and distributors have become more globalized and as consumer buying has favoured big box food stores offering processed and fresh foods mainly from elsewhere.
Increasing community interest in a more localized food system reflects greater awareness of the environmental, social and economic costs of a globalized food system. Trucking food from far away shifts benefits from the local economy to elsewhere, while contributing to greenhouse gas emissions and a disconnect between urban residents and where their food comes from. Our increasingly industrialized food system has also left Thunder Bay without centralized storage and with very little food processing or agri-business infrastructure.
Agricultural economic impact studies in Canada and the U.S. have demonstrated many times over the income and employment gains to be made from strengthening local supply chains. Though highly dependent on the locale and commodity in question, buying local food has a multiplier effect of 1.4 to 2.6 throughout the wider economy.1 The multiplier effect is the amount of local economic activity that is triggered by the purchase of any one item. Community economics tells us that the more a dollar circulates in a defined region, and the faster it circulates, the more income, wealth and jobs it creates. It is estimated that if every household in Ontario spent $10 a week on local food, we would have an additional $2.4 billion in our local economy at the end of the year and create 10,000 new jobs.2
In 2013, a multiplier workforce study found that the food production sector in Thunder Bay District has an average workforce multiplier effect of 1.7. This means that in Northwestern Ontario, every 1,000 jobs at local farms and food processors support 700 additional jobs indirectly among suppliers and retailers. The study also identified a need to address current infrastructure gaps, such as a regional distribution centre, processing facilities and storage in order to enhance the growth of the region’s food sector.3
FOOD INFRASTRUCTUREGOAL: To support the creation of a food supply chain that links local production to processing, distribution and marketing, consumption and waste management in ways that sustain the local economy, minimize environmental impact and improve people’s access to healthy food.

COMMUNITY FOOD SECURITY REPORT CARD 2015 19
WHAT IS FOOD INFRASTRUCTURE?
Production
Food production is the process of growing, raising,
and harvesting food.
Distribution
Food distribution is how food
moves between different points in the food system.
FOOD INFRASTRUCTURE INDICATORSALL INDICATORS RELATE TO DATA GATHERED IN THE THUNDER BAY CENSUS METROPOLITAN AREA.
Measures of Access to Local Food Indicator Measured Over
Number of community supported agriculture initiatives 4 1 2015
Number of online ordering platforms for local food 5 2 2015
Number of farmers’ markets 6 5 2015
Number of food and farming co-ops 7 1 2015
Number of retail stores stocking local food 8 8 2015
Number of pick your own operations 9 4 2015
Measure of Distribution Infrastructure Indicator Measured Over
Number of food distributors 10 10 2014
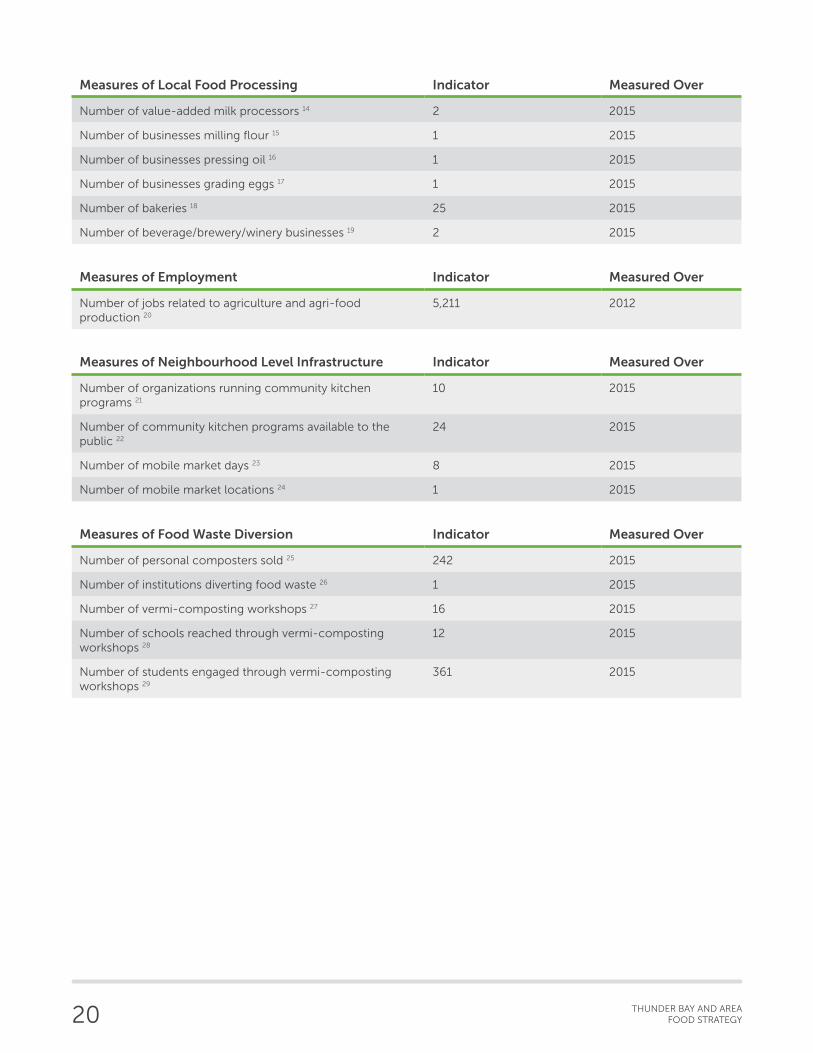
Measures of Local Food Processing Indicator Measured Over
Number of abattoirs 11 1 2015
Number of businesses doing further meat processing 12 9 2015
Number of fluid milk processors 13 2 2015
Processing
Food processing is the transformation of raw ingredients into food, or food into other food.
Storage
Vegetables, grains, dairy, meats, and other foods are stored at different
points along the value chain, from on farm, to distribution warehouses, to
home pantries.
Access/Consumption
Food access/consumption is where food is purchased
or otherwise acquired, prepared, and eaten.
Disposal/Waste Recovery
Food waste is food that is discarded, lost, or uneaten and
can happen at the stages of production, processing, storage, distribution, and consumption.
THUNDER BAY AND AREA FOOD STRATEGY20
Measures of Local Food Processing Indicator Measured Over
Number of value-added milk processors 14 2 2015
Number of businesses milling flour 15 1 2015
Number of businesses pressing oil 16 1 2015
Number of businesses grading eggs 17 1 2015
Number of bakeries 18 25 2015
Number of beverage/brewery/winery businesses 19 2 2015
Measures of Employment Indicator Measured Over
Number of jobs related to agriculture and agri-food production 20
5,211 2012
Measures of Neighbourhood Level Infrastructure Indicator Measured Over
Number of organizations running community kitchen programs 21
10 2015
Number of community kitchen programs available to the public 22
24 2015
Number of mobile market days 23 8 2015
Number of mobile market locations 24 1 2015
Measures of Food Waste Diversion Indicator Measured Over
Number of personal composters sold 25 242 2015
Number of institutions diverting food waste 26 1 2015
Number of vermi-composting workshops 27 16 2015
Number of schools reached through vermi-composting workshops 28
12 2015
Number of students engaged through vermi-composting workshops 29
361 2015
COMMUNITY FOOD SECURITY REPORT CARD 2015 21
WHAT DO THESE INDICATORS TELL US?FOOD BUSINESSES AND EMPLOYMENT
Local farms and food processing are an important component of our economy. According to the 2013 Thunder Bay Multiplier Study, “many jobs were lost in Ontario as a result of the economic depression since 2008. However, food production related employment has been more or less stable as compared to other industries.”30 The food processing and farming businesses also generate the highest annual revenue in Ontario and provide a significant number of both direct and indirect jobs.31
ACCESS TO LOCAL FOOD
Despite this, by and large, our food supply chain is not oriented towards local food and our infrastructure reflects this. Food tends to come into Thunder Bay from the western provinces of Alberta, Saskatchewan and Manitoba, via Winnipeg or Calgary. Some food is imported from the United States and southern Ontario via the Toronto Food Terminal.32
The fact that food is mainly sourced from and aggregated in the western provinces before being shipped to Thunder Bay has a significant impact on the ability of grocery stores, restaurants, and public sector institutions to buy local food. Distribution channels are not set up to provide local and Ontario product. It also means that local processors and manufacturers who want to get into the supply chain and who are buying ingredients through the traditional distribution channels are more often than not buying non-Ontario ingredients. When that happens their finished product cannot be considered Ontario product.33
Distribution is starting to connect better with local food as grocery stores, restaurants, catering companies and institutions are starting to source food from the area. Many farmers are distributing their food to local grocery stores and restaurants on their own. Some distributors are beginning to source from local producers. Small local distributors may not have the advantage of a large warehousing facility for aggregating product, but they are usually able to be flexible in their buying habits, which means they are better equipped to flex with the seasonality of Ontario suppliers. Distributors based in the area often have a better understanding of the local landscape, as well as the communities and the products that are available within reach. Locally-based operators also tend to have smaller vehicles in their fleets than the larger competition, placing middle distance routes within their reach.34
Online ordering platforms have sprung up to make it easier for people to access local food and to make it more cost efficient for growers. Online ordering platforms are beginning to extend across the northwest, creating linkages to Dryden and Rainy River, for instance. Farmers’ markets, pick-your-own operations, and community supported agriculture are other common ways that people have access to local food.

THUNDER BAY AND AREA FOOD STRATEGY22
LOCAL FOOD PROCESSING AND STORAGE
There are a growing number of businesses popping up in the Thunder Bay area that are doing further processing with local and non-local ingredients. Products range from teas, pasta and pasta sauce, perogies, preserves and canned goods, to baby foods, dairy products, locally roasted coffee and chocolate, beef jerky, bitters, locally milled and pressed flour, and much more. Although many of the businesses doing value-added processing are small—generally ranging from part-time businesses to up to 5 full-time staff—these businesses are thriving and there is potential for future growth and for new businesses to emerge and fill gaps in the market. There is a need to inventory the diversity of businesses doing value-added processing so that the sector can better be tracked, understood and supported.
More and more farmers are beginning to add infrastructure to their farms, such as storage buildings and equipment for further processing raw goods. These improvements make local foods available longer into the year, increase efficiencies, open up new markets, and improve revenues for growers. While gaps in infrastructure are beginning to slowly fill, there are still large holes. Thunder Bay, for instance, does not have the ability to process chicken. One reason for this and other products is that demand and supply need to grow to a point where volumes justify the investment in new facilities and equipment.
Existing systems, regulations, and missing infrastructure still present a number of challenges when it comes to accessing local food. Targeted investment, favourable legislation, regulations, research, and policy development will be essential in stimulating regional food production and processing.
NEIGHBOURHOOD LEVEL INFRASTRUCTURE
There is a need for more neighbourhood level infrastructure, such as small-scale markets, that would make local food more accessible to communities, particularly low-income communities. At the same time, more supports are needed for community-based programs and initiatives, such as community kitchens and community gardens, since most are volunteer run and are therefore unable to offer regular programming and use these spaces to their full potential. More resources and coordination would certainly increase the demand for, access to, and impact of these spaces.
If urban agriculture is to be re-introduced into urban areas on a larger scale, there is a need to re-imagine green spaces in urban areas. At the moment, boulevards, parks, and institutional lands—like university grounds—lack diversity and are generally underused. These spaces can be transformed into places for growing food. It would be a huge boon to see gardens replace grass on boulevards, park space be dedicated to outdoor bake ovens and urban farms, and space along recreational trails be naturalized to provide more habitat for pollinators or foods that can be harvested. Oftentimes boulevards are next to houses, parks are in neighbourhoods, and institutional grounds are near schools and health care facilities. Diversifying these spaces could be part of a wellness or education strategy. New forms of infrastructure will be needed as well. For example, year-round greenhouses, aquaponics facilities, re-purposed industrial buildings for storage or distribution, and a permanent farmers’ market building would all help increase production and make local food available all year.
FOOD WASTE DIVERSION
National studies indicate that a lot of waste is generated across the food chain—from farm production, distribution, retail to consumption. More than $31 billion worth of food is wasted every year in Canada. Individuals waste about 47% of all food wasted in Canada. Food manufacturing and processing is also responsible for as much as one-fifth of the food wasted across the country. Ten percent of food waste happens on farm and retailers waste another 10%. Restaurants and hotels waste a further 9% and the rest is wasted at processing facilities, food terminals, or during transportation.35 Some institutions, businesses, and individuals are diverting food waste; however, the amount pales in comparison to the overall amount of waste generated. There is enormous opportunity to ramp up food waste management by analyzing waste streams towards strategic diversion, and implementing solutions such as curbside pick-up of organic material. A sustainable food system requires that waste is treated as a resource to be recycled back into agricultural production.

COMMUNITY FOOD SECURITY REPORT CARD 2015 23
FOOD INFRASTRUCTURE HIGHLIGHTS
SUSTAINABLE NEW AGRICULTURAL PRODUCTS (SNAP) PROGRAM
With an investment of $290,000 from FedNor and Industry Canada through the Northern Ontario Development Fund, the Sault Ste. Marie Innovation Centre and 3 northern partners (including Clover Valley Farmers’ Market of Fort Frances) conducted a pilot project in 2014 to help small agri-food producers and processors in northern Ontario create new and value-added products. Eight applicants from the Thunder Bay area were successful grant recipients. Three farms added cold storage onto their farming operations to extend the season, 1 farm added a greenhouse to their operation, a local flour mill purchased an oil press to begin making local canola oil, and 3 additional businesses undertook food processing (an apple cider press, a hamburger patty maker, and a brewing system).
FOOD TRUCKS
In 2013, food trucks were the number one food trend in North America. It is no coincidence that 2013 also marked the year that Thunder Bay’s first food truck was up and running. By 2015, 6 food trucks were operating in the city, bringing fun and creative food to city streets and events.
THUNDER BAY COUNTRY MARKET
An average of 6,000 visitors shop at the Thunder Bay Country Market each week for local meats, cheese, eggs, produce, baking and handcrafted items. The Country Market has grown from 11 vendors in 1997 to over 100 seasonal vendors today. The Country Market adds close to $5 million to the local economy.
COMMUNITY SUPPORTED AGRICULTURE
Community Supported Agriculture (CSA) is a concept which has been steadily growing in popularity across North America over the past 30 years. In this community supported model, a farm receives a payment up-front for a coming season’s harvest. Once the farm starts harvesting food, subscribers receive frequent batches of fresh produce, which is locally grown and often organic. CSA’s usually mean lots of produce, but can also include other goods the farm produces, such as dairy, meat, and baking. By receiving pre-payment for a season, farms are able to plant according to demand and more securely cover the early costs of sowing and tending to their harvest. CSA programs are generally administered either by the farms themselves, or by local co-op initiatives.
THUNDER BAY FARMING CO-OP
Established over 55 years ago, Thunder Bay Co-Op Farm Supplies represents a valuable resource for both professional and casual farmers across the northern Ontario region. Founded by local farmers who wanted to receive better pricing on farm stock and supplies by pooling their resources and buying power, the group has seen a steadily growing patronage over the past half decade. They sell a wide variety of time-tested products at responsible prices, and welcome visitors from near and far to pay them a visit and see what they have to offer.

THUNDER BAY AND AREA FOOD STRATEGY24
WHAT ARE THE ISSUES AROUND FOOD PROCUREMENT IN THE THUNDER BAY AREA?Due to the emergence of centralized distributors, the loss of local food infrastructure, and the dominance of corporate food service companies, food is now sourced from all over the world. This means that within the Thunder Bay area, the rest of Ontario, and much of Canada, public dollars used for buying food for hospitals, day cares and other public sector institutions are not being spent on food businesses that would benefit the local economy.
This is a serious oversight when we consider that the Broader Public Sector (BPS) plays a significant role in the food economy and has dramatic buying power. The Ontario healthcare system alone serves an estimated 115,000,000 meals to patients every year, with the value of food in all those meals estimated to be over $285,000,000.1 In 2014, BPS institutions in the Thunder Bay area spent approximately $10 million on food.2 Shifting even 10% of purchases to locally grown and processed foods would create a $1 million market for farmers and processors. Public institutions have the potential to use their significant purchasing power to invest in local agriculture, while providing opportunities to other local food entrepreneurs along the supply chain.
Throughout Canada and many other countries, the consumption of local foods within the BPS is being promoted as a means to scale-up local food systems and enhance local economic development. Locally, awareness is increasing among the public, the BPS, restaurants and businesses that buying local means tangible economic benefits. This increased awareness is generating growing demand, market opportunities and greater capacity—all of which is enhancing the local economic development cycle.
Local food not only has economic benefits, but often also means more nutritious, fresher, and tastier food. The BPS is responsible for the health and well-being of many people, including students, the elderly and the ill. Sourcing local food is therefore a way to raise the bar towards offering more nutritious and better tasting food to a range of people who would benefit from eating well. Buying food closer to the source would also mean reducing greenhouse gas emissions that come from shipping food long distances.
PROCUREMENTGOAL: Leverage procurement food spending to develop a public sector food supply chain that contributes to the economic, ecological and social well-being of Thunder Bay and Area through food purchases that foster local production, processing, and distribution.
WHAT DOES “LOCAL FOOD” MEAN ANYWAY?Local food is difficult to define. Oftentimes institutions talk about local as meaning food grown in Ontario. Other times the term “local” is used to talk about food from northwestern Ontario or food from around Thunder Bay. The Food Strategy does not currently have a definition of local food because there has not yet been a process to decide where the boundary of local/non-local lies, or how this would be verified. Defining local food becomes even more complicated with processed foods. Does a processor using non-Ontario product processing food in Thunder Bay count as local food? What if 50% of the ingredients are from the area and 50% are non-Ontario product? Add to that the reality that some foods are not even available locally, such as coffee and chocolate, or at the volumes needed to supply the area, and it makes answering the question of “what is local?” even more difficult. All that said, one of the goals of the Food Strategy is to foster local economic development. Local food is therefore generally taken to mean food grown and processed in and around the Thunder Bay area. Food grown in northwestern Ontario is thought of as “regional” and food from elsewhere in the province as Ontario product.

COMMUNITY FOOD SECURITY REPORT CARD 2015 25
FOOD PROCUREMENT INDICATORS
Measures of Local Food Purchasing Indicator Measured Over
Number of health care facilities purchasing food from farms within 100 kilometers of Thunder Bay 3
5 2015
Number of daycares purchasing food from farms within 100 kilometers of Thunder Bay 4
18 2015
Number of postsecondary institutions purchasing food from farms within 100 kilometers of Thunder Bay 5
1 2015
Number of schools purchasing food from farms within 100 kilometers of Thunder Bay 6
4 2015
Number of high schools with a farm to cafeteria program 7 4 2015
Number of farm to cafeteria events 8 42 2015
Number of meals served through the farm to cafeteria program 9
1,920 2015
WHAT DO THESE INDICATORS TELL US?The landscape has shifted in a few short years in terms of the effort institutions are making to buy local food. For instance, the Corporation of the City of Thunder Bay has become an advocate for locally produced foods, having endorsed the Thunder Bay Food Charter (2008), the Community Environmental Action Plan (2008), and the Thunder Bay and Area Food Strategy (2014). The City recently adopted a Sustainable Ethical Environmental Purchasing Policy (2011) and was awarded 2 Greenbelt Fund grants to help shift purchasing policies towards more local food.
Under the first Greenbelt grant, the City increased purchasing of local food by 2% in one year. A main takeaway from this project was that it challenged the assumption that public sector institutions cannot buy local food. Up until that point, it was generally believed that the volumes, consistent supply, and health and safety requirements could not be met by producers from the area. Under the second Greenbelt Fund project, the City increased purchasing of local food by 10% in one year for its 3 Homes for the Aged and 4 daycares.
Together these 2 projects provided opportunity for convening a range of food system interests–producers, buyers, distributors, institutional administrators and front-line staff–on the topic of how to bring more locally-sourced food to long-term care and child care facilities. It also helped build stakeholder enthusiasm and confidence in the value of giving priority to locally-sourced food, where possible.
While demand for local food among institutional buyers is growing, there is a need to make buying local food easier for managers, chefs, and storekeepers. One of the realities of the modern food system is that many institutions have outsourced management of food services to external private companies. These companies have their own distribution networks that source from outside Ontario, specifically the Winnipeg area. Local food content is often difficult to identify through mainline distributors until after the product is delivered. Smaller institutions like daycares and schools also have challenges around sourcing local food since they require such low volumes.10 Since many growers are doing their own distribution, it can be hard for small institutions to make the case for deliveries.
Increasingly, alternative local distribution channels are developing, such as online ordering platforms, and some local distributors are making connections with growers from the area. It is likely that as the demand for local food increases, local food distribution channels will become more developed, convenient and efficient, and available to institutions of all sizes.

THUNDER BAY AND AREA FOOD STRATEGY26
HOW MUCH LOCAL FOOD IS BEING BOUGHT?There is little by way of data tracking volumes of local food purchased by public sector institutions, restaurants, and caterers. Generally this information is not requested by institutions. There are also big differences in how much local food is bought. For instance, some institutions will purchase local food a couple times a year for special events while others use local food weekly. The same is true for restaurants and caterers.
FOOD PROCUREMENT HIGHLIGHTS
CITY OF THUNDER BAY BUYS INTO LOCAL FOOD
Over 2014 the Thunder Bay and Area Food Strategy worked with the City on a local food procurement project that aimed at increasing that amount of local food being sourced by the City’s Homes for the Aged and daycares by 10%. Following this, the City identified 6 local food procurement objectives for 2015 that it wanted to pursue:
• Develop and launch quarterly local food meetings with the long-term care homes and day cares to continue the conversation on how they might improve internal ordering processes, and better work with local food producers and distributors
• Pilot a forward contract with a local farm. A forward contract is a buying arrangement that provides the City with a guarantee that the product will be available and at a certain price, while giving the grower certainty that City will purchase the product and at a agreed upon price
• Undertake a food waste audit with one of the Homes for the Aged to measure food waste—such as stock, cooking, and plate waste—so that waste reductions can be reinvested back into buying local food.
• Engage residents through local food days, tours, and by bringing in farmers as guest speakers
• Share learnings with food service staff from other institutions—such as schools, hospitals and post-secondary institutions—on the City’s procurement model
• Establish, measure and report on local food key performance indicators
THUNDER BAY REGIONAL HEALTH SCIENCES CENTRE
The Regional Hospital continues to use locally grown potatoes in their menu. This past year they began using large whole carrots from a local farm and added a homemade soup to the menu using locally grown cabbage. The Regional Hospital is also host to a farmers’ market during the summer months and in 2015 the Hospital’s Prevention and Screening Services and Mental Health Programs departments combined their efforts to grow a garden. The project was a big success - so much so, that the units started having salad days, making kale chips, as well as many other tasty treats.
Another challenge institutions face when it comes to purchasing local food is that the supply of local food is limited by the shorter growing season and smaller scale production in the immediate area. In other words, some institutions require such large volumes that they cannot yet substitute their purchases entirely with food from the area. Some are, however, still making efforts to buy some northwestern Ontario and Ontario foods. There is an opportunity to maximize the use of certain crops (e.g. root vegetables, cabbage, onions) and add storage, processing, and mechanization on farms that would help growers reach greater volumes and at a more competitive price point. Another option could be for farmers not producing enough on an individual basis to fill orders collectively.
Procurement stakeholders want product to be aggregated and pre-processed whenever possible before it arrives at their door in one convenient delivery. Making menu substitutions is difficult when labour costs go up as raw food preparation takes more time. Having the option of buying pre-processed local foods (washed, chopped, frozen, and bagged) appears to be a necessary component of a successful local food system. Integrating local food into institutional menus would also occur sooner if food service staff were trained in how to source and prepare locally-sourced foods and make menu substitutions using food from the area.11
Ideally, as the public sector moves towards buying from closer to home, they will also begin tracking their purchases more closely. At the moment, it is clear that the number of institutions buying from the Thunder Bay area, northwestern Ontario, and Ontario is increasing, yet there is very little information on the volumes or dollars purchased. Having this information will be key in measuring progress over the long term.

COMMUNITY FOOD SECURITY REPORT CARD 2015 27
FOOD ACCESS PROGRAMS USING LOCAL FOOD
Institutions are not the only ones starting to buy local food. Organizations involved in food access initiatives are trying to do their part to support farmers from the area too. As food prices go up, local food is also becoming more cost competitive. In 2015, the Good Food Box bought $29,332 worth of food from growers in the Thunder Bay area: 18,526 lbs of potatoes, 837 cabbages, 1160 squash, 4,145 lbs of carrots, 1,170 ears of corn, and 51 litres of local blueberries. This was $8,000 more than they purchased the previous year ($21,402 in 2014). The Regional Food Distribution Association also uses local food in their programming and food box. Several nearby farms and a couple community gardens donate produce during the growing season to the RFDA.
LAKEHEAD UNIVERSITY
In 2014, Lakehead University hired back Aramark as the food service provider for university cafeterias and catering. An organized effort on the part of the student body to see more local food on campus led Aramark to commit to sourcing 20% of its food from Ontario.
LITTLE LIONS WALDORF DAYCARE & KINDERGARTEN
Little Lions Waldorf Daycare & Kindergarten is a champion of local food in their 12 daycares. According to CEO Marilyn Grudniski, “We try very hard to minimize the exposure of children to potentially harmful or controversial substances, which includes things like preservatives, pesticides and hormones which may be present in our food. We choose ingredients with great care, often buying organic. We buy local beef from a reputable farmer, veggies and berries grown locally (often right here in our own community gardens), flour and cheese from local producers. We hope that by buying this high quality food and serving it as close to its natural state as possible, we will set this example to hundreds of children daily, encouraging families to become more ecologically conscious while enjoying great food!”
THUNDER BAY AND AREA FOOD STRATEGY28
WHAT ARE THE ISSUES AROUND FOOD PRODUCTION IN THE THUNDER BAY AREA?Agriculture is the backbone of our food system. Crops and livestock provide most of our calories and proteins while agriculture and related industries play a crucial role in the life of our economy. Nationally, the food and farming sector accounts for 8% of Gross Domestic Product and 1 in 8 jobs. Within the province of Ontario, food and farming compete with the auto industry as the largest sector of the economy.1
On average, food travels 3,500 km to reach Thunder Bay and the storage, refrigeration, packaging and transportation involved generates waste and burns a large amount of fuel.2 The food system’s high energy inputs, such as fossil fuels and fertilizers account for almost a third of greenhouse gas emissions on a global scale.3 Localizing food production would go a long way to reducing greenhouse gas emissions. At the same time, having a stronger farming sector would mean being less vulnerable to rising food costs associated with increasing energy prices, loss of agricultural land due to development and erosion, and the impact of climate change—all of which threaten long-term access to imported food.4
A strong local food system depends on a healthy, thriving community of local food producers. Yet for many farmers it is difficult to make a living from growing food. Between 1996 and 2006, for instance, the number of farmers in the Thunder Bay District seeking a second income increased from 33% to 47%.5 One reason is the loss of local food infrastructure which means farmers have to incur higher costs to send their products further away to be processed. The rising cost of inputs (e.g. oil, fertilizers) and competition from foreign goods also make it harder to compete.
The viability of farming as a livelihood is particularly concerning if we consider that the farming population is aging (almost 50% of farmers in Canada are 55 or older) and many established farmers are retiring without successors.6
A high dependence on imported goods results in a loss of food self-sufficiency as well as lost economic opportunities. Many regions in North America and Europe are therefore choosing to promote agriculture and food processing for local consumption as a way to enhance economic viability at the local and regional levels.
Agriculture is already an important industry in northwestern Ontario. The Thunder Bay District Agricultural Economic Impact Study (2009) found that in 2005, farmers in the District reported a total of $32.3 million in gross farm receipts and directly support 605 on-farm jobs, and many more in related industries. Employment in agriculture between 2001 and 2006 also remained relatively stable compared to other sectors of the economy, such as forestry and manufacturing, which experienced combined losses of over 2,500 jobs.7 Producing more food in the area for sale in local markets would mean creating jobs, generating tax dollars, and having an impact on the wider economy through connections with other businesses, such as retail, manufacturing, construction, and transportation.
In addition to the economic benefits of agriculture, it is important to recognize the environmental and social benefits of local food systems. On the one hand, local food consumption tends to move consumers toward fresh foods and away from heavily processed foods that contain high amounts of sugar, salt, and fat. Agricultural landscapes provide a number of essential functions, including air and water purification, wetland and watershed protection, wildlife habitat, recreation, and open space.8
PRODUCTIONGOAL: Protect and encourage growth in farm-scale production so that a greater proportion of food is grown, raised, prepared, processed, and purchased closer to home.

COMMUNITY FOOD SECURITY REPORT CARD 2015 29
FOOD PRODUCTION INDICATORS
WHAT COUNTS AS A FARM?Statistics Canada uses $2,500 of declared farm income as the threshold for when someone is counted as a farm. Within the number of farms, there are different types of farms based on operating revenues, age, and total family income. For instance, small business focused farms have total operating revenues of $10,000 to $49,999 whereas very large business focused farms have total operating revenues of $500,000 or more. Within the District of Thunder Bay most farms are categorized as small business and medium business focused farms. Larger farms in Ontario tend to be in the southern part of the province.
UNLESS OTHERWISE INDICATED, ALL INDICATORS RELATE TO DATA GATHERED IN THE DISTRICT OF THUNDER BAY.
Farm Operator Characteristics Indicator Measured Over
Number of farms 9 239 2011
Number of farm operators 10 360 2011
Percentage of farmer operators under 35 years of age 11 35 2011
Number of farm operators between 35-54 years of age 12 155 2011
Number of farm operators 55 years of age and over 13 170 2011
Average age of farm operators 14 53.2 2011
Estimated number of full-time farm operators 15 60 2015
Estimated number of part-time farm operators 16 179 2015
Number of acres in production 17 59,072 2011
Average farm size (measured in acres) 18 247 2011
Total gross farm receipts 19 $32,396,811 2011
Jobs related to agriculture and agri-food production 20 5,211 2012
Areas owned (measured in acres) 21 45,953 or 80% 2011
Area rented/leased (measured in acres) 22 11,387 or 20% 2011

THUNDER BAY AND AREA FOOD STRATEGY30
Farm Characteristics Indicator Measured Over
Number of farms producing hay/fodder crops 23 86 2011
Number of farms engaged in dairy production 24 29 2011
Number of farms engaged in beef cattle production 25 19 2011
Number of sheep farms 26 7 2011
Number of hog farms 27 2 2011
Number of poultry and egg farms 28 4 2011
Number of farms engaged in other farm animal husbandry (horses, bison, deer, elk, llamas, etc) 29
41 2011
Number of farms involved in fruit production 30 8 2011
Number of farms involved in vegetable production 31 12 2011
Number of greenhouses (nurseries, floriculture, and vegetable) 32
25 2011
Number of Thunder Bay Beekeeper Association members 33 59 2015
Varieties trialed by the Thunder Bay Agricultural Research Station 34
223 2014
Number of people producing seeds for sale through the Superior Seed Producers 35
8 2015
WHAT DO THESE INDICATORS TELL US?The Thunder Bay District features a variety of farms. The single largest use of farmland is crop production with 45,943 acres or 80% of land in 2011 being put to this use. The main field crops grown in the area are barley, wheat, oats, corn, soybeans, potatoes and hay crops.36 Despite the relatively short growing season, the growing days in this region are long and there are clay deposits suitable for raising good crops of grasses and grains for livestock feed and pasture. Since land is comparatively inexpensive, many farms in the area are dedicated to the raising of livestock for meat or dairy. In addition to beef and dairy farmers, Thunder Bay is seeing a growing interest in the production of pork and specialty meats like lamb, goat and rabbit.37
There are a few farms growing grains for human consumption or for seed. There is a single local flour mill in this area which produces partially-sifted, whole wheat and rye flour and has the capacity to clean grains as well.38
Until recently the area was home to an egg farm that sold to grocery retail, institutions and distributors. With the sale of the farm’s egg quota, they have reduced the scope of their operation to wholesaling eggs brought in from Manitoba and offering grading services for eggs produced by local small-flock farmers.39
Many of the farms in the Thunder Bay District are dairy farms. Some of this milk is pasteurized by the two dairy plants located in Thunder Bay and is packaged in cartons and milk bags for sale in grocery stores within the District. Milk produced locally is also transported to plants in other parts of the province, as determined by the Dairy Farmers of Ontario. Nearly all of the dairy products other than milk that consumers enjoy are sourced from outside the District, mainly west from Winnipeg. For well over a decade, one dairy farm has been making cheese from the milk they produce on their farm for sale in the Thunder Bay market. In 2015 an additional farm began operations producing milk and yogurt bottled in glass jars.
Vegetable farming is experiencing an upswing in Thunder Bay, due to customer demand at the retail level. Vegetable farmers focus on hardier crops like root vegetables and tubers, onions, and cooking greens like kale and spinach. The current smaller-scale operations are able to sell most of their raw product at the farmers’ market or through other avenues like community supported agriculture. There are not a lot of big producers growing wholesale quantities of vegetables in this area.40

COMMUNITY FOOD SECURITY REPORT CARD 2015 31
A number of existing farms in the area have expanded to meet the growing demand for local food while others are undertaking value added activities on their farms. This is being driven by growing consumer interest in locally produced foods and local efforts to promote greater awareness and involvement in production activities aimed at the local market. Restaurants, caterers, grocery stores, and public sector institutions are also starting to source food from the area, increasing demand for all varieties of product. Related to this, there has been an expansion in artisanal and niche markets. Businesses have for years been making products such as jams and jellies, canned goods, and baked goods for sale at farmers’ markets and grocery stores. It is becoming more commonplace for these processors to use fruits, vegetables, grains, and other products grown in the area.
There are currently no measures of assessing growth in demand or supply, although the Get Fresh! Guide provides a sense of the number of retailers sourcing local food. According to the Get Fresh! Guide, nearly 20 restaurants and caterers are purchasing food from the Thunder Bay area.41 The amount of food bought varies considerably by business. Some caterers, for instance, use local foods in most of their caterings while others offer local only on request. The same is true with restaurants where some use local throughout all or much of the year, whereas others incorporate local on occasion, such as for a seasonal dish.
The number of farms reduced 5% from 252 in 2006 to 239 in 2011.42 The land used for farming decreased 4.5% from 61,850 in 2006 to 59,072 in 2011. Still, northwestern Ontario’s farms are on a growth path. The total farm capital market value increased 6.5% from $132,999,547 in 2006 to $140,723,410 in 2011.43 Total gross farm receipts also increased during the same 5 year period. This was also in an era of little support from government and policy makers for small farmers and agriculture in northern Ontario, and at a time when there were smaller markets for locally produced goods and where municipal, provincial, and federal regulatory frameworks were more restrictive for growers.
Anecdotal evidence suggests that in recent years, the trend of losing farms is reversing slightly. Newer farmers seem to be starting smaller scale operations. This is likely due in part to opportunities in market vegetable production (which requires less land) and the cost of farmland, which while considerably less than in southern Ontario, is some of the most expensive land in northern Ontario. Still, farmland in the Thunder Bay District is relatively affordable and many growers are able to purchase land to farm on. Between 2006 and 2011, for instance, the amount of self-owned farmland in the area increased by 3%.44 And although the amount of land being used to grow food in the District is considerably less than what it was 50 years ago, this means that land is available to expand the farming sector should demand for local foods continue to grow. It is also feasible to grow more food in urban areas, such as through urban farms, rooftop agriculture, and greenhouses.
There are significant opportunities for established farms to grow and meet demand for local food, as well as for new farms to start up and fill gaps in the market. Whether it be beef, eggs, vegetables, or dairy, farms in the District are only supplying a very small amount of the overall demand. It is possible that new kinds of farms—orchards growing cold hardy varieties of pears and apples, for instance—could come onto the scene. There are also opportunities to diversify farm operations, such as by adding on-farm processing, to generate additional farm income, create jobs, and expand the tax base for rural area.
In order for growth to continue, demand for local food will need to continue. There is also a need to address shortages of skilled labour and infrastructure gaps, foster further linkages and communication across the supply chain, and develop funding sources to support growth in production.
AREA OF FARMLAND OVER TIME
1996480 farm operators
2006375 farm operators
2001238 farm operators
NUMBER OF FARMERS OVER TIME
200661,850 acres
200159,383 acres
1961162,723 acres

THUNDER BAY AND AREAFOOD STRATEGY32
FOOD PRODUCTION HIGHLIGHTS
THUNDER BAY BEEKEEPERS ASSOCIATION
The Thunder Bay Beekeepers’ Association provides its members with a forum for sharing knowledge in beekeeping, and is dedicated to educating and promoting the benefi ts of beekeeping to the public. This past year they have been investigating techniques to reduce hive loss resulting from mite infestation, an issue which continues to present a problem for area beekeepers.
SUPERIOR SEED PRODUCERS
Superior Seed Producers is a collective of local Thunder Bay Area growers who promote the saving and distribution of locally adapted, sustainably grown, open-pollinated non-GMO seeds in northwestern Ontario, while educating and supporting those who want to learn more about saving seeds. In 2014 there were 4 producers and 172 packages of seeds sold. In 2015 the number of seed producers grew to 8 and 569 packages were sold.
THUNDER BAY AGRICULTURAL RESEARCH STATION
The Thunder Bay Agricultural Research Station has been a key research facility in the region for over 20 years, conducting research on food and feed varieties (e.g. chickpeas, soy beans, spring and winter cereals, forages, canola and fl ax seed) suitable for use in our unique climate and growing conditions.
GROWING POLICY SUPPORT
The policy environment has become increasingly supportive of the agri-food sector in recent years.
Changes in the Funding Landscape: A growing number of economic development organizations and granting bodies at the municipal, provincial, and federal levels of government are providing support to local food producers, processors, and collaborations.
New Chicken Farmers of Ontario (CFO) Programs (2015): In the summer of 2015 the CFO announced a suit of new programs aimed at encouraging new entrant farmers and processors to meet the demand for small-scale production and regional demand, especially in northern Ontario.
Thunder Bay Community Economic Development Commission (CEDC) Strategic Action Plan (2014): The CEDC released its new Strategic Action Plan 2014-2017: Transitioning to Growth. While many of the themes connected to areas of the economy this region is commonly known for—most notably manufacturing and mining—new on the scene is the CEDC’s commitment to supporting Regional Food and Local Agriculture.
Premier’s Agri-Food Growth Challenge (October 2014): Premier Wynne challenged the agri-food industry to double its annual growth rate and create 120,000 jobs by the year 2020.
Ontario Ministry of Agriculture Food and Rural Aff airs, Mandate Letter (September 2014): The letter from the Premier to the Minister instructed the Minister to “[Work] with other ministries and partners to explore opportunities to develop the agricultural sector in the North.”
Provincial Policy Statement (2014): The Provincial Policy Statement (PPS) is a province-wide policy developed by the Government of Ontario that directs how land can be used in the province. The PPS released in 2014 protects prime agricultural areas for long-term agriculture use and allows for more diversifi ed activities on the farm, such as larger-scale processing. In the Thunder Bay area, the municipalities of Oliver Paipoonge and Neebing have areas that meet the defi nition of prime agricultural areas.
Local Food Act (2013): On November 5, 2013, the Ontario Government passed the Local Food Act, which aims to foster local food economies in Ontario. The Act brought with it $30 million in funding over three years for local food projects.
Northern Ontario Growth Plan (2011): This 25 year plan, released in 2011, aims to strengthen the economy of the north. Agriculture, aquaculture, and food processing is one of the 11 sectors named under the Growth Plan.
PHOTO COURTESY OF TOURISM THUNDER BAYPHOTO COURTESY OF TOURISM THUNDER BAY
WALTER SCHEP, THUNDER OAK CHEESE FARM

COMMUNITY FOOD SECURITYREPORT CARD 2015 33
WHAT WE GROW:• Wheat
• Oats
• Barley
• Corn
• Alfalfa
• Canola
• Soybeans
• Potatoes
• Apples
• Pears
• Strawberries
• Raspberries
• Blueberries
• Sweet corn
• Tomatoes
• Cucumbers
• Green peas
• Green beans
• Cabbage
• Caulifl ower
• Broccoli
• Carrots
• Rutabagas
• Beets
• Lettuce
• Peppers
• Pumpkins
• Squash and zucchini
• Asparagus
• Garlic
• Onions
• Snap peas
• Turnips
• Herbs
• Kale
• Leeks

THUNDER BAY AND AREA FOOD STRATEGY34
WHAT ARE THE ISSUES AROUND SCHOOL FOOD ENVIRONMENTS IN THE THUNDER BAY AREA?Fruits, vegetables, and other foods are important for the healthy physical and mental development of children and youth. Yet an overwhelming number of young people—from preschool children to teenagers—are not eating enough nutritious foods needed for building strong bodies and minds. At the same time, consumption of foods high in salt, sugar, and fats is increasing. If nothing is done, the current generation of children will develop chronic illnesses much younger and be more affected as they age.1 Preventable chronic diseases also threaten the sustainability of our health care system. For example, in 2009, the estimated direct and indirect costs associated with obesity cost Ontario $4.5 billion.2 Since poor diets are a major contributing factor to the problem, creating healthier food environments and teaching children about better food options is one way for local governments and school boards to promote healthy eating that requires little investment.
Children and youth are over-represented among food insecure individuals in Canada.3 Despite efforts already being made to provide better access to food for families, some children continue to suffer from food insecurity and malnourishment. Although there are several good school nutrition programs operating in the country, Canada is the only G7 country without a national school nutrition program.
There is an enormous imperative for improving eating habits among children and youth since students who eat better perform better. Arriving to class on time and ready to learn positively impacts student success, and in turn, impacts the vitality and culture of our communities.4 Since food education reconnects individuals to how food is grown and produced, building healthy school food environments sets students on a path for becoming more active participants in decisions about the food system as consumers, parents, and decision-makers later in life.
Educational institutions are well-positioned in our communities to positively impact the health of our children. Many have land for gardens and kitchen facilities that can be used for preparing food. Schools have an ability to innovate and excel at involving parents and the broader community in activities. Children also spend a significant amount of time at school, which creates ample opportunity to impact student food literacy and skills to improve unhealthy eating trends.
SCHOOL FOOD ENVIRONMENTSGOAL: Improve the eating habits, food skills and food literacy of children and youth in Thunder Bay and Area through supportive healthy school food environments.

COMMUNITY FOOD SECURITY REPORT CARD 2015 35
SCHOOL FOOD ENVIRONMENTS INDICATORSALL INDICATORS RELATE TO DATA GATHERED IN THE THUNDER BAY CENSUS METROPOLITAN AREA.
Measures of Improving School Food Cultures and Access to Food
Indicator Measured Over
Number of schools with a food garden 5 24 2015
Number of schools with a pollinator garden 6 13 2015
Number of schools with a greenhouse 7 4 2015
Number of high schools with a farm to cafeteria program 8 4 2015
Number of farm to cafeteria events 9 42 2015
Number of schools with Student Nutrition Programs 10 52 2015
Estimated number of people volunteering for Student Nutrition Programs 11
156 2015
Number of food classes in schools 12 10 2015
Number of adult education cooking classes in schools 13 70 2015
Number of participants engaged through adult education cooking classes 14
2,800 2015
Number of schools participating in the Great Big Crunch 15 26 2015
27 24
38
13
47
4
34
Schools with food gardens
Schools without food gardens
Schools with greenhouses
Schools without greenhouses
Schools with pollinator gardens
Schools without pollinator gardens
High schools with farm to cafeteria programs
High schools without farm to cafeteria programs

THUNDER BAY AND AREAFOOD STRATEGY36
WHAT DO THESE INDICATORS TELL US?Local schools are already doing a lot to include healthy eating, food skills and local foods in their programs both in the classroom and in the food served. An increasing number of schools have taken the initiative to develop vegetable gardens, pollinator friendly gardens, and greenhouses to complement their classroom teaching. Many of these initiatives are now supported by school board policies. Student nutrition programs are sourcing some local foods and some fundraisers are centered on local food items. Students are taking the lead in their schools to promote better eating habits and attempting to create healthier food environments. These initiatives can be built upon to ensure system-wide support for healthy school food environments.
Several organizations are working to improve access to fresh food in schools or are off ering programming aimed at teaching food skills like growing, cooking, and preserving. A number of schools are host sites for the Good Food Box, which is coordinated by the Northwestern Ontario Women’s Center. Others run Student Nutrition Programs with some support from the Canadian Red Cross. The Thunder Bay District Health Unit, Roots to Harvest, Shkoday Abinojiiwak Obimiwedoon, the Multicultural Youth Centre, Our Kids Count, Evergreen a United Neighbourhood, Dilico Anishinabek Family Care, and Indian Friendship Centre provide a range of food centric programming for children and youth both in and out of school.
While there have been considerable gains made in some areas, there is still work to be done. Students spend much of their day at school. Schools are therefore the perfect place to form good habits around food. However, the present school culture around food often is in confl ict with healthy eating curriculum and use of local food. For instance cafeterias rarely cook with fresh ingredients, school fundraisers often use sugary and processed foods (such as pizza day and chocolate) and there are few systemic supports for school gardens. As a result, eff orts to help students learn about eating with the seasons, planning a healthy menu, cooking from scratch, and growing or preserving food are inconsistent.
The Thunder Bay and Area Food Strategy makes a number of recommendations that would go a long way in changing school food cultures, such as hiring a school garden coordinator and off ering food curriculum training for teachers. Schools would also benefi t from better coordination between organizations that provide programming in schools aimed at increasing access to healthy food and teaching food skills.
PHOTO COURTESY OF KRIS DONTAS
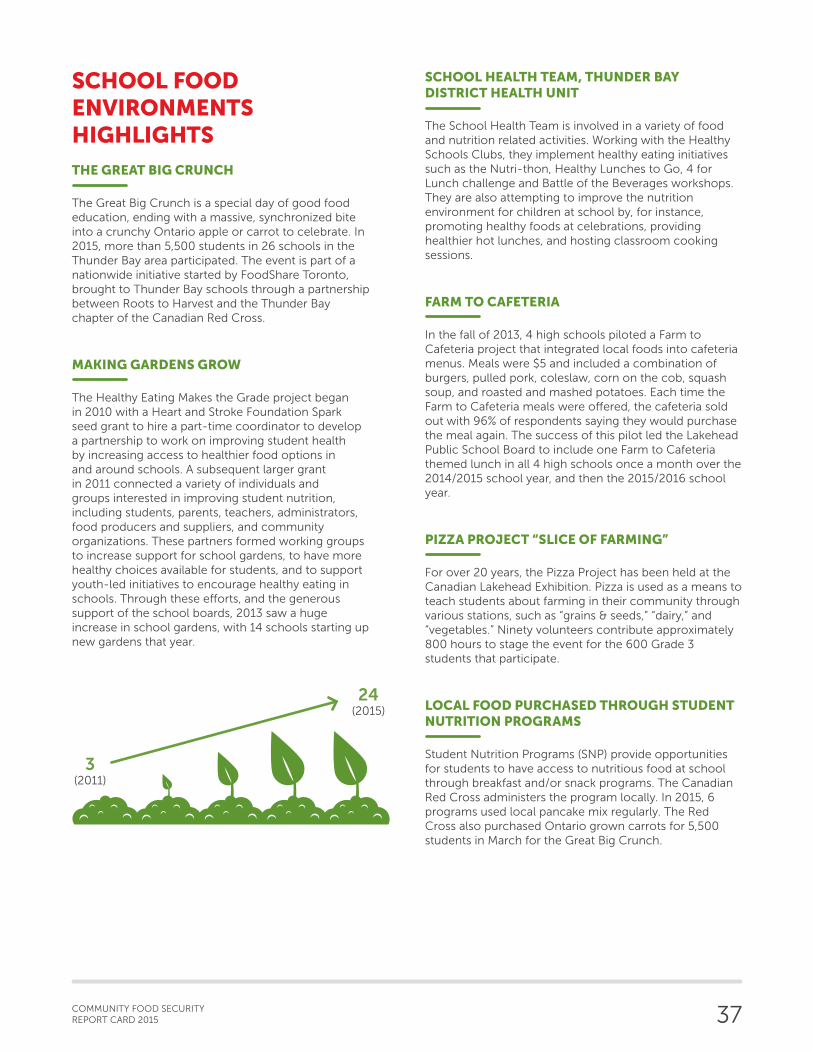
COMMUNITY FOOD SECURITY REPORT CARD 2015 37
SCHOOL FOOD ENVIRONMENTS HIGHLIGHTS
THE GREAT BIG CRUNCH
The Great Big Crunch is a special day of good food education, ending with a massive, synchronized bite into a crunchy Ontario apple or carrot to celebrate. In 2015, more than 5,500 students in 26 schools in the Thunder Bay area participated. The event is part of a nationwide initiative started by FoodShare Toronto, brought to Thunder Bay schools through a partnership between Roots to Harvest and the Thunder Bay chapter of the Canadian Red Cross.
MAKING GARDENS GROW
The Healthy Eating Makes the Grade project began in 2010 with a Heart and Stroke Foundation Spark seed grant to hire a part-time coordinator to develop a partnership to work on improving student health by increasing access to healthier food options in and around schools. A subsequent larger grant in 2011 connected a variety of individuals and groups interested in improving student nutrition, including students, parents, teachers, administrators, food producers and suppliers, and community organizations. These partners formed working groups to increase support for school gardens, to have more healthy choices available for students, and to support youth-led initiatives to encourage healthy eating in schools. Through these efforts, and the generous support of the school boards, 2013 saw a huge increase in school gardens, with 14 schools starting up new gardens that year.
SCHOOL HEALTH TEAM, THUNDER BAY DISTRICT HEALTH UNIT
The School Health Team is involved in a variety of food and nutrition related activities. Working with the Healthy Schools Clubs, they implement healthy eating initiatives such as the Nutri-thon, Healthy Lunches to Go, 4 for Lunch challenge and Battle of the Beverages workshops. They are also attempting to improve the nutrition environment for children at school by, for instance, promoting healthy foods at celebrations, providing healthier hot lunches, and hosting classroom cooking sessions.
FARM TO CAFETERIA
In the fall of 2013, 4 high schools piloted a Farm to Cafeteria project that integrated local foods into cafeteria menus. Meals were $5 and included a combination of burgers, pulled pork, coleslaw, corn on the cob, squash soup, and roasted and mashed potatoes. Each time the Farm to Cafeteria meals were offered, the cafeteria sold out with 96% of respondents saying they would purchase the meal again. The success of this pilot led the Lakehead Public School Board to include one Farm to Cafeteria themed lunch in all 4 high schools once a month over the 2014/2015 school year, and then the 2015/2016 school year.
PIZZA PROJECT “SLICE OF FARMING”
For over 20 years, the Pizza Project has been held at the Canadian Lakehead Exhibition. Pizza is used as a means to teach students about farming in their community through various stations, such as “grains & seeds,” “dairy,” and “vegetables.” Ninety volunteers contribute approximately 800 hours to stage the event for the 600 Grade 3 students that participate.
LOCAL FOOD PURCHASED THROUGH STUDENT NUTRITION PROGRAMS
Student Nutrition Programs (SNP) provide opportunities for students to have access to nutritious food at school through breakfast and/or snack programs. The Canadian Red Cross administers the program locally. In 2015, 6 programs used local pancake mix regularly. The Red Cross also purchased Ontario grown carrots for 5,500 students in March for the Great Big Crunch.
3(2011)
24(2015)

THUNDER BAY AND AREA FOOD STRATEGY38
URBAN AGRICULTUREGOAL: Increase food production in the urban landscape and support the participation of citizens in urban agriculture activities.
WHAT ARE THE ISSUES AROUND URBAN AGRICULTURE IN THE THUNDER BAY AREA?The majority of our food grows on farms in rural areas, yet food production can be a thriving part of urban environments as well. Historically, gardens were a prominent feature within cities, with many people relying on gardens to grow some of their own food. Changing urban culture and farming practices over the past 50 years has made growing food in the city, and especially raising small livestock, less common.
In recent years, the re-emergence of urban agriculture has taken the world by storm. An increasing number of people are looking for ways to produce more of the food they eat in an effort to be more economical and health conscious, and to foster a deeper connection to food and to nature.
Not-for profit organizations, schools, hospitals, and others have also caught the urban agriculture bug and are using food for such far ranging purposes as youth engagement and education, to creating therapeutic spaces for patients, to seizing niche business opportunities in urban centres.
The resurgence of urban agriculture has pushed the boundaries of possibility both in terms of where and how food is grown. Gardens now exist on rooftops and herbs are being grown in hydroponics operations at airports. Beekeepers are starting apiaries in backyards and aquaponics operations are getting their start in warehouses. Greenhouses are being built as vertical structures and on industrial sites, and urban farms are being cultivated on university grounds. Pollinator gardens are popping up like never before, and forest foods are being planted in parks.
The benefits of urban agriculture are impressive. Integrating agriculture into the urban realm builds a lively and healthy urban landscape while fostering an understanding of where food comes from. It creates more opportunities for residents to access healthy, affordable food, while providing opportunities for community members to share knowledge about the relationship between nutrition and health. Creating vibrant green space contributes to the mental health and general well-being of urban residents, and activities such as planting and harvesting can provide an important form of regular exercise.
Urban agriculture is a way to engage local residents in the stewardship of their neighborhood’s green spaces and their urban environment more broadly. Expanding urban spaces for food production can be used as a tool for turning underutilized spaces into productive ones, and deteriorating lots into interesting community spaces. Physical improvements to the environment improve community safety, decreasing the need for policing and municipal maintenance of blighted properties.
Growing food close to home contributes to a sustainable city. Not only does it shorten the distance that food travels but it can be leveraged for waste water management, soil remediation, and to improve biodiversity and pollinator habitats. People who grow food are more likely to see food as a resource and divert food waste from landfills to composting. Urban agriculture builds climate resiliency by reducing individual reliance on imported foods. And according to an increasing number of urban planners, bringing nature back into cities is essential to fostering sustainable urban ecosystems.

COMMUNITY FOOD SECURITY REPORT CARD 2015 39
URBAN AGRICULTURE INDICATORSALL INDICATORS RELATE TO DATA GATHERED IN THE THUNDER BAY CENSUS METROPOLITAN AREA.
Measures of Urban Agriculture Indicator Measured Over
Number of community gardens 1 25 2015
Number of school food gardens 2 24 2015
Number of food forests 3 1 2015
Number of pollinator gardens on city land within Thunder Bay 4
6 2015
Number of schools with a pollinator garden 5 13 2015
Number of pollinator plants sold through EcoSuperior’s annual plant sale 6
800 2015
Number of edible bus stops 7 1 2015
Number of homeowners volunteering their fruit trees for urban gleaning programs 8
20 2015
Number of seed packages sold by the Superior Seed Producers 9
569 2015
Number of people producing seeds for sale through the Superior Seed Producers 10
8 2015
Measures of Urban Agriculture Education Indicator Measured Over
Number of organizations engaged in urban agriculture as a way to build community 11
19 2015
Number of municipalities/townships engaged in urban agriculture 12
3 2015
WHAT DO THESE INDICATORS TELL US?Urban agriculture has been on the rise in recent years within the Thunder Bay area. The number of community gardens has more than tripled since 2008 and have increasingly been created for different purposes. The most common type of community gardens are located in neighbourhoods across the city and are organized as individual plots that residents can use to grow food for themselves for the growing season. Both Confederation College and Lakehead University have large individual plot-style community gardens to give students, faculty and community members an opportunity to grow food. A number of organizations in the city have also started gardens as a way to build community, grow fresh food for use in programming, and as a source of healthy food for low income residents. Institutions such as the Thunder Bay Regional Hospital are now using gardens as a way to enrich patient experiences, while workplaces such as the Ontario Ministry of Environment and Thunder Bay District Health Unit have planted gardens as a means to engage staff and grow produce for use in programs.
More and more people are showing an interest in local action that will increase both personal and overall community food security. Engagement in community gardens is one component of this. Growing awareness about losses in pollinator populations—particularly bees and butterflies—seems to be driving people in urban areas to plant species that provide food for pollinators (pollinator friendly plants) such as in community gardens, backyard gardens, or dedicated pollinator gardens. There has also been a surge in the number of people purchasing locally produced seeds. According to Superior Seed Producers, people want to buy seeds that are adapted to our climate and because they believe that local production and control of our seed supply is an important condition of community food security.

THUNDER BAY AND AREAFOOD STRATEGY40
Individuals and organizations are pushing boundaries within urban areas in terms of how and where food can be grown. The Court Street Edible Food Forest and EcoSuperior’s Edible Bus Stop are two recent examples of how access to fresh food can be improved by growing food in small underutilized areas. Both are also examples of novel partnerships between community organizations and the city to create projects that beautify areas and provide a service. This move towards using underutilized space is also occurring at the home level, as residents are starting to grow food on front yards and even boulevards. Anecdotal evidence suggests a growing interest in raising small numbers of livestock (particularly hens for egg production) and bees in urban areas. Historically, raising food in urban places was very common but over the past fi fty years most forms of agriculture have been pushed out to rural areas. In recent years, this trend appears to be slowly reversing.
There is potential to raise a lot more food in urban areas. Production on urban lots, park spaces, and institutional grounds is nowhere near capacity. There are currently no known rooftop gardens or urban farms. To date, support for urban agriculture has been off ered in an ad hoc way. Policy that is supportive of urban agriculture, dedicated staff time, an urban agriculture coordinator, demonstration projects, workshops and other educational tools would go a long way in expanding awareness and participation in urban agriculture. A variety of initiatives are needed to involve more individuals, families, organizations and businesses in this movement towards bringing food production back into urban areas.
URBAN AGRICULTURE HIGHLIGHTS:
REGIONAL HOSPITAL GARDEN
In 2015, the Thunder Bay Regional Hospital's Prevention and Screening Services and Mental Health Programs departments combined their eff orts to grow a garden. The project was a big success and the garden fl ourished - so much so, that the units started having salad days, and were making kale chips as well as many other things. A great fi rst year!
EDIBLE BUS STOP
Transit riders at one Red River Road bus stop are now able to snack healthy over the summer—on crunchy pea pods, mini cucumbers and ripe tomatoes. The veggies grew in a mini garden next to the bus shelter, planted and cared for by EcoSuperior staff , with Food Strategy support and signage from Thunder Bay Transit. The edible bus stop promoted friendly, enjoyable public transit, as well as locally grown food and healthier snacks. Food gardens in unexpected places show people how easy it is to grow vegetables, and caring for the gardens helps build a sense of community.
ECOSUPERIOR PLANT SALE
Each year EcoSuperior holds a plant sale with species for sale that are a good food source for pollinators. In 2014, EcoSuperior sold 525 pollinator plants and in 2015 sold 800, representing a 35% increase!
525 sold in 2014 800 sold in 2015
PHOTO COURTESY OF TOURISM THUNDER BAY

COMMUNITY FOOD SECURITYREPORT CARD 2015 41
6
25
URBAN FRUIT GLEANING
Bay City Cider is a social enterprise initiative of Roots to Harvest that began in 2014. Young people harvest apples from local trees, make cider, and sell at local pop up markets around the city. Through this project, Roots to Harvest employs young people and engages volunteers to pick apples that would otherwise go to waste and produce a unique product that is not widely available in our region.
WILLOW SPRINGS CREATIVE CENTRE
Willow Springs Creative Centre (WSCC) is an innovative, social purpose enterprise serving Thunder Bay and the surrounding region. WSCC provides training in gardening and food service for young adult with disabilities. WSCC also partners with organizations and institutions to provide urban gardening programs for the elderly and individuals with disabilities. At each location, WSCC incorporates native plant species and plants that attract pollinators.
COMMUNITY GARDEN COLLECTIVE
The Community Garden Collective is a network of community garden leaders that formed in 2009 to collaborate with the City of Thunder Bay, community members, groups and businesses to increase food skills, food security, and community engagement through community gardens. It supports community gardens by coordinating resources, sharing information and experiences, promoting existing gardens, and facilitating the development of new gardens. The Collective’s vision is for all citizens to have access to supports and resources that will enable them to grow, prepare and preserve their own food and get involved in their community. The City of Thunder Bay Parks Division supports gardens through a Community Garden Policy that was developed in 2009, following the adoption of the Food Charter and the EarthCare Plan, to support community gardens on city property with a water supply, and annual manure and rototilling.
LOCAL BUSINESSES SUPPORT COMMUNITY GROWING
In 2014, Eat Local Pizza connected with Evergreen A United Neighbourhood to support them in engaging with the community to grow and learn to cook with healthy food. Together, they put in a pizza garden at Sundial Park to grow healthy food for the neighbourhood. The following year, Eat Local Pizza developed a second garden at Dease Park. Evergreen stewards the gardens and involves the neighbourhoods in growing and distributing the food.
BACKYARD HEN POLICY
More and more Canadian cities are changing their bylaws to let people keep small numbers of chickens in their backyards. In 2013, Gillies Township began reviewing its Offi cial Plan. Offi cial Plans dictate how land in a municipality or township can be used. It came to light that many residents in Hymers (a village in Gillies) were in favour of a change to the bylaw restricting all livestock within the village zone. Council changed the bylaw and residents in Hymers are now able to keep small numbers of chickens, sheep and goats.
There were 6 community gardens in 2008 and 25 in 2015.PHOTO COURTESY OF BRAD DOFF

THUNDER BAY AND AREA FOOD STRATEGY42
BEES IN THE CITY
As urban agriculture starts to grow within the city, it’s becoming more common for organizations, individuals and businesses to keep bees. The Thunder Bay Conservatory has a working relationship with a local honeybee farmer, who set up and maintains 8 large hives on the Conservatory’s grounds. The hives are very active and have a honey bee population of several hundred thousand. Roots to Harvest also keeps bees at their garden (located at the corner of Cornwall and Algoma). The hives are used to pollinate the garden and to teach others about how to keep bees. Each year the honey is harvested so it can help raise money for the organization’s programs.
COURT STREET EDIBLE FOOD FOREST
The Court Street Edible Fruit Forest—located at the corner of Court Street and Bay Street—transformed an existing underused park into a vibrant, beautiful, edible greenspace with trees and other fruiting plants including apples, plums, and many berry bushes. General site maintenance is provided by Roots to Harvest with some support from City of Thunder Bay Parks Division. This site is a meeting place for groups, an outdoor classroom for school trips, a location for integrated Roots to Harvest school programs, a place for families to enjoy and learn, and a relaxing place for individuals to visit.
ONTARIO MINISTRY OF ENVIRONMENT GARDEN
There are about 10 people involved in the garden that weed, water and harvest food together one day a week. For many who work at the Ministry, the garden is a workplace health initiative, as many employees choose to spend time at the garden during their lunch and coffee breaks, and away from their desks and computer screens. Food is harvested throughout the season and delivered to the Regional Food Distribution Association for use in their soups and sandwiches, or is delivered to other meal programs in the city. Some support for the garden is provided by the Ontario Realty Corporation (who owns the property), who bought the lumber for the beds and moved the garden when a new parking lot was put in. There is also a partnership with the Thunder Bay Correctional Centre who starts the seedlings that are sold in the Ministry building to raise money for seeds, sod, and tools.
ORGANIZATIONS ENGAGED IN URBAN AGRICULTURE AS A WAY TO BUILD COMMUNITY:
• March of Dimes
• Township of Shuniah
• Roots to Harvest
• Thunder Bay District Health Unit
• EcoSuperior Environmental Programs
• Thunder Bay Horticulture Society
• Thunder Bay District Master Gardeners
• Willow Springs Creative Centre
• Food Security Research Network
• Township of Gillies
• Windsor Picton neighboughood
• Vale Community Council/Limbrick
• Ontario Ministry of the Environment
• Salvation Army (Field of Greens)
• Regional Food Distribution Association
• Little Lions Waldorf Daycare
• Thunder Bay Regional Health Sciences Centre
• Thunder Bay Counselling Centre
• Monty Parks Centre
• Anishnawbe Mushkiki Aboriginal Health
• City of Thunder Bay
• Thunder Bay Catholic District School Board
• Lakehead Public Schools

Thank you to all those who provided guidance and assistance
in developing this Report Card.

REFERENCES1. Agriculture and Agri-Food Canada. (2013). An overview of the Canadian agriculture and agri-food system 2013.
FOOD ACCESS
1. Health Canada, Office of Nutrition Policy and Promotion, Health Products and Food Branch. (2004). Income-Related Household Food Security in Canada.
2. Tarasuk, V., Mitchell, A., & Dachner, N. (2013). Household Food Insecurity in Canada 2011.3. Schwartz-Mendez, C., (2014). Thunder Bay District Health Unit. Personal Communication, April 29, 2014.4. Tarasuk, V., Mitchell, A., & Dachner, N. (2013). Household food insecurity in Canada 2011.5. Lakehead Social Planning Council. (2013). Building a Better Thunder Bay for All: A Community Action Strategy to Reduce Poverty, page 5.6. Lakehead Social Planning Council. (2013). Building a Better Thunder Bay for All: A Community Action Strategy to Reduce Poverty, page 5.7. Thunder Bay District Social Services Administration Board. (2014). Thunder Bay and District Poverty Reduction Strategy: Annual Report 2014. 8. Thunder Bay Community Economic Development Commission. (2015). Labour Force Characteristics.9. Social Planning Council of Sudbury. (2015). Northern Region Transformation Project Needs Assessment, funded by Legal Aid Ontario.
Personal Communication via Kinna Aweya Legal Clinic.10. The District of Thunder Bay Social Services Administration Board. (2015). TBDSSAB 2015 Quarterly Operational Report, 2nd Quarter.11. The District of Thunder Bay Social Services Administration Board. (2015). TBDSSAB 2015 Quarterly Operational Report, 2nd Quarter.12. Lovato-Day, K. (2016). Thunder Bay District Social Services Administration Board. Personal Communication.13. Lakehead Social Planning Council. (2013). Building a Better Thunder Bay for All: A Community Action Strategy to Reduce Poverty, page 15.14. Lakehead Social Planning Council. (2013). Building a Better Thunder Bay for All: A Community Action Strategy to Reduce Poverty. 15. Canadian Community Health Survey, 2013-2014, Statistics Canada, Ontario share files, Ontario Ministry of Health and Long-Term Care. 16. Statistics Canada. Table 105-0502-Health indicator profile, two year period estimates, by age group and sex, Canada, provinces, territories,
health regions (2013 boundary) and peer group, occasional CANSIM (database) (accessed Feb 2, 2016).17. Statistics Canada. Table 105-0502-Health indicator profile, two year period estimates, by age group and sex, Canada, provinces, territories,
health regions (2013 boundary) and peer group, occasional CANSIM (database) (accessed Feb 2, 2016). 18. Statistics Canada. Table 105-0502-Health indicator profile, two year period estimates, by age group and sex, Canada, provinces, territories,
health regions (2013 boundary) and peer group, occasional CANSIM (database) (accessed Feb 2, 2016). 19. Statistics Canada. (2011). Canadian Community Health Survey. 20. Hendel, J., (2015). Thunder Bay Transit. Personal Communication.21. Hendel, J., (2015). Thunder Bay Transit. Personal Communication.22. Thunder Bay District Health Unit. (2015). Cost of Eating Report 2015.23. Carlin, B., (2015). Regional Food Distribution Association. Personal Communication.24. Carlin, B., (2015). Regional Food Distribution Association. Personal Communication.25. Carlin, B., (2015). Regional Food Distribution Association. Personal Communication.26. Carlin, B., (2015). Regional Food Distribution Association. Personal Communication.27. Thunder Bay District Health Unit. (2015). Hungry for Change in the Thunder Bay District.28. Thunder Bay District Health Unit. (2015). Hungry for Change in the Thunder Bay District.29. O’Reilly, G., (2015). Northwestern Ontario Women’s Center. Personal Communication.30. O’Reilly, G., (2015). Northwestern Ontario Women’s Center. Personal Communication.31. McKay, E., (2015). Canadian Red Cross, Thunder Bay. Personal Communication.32. Schwartz-Mendez, C., (2015). Thunder Bay District Health Unit. Personal Communication.33. Schwartz-Mendez, C., (2015). Thunder Bay District Health Unit. Personal Communication.34. Schwartz-Mendez, C., (2015). Thunder Bay District Health Unit. Personal Communication.35. Mitchell, J., (2015). Roots to Harvest. Personal Communication.36. Mitchell, J., (2015). Roots to Harvest. Personal Communication.37. Schwartz-Mendez C., (2015). Thunder Bay District Health Unit. Personal Communication.38. Schwartz-Mendez C., (2015). Thunder Bay District Health Unit. Personal Communication.39. Shkoday Abinojiiwak Obimiwedoon Aboriginal Head Start. (2014). Personal Communication.40. Lakehead Social Planning Council. (2013). Building a Better Thunder Bay for All: A Community Action Strategy to Reduce Poverty, page 5.41. Lakehead Social Planning Council. (2013). Building a Better Thunder Bay for All: A Community Action Strategy to Reduce Poverty, page 5.42. Campaign 2000. (2014). 2014 Report Card on Child and Family Poverty in Ontario.43. Thunder Bay District Health Unit. (2015). The Cost of Eating Well in the District of Thunder Bay 2015.44. Tarasuk, V., Cheng, J., de Oliveira, C., Dachner, N., Gundersen, C., & Kurdyak, P. (2015). Association between household food insecurity and
annual health care costs. CMAJ : Canadian Medical Association Journal, 187(14), E429–E436.45. Tarasuk, V., Cheng, J., de Oliveira, C., Dachner, N., Gundersen, C., & Kurdyak, P. (2015). Association between household food insecurity and
annual health care costs. CMAJ : Canadian Medical Association Journal, 187(14), E429–E436.
FOREST & FRESHWATER FOODS
1. Stolz, W., (2015). Ontario Nature. Personal Communication, November 7, 2015.2. Stolz, W., (2015). Ontario Nature. Personal Communication, November 7, 2015.3. Thunder Bay and Area Food Strategy. (2015). Community Food Security Database.4. Lakehead Region Conservation Authority. (2015). Website, Accessed December 12, 2015. 5. Lakehead Region Conservation Authority. (2015). Website, Accessed December 12, 2015.6. Lakehead Region Conservation Authority. (2015). Website, Accessed December 12, 2015.7. Lakehead Region Conservation Authority. (2015). Website, Accessed December 12, 2015.8. Stolz, W., (2015). Ontario Nature. Personal Communication, November 7, 2015.9. Thunder Bay and Area Food Strategy. (2015). Community Food Security Database.10. TB News Watch. (2014). Limited Moose Tags. Online news story posted April 17, 2014.11. Deschamps, M., (2016). Ministry of Natural Resources and Forestry. Personal Communication, January 28, 2016. 12. Deschamps, M., (2016). Ministry of Natural Resources and Forestry. Personal Communication, January 28, 2016. 13. Deschamps, M., (2016). Ministry of Natural Resources and Forestry. Personal Communication, January 28, 2016.14. Chiodo, T., (2016). Ministry of Natural Resources and Forestry. Personal Communication, January 20, 2016. 15. Chiodo, T., (2016). Ministry of Natural Resources and Forestry. Personal Communication, January 20, 2016. 16. TB News Watch. (2014). Limited Moose Tags. Online news story posted April 17, 2014.17. Chiodo, T., (2016). Ministry of Natural Resources and Forestry. Personal Communication, January 20, 2016.

FOOD INFRASTRUCTURE
1. Food Security Research Network and Faculty of Natural Resources Management, Lakehead University. (2013). The Workforce Multiplier Effect of Local Farms and Food Processors in Northwestern Ontario. Funded by the North Superior Workforce Planning Board and the Northwest Training and Adjustment Board.
2. McGuinty, D., (2012). Shifting to Local Food will Create 10,000 Ontario Jobs.3. Food Security Research Network and Faculty of Natural Resources Management, Lakehead University. (2013). The Workforce Multiplier Effect
of Local Farms and Food Processors in Northwestern Ontario. Funded by the North Superior Workforce Planning Board and the Northwest Training and Adjustment Board.
4. Thunder Bay and Area Food Strategy. (2015). Community Food Security Database.5. Thunder Bay and Area Food Strategy. (2015). Community Food Security Database.6. Thunder Bay and Area Food Strategy. (2015). Community Food Security Database.7. Thunder Bay and Area Food Strategy. (2015). Community Food Security Database.8. Thunder Bay and Area Food Strategy. (2015). Community Food Security Database.9. Thunder Bay and Area Food Strategy. (2015). Community Food Security Database.10. Thunder Bay and Area Food Strategy. (2015). Community Food Security Database.11. Thunder Bay and Area Food Strategy. (2015). Community Food Security Database.12. Ontario Ministry of Agriculture, Food and Rural Affairs. (2015). Provincially Licensed Meat Plants, website last updated on November 9, 2015.13. Thunder Bay and Area Food Strategy. (2015). Community Food Security Database.14. Thunder Bay and Area Food Strategy. (2015). Community Food Security Database.15. Thunder Bay and Area Food Strategy. (2015). Community Food Security Database.16. Thunder Bay and Area Food Strategy. (2015). Community Food Security Database.17. Thunder Bay and Area Food Strategy. (2015). Community Food Security Database.18. Agriculture Development Advisory. (2015). Ontario Ministry of Agriculture, Food and Rural Affairs. Personal Communication.19. Thunder Bay and Area Food Strategy. (2015). Community Food Security Database.20. Ontario Ministry of Agriculture, Food and Rural Affairs. (2015). Analyst software. Data parameters included in the Thunder Bay and Area Food
Strategy. (2015). Community Food Security Database.21. Thunder Bay and Area Food Strategy. (2015). Community Food Security Database.22. Thunder Bay and Area Food Strategy. (2015). Community Food Security Database.23. Mitchell, J., (2015). Roots to Harvest. Personal Communication.24. Mitchell, J., (2015). Roots to Harvest. Personal Communication.25. Mortfield, E., (2015). EcoSuperior Environmental Programs. Personal Communication, January 26, 2016.26. Thunder Bay and Area Food Strategy. (2015). Community Food Security Database.27. Moir, E., (2015). EcoSuperior Environmental Programs. Personal Communication.28. Moir, E., (2015). EcoSuperior Environmental Programs. Personal Communication.29. Moir, E., (2015). EcoSuperior Environmental Programs. Personal Communication.30. Food Security Research Network and Faculty of Natural Resources Management, Lakehead University. (2013). The Workforce Multiplier Effect
of Local Farms and Food Processors in Northwestern Ontario. Funded by the North Superior Workforce Planning Board and the Northwest Training and Adjustment Board.
31. Food Security Research Network and Faculty of Natural Resources Management, Lakehead University. (2013). The Workforce Multiplier Effect of Local Farms and Food Processors in Northwestern Ontario. Funded by the North Superior Workforce Planning Board and the Northwest Training and Adjustment Board.
32. Roy, R., (2014). Appendix E: Growth Opportunities in Thunder Bay’s Food Infrastructure, Research Report. Prepared by Beanstalk Consulting as part of the City of Thunder Bay and Food Action Network Broader Public Sector Education Strategy Implementation Project, Summary Report.
33. Roy, R., (2014). Appendix E: Growth Opportunities in Thunder Bay’s Food Infrastructure, Research Report. Prepared by Beanstalk Consulting as part of the City of Thunder Bay and Food Action Network Broader Public Sector Education Strategy Implementation Project, Summary Report.
34. Roy, R., (2014). Appendix E: Growth Opportunities in Thunder Bay’s Food Infrastructure, Research Report. Prepared by Beanstalk Consulting as part of the City of Thunder Bay and Food Action Network Broader Public Sector Education Strategy Implementation Project, Summary Report.
35. Value Chain Management International. (2014). Cut Waste, Grow Profit.
PROCUREMENT
1. Wylie-Toal, B., et al. (2013). Local Food Provision in Ontario’s Hospitals and Long-Term Care Facilities.2. Bevilaqua, C., (2014). City of Thunder Bay Supply Management, Personal Communication, March 14, 2014.3. Thunder Bay and Area Food Strategy. (2015). Community Food Security Database.4. Thunder Bay and Area Food Strategy. (2015). Community Food Security Database.5. Thunder Bay and Area Food Strategy. (2015). Community Food Security Database. 6. Thunder Bay and Area Food Strategy. (2015). Community Food Security Database.7. Mitchell, J., (2015). Roots to Harvest. Personal Communication.8. Mitchell, J., (2015). Roots to Harvest. Personal Communication.9. Beagle, E., (2015). Roots to Harvest. Personal Communication.10. Roy, R., (2014). Appendix E: Growth Opportunities in Thunder Bay’s Food Infrastructure, Research Report. Prepared by Beanstalk Consulting
as part of the City of Thunder Bay and Food Action Network Broader Public Sector Education Strategy Implementation Project, Summary Report.
11. Roy, R., (2014). Appendix E: Growth Opportunities in Thunder Bay’s Food Infrastructure, Research Report. Prepared by Beanstalk Consulting as part of the City of Thunder Bay and Food Action Network Broader Public Sector Education Strategy Implementation Project, Summary Report.
PRODUCTION
1. Agriculture and Agri-Food Canada. (2013). An Overview Of The Canadian Agriculture And Agri-Food System 2012.2. C. Schwartz-Mendez, Thunder Bay District Health Unit, February 18, 2014, Personal Communication.3. Consultative Group on International Agricultural Research. (2013). Food Emissions Fact Sheet.4. Miller, S. (2013). Places to farm.5. Harry Cummings and Associates Inc. (2009). Thunder Bay District Agricultural Economic Impact Study.6. Statistics Canada. (2014). Demographic Changes In Canadian Agriculture.7. Harry Cummings and Associates Inc. (2009). Thunder Bay District Agricultural Economic Impact Study.8. Baker, L., Campsie, P., & Rabionwicz, K. (2010). Menu 2020: Ten Good Food Ideas For Ontario. Prepared for the Metcalf Foundation.9. Food Security Research Network and Faculty of Natural Resources Management, Lakehead University. (2013). The Workforce Multiplier Effect
of Local Farms and Food Processors in Northwestern Ontario. Funded by the North Superior Workforce Planning Board and the Northwest Training and Adjustment Board. Page 53.
10. Food Security Research Network and Faculty of Natural Resources Management, Lakehead University. (2013). The Workforce Multiplier Effect of Local Farms and Food Processors in Northwestern Ontario. Funded by the North Superior Workforce Planning Board and the Northwest Training and Adjustment Board. Page 53.
11. Food Security Research Network and Faculty of Natural Resources Management, Lakehead University. (2013). The Workforce Multiplier Effect of Local Farms and Food Processors in Northwestern Ontario. Funded by the North Superior Workforce Planning Board and the Northwest Training and Adjustment Board. Page 53.
12. Food Security Research Network and Faculty of Natural Resources Management, Lakehead University. (2013). The Workforce Multiplier Effect of Local Farms and Food Processors in Northwestern Ontario. Funded by the North Superior Workforce Planning Board and the Northwest Training and Adjustment Board. Page 53.
13. Food Security Research Network and Faculty of Natural Resources Management, Lakehead University. (2013). The Workforce Multiplier Effect of Local Farms and Food Processors in Northwestern Ontario. Funded by the North Superior Workforce Planning Board and the Northwest Training and Adjustment Board. Page 53.
14. Food Security Research Network and Faculty of Natural Resources Management, Lakehead University. (2013). The Workforce Multiplier Effect of Local Farms and Food Processors in Northwestern Ontario. Funded by the North Superior Workforce Planning Board and the Northwest Training and Adjustment Board. Page 53.
15. Agriculture Development Advisory. (2015). Ontario Ministry of Agriculture, Food and Rural Affairs. Personal Communication.16. Agriculture Development Advisory. (2015). Ontario Ministry of Agriculture, Food and Rural Affairs. Personal Communication.17. Food Security Research Network and Faculty of Natural Resources Management, Lakehead University. (2013). The Workforce Multiplier Effect
of Local Farms and Food Processors in Northwestern Ontario. Funded by the North Superior Workforce Planning Board and the Northwest Training and Adjustment Board. Page 26.
18. Food Security Research Network and Faculty of Natural Resources Management, Lakehead University. (2013). The Workforce Multiplier Effect of Local Farms and Food Processors in Northwestern Ontario. Funded by the North Superior Workforce Planning Board and the Northwest Training and Adjustment Board. Page 26
19. Food Security Research Network and Faculty of Natural Resources Management, Lakehead University. (2013). The Workforce Multiplier Effect of Local Farms and Food Processors in Northwestern Ontario. Funded by the North Superior Workforce Planning Board and the Northwest Training and Adjustment Board. Page 49.
20. Ontario Ministry of Agriculture, Food and Rural Affairs. (2015). Analyst software. Data parameters included in the Thunder Bay and Area Food Strategy. (2015). Community Food Security Database.
21. Food Security Research Network and Faculty of Natural Resources Management, Lakehead University. (2013). The Workforce Multiplier Effect of Local Farms and Food Processors in Northwestern Ontario. Funded by the North Superior Workforce Planning Board and the Northwest Training and Adjustment Board. Page 27.
22. Food Security Research Network and Faculty of Natural Resources Management, Lakehead University. (2013). The Workforce Multiplier Effect of Local Farms and Food Processors in Northwestern Ontario. Funded by the North Superior Workforce Planning Board and the Northwest Training and Adjustment Board. Page 27.
23. Food Security Research Network and Faculty of Natural Resources Management, Lakehead University. (2013). The Workforce Multiplier Effect of Local Farms and Food Processors in Northwestern Ontario. Funded by the North Superior Workforce Planning Board and the Northwest Training and Adjustment Board. Page 29.
24. Food Security Research Network and Faculty of Natural Resources Management, Lakehead University. (2013). The Workforce Multiplier Effect of Local Farms and Food Processors in Northwestern Ontario. Funded by the North Superior Workforce Planning Board and the Northwest Training and Adjustment Board. Page 29.
25. Food Security Research Network and Faculty of Natural Resources Management, Lakehead University. (2013). The Workforce Multiplier Effect of Local Farms and Food Processors in Northwestern Ontario. Funded by the North Superior Workforce Planning Board and the Northwest Training and Adjustment Board. Page 29.
26. Food Security Research Network and Faculty of Natural Resources Management, Lakehead University. (2013). The Workforce Multiplier Effect of Local Farms and Food Processors in Northwestern Ontario. Funded by the North Superior Workforce Planning Board and the Northwest Training and Adjustment Board. Page 29.
27. Food Security Research Network and Faculty of Natural Resources Management, Lakehead University. (2013). The Workforce Multiplier Effect of Local Farms and Food Processors in Northwestern Ontario. Funded by the North Superior Workforce Planning Board and the Northwest Training and Adjustment Board. Page 29.
28. Food Security Research Network and Faculty of Natural Resources Management, Lakehead University. (2013). The Workforce Multiplier Effect of Local Farms and Food Processors in Northwestern Ontario. Funded by the North Superior Workforce Planning Board and the Northwest Training and Adjustment Board. Page 29.
29. Food Security Research Network and Faculty of Natural Resources Management, Lakehead University. (2013). The Workforce Multiplier Effect of Local Farms and Food Processors in Northwestern Ontario. Funded by the North Superior Workforce Planning Board and the Northwest Training and Adjustment Board. Page 33.
30. Food Security Research Network and Faculty of Natural Resources Management, Lakehead University. (2013). The Workforce Multiplier Effect of Local Farms and Food Processors in Northwestern Ontario. Funded by the North Superior Workforce Planning Board and the Northwest Training and Adjustment Board. Page 29.
31. Food Security Research Network and Faculty of Natural Resources Management, Lakehead University. (2013). The Workforce Multiplier Effect of Local Farms and Food Processors in Northwestern Ontario. Funded by the North Superior Workforce Planning Board and the Northwest Training and Adjustment Board. Page 29.

32. Food Security Research Network and Faculty of Natural Resources Management, Lakehead University. (2013). The Workforce Multiplier Effect of Local Farms and Food Processors in Northwestern Ontario. Funded by the North Superior Workforce Planning Board and the Northwest Training and Adjustment Board. Page 31.
33. Thunder Bay Beekeeper Association. (2015). Personal Communication.34. Thunder Bay Agricultural Research Station. (2014). Annual Crop Report 2014.35. Mitchell, J., (2015). Superior Seed Producers. Personal Communication.36. Food Security Research Network and Faculty of Natural Resources Management, Lakehead University. (2013). The Workforce Multiplier Effect
of Local Farms and Food Processors in Northwestern Ontario. Funded by the North Superior Workforce Planning Board and the Northwest Training and Adjustment Board. Page 35.
37. Roy, R., (2014). Appendix E: Growth Opportunities in Thunder Bay’s Food Infrastructure, Research Report. Prepared by Beanstalk Consulting as part of the City of Thunder Bay and Food Action Network Broader Public Sector Education Strategy Implementation Project, Summary Report.
38. Roy, R., (2014). Appendix E: Growth Opportunities in Thunder Bay’s Food Infrastructure, Research Report. Prepared by Beanstalk Consulting as part of the City of Thunder Bay and Food Action Network Broader Public Sector Education Strategy Implementation Project, Summary Report.
39. Roy, R., (2014). Appendix E: Growth Opportunities in Thunder Bay’s Food Infrastructure, Research Report. Prepared by Beanstalk Consulting as part of the City of Thunder Bay and Food Action Network Broader Public Sector Education Strategy Implementation Project, Summary Report.
40. Roy, R., (2014). Appendix E: Growth Opportunities in Thunder Bay’s Food Infrastructure, Research Report. Prepared by Beanstalk Consulting as part of the City of Thunder Bay and Food Action Network Broader Public Sector Education Strategy Implementation Project, Summary Report.
41. Thunder Bay District Health Unit. (2015). Get Fresh! Guide.42. Food Security Research Network and Faculty of Natural Resources Management, Lakehead University. (2013). The Workforce Multiplier Effect
of Local Farms and Food Processors in Northwestern Ontario. Funded by the North Superior Workforce Planning Board and the Northwest Training and Adjustment Board. Page 52.
43. Food Security Research Network and Faculty of Natural Resources Management, Lakehead University. (2013). The Workforce Multiplier Effect of Local Farms and Food Processors in Northwestern Ontario. Funded by the North Superior Workforce Planning Board and the Northwest Training and Adjustment Board. Page 26.
44. Food Security Research Network and Faculty of Natural Resources Management, Lakehead University. (2013). The Workforce Multiplier Effect of Local Farms and Food Processors in Northwestern Ontario. Funded by the North Superior Workforce Planning Board and the Northwest Training and Adjustment Board. Page 52.
SCHOOL FOOD ENVIRONMENTS
1. Healthy Kids Panel. (2013). No Time to Wait.2. Healthy Kids Panel. (2013). No Time to Wait. 3. Food Banks Canada. (2014). HungerCount 2013.4. Food Banks Canada. (2014). HungerCount 2013.5. Schwartz-Mendez, C., (2016). Thunder Bay District Health Unit. Personal Communication, January 8, 2016.6. Schwartz-Mendez, C., (2016). Thunder Bay District Health Unit. Personal Communication, January 8, 2016.7. Schwartz-Mendez, C., (2016). Thunder Bay District Health Unit. Personal Communication, January 8, 2016.8. Mitchell, J., (2015). Roots to Harvest. Personal Communication.9. Mitchell, J., (2015). Roots to Harvest. Personal Communication.10. Mackay, E., (2015). Canadian Red Cross, Thunder Bay. Personal Communication.11. Mackay, E., (2015). Canadian Red Cross, Thunder Bay. Personal Communication.12. Beagle, E., (2015). Roots to Harvest. Personal Communication. AND Schwartz-Mendez., C. (2015). Thunder Bay District Health Unit. Personal
Communication.13. Beagle, E., (2015). Roots to Harvest. Personal Communication. 14. Beagle, E., (2015). Roots to Harvest. Personal Communication.15. Schwartz-Mendez, C., (2016). Thunder Bay District Health Unit. Personal Communication, January 8, 2016.
URBAN AGRICULTURE
1. Mendez-Schwartz, C., (2015). Thunder Bay District Health Unit. Personal Communication.2. Mendez-Schwartz, C., (2015). Thunder Bay District Health Unit. Personal Communication.3. Thunder Bay and Area Food Strategy. (2015). Community Food Security Database.4. Thunder Bay and Area Food Strategy. (2015). Community Food Security Database.5. Schwartz-Mendez, C., (2016). Thunder Bay District Health Unit. Personal Communication, January 8, 2016.6. Mortfield, E., (2015). EcoSuperior Environmental Programs. Personal Communication.7. Thunder Bay and Area Food Strategy. (2015). Community Food Security Database.8. Mitchell, J., (2015). Roots to Harvest. Personal Communication.9. Mitchell, J., (2015). Roots to Harvest. Personal Communication.10. Mitchell, J., (2015). Roots to Harvest. Personal Communication.11. Thunder Bay and Area Food Strategy. (2015). Community Food Security Database.12. Thunder Bay and Area Food Strategy. (2015). Community Food Security Database.

The Thunder Bay and Area Food Strategy is committed to creating a healthy, equitable, and sustainable food system that contributes to the economic,
ecological, health, and social well-being of the City of Thunder Bay and Area.
562 Red River Road, Thunder Bay, Ontario P7B 1H3
tbfoodstrategy.ca