throughput issues for high-speed wide-area networks · autotuning settings • linux 2.6...
TRANSCRIPT
Throughput Issues for High-Speed Wide-Area
Networks
Brian L. TierneyESnet
Lawrence Berkeley National Laboratory
http://fasterdata.es.net/(HEPIX Oct 30, 2009)
Why does the Network seem so slow?

TCP Performance Issues
• Getting good TCP performance over high-latency high-bandwidth networks is not easy!
• You must keep the TCP window full– the size of the window is directly related to the
network latency• Easy to compute max throughput:
– Throughput = buffer size / latency– eg: 64 KB buffer / 40 ms path = 1.6 KBytes
(12.8 Kbits) / sec

Setting the TCP buffer sizes
• It is critical to use the optimal TCP send and receive socket buffer sizes for the link you are using.– Recommended size to fill the pipe
• 2 x Bandwidth Delay Product (BDP) – Recommended size to leave some bandwidth for others
• around 20% of (2 x BPB) = .4 * BDP
• Default TCP buffer sizes are way too small for today’s high speed networks– Until recently, default TCP send/receive buffers were typically
64 KB– tuned buffer to fill LBL to BNL link: 10 MB
• 150X bigger than the default buffer size– with default TCP buffers, you can only get a small % of the
available bandwidth!
Buffer Size Example
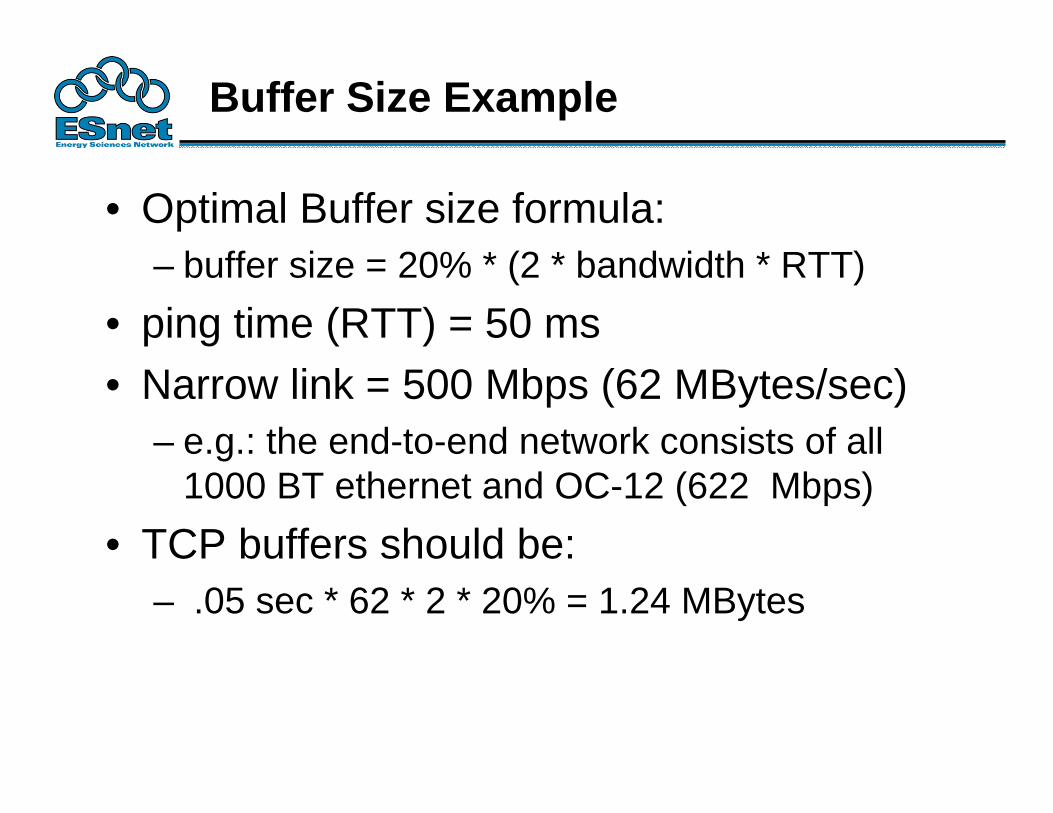
• Optimal Buffer size formula: – buffer size = 20% * (2 * bandwidth * RTT)
• ping time (RTT) = 50 ms• Narrow link = 500 Mbps (62 MBytes/sec)
– e.g.: the end-to-end network consists of all 1000 BT ethernet and OC-12 (622 Mbps)
• TCP buffers should be:– .05 sec * 62 * 2 * 20% = 1.24 MBytes

Sample Buffer Sizes
• LBL to (50% of pipe)– SLAC (RTT = 2 ms, narrow link = 1000 Mbps) : 256 KB– BNL: (RTT = 80 ms, narrow link = 1000 Mbps): 10 MB– CERN: (RTT = 165 ms, narrow link = 1000 Mbps): 20.6
MB• Note: default buffer size is usually only 64 KB,
and default maximum autotuning buffer size for is often only 256KB – e.g.: FreeBSD 7.2 Autotuning default max = 256 KB– 10-150 times too small!
• Home DSL, US to Europe (RTT = 150, narrow link = 2 Mbps): 38 KB– Default buffers are OK.

Socket Buffer Autotuning
• To solve the buffer tuning problem, based on work at LANL and PSC, Linux OS added TCP Buffer autotuning– Sender-side TCP buffer autotuning introduced in Linux 2.4– Receiver-side autotuning added in Linux 2.6
• Most OS’s now include TCP autotuning– TCP send buffer starts at 64 KB – As the data transfer takes place, the buffer size is continuously
re-adjusted up max autotune size • Current OS Autotuning default maximum buffers
– Linux 2.6: 256K to 4MB, depending on version– FreeBSD 7: 256K– Windows Vista: 16M– Mac OSX 10.5: 8M
Autotuning Settings
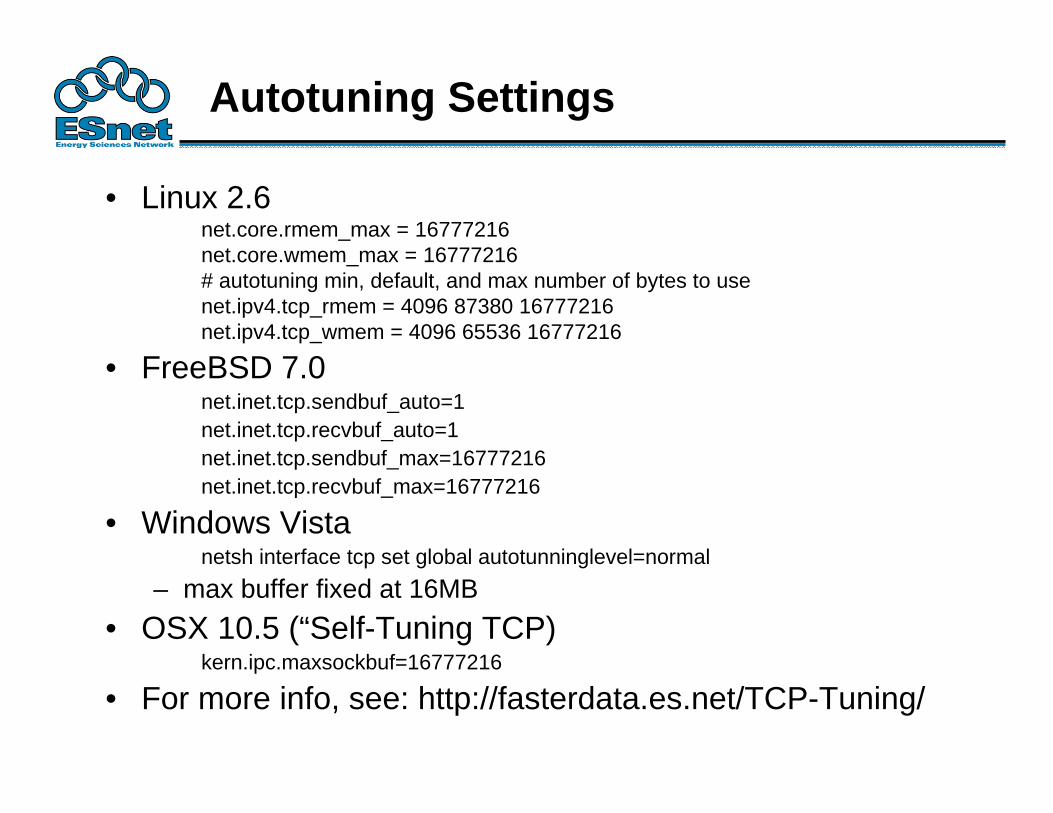
• Linux 2.6net.core.rmem_max = 16777216 net.core.wmem_max = 16777216 # autotuning min, default, and max number of bytes to usenet.ipv4.tcp_rmem = 4096 87380 16777216 net.ipv4.tcp_wmem = 4096 65536 16777216
• FreeBSD 7.0net.inet.tcp.sendbuf_auto=1 net.inet.tcp.recvbuf_auto=1 net.inet.tcp.sendbuf_max=16777216 net.inet.tcp.recvbuf_max=16777216
• Windows Vistanetsh interface tcp set global autotunninglevel=normal
– max buffer fixed at 16MB• OSX 10.5 (“Self-Tuning TCP)
kern.ipc.maxsockbuf=16777216
• For more info, see: http://fasterdata.es.net/TCP-Tuning/

More Problems: TCP congestion control
Path = LBL to CERN (Geneva) OC-3, (in 2000), RTT = 150 ms
average BW = 30 Mbps

Parallel Streams Can Help

Parallel Streams Issues
• Potentially unfair• Places more load
on the end hosts• But they are
necessary when you don’t have root access, and can’t convince the sysadmin to increase the max TCP buffers
graph from Tom Dunigan, ORNL
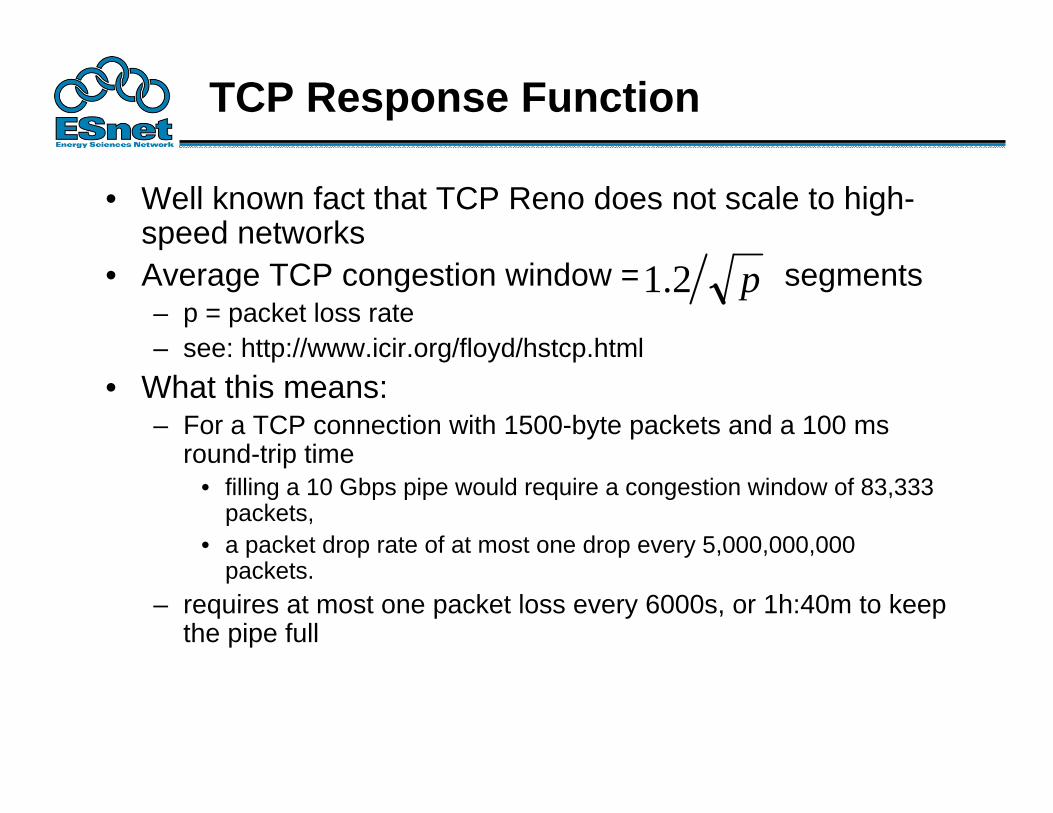
• Well known fact that TCP Reno does not scale to high-speed networks
• Average TCP congestion window = segments– p = packet loss rate– see: http://www.icir.org/floyd/hstcp.html
• What this means:– For a TCP connection with 1500-byte packets and a 100 ms
round-trip time• filling a 10 Gbps pipe would require a congestion window of 83,333
packets, • a packet drop rate of at most one drop every 5,000,000,000
packets. – requires at most one packet loss every 6000s, or 1h:40m to keep
the pipe full
p2.1
TCP Response Function

Proposed TCP Modifications
• Many proposed alternate congestion control algorithms:– BIC/CUBIC– HTCP: (Hamilton TCP)– Scalable TCP– Compound TCP– And several more
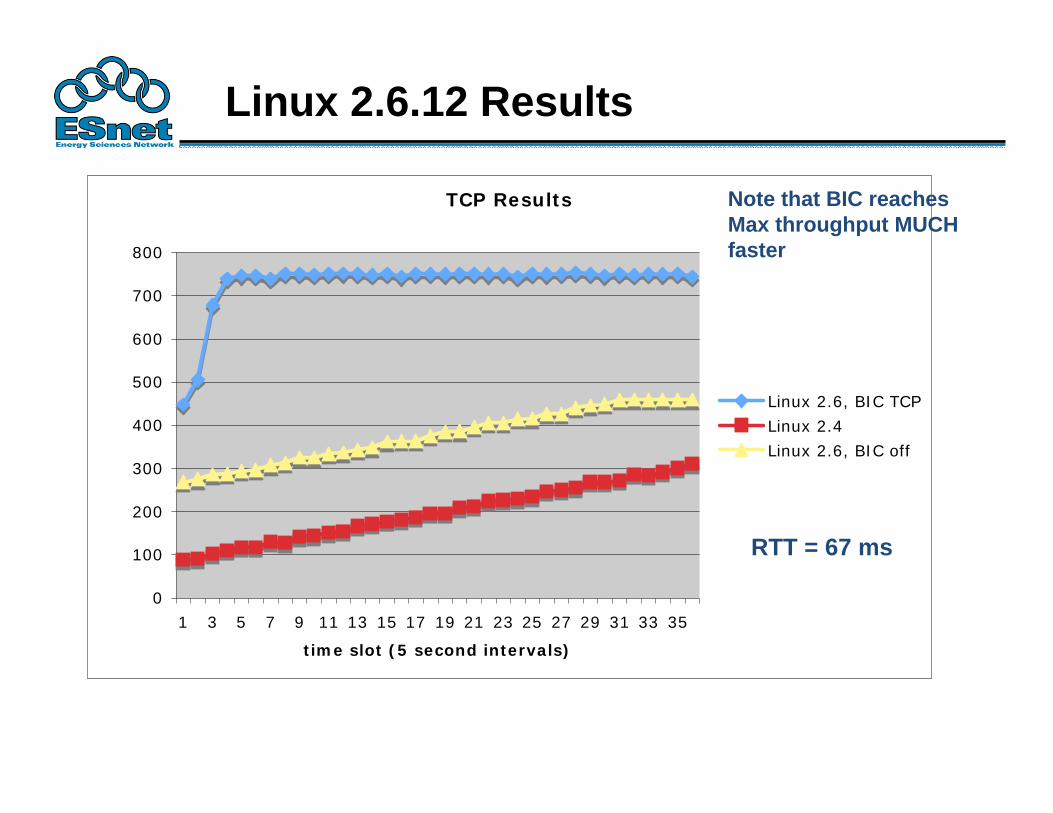
Linux 2.6.12 Results
TCP Results
0
100
200
300
400
500
600
700
800
1 3 5 7 9 11 13 15 17 19 21 23 25 27 29 31 33 35
time slot (5 second intervals)
Linux 2.6, BIC TCP
Linux 2.4
Linux 2.6, BIC off
RTT = 67 ms
Note that BIC reaches Max throughput MUCH faster
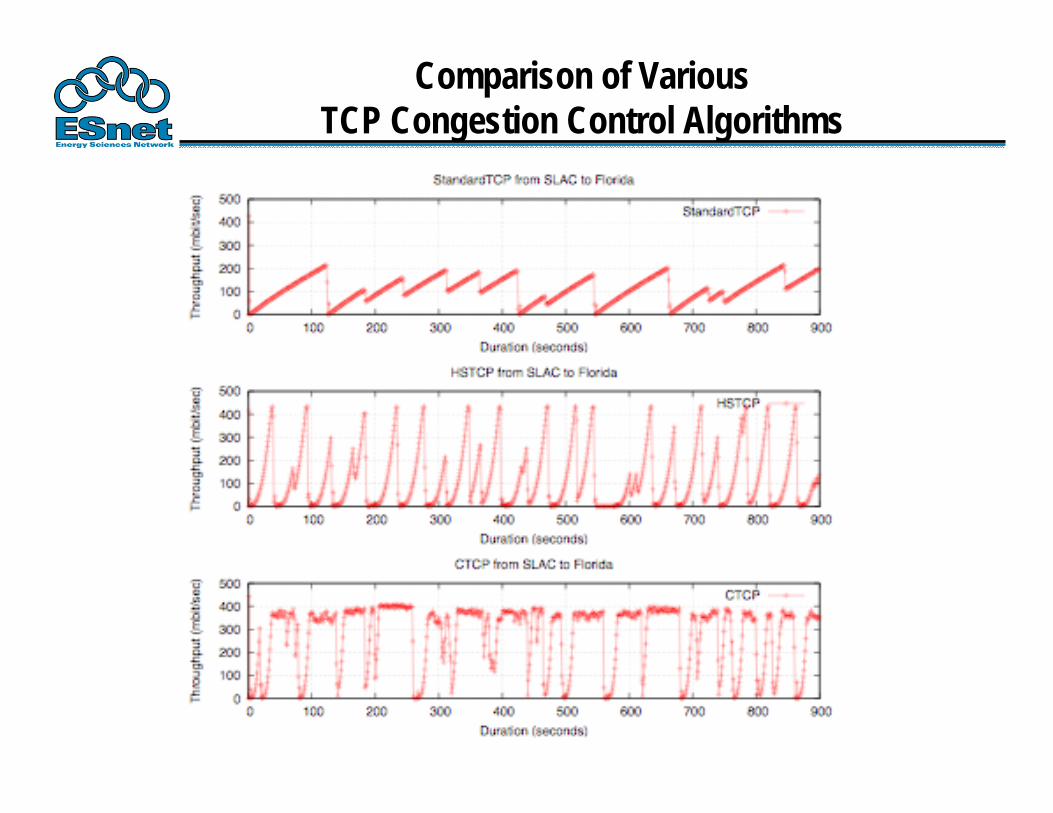
Comparison of Various TCP Congestion Control Algorithms

Selecting TCP Congestion Control in Linux
• To determine current configuration:sysctl -a | grep congestion
net.ipv4.tcp_congestion_control = cubicnet.ipv4.tcp_available_congestion_control = cubic reno
• Use /etc/sysctl.conf to set to any available congested congestion control.
• Supported options (may need to enabled by default in your kernel):– CUBIC, BIC, HTCP, HSTCP, STCP, LTCP, more..

Summary so far
• To optimize TCP throughput, do the following:– Use a newer OS that supports TCP buffer
autotuning– Increase the maximum TCP autotuning buffer
size– Use a few parallel streams if possible– Use a modern congestion control algorithm

PERFSONAR

High Performance Networking
• Most of the R&E community has access to 10 Gbps networks.
• Naive users with the right tools should be able to easily get:• 200 Mbps/per stream between properly maintained systems
• 2 Gbps aggregate rates between significant computing resources
• Most users are not experiencing this level of performance• “There is widespread frustration involved in the transfer of large data sets between facilities, or from the data’s facility of origin back to the researcher’s home institution. “ From the BES network requirements workshop: http://www.es.net/pub/esnet‐doc/BES‐Net‐Req‐Workshop‐2007‐Final‐Report.pdf
• We can increase performance by measuring the network and reporting problems!
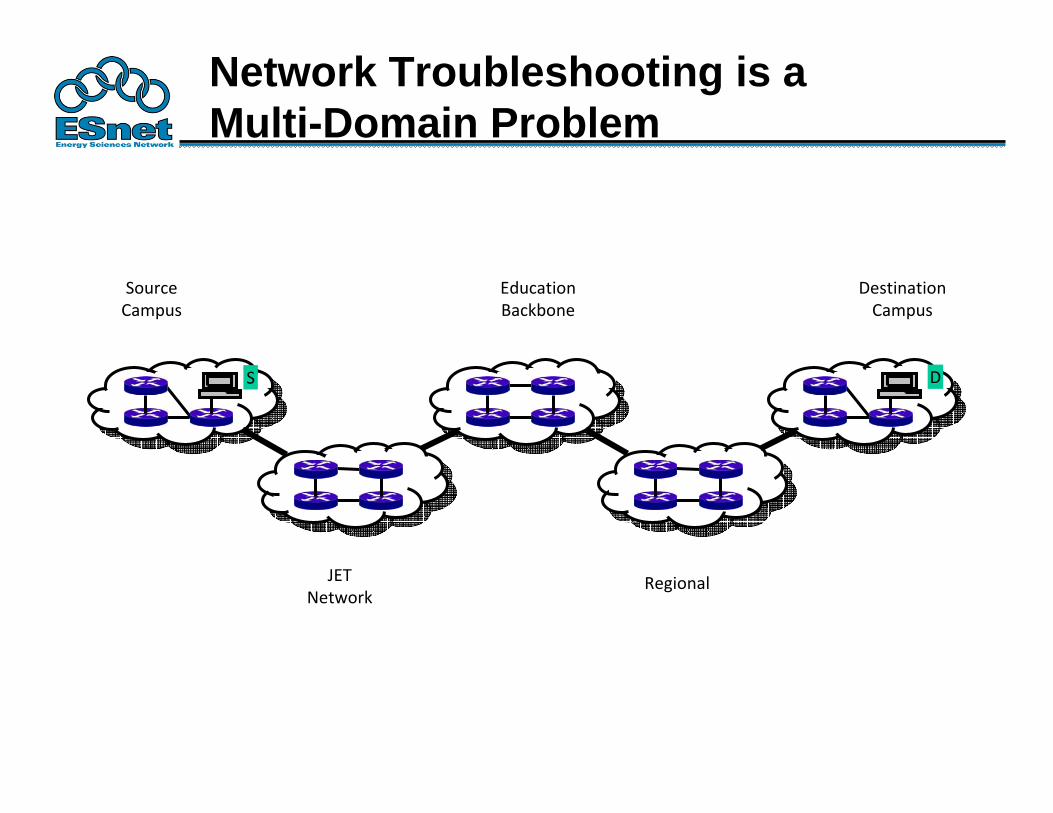
Network Troubleshooting is aMulti-Domain Problem
SourceCampus
EducationBackbone
Regional
DS
DestinationCampus
JETNetwork

Where are common problems?
SourceCampus
EducationBackbone
Regional
DS
DestinationCampus
JETNetwork
Congested or faulty links between domains
Latency dependant problems inside domains with small RTT
Soft Network Failures
• Soft failures are where basic connectivity functions, but high performance is not possible.
• TCP was intentionally designed to hide all transmission errors from the user:– “As long as the TCPs continue to function properly
and the internet system does not become completely partitioned, no transmission errors will affect the users.” (From IEN 129, RFC 716)
• Some soft failures only affect high bandwidth long RTT flows.
• Hard failures are easy to detect & fix, soft failures can lie hidden for years.
Common Soft Failures• Small Queue Tail Drop
– Switches not able to handle the long packet trains prevalent in long RTT sessions and cross traffic at the same time
• Un-intentional Rate Limiting– Process Switching on Cisco 6500 devices due to faults,
acl’s, or mis-configuration– Security Devices
• E.g.: 10X improvement by turning off Cisco Reflexive ACL
• Random Packet Loss– Bad fibers or connectors– Low light levels due to amps/interfaces failing– Duplex mismatch

Local testing will not find all problems
SourceCampus
R&EBackbone
Regional
DS
DestinationCampus
Regional
Performance is good when RTT is < 20 msPerformance is poor when
RTT exceeds 20 ms
Switch with Switch with small bufferssmall buffers
Addressing the Problem: perfSONAR
• Developing an open web-services based framework for collecting, managing and sharing network measurements
• Deploying the framework across the science community
• Encouraging people to deploy ‘known good’ measurement points near domain boundaries
• Using the framework to find & correct soft network failures.

perfSONAR Deployments
• Internet2• ESnet• Argonne National Lab• Brookhaven National Lab• Fermilab• National Energy Research Scientific
Computing Center• Pacific Northwest National Lab• University of Michigan, Ann Arbor• Indiana University• Boston University• University of Texas Arlington• Oklahoma University, Norman• Michigan Information Technology Center• William & Mary• University of Wisconsin Madison• Southern Methodist University, Dallas• University of Texas Austin• Vanderbilt University
• APAN• GLORIAD• JGN2PLUS• KISTI Korea• Monash University, Melbourne• NCHC, HsinChu, Taiwan• Simon Fraser University • GEANT• GARR• HUNGARNET• PIONEER• SWITCH• CCIN2P3• CERN• CNAF• DE-KIT• NIKHEF/SARA• PIC• RAL• TRIUMF
perfSONAR Architecture
• Interoperable network measurement middleware (SOA):– Modular– Web services-based– Decentralized– Locally controlled
• Integrates:– Network measurement tools and data archives– Data manipulation– Information Services
• Discovery• Topology• Authentication and authorization
• Based on:– Open Grid Forum Network (OGF) Network Measurement Working Group (NM-
WG) schema– Formalizing the specification of perfSONAR protocols in the OGF NMC-WG– Network topology description work in the OGF NML-WG

Main perfSONAR Services• Lookup Service
– gLS – Global service used to find services– hLS – Home service for registering local perfSONAR metadata
• Measurement Archives– SNMP MA – Interface Data– pSB MA -- Scheduled bandwidth and latency data
• Measurement Points– BWCTL– OWAMP– PINGER
• Troubleshooting Tools– NDT– NPAD
• Topology Service

PerfSONAR-PS Deployment Status
• Currently deployed in over 130 locations– 45 bwctl and owamp servers– 40 pSB MA– 15 SNMP MA– 5 gLS and 135 hLS
• US Atlas Deployment– Monitoring all “Tier 1 to Tier 2” connections
• For current list of services, see:– http://www.perfsonar.net/activeServices.html
29

Deploying a perfSONAR measurement host in under 30 minutes
• Using the PS Performance Toolkit is very simple– Boot from CD– Use command line tool to configure
• what disk partition to use for persistent data• Network address and DNS• User and root passwords
– Use Web GUI to configure• Select which services to run• Select remote measurement points for bandwidth and latency
tests• Configure Cacti to collect SNMP data from key router
interfaces
30

SAMPLE RESULTS
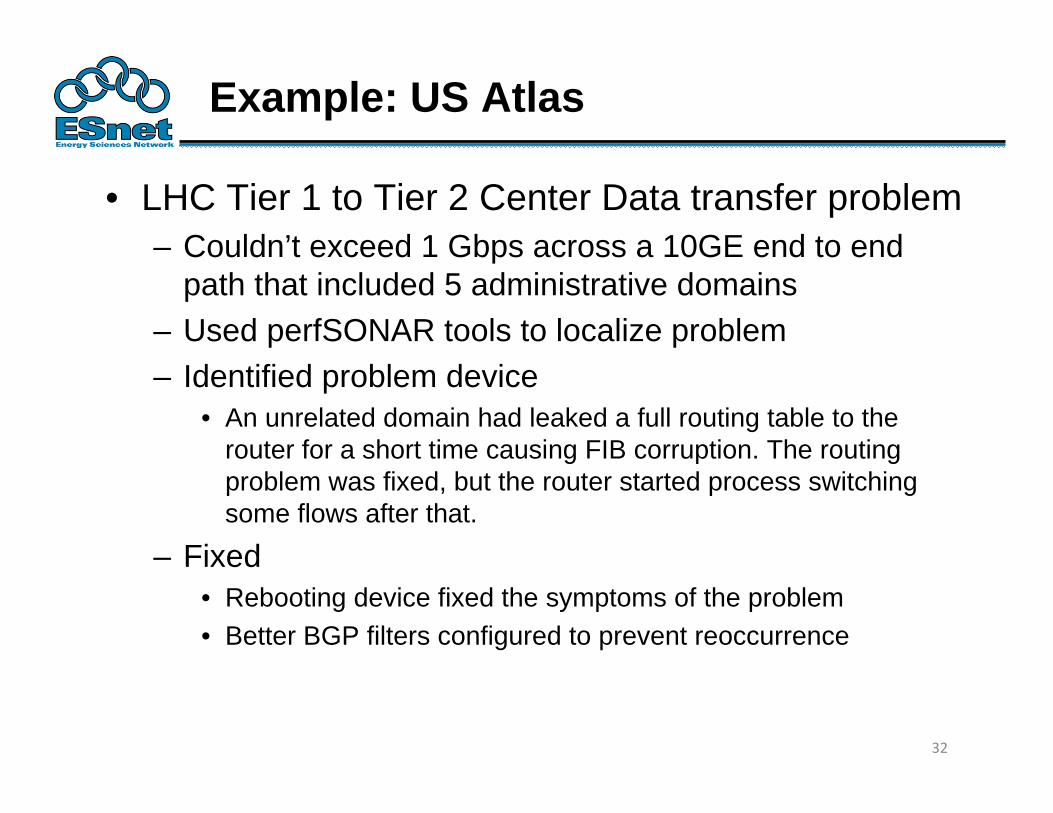
Example: US Atlas
• LHC Tier 1 to Tier 2 Center Data transfer problem– Couldn’t exceed 1 Gbps across a 10GE end to end
path that included 5 administrative domains– Used perfSONAR tools to localize problem– Identified problem device
• An unrelated domain had leaked a full routing table to the router for a short time causing FIB corruption. The routing problem was fixed, but the router started process switching some flows after that.
– Fixed• Rebooting device fixed the symptoms of the problem• Better BGP filters configured to prevent reoccurrence
32

Sample Results: Fixed a soft failure
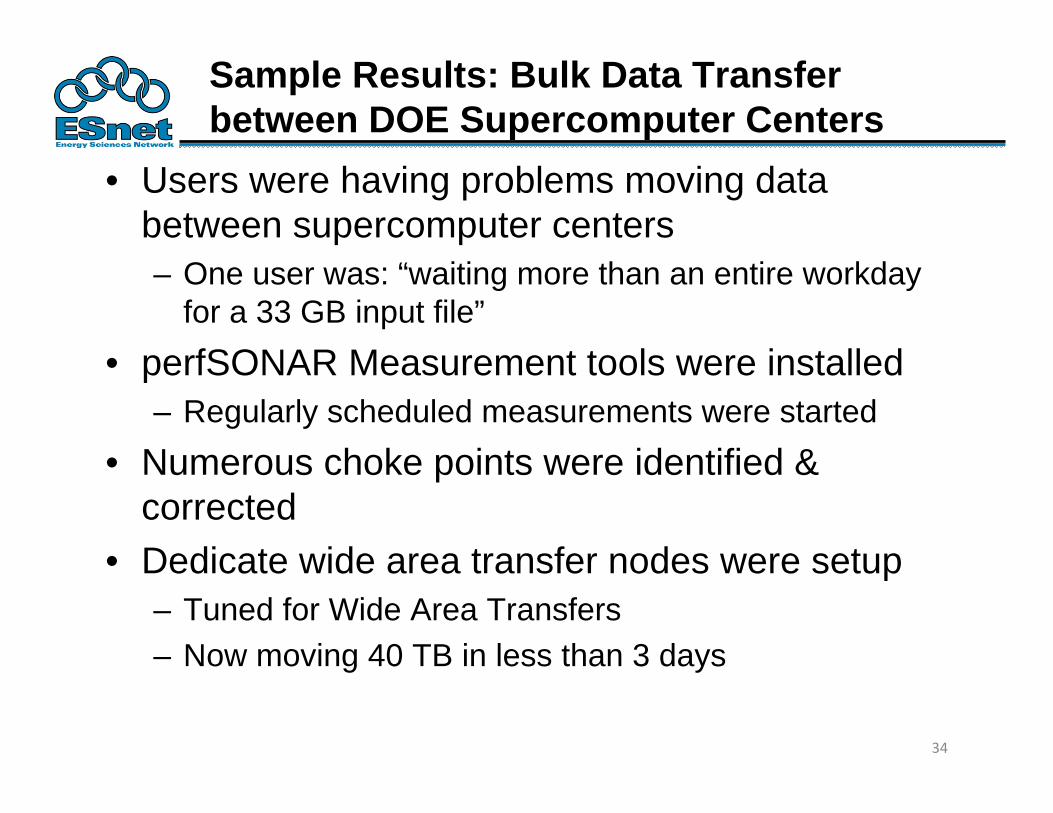
Sample Results: Bulk Data Transfer between DOE Supercomputer Centers
• Users were having problems moving data between supercomputer centers– One user was: “waiting more than an entire workday
for a 33 GB input file”• perfSONAR Measurement tools were installed
– Regularly scheduled measurements were started• Numerous choke points were identified &
corrected• Dedicate wide area transfer nodes were setup
– Tuned for Wide Area Transfers– Now moving 40 TB in less than 3 days
34

Importance of Regular Testing
• You cant wait for users to report problems and then fix them
• Soft failure can go unreported for years• Problems that get fixed have a way of coming
back– System defaults coming back after hardware/software
upgrade– New employees not knowing why the previous
employee set things up that way• perfSONAR makes is easy to collect, archive,
and alert on throughput information
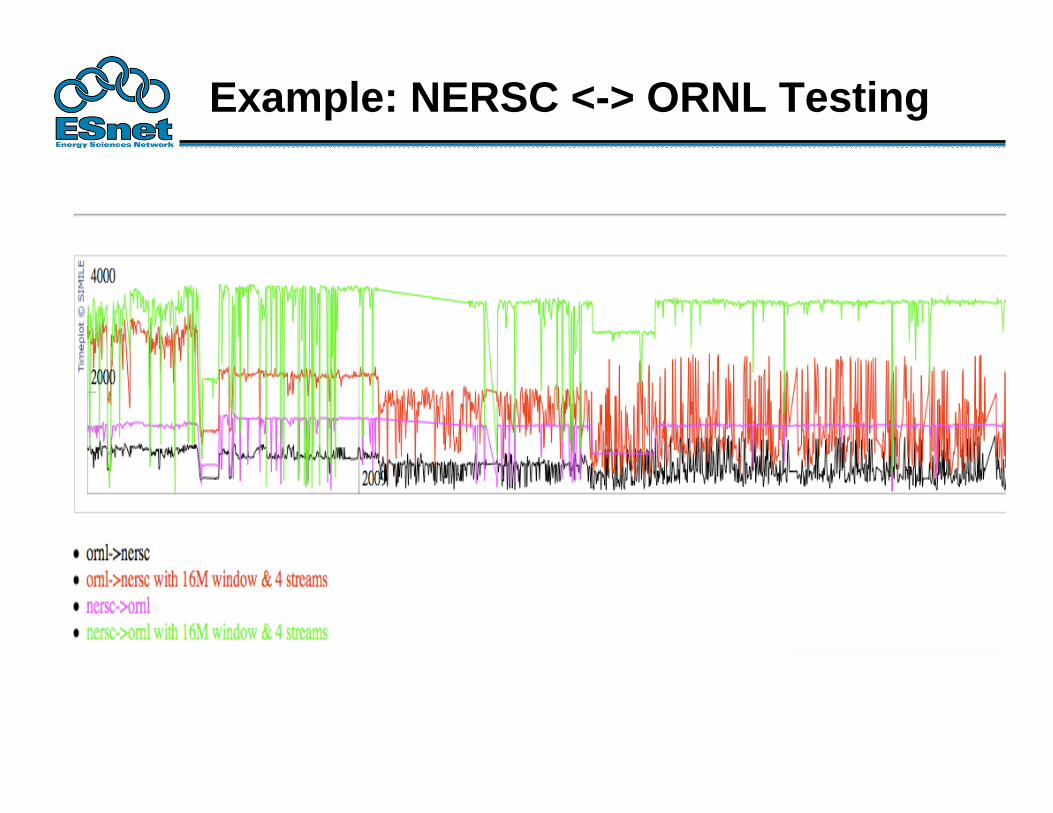
Example: NERSC <-> ORNL Testing

More Information
• http://fasterdata.es.net/
• email: [email protected]
• Also see:– http://fasterdata.es.net/talks/Bulk-transfer-tutorial.pdf– https://plone3.fnal.gov/P0/WAN/netperf/methodology/