threshold friction velocities for dust production for ...dust.ess.uci.edu/ppr/ppr_gil88.pdf ·...
TRANSCRIPT
JOURNAL OF GEOPHYSICAL RESEARCH, VOL. 93, NO. D10, PAGES 12,645-12,662, OCTOBER 20, 1988
Threshold Friction Velocities for Dust Production for Agricultural Soils
DALE A. GILLETFE
Geophysical Monitoring for Climatic Change, Air Resources Laboratories, NOAA, Boulder, Colorado
Threshold velocities for agricultural soils were measured for a wide variety of conditions in ord'er to quantify a model of dust emissions for the United States. These measurements supplement threshold velocities for arid and semiarid soils (Gillette, et al., 1980, Gillette, et al., 1982). The model will be used in precipitation acid/base balance studies. The soils were organized according to surface texture, organic matter content, and calcium carbonate composition. They were further organized by the physical surface states: smooth-loose, cloddy, and crested. Sandy soils were found to have the lowest threshold velocities and were the least affected by wetting (precipitation). Loamy soils were found to have the highest threshold velocities and were the most affected by precipitation wetting.
1. INTRODUCTION
Recent interest has been expressed in evaluation of dust emission from open sources such as agricultural soils. Dust emitted by wind erosion of agricultural soils is of importance on a large geographical scale for two nationally discussed problems in the United States: (1) the acidfloase balance of atmospheric precipitation, and (2) soil erosion.
The alkaline components of soil-derived dust are bases that may be important in neutralizing acidic precursors in precipitation. This possibility is being pursued by the National Acid Precipitation Assessment Program (NAPAP). Aerosols derived from wind erosion of soil, which are transported great distances, represent a long-term soil loss. The National Resource Inventory (NRI) of the Soil Conservation Service of the U.S. Department of Agriculture (USDA), is actively assessing such long-term loss of soil.
For estimation of dust production and wind erosion, one model relies heavily on values of threshold friction velocities [Gillette, 1986]. Threshold friction velocity for wind erosion corresponds to the minimum wind stress needed to overcome forces holding soil particles in place. Threshold friction velocity is related simply to the threshold wind stress: the square of the threshold friction velocity u. t times the density of the air equals the threshold wind stress. Although friction velocities at the threshold of erosion have been determined experimentally for idealized surfaces by several investigators [Baghold, 1941; Chepil, 1945; Arvidson, 1972; Greeley, et al., 1974; Hess, 1973; Iversen, et al., 1973; Ryan, 1964; Sagan and Pollack, 1969; Wood et al., 1974, Phillips, 1980; Ishihara and Iwagaki, 1952], these idealized surfaces only slightly resemble the complexity of the natural earth surfaces. A wide variety of particle sizes, inhomogeneous particle composition, effects of wetting/drying and freezing/thawing, vegetation, and aggregation of particles complicate the physical circumstances in agricultural soils. Threshold friction velocities have been measured for desert soils
by Gillette et al. [1980, 1982]. Although some of the friction velocities may be applicable in this study, large differences between desert and agricultural soil threshold velocities exist because of working of the land in agriculture, large precipitation differences, the existence of usually greater quantities of soluble
This paper is not subject to U.S. copyright. Published in 1988 by the American Geophysical Union.
Paper number 88JD03081.
salts in desert soils, the presence of "desert pavement" in many desert soils, and other large differences in vegetation and land use.
It is the purpose of this paper to apply the knowledge obtained in the studies of idealized surfaces, along with the more empirical approach taken in the study of desert soils, in order to determine threshold friction velocities for dust production from agricultural soils.
2. SCIENTIFIC STRATEGY
The organization of the soil samples to be classified for threshold friction velocity was chosen according to surface soil texture and further modified by carbonate and organic matter content. This choice was made because it is the organization used by the NRI national soil inventory. It also was the starting point in the organization framework used in the pioneering soil erosion work of Chepil and Woodruff[1963]. A moderate degree of homogeneity in soil physical properties, such as threshold friction velocity, is expected within a given soil texture class for the same carbonate and organic matter soil composition. The source of variation would be the exact differences in mixtures of
sand, silt, and clay within a given soil texture class as well as the differences in the size distributions of the particles making up the sand, silt, and clay fractions. Aggregations of surface soil textures have been used to define "wind erodibility groups" (WEGs) by Chepil and Woodruff [1963]. A recent definition of WEGs used by the Soil Conservation Service for NRI work is given in Table 1. These wind erodibility groupings of soil textures assign the most erodible designation to sand textures (WEG 1) and the least erodible designations to loams (WEG 8). Included in WEG 8 are a number of textures located in the
middle of the texture triangle shown in Figure 1. Typical percentages of loose soil material smaller than 0.84 mm are given in Table 1.
A classification of the 1982 NRI of all erodible soils of the
48 contiguous United States shows the percentage distribution (of area) of all surface soil textures that were judged to have potential wind erosion by local USDA soil scientists. This inventory shown in Figure 1 shows no erodible soil area for the soil textures "silt" and "sandy clay." Figure 1 also shows that most of the United States is covered by soil with the following erodible textures: sand, loamy sand, clay loam, silty clay loam, sandy loam, silt loam, and loam.
Our initial soil classification uses the surface soil textures
shown in Figure 1. These texture classifications are
12,645

12,646 GILLETTE: THRESHOLD FRICTION VELOCITIES FOR AGRICULTURAL DUST EMISSION
TABLE 1. Wind Erodibility Group versus Soil Texture, Percentage of Dry Aggregates Smaller Than 0.84 mm, and Wind Erodibility Index
WEG Soil Texture of Surface Layer
Percent Dry Aggregates WEI,* <0.84 mm T/(Ac* Yr)
4L
very fine sand, fine sand, sand, or coarse sand
loamy very fine sand, loamy fine sand, loamy sand, loamy coarse sand, or sapric organic soil materials
very fine sandy loam, fine sandy loam, sandy loam or coarse sandy loam
clay, silty clay, noncalcarious clay loam, or silty clay loam with more than 35% clay content
noncalcareous loam or silt loam
with less than 20% clay content, or sandy clay loam, sandy clay, or hemic organic soil materials
noncalcareous loam or silt loam
with more than 20% clay content, or noncalcareous clay loam with less that 35% clay content
silt, noncalcareous silty clay loam with less than 35% clay content or fibric organic soil material
soils not susceptible to wind erosion because of coarse suface
fragments or wetness calcareous loam, silt loam, clay
loam, or silty clay loam.
93-99 160-310
90 134
75 86
75 86
60 56
55 48
50 38
<20 0
75 86
WEG, wind erodibility group; WEI, wind erodibility index. *Data courtesy of USDA Wind Erosion Laboratory.
supplemented by four calcareous (rich in calcium carbonate) textures listed as WEG 4L in Table 1' loam, silt loam, clay loam and silty clay loam. In our secondary classification clay and silty clay soils having less than 3% organic matter are also separated from clay and silty clay soils having more than 3% organic matter for reasons that will be given in section 4. Silt and sandy clay textures are ignored, since zero area of those textures is shown in the inventory of erodible soils as given by the NRI in Figure 1.
A further subdivision in the organization for threshold friction velocity work is based on the friction velocity Reynolds number, B.
B = (u., Dp)4 (1) where
u. t threshold friction velocity; D v a size scale of the erodible particles;
v the kinematic viscosity of the air.
In laboratory studies using monodisperse particles having the
same density, the parameter Dj, has been taken to be the diameter of the tested particles. For natural soils, however, particle sizes range over several orders of magnitude. In addition, natural soils form aggregates, the size distributions of which change as a function of wetting, disturbance, etc. Gillette et al. [1980] found that a useful length scale for eroding soils is the mode of the mass size distribution of loose aggregates present on the surface of the soil. They found that the size distribution of those aggregates available for erosion and those particles set into
motion at threshold velocity are virtually the same. The length scale was best established when the size distribution had a sharp peak; such a peak was observed for only a small fraction of the soils. In many cases the mass size distribution showed a very gentle maximum, and in several cases, multiple modes were found.
Gillette [1984] reviewed the literature for natural threshold velocities and found a minimum Reynolds number of 2.6 for all reported values for the observations of Lettau and Lettau (1978). The threshold friction speed parameter A for idealized soil (e.g., monodisperse particles) is almost constant for Reynolds numbers larger than 1 [Iversen, et al., 1976]. A is defined as
A = u.t(ovgD•/o) m where
o v particle density; • air density; g the acceleration of gravity.
The threshold friction velocity would be expected to be approximately proportional to the square root of D in this case p'
the mode of the size distribution of loose particles on the soil surface. Indeed, this relationship was found to be the most useful predictor of threshold friction velocity for natural desert soils, accounting for 55% of the variance for 72 degrees of freedom [Gillette et al., 1980]. Although this relationship was the most useful predictor of u. e a large scatter of data would be expected because of the rather inexact description of the natural dry aggregate size distribution by a single parameter. Thus we used a

GILLETTE: THRESHOLD FRICTION VELOCITIES FOR AGRICULTURAL DUST EMISSION 12,647
I
I x
i

12,648 GILLETTE: THRESHOLD FRICTION VELOCITIES FOR AGRICULTURAL DUST EMISSION
rough but useful classification of surface description corresponding to information on dry aggregate size distribution: "smooth-loose" corresponds to a disaggregated soil having a small mode of the size distribution; "cloddy" corresponds to a soil having coarse aggregates; and "crusted" corresponds to a soil having a significant surface crust.
Soil crusts and aggregates of soils were found to increase u. t [Gillette et al., 1980]. To quantify the strength of crusts in resisting erosion and in maintaining themselves against mechanical disturbance, modulus of rupture, M, was determined. Modulus of rupture is defined as
M = 3FI•2WT 2) (2) where
F impressed force at which the crust breaks; L length between supports of the crust; T is thickness of crust; W width of the crust.
The stability of aggregates of soils was tested by measuring the percentage of aggregates larger than a given size (1 mm) remaining larger than that size following 2 min of rather vigorous mechanical sieve shaking.
3. METHODS
3.1. Threshold Friction Velocity Determination
A portable wind tunnel described by Gillette [1978] was used with an open-floored test section so that a variable-speed turbulent boundary layer could be formed over a flat soil containing small-scale roughness elements. The wind tunnel used a two-dimensional 5:1 contraction section, with a honeycomb flow straightener and a roughly conical diffuser attached to the working section in a configuration similar to that described by Wooding [1968]. Dimensions of the cross section of the working section are 15.24 X 15.24 cm, and the length of the working section is 240 cm.
Wind speed data were collected at several heights above the surface midway across the end of the working section. The Pitot tube anemometer was calibrated and corrected for temperature and pressure changes. Data for the mean velocity U versus height (wind profile data) were fitted to the function for aerodynamically rough flow [see Priestley, 1959]:
u = o) (3) where u, is friction velocity, z is height above the surface, z 0 is roughness height characteristic of the surface, and k is Von Karman's constant. The threshold velocity profile was obtained when continuous movement of soil particles was first visible.
Several of our field samplings were within about 100 m of the NOAA Boulder Atmospheric Observatory (BAO) in Erie, Colorado. These soils were monitored closely, and times when threshold friction velocities were reached were recorded.
Friction velocities were obtained from wind fluctuation data
recorded at the BAO: u. = {[u'w']]ø'5 where the square brackets indicate mean quantity and u' and w' are fluctuations of horizontal and vertical wind speed from the mean. For several Texas soil samples a 6-m tower was used to collect wind data during wind erosion events. Priestley's [1959] expression (3) for friction velocity was used to derive friction velocities from the recorded wind profiles.
3.2. Soil Descriptions
Several soils representative of each textural group were chosen in agricultural areas of the United States having wind erosion problems. The soil textures were located by soil maps or by approximate soil texture determination in the field. Later, all soils were classified in a soil laboratory for soil texture, and some mapping- or field-determined textures were found to be slightly inaccurate. For example, several of our "silt loam" soils, according to mapping classification, were actually "loam" soils, as determined by laboratory determinations.
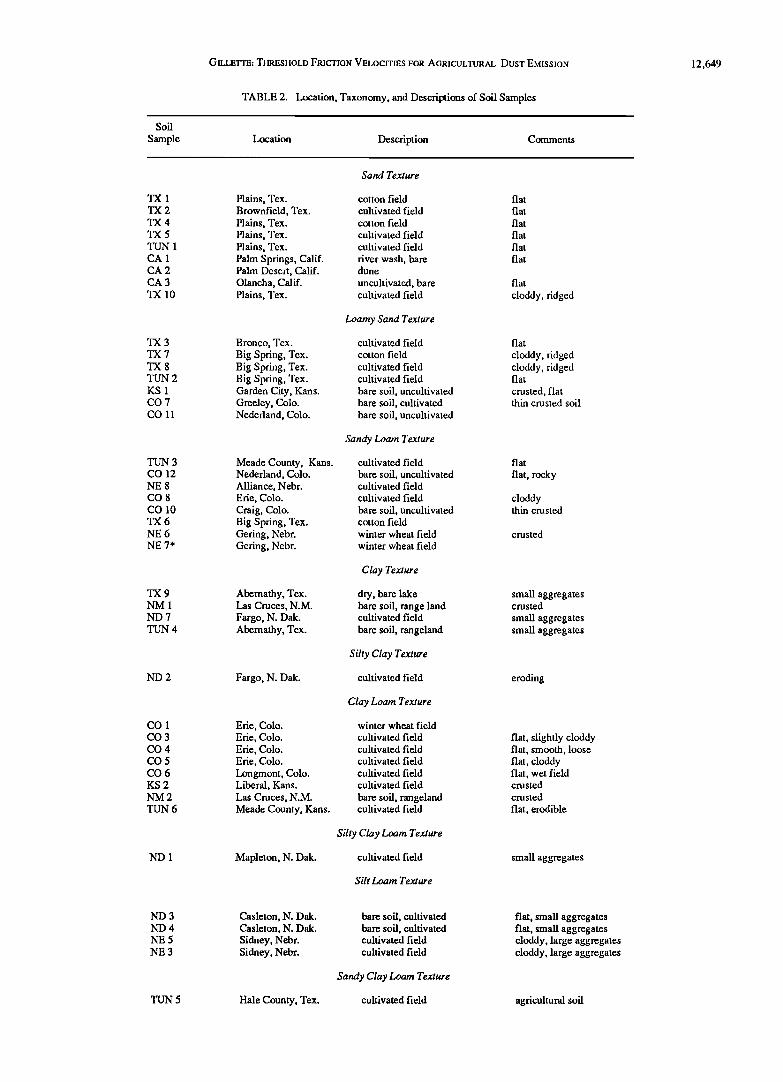
Locations and details, such as descriptions of the land and cropping for each soil sample, are given in Table 2. All soil samples were tested for in situ conditions. The wind tunnel was placed directly over the soil to be tested, so that the exposed soil was as homogeneous as possible.
Mass percentages and size distributions of the test soils were determined after water-soluble material, calcium carbonate, and
organic material were removed. The pipette method and sedigraph method were used to determine the size distributions. The resulting compositions of sampled soils in Table 2 are shown in Figure 1.
Other components of the test soils are given in Table 3. Soluble material was measured gravimetrically from a soil water extract of a suspension formed by intermittent stirring of soil in water for 3 hours. The measurement was checked (with good agreement) against specific conductance, which was converted to an estimate of soluble material by using an empirical formula. The pH values were obtained for a soil/water ratio 1:5, using a Hach meter. Organic matter and carbonate material were determined by standard laboratory procedures. Chemical determinations were made for air-dry samples after they were gently disaggregated and passed through a 2-mm sieve. The sample was placed in a plastic centrifuge tube, where carbonates and soluble salts were removed with 1 N NaOAc (pH=5), using Jackson's [1975] centrifuge washing procedure. The carbonate and salt-free sample was then transferred to a beaker, and organic matter was destroyed by treatment with H20 2 and dispersed with 25 mL of Na4P207. Stirring and ultrasonic treatment followed. Clays were isolated by sedimentation after removal of the sand fraction by wet sieving.
Soil moisture values for the samples are also reported in Table 3. They are expressed in terms of the soil moisture as a percentage of the oven-dry soil mass obtained after 48 hours of drying at 105øC. The soil moistures are given for the condition of the soil as it was found in the field. For some samples, measurements were made of the soil moisture at -15 bar tension
(roughly the soil moisture at the wilting point of sunflowers). Comparison of this soil moisture with the observed soil moistures shows that for all but one soil the moisture content was equal to or below the wilting point.
Dominant mineralogy of the clay fraction was determined by X ray diffraction, using the method described by Gillette et al. [1982] for three samples. Clays for samples CA 1, CO 10, and CO 9 were dominantly mica and chlorite, smectites, and mica and chlorite, respectively.
Bulk density was measured in situ using the method of Robert Grossman (Soil Conservation Service, National Soil Laboratory, personal communication, 1985), in which the volume of the soil is measured along with its mass in the field.
In addition, although most samples were obtained from soils without vegetative residue, some measurements were made on land that had vegetative residue. Table 4 lists these
GILLETTE: TttRESHOLD FRICTION VELOCITIES FOR AGRICULTURAL DUST EMISSION 12,649
TABLE 2. Location, Taxonomy, and Descriptions of Soil Samples
Soil
Sample Location Description Comments
Sand Texture
TX 1 Plains, Tex. cotton field TX 2 Brownfield, Tex. cultivated field TX 4 Plains, Tex. cotton field TX 5 Plains, Tex. cultivated field TUN 1 Plains, Tex. cultivated field CA 1 Palm Springs, Calif. fiver wash, bare CA 2 Palm Desert, Calif. dune CA 3 Olancha, Calif. uncultivated, bare TX 10 Plains, Tex. cultivated field
Loamy Sand Texture
TX 3 Bronco, Tex. cultivated field TX 7 Big Spring, Tex. cotton field TX 8 Big Spring, Tex. cultivated field TUN 2 Big Spring, Tex. cultivated field KS 1 Garden City, Kans. bare soil, uncultivated CO 7 Greeley, Colo. bare soil, cultivated CO 11 Nederland, Colo. bare soil, uncultivated
Sandy Loam Texture
TUN 3 Meade County, Kans. cultivated field CO 12 Nederland, Colo. bare soil, uncukivated NE 8 Alliance, Nebr. cultivated field CO 8 Erie, Colo. cultivated field CO 10 Craig, Colo. bare soil, uncultivated TX 6 Big Spring, Tex. cotton field NE 6 Gering, Nebr. winter wheat field NE 7* Gering, Nebr. winter wheat field
Clay Texture
flat
flat
flat
flat
flat
flat
flat
cloddy, ridged
flat
cloddy, ridged cloddy, ridged flat
crusted, flat thin crusted soil
flat
flat, rocky
cloddy thin crusted
crusted
TX 9 Abemathy, Tex. dry, bare lake small aggregates NM 1 Las Cruces, N.M. bare soil, range land crusted ND 7 Fargo, N. Dak. cultivated field small aggregates TUN 4 Abemathy, Tex. bare soil, rangeland small aggregates
Silty Clay Texture
ND 2 Fargo, N. Dak. cukivated field
Clay Loam Texture
CO 1 Erie, Colo. winter wheat field CO 3 Erie, Colo. cultivated field CO 4 Erie, Colo. cultivated field CO 5 Erie, Colo. cultivated field CO 6 Longmont, Colo. cultivated field KS 2 Liberal, Kans. cultivated field NM 2 Las Cruces, N.M. bare soil, rangeland TUN 6 Meade County, Kans. cultivated field
Silty Clay Loam Texture
ND 1 Mapleton, N. Dak. cultivated field
Silt Loam Texture
eroding
flat, slightly cloddy flat, smooth, loose flat, cloddy flat, wet field crusted
crusted
flat, erodible
small aggregates
ND 3 Casleton, N. Dak. bare soil, cultivated flat, small aggregates ND 4 Casleton, N. Dak. bare soil, cultivated flat, small aggregates NE 5 Sidney, Nebr. cultivated field cloddy, large aggregates NE 3 Sidney, Nebr. cultivated field cloddy, large aggregates
Sandy Clay Loam Texture
TUN 5 Hale County, Tex. cultivated field agricultural soil

12,650 GILLETTE: THRESHOLD FRICTION VELOCITIES FOR AGRICULTURAL DUST EMISSION
TABLE 2. (continued)
Soil
Sample Location Description Comments
Loam Texture
CO 2 Erie, Colo. cultivated field CO 9 Pueblo, Colo. bare soil, uncultivated crusted NE 1 Sidney, Nebr. cultivated field clods, crusted and loose NE 2 Sidney, Nebr. cultivated field clods, crusted and loose NE 4 Sidney, Nebr. cultivated field clods, crusted and loose KS 3 Garden City, Kans. cultivated field clods, crusted and loose KS 4 Garden City, Kans. cultivated field clods, crusted and loose NM 3 Las Cruces, N.M. bare soil, range land crusted
Calcareous Loam, Silty Loam, Silty Clay Loam, and Clay Loam
ND 5 Casleton, N. Dak. cultivated field ND 6 Jamestown, N. Dak. cultivated field
*Soil contained shale fragments, not really cloddy but loose mixed with gravel-sized particles. '•WEG 4L category.
measurements. The vegetative residue was weighed after the samples were oven dried for 24 hours.
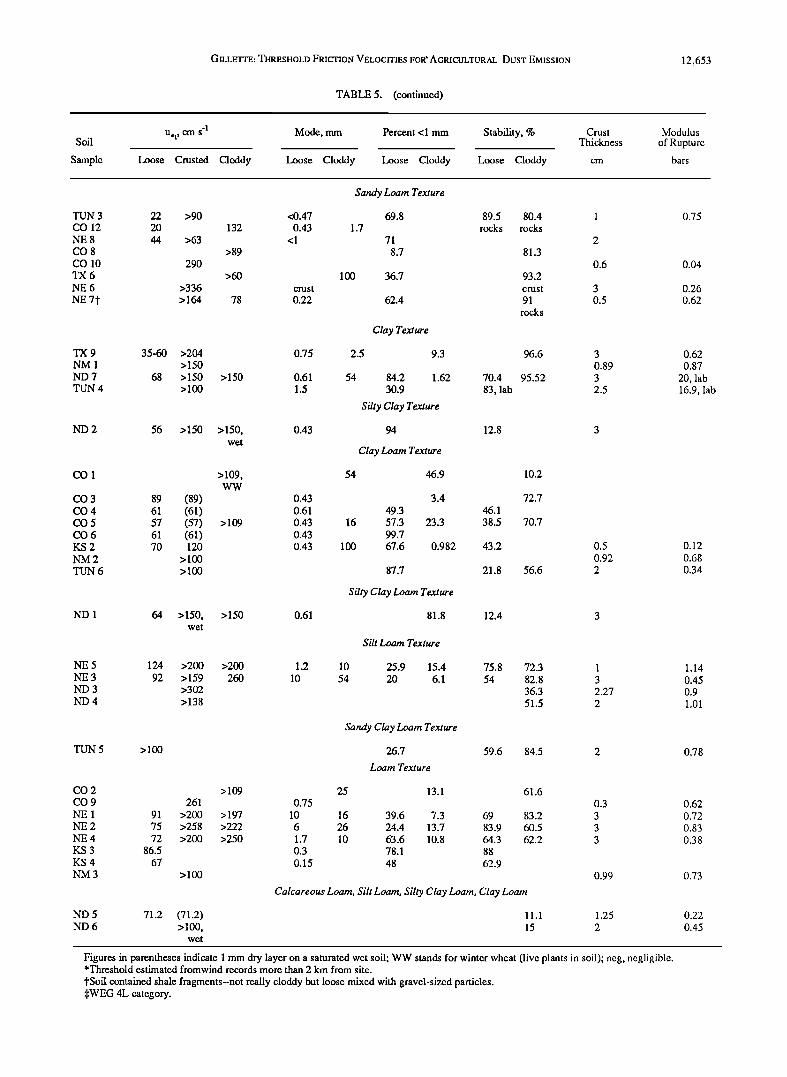
Table 5 lists the threshold friction velocities for the test soils
for the three soil conditions; smooth-loose, crusted, and cloddy. When threshold velocity was not reached by our apparatus, the maximum friction velocity is given using the "greater than" symbol to indicate that the actual threshold friction velocity is higher.
The coarse-aggregate size distribution was determined for smooth-loose and cloddy samples by dry sieving. There were no coarse aggregates in the soil crusts. The soil samples were carefully transported to our laboratory to avoid breakage of aggregates. From the size distribution the maxima (i.e. modes) were obtained for each test (Table 5).
A measure of how resistant the size distribution was to
change is given by the stability measurements. These measurements (given in Table 5) show the percentage of soil aggregate mass larger than 1 mm that survives a period of rather vigorous dry sieving provided by a mechanical sieve-shaker for the 1-mm sieve. The method used to obtain the initial size
distribution of dry aggregates is a gentle dry sieving, using as little shaking as possible to separate the soil. This method, although relative and certainly not the same as the mechanical stresses experienced by soil aggregates in the field, gives a measure of how stable the aggregates will be to such mechanical disturbances as sandblasting by wind erosion.
Finally, the thickness of the soil crust and modulus of rupture are also given in Table 5. The modulus of rupture was
TABLE 3. Composition of Soil Samples
Moisture %
Soil
Soil Loose Crusted Cloddy at -15 bar Sample Soil Soil Soil Tension
0.52
0.99
0.41
0.52
0.3
0.06
1.29 0.6
0.4
0.9
1.64
TX1
TX2
TX4
TX5
TUN 1 CA 1
CA2 CA3
TX10
TX3
TX7
TX8
TUN 2
KS 1 CO 7
CO 11
Soluble Salt,* %
Carbonate, %
Sand Texture
1.3
0.1
0.23
0.5
Loamy Sand Texture
Organic Matter, % pH
1.2
0.9 8.4
0.6
3.5 1 0.41 7.6 1.74 0.89 7.3
0.05 0 0 8.1
0.04 0 0 7.7 0.43 3 0 9.9

GILLETTE: THRESHOLD FRICTION VELOCITIES FOR AGRICULTURAL DUST EMISSION 12,651
TABLE 3. (continued)
Soil
Sample Loose Soil
Moisture %
Crusted Soil
Soil
Cloddy at - 15 bar Soluble Carbonate Organic Soil Tension Salt,* % % Matter, % pH
TUN 3 CO 12
NE 8 CO 8
CO 10
TX6
NE 6
NE 7
TX9
NM 1
ND 7
TUN 4
ND 2
CO 1
CO 3
CO 4
CO 5
CO 6
KS 2
NM 2 TUN 6
3.0
1.57
4.3
1.79
2.8
1.6
8
2.99 2.4
7.43
1.5
1.82
1.1
ND 1 4.88
3.3
4.2
1.79
1.6
8
2.51 3.23
2.2
1.57
Sandy Loam Texture
5.9 0.89 7.1 9.1 1 3.24
0.75 7.6 1 O.78
6.1 5 0.29
Clay Texture
6.6
11.6 19 0.96 3.23 0.98 5.73
Silty Clay Texture
2.58 5.08 7.8
Clay Loam Texture
10.6 10.6 0 0 1.05
(air dry/on sat.)•' 9.9 0 0 1.01 (air dry/on sat.)? 11.4 0 2 1.03 (air dry/on sat.)'• 13.4 0 2 0.81 (air dry/on sat.)? 11.1 0 2 1.1
1.5 11 6.5 0 1.14
1.2
Silty Clay Loam Texture
Silt Loam Texture
NE 5 5.69 6.4 6.4 14.2 NE 3 6 2.77 4.41 13.7 ND 3 2.25 ND 4 2.56
TUN 5 2.4 2.2
Sandy Clay Loam Texture
Loam Texture
CO 2 9.9 9.9 1
CO 9 4.5 8.8 0.04 9.5 NE 1 4.8 3.32 3.27 12.2 0
NE 2 5.3 2.31 3.47 11.7 0 NE 4 6.5 4.1 3.08 10 2
KS 3 2.3 11.6 3 KS 4 3 8 0 NM 3 2.41
7.6
7.7
7.8
7.1
Calcareous Loam, Silt Loam, Silty Clay Loam, Clay Loam
ND 5 2.6 6.59 ND 6 1.54 15.52
6.9 6.3
7.3 7.3
7.5 6
0.67 5.79 7.4
0 2.18 6.1
0 2 5.8
1.45 4.32 7.6 2.42 1.51 7.8
1.01
0.67 1.7
1.06
1.55
2.08
1.24
5.94 1.29
7.4
7.9 6.6
6.1
7.3
7.5 6.4
7.9 8
*No data for samples judged to have negligible soluble salt. '•Indicates 1 mm dry layer on a saturated wet soil. $WEG 4L category

12,652 GILLETTE: THREStIOLD FRICTION VELOCITIES FOR AGRICULTURAL DUST EMISSION
TABLE 4. Vegetative Residue for Soil Samples
Soil Type Soil Sample Residue
Sand
Loamy sand
TX 1 26.7 TX 2 8.3
TX 4 91.6 TX5 19.1
TX 3 3.67 TX7 161
TX 8 39
Sandy loam TX 6 161
Clay TX 9 2.9
Clay loam CO 1 33.6
All samples not mentioned in this table had negligible vegetative residue.
used as a measure of the hardness of crust or its resistance to
change. It was determined by the method described by Richards [1953] and was obtained after carefully transporting a field crust to the laboratory and cutting it to the dimensions specified by Richards.
4. THRESHOLD FRICTION VELOCITIES FOR SMOOTH-LOOSE, CLODDY, AND CRUSTED SOILS VERSUS SOIL TEXTURES
Table 6 summarizes the threshold friction velocity data given in Table 5 as mean friction •reshold velocities, mean percentages of soil aggregates smaller than 1 mm, average stability for both smooth-loose and cloddy samples, and modulus of rupture. In comparing the percentages of material smaller than 0.84 mm in Table 1 with the percentage of mass smaller than 1 mm in Table 6, there is general agreement for the smooth-loose soils of Table 6 with Table 1 values. The agreement breaks
down for the sandy clay loam and silt loam textures. Since these textures represent only three samples in Table 6, however, it is possible that our samples are biased to more aggregated conditions. For cloddy soils our values in Table 6 for percentage of soil mass smaller than 1 mm are much lower than the values
given in Table 1. This may simply show a concern by the authors of Table 1 for more highly erodible soils, hence soils of the smooth-loose classification.
Table 6 shows that the mean modulus of rupture for soil crusts is very low for sand textures and much higher for all other textures. Crusts having moduli of rupture larger than 0.5 and thicknesses of 1 cm or more are efficient in preventing wind erosion for most winds.
Stability of dry aggregates larger than 1 mm was fairly high (>40%) for all textures except silty clay, silty clay loam, and the calcareous soils making up WEG 4L (see Table 1). Such clod stability for almost all soils textures makes the clod-destructive properties of rainfall very important in wind erosion, since cloddy soils are fairly resistant to wind erosion.
With increasing erodibility, according to soil texture, the threshold friction velocities of Table 5 generally decrease as the WEG erosion indices decrease. Thus sand is the most erodible
soil texture for both Tables 1 and 6. The textures sand, loamy sand, sandy loam, clay and silty clay are the most erodible for both Tables 1 and 6, whereas the textures clay loam, silty clay loam, silt loam, and sandy clay loam are considerably less erodible.
The effect of composition is extremely important as seen in two cases. First, the desert clay-textured soils, as investigated by Gillette et al. [1982] were crusted and extremely nonerodible. The clay-textured soils investigated here were highly erodible and were almost smooth-loose following a dry winter in both North Dakota and Texas. The principal difference in the clay soils of the desert and of North Dakota/Texas seems to be the low
organic content in the desert clay soils and a higher than 5% organic content in the North Dakota/Texas clay soils. An
TABLE 5. Observed Threshold Friction Velocities and Other Wind Erosion Parameters for the Sampled Soils
u,t, cm s -1 Mode, mm Percent < 1 mm Stability, % Crest Modulus Soil Thickness, of Rupture,
Sample Loose Crusted Cloddy Loose Cloddy Loose Cloddy Loose Cloddy cm bars
TX1
TX2 TX4
TX5 TUN 1
CA 1 CA2
CA3 TX10
TX3 TX7 TX8
TUN 2
KS 1
CO 7*
CO 11
Sand Texture
25 <0.42 95 74.2 25 <0.42 98.9 7.1 30 <0.42 95.9 22.6 30 <0.42 98.8 42.9 22 90 <0.42 96.7 56.5 37 <0.375
22
42
22
42 9O
152
4O
67
75
85
lOO 30
<0.42
<0.42
0.3
0.43
22
Loamy Sand Texture
81.5
60
53
91.5
63.2
62.7
51.7
49
(14.8) crust
rocks
84.6 <1
75
73.1
0
0.6
0.64
0.2
neg. 0
neg. 0.03
0.29
0.7
GILLETTE: THRESHOLD FRICTION VELOCITIES FOR' AGRICULTURAL DUST EMISSION 12,653
TABLE 5. (continued)
Soil
Sample
-1
U,t , •Tn S
Loose Crusted Cloddy
Mode, mm
Loose Cloddy
Percent <1 mm Stability, %
Loose Cloddy Loose Cloddy
Crust Thickness
Modulus
of Ruptu re bars
TUN 3 CO 12
NE 8
CO 8
CO 10 TX6
NE 6
NE 7t
22 >90 20
44 >63
290
>336
>164
TX 9 35-60 >204 NM 1 > 150
ND 7 68 > 150 TUN 4 > 100
132
>89
>60
78
>150
<0.47 0.43
<1
crest
0.22
0.75
0.61
1.5
ND 2 56 > 150 > 150, 0.43 wet
Sandy Loam Texture
69.8 1.7
71 8.7
100 36.7
62.4
Clay Texture
2.5 9.3
54 84.2 1.62 30.9
Silty Clay Texture
94
Clay Loam Texture
CO 1 > 109, 54 46.9 WW
CO 3 89 (89) 0.43 3.4 CO 4 61 (61) 0.61 49.3 CO 5 57 (57) >109 0.43 16 57.3 23.3 CO 6 61 (61) 0.43 99.7 KS 2 70 120 0.43 100 67.6 0.982 NM 2 >100 TUN 6 > 100
89.5 80.4 rocks rocks
70.4
83, lab
12.8
46.1
38.5
43.2
81.3
93.2 crest
91 rocks
96.6
95.52
10.2
72.7
70.7
87.7 21.8 56.6
Silty Clay Loam Texture
ND 1 64 >150, >150 0.61 81.8 12.4 3 wet
Silt Loam Texture
0.6
3
0.5
3
0.89 3
2.5
0.5
0.92 2
NE 5 124 >200 >200 1.2 10 25.9 15.4 75.8 72.3 1 NE 3 92 > 159 260 10 54 20 6.1 54 82.8 3 ND 3 >302 36.3 2.27 ND 4 >138 51.5 2
TUN 5
Sandy Clay Loam Texture
>100 26.7 59.6 84.5 2
Loam Texture
CO 2 >109 25 13.1 61.6 CO 9 261 0.75 0.3 NE 1 91 >200 >197 10 16 39.6 7.3 69 83.2 3 NE 2 75 >258 >222 6 26 24.4 13.7 83.9 60.5 3 NE 4 72 >200 >250 1.7 10 63.6 10.8 64.3 62.2 3 KS 3 86.5 0.3 78.1 88 KS 4 67 0.15 48 62.9 NM 3 > 100 0.99
Calcareous Loam, Silt Loam, Silty Clay Loam, Clay Loam
ND 5 71.2 (71.2) 11.1 1.25 ND 6 > 100, 15 2
wet
0.75
0.04
0.26
0.62
0.62
0.87
20, lab 16.9, lab
0.12
O.68
0.34
1.14
0.45 0.9
1.01
0.78
0.62
0.72 0.83
0.38
0.73
0.22
O.45
Figures in parentheses indicate 1 mm dry layer on a saturated wet soil; WW stands for winter wheat (live plants in soil); neg, negligible. *Threshold estimated fromwind records more than 2 km from site.
•'Soil contained shale fragments--not really cloddy but loose mixed with gravel-sized particles. $WEG 4L category.
12,654 GILLETTE: THRESHOLD FRICTION VELOCITIES FOR AGRICULTURAL DUST EMISSION
TABLE 6. Mean Threshold Friction Velocities for Three Soil Conditions, Stability, Modulus of Rupture, and Other Wind Erosion Parameters, for Various Textures
Texture
u, t, cm s -t Percent < 1 mm Average Modulus Stability, of Rupture,
Loose Crusted Cloddy Loose Cloddy % bars
Sand 28.2 65.7 75 97.06 30 48 0.03
Loamy sand 33.6 103 85 74 53 62.3 0.5 Sandy loam 28.7 290 105 70.4 35.9 87.1 0.42 Clay 54.3 >200 > 150 57.6 5.5 86.4 0.75 Silty clay 56 94 12.8 Clay loam 67.6 120 > 109 72.3 18.6 45 0.38 Silty clay 64 > 150 81.8 12.9
loam
Silt loam 108 >150 >200 23 10.8 60.7 0.8
Sandy clay > 100 26.7 72.1 0.78 loam
Loam 78.3 > 150 > 150 50.7 11.2 70.6 0.66
Calcareous 71.2 > 100 > 100 13.1 0.34
loam, silt loam, silty clay loam, clay loam
example of a desert clay soil is NM 1; examples of North Dakota and Texas clay soils are ND 7 and TX 9. A wider ranging study of the disaggregation of clay soils is under way (R. Breuninger, D.A. Gillette, and R. Kihl, manuscript in preparation, 1988).
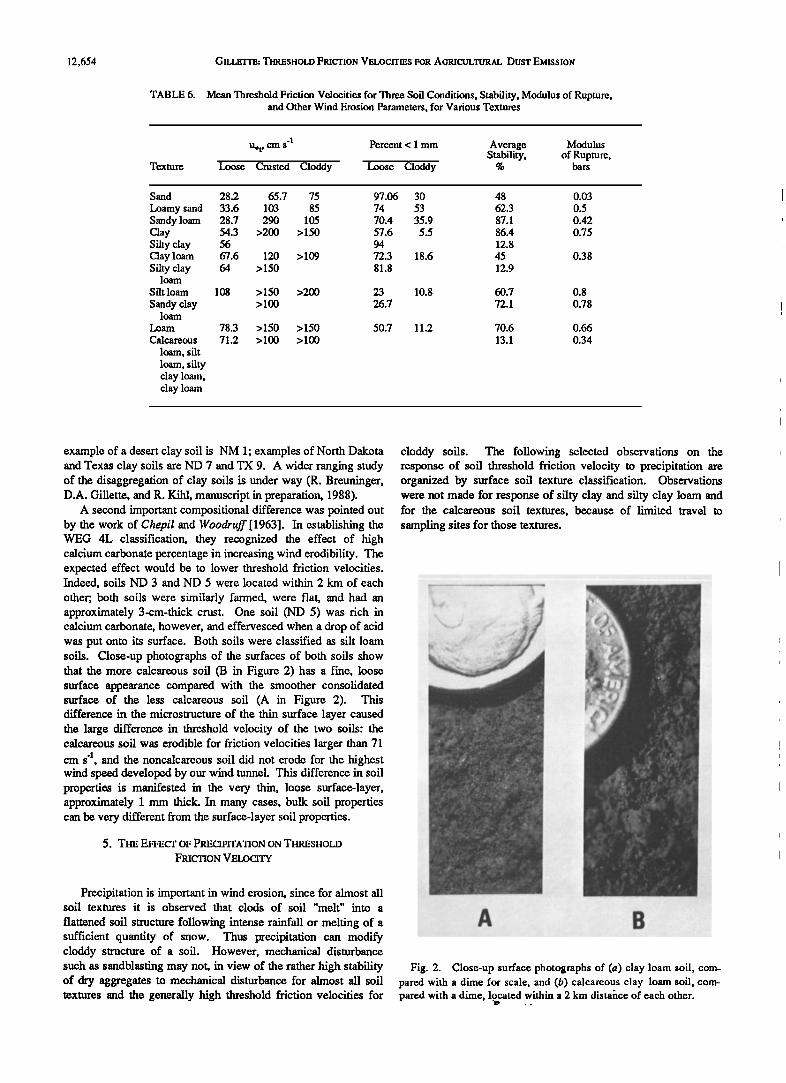
A second important compositional difference was pointed out by the work of Chepil and Woodruff[1963]. In establishing the WEG 4L classification, they recognized the effect of high calcium carbonate percentage in increasing wind erodibility. The expected effect would be to lower threshold friction velocities. Indeed, soils ND 3 and ND 5 were located within 2 km of each
other; both soils were similarly farmed, were flat, and had an approximately 3-cm-thick crust. One soil (ND 5) was rich in calcium carbonate, however, and effervesced when a drop of acid was put onto its surface. Both soils were classified as silt loam soils. Close-up photographs of the surfaces of both soils show that the more calcareous soil (B in Figure 2) has a fine, loose surface appearance compared with the smoother consolidated surface of the less calcareous soil (A in Figure 2). This difference in the microstructure of the thin surface layer caused the large difference in threshold velocity of the two soils: the calcareous soil was erodible for friction velocities larger than 71 cm s 4, and the noncalcareous soil did not erode for the highest wind speed developed by our wind tunnel. This difference in soil properties is manifested in the very thin, loose surface-layer, approximately 1 mm thick. In many cases, bulk soil properties can be very different from the surface-layer soil properties.
5. THE EFFECT OF PRECIPITATION ON THRESHOLD
FRICTION VELOCITY
Precipitation is important in wind erosion, since for almost all soil textures it is observed that clods of soil "melt" into a
flattened soil structure following intense rainfall or melting of a sufficient quantity of snow. Thus precipitation can modify cloddy structure of a soil. However, mechanical disturbance such as sandblasting may not, in view of the rather high stability of dry aggregates to mechanical disturbance for almost all soil textures and the generally high threshold friction velocities for
cloddy soils. The following selected observations on the response of soil threshold friction velocity to precipitation are organized by surface soil texture classification. Observations were not made for response of silty clay and silty clay loam and for the calcareous soil textures, because of limited travel to
sampling sites for those textures.
Fig. 2. Close-up surface photographs of (a) clay loam soil, com- pared with a dime for scale, and (b) calcareous clay loam soil, com- pared with a dime, located within a 2 km distahce of each other.
GILLETTE: THRESHOLD FRICTION VELOCITIES FOR AGRICULTURAL DUST EMISSION 12,655
7.00
6.00
5.00 -
4.00 -
3.00 -
2.00 -
1.00 -
0.00 i i I i I I I I I
May Jun Jul Au• Sep Oct Nov De• Jan Feb MaP Apr May Jun Jul
May 85- July 80 [] MOD. RUP. + THICKNESS • RAIN
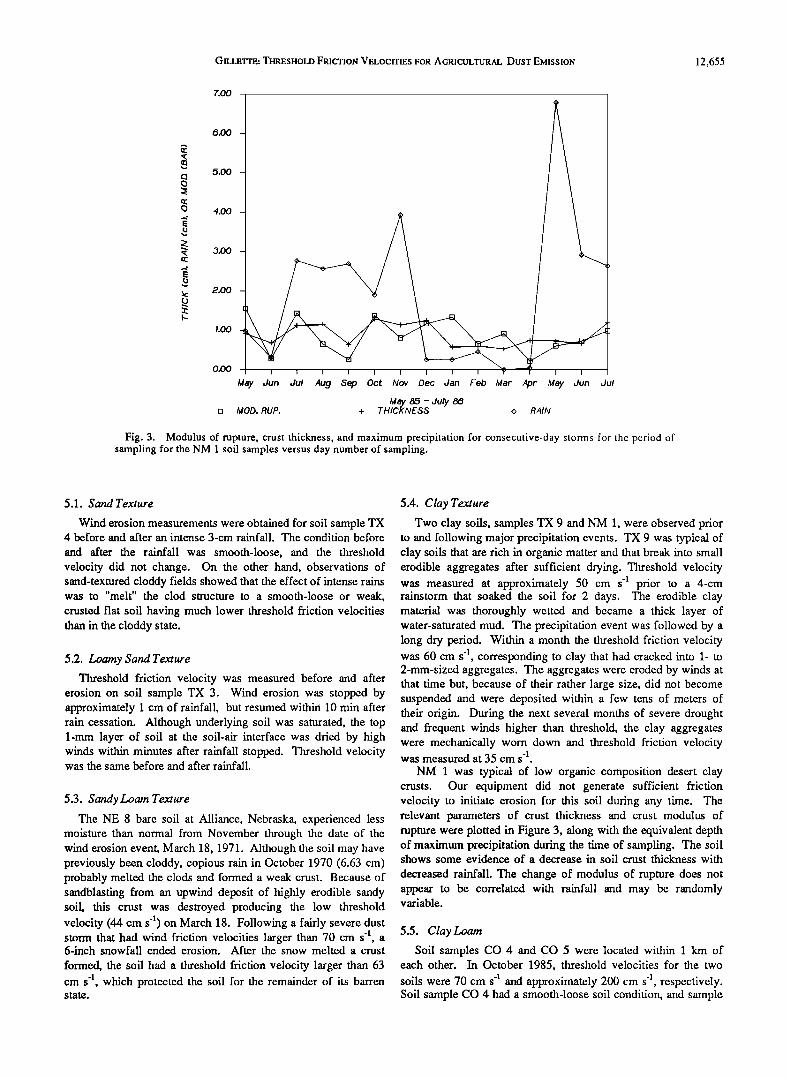
Fig. 3. Modulus of rupture, crust thickness, and maximum precipitation for consecutive-day storms for the period of sampling for the NM 1 soil samples versus day number of sampling.
5.1. Sand Texture
Wind erosion measurements were obtained for soil sample TX 4 before and after an intense 3-cm rainfall. The condition before
and after the rainfall was smooth-loose, and the threshold
velocity did not change. On the other hand, observations of sand-textured cloddy fields showed that the effect of intense rains was to "melt" the clod structure to a smooth-loose or weak,
crusted flat soil having much lower threshold friction velocities than in the cloddy state.
5.2. Loamy Sand Texture
Threshold friction velocity was measured before and after erosion on soil sample TX 3. Wind erosion was stopped by approximately 1 cm of rainfall, but resumed within 10 min after rain cessation. Although underlying soil was saturated, the top 1-mm layer of soil at the soil-air interface was dried by high winds within minutes after rainfall stopped. Threshold velocity was the same before and after rainfall.
5.3. Sandy Loam Texture
The NE 8 bare soil at Alliance, Nebraska, experienced less moisture than normal from November through the date of the wind erosion event, March 18, 1971. Although the soil may have previously been cloddy, copious rain in October 1970 (6.63 cm) probably melted the clods and formed a weak crust. Because of sandblasting from an upwind deposit of highly erodible sandy soil, this crust was destroyed producing the low threshold velocity (44 cm s 4) on March 18. Following a fairly severe dust storm that had wind friction velocities larger than 70 cm s 4, a 6-inch snowfall ended erosion. After the snow melted a crust
formed, the soil had a threshold friction velocity larger than 63 cm s 4, which protected the soil for the remainder of its barren state.
5.4. Clay Texture
Two clay soils, samples TX 9 and NM 1, were observed prior to and following major precipitation events. TX 9 was typical of clay soils that are rich in organic matter and that break into small erodible aggregates after sufficient drying. Threshold velocity was measured at approximately 50 cm s 4 prior to a 4-cm rainstorm that soaked the soil for 2 days. The erodible clay material was thoroughly wetted and became a thick layer of water-saturated mud. The precipitation event was followed by a long dry period. Within a month the threshold friction velocity was 60 cm s 4 corresponding to clay that had cracked into 1- to 2-mm-sized aggregates. The aggregates were eroded by winds at that time but, because of their rather large size, did not become suspended and were deposited within a few tens of meters of their origin. During the next several months of severe drought and frequent winds higher than threshold, the clay aggregates were mechanically worn down and threshold friction velocity was measured at 35 cm s 4.
NM 1 was typical of low organic composition desert clay crusts. Our equipment did not generate sufficient friction velocity to initiate erosion for this soil during any time. The relevant parameters of crust thickness and crust modulus of rupture were plotted in Figure 3, along with the equivalent depth of maximum precipitation during the time of sampling. The soil shows some evidence of a decrease in soil crust thickness with
decreased rainfall. The change of modulus of rupture does not appear to be correlated with rainfall and may be randomly variable.
5.5. Clay Loam
Soil samples CO 4 and CO 5 were located within 1 km of each other. In October 1985, threshold velocities for the two
soils were 70 cm s 4 and approximately 200 cm s 4, respectively. Soil sample CO 4 had a smooth-loose soil condition, and sample
12,656 GILLETTE: THRESHOLD FRICTION VELOCITIES FOR AGRICULTURAL DUST EMISSION
350 .
03 300 - \
b :250 -
:200 ..••
150 -
I00 -
5O
0 I • • • • 0 :2 4
CUMULATIVE RAINFALL (cm)
[] NE 1 + NE :2 o NE 3 A NE 4 x CO 4 v CO 5
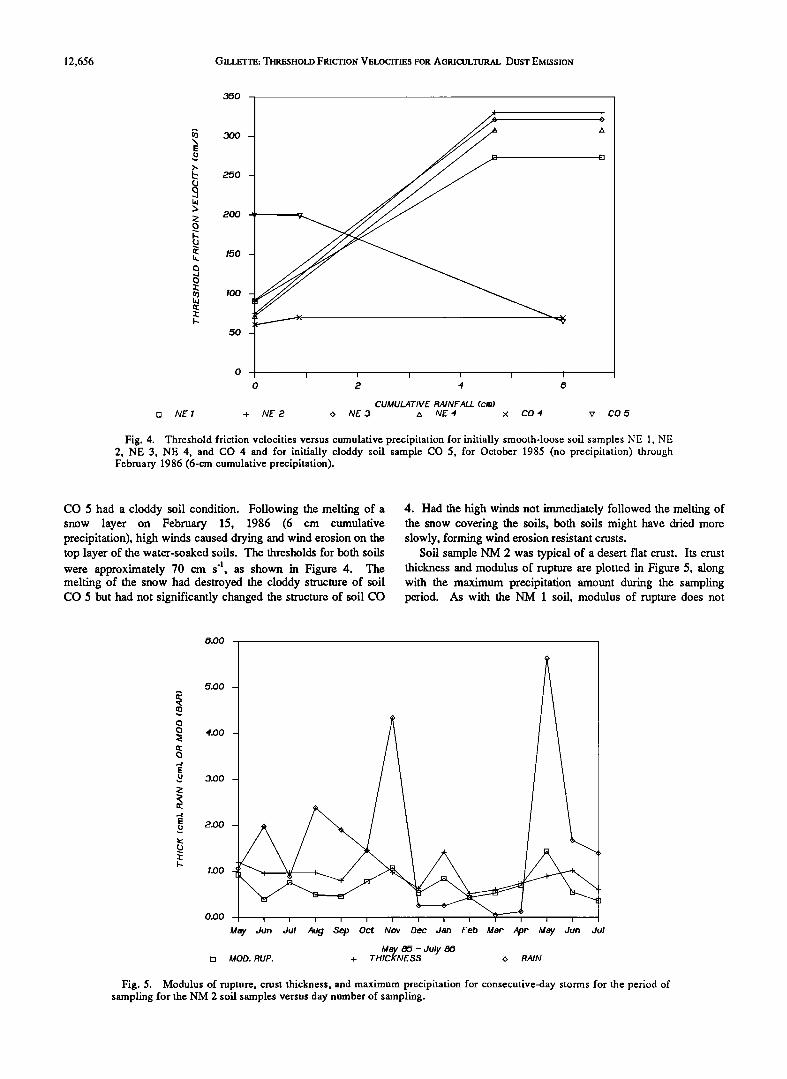
Fig. 4. Threshold friction velocities versus cumulative precipitation for initially smooth-loose soil samples NE 1, NE 2, NE 3, NE 4, and CO 4 and for initially cloddy soil sample CO 5, for October 1985 (no precipitation) through February 1986 (6-cm cumulative precipitation).
CO 5 had a cloddy soil condition. Following the melting of a snow layer on February 15, 1986 (6 cm cumulative precipitation), high winds caused drying and wind erosion on the top layer of the water-soaked soils. The thresholds for both soils were approximately 70 cm s 'l, as shown in Figure 4. The melting of the snow had destroyed the cloddy structure of soil CO 5 but had not significantly changed the structure of soil CO
4. Had the high winds not immediately followed the melting of the snow covering the soils, both soils might have dried more slowly, forming wind erosion resistant crusts.
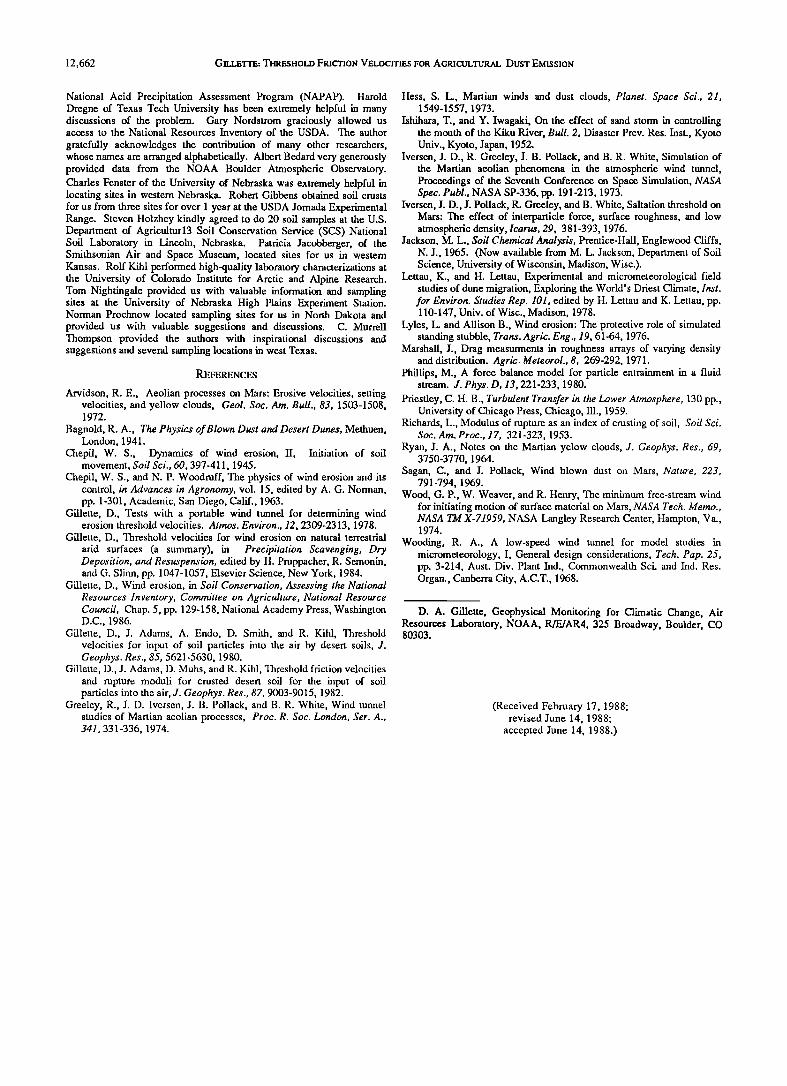
Soil sample NM 2 was typical of a desert flat crust. Its crust thickness and modulus of rupture are plotted in Figure 5, along with the maximum precipitation amount during the sampling period. As with the NM 1 soil, modulus of rupture does not
O.OO
5.00 -
4.00 -
3.00
:2.00
1.00 -•
O'OO I I I I
May Jun Jul Aug Sop Oct Nov Dec Jan Feb Mar Apr May Jun Jul
uay t•- Jury eo [] MOD, RUP, + THICKNESS •> RAIN
Fig. 5. Modulus of rupture, crust thickness, and maximum precipitation for consecutive-day storms for the period of sampling for the NM 2 soil samples versus day number of sampling.

GILLETTE: THRESHOLD FRICTION VELOCITIES FOR AGRICULTURAL DUST EMISSION 12,657
350 ..
300
250
200
150 -
I00 -
50 -
0 ,
0 œ 4 • 8 10 12 14 1•
CUMULATIVE RAINFALL (cm) [3 NE 1 + NE œ o NE 3 z• NE 4
Fig. 6. Threshold friction velocities for initially cloddy soil samples NE 1, NE 2, NE 3, and NE 4. The cloddiness was destroyed by rainfall and soil crusts were formed.
correlate with rainfall amount although crust thickness is weakly correlated with rainfall amount. Threshold velocity was never exceeded for this soil.
5.6. Silt Loam
Threshold friction velocity for soil sample NE 3 responded to cumulative rainfall, as shown in Figure 4. After a slow drying of the wetted soil that had initially been smooth-loose, following a 4-cm rainfall, the soil developed a crust that was resistent to wind erosion. The precipitation in the case shown in Figure 6 thus caused a great increase of the initial threshold friction velocity. It has been observed, however, that high winds following driving rain and clod destruction of silt loam and loam soils cause intense
wind erosion (Tom Nightingale, University of Nebraska, personal communication, 1986). This was also observed for the clay loam soil sample CO 5 by the authors. The rather ambiguous result that intense precipitation may be followed by intense wind erosion or by crusting and no erosion may be differentiated by the timing of the strong drying wind following wetting: if the wind occurs while the surface layer is still wet, wind erosion is possible; if it occurs after the soil crust has at least partially formed on the surface, wind erosion will probably be prevented.
When the initial soil condition was cloddy, a change toward a more crusted soil was observed. That is, after 6-cm accumulated rain moistened the clods on sample NE 3, the cloddy structure was destroyed and the soil became flatter and more crusted. In Figure 6 the threshold velocity, initially very high for the cloddy condition, remained very high for the crusted soil.
5.7. Loam Texture
Threshold friction velocities for soil samples NE 1, NE 2, and NE 4 are also shown in Figure 6, for initially cloddy conditions. As with soil sample NE 3, cloddy structure was destroyed by
rainfall and erosion-resistant crusts were formed, while smooth-loose structure (Figure 4) was aggregated into a crust that was very resistent to soil erosion. From our observations, the rainfall increased u. t for smooth-loose soils and maintained large threshold velocities for initially cloddy soils. For these same soils, however, observations of severe wind erosion following wetting of the soils have been made. We feel that the timing of the high wind follow'rag wetting of the loam soils is as important as for clay loam soils.
Crust thicknesses of soil samples NE 1, NE 2, and NE 4 are shown in Figure 7, along with data for sample NE 3 (a silt loam). Moduli of rupture for the same soils are shown in Figure 8. Figures 7 and 8 show thickening of the crusts, as rainfall accumulates on initially uncrusted soil, and decrease of modulus of rupture. Modulus of rupture was larger for the clods (accumulated rainfall is equal to zero in Figure 8) than it was for old crusts. This is probably caused by the more compacted soil condition of clods that are formed by moist soil being brought from below by plowing. These conditions may be contrasted with the changes of crust thickness and modulus of rupture with rainfall of the NM 3 soil sample shown in Figure 9. The NM 3 soil sample was initially crusted and flat and remained that way throughout the observations. Thickness of this desert crust seems to vary with rainfall, altho ..ugh the variation of modulus of rupture is not clearly correlated with rainfall.
5.8. Bulk Density
Bulk density, a soil parameter suggested by Robert Grossman (Soil Conservation Service, National Soil Laboratory) to be important in research on wind erosion of soil is shown for soil samples NE 1, NE 2, NE 3, and NE 4 for initially smooth-loose soils (same time frame as Figure 4) in Figure 10 and for initially cloddy soils (same time frame as Figure 6) in Figure 11. Initially smooth-loose soils were converted into crusted soils by the

12,658 GILLETTE: THRESHOLD FRICTION VELOCITIES FOR AGRICULTURAL DUST EMISSION
4 -
3.5
3 -
0 • 1
CUMULATIVE RAINFALL (cm) [] NE 1 + NE 2 o NE :3 z• NE 4
Fig. 7. Crust thickness versus accumulated rainfall for soil samples NE 1, NE 2, NE 3, and NE 4.
wetting and drying cycles associated with precipitation. As shown in Figure 10, the change in soil bulk density is not great. For initially cloddy soils, however, large air pockets between clods resulted in lower initial bulk density. The flattening, filling, and crust-forming processes associated with precipitation effectively increased soil bulk density, as seen in Figure 11. For the samples that were collected, the predictive value for threshold friction velocity of bulk density was not seen.
5.9. Synthesis of Observations on Effects of Precipitation
These observations on the effect of precipitation on threshold friction velocities were synthesized and are presented in Table 7. Table 7 gives ranges of threshold velocities before and after precipitation, using the data of Table 5 for sand, loamy sand, sandy loam, clay, loam, and silt loam. The precipitation effects for silty clay, silty clay loam, sandy loam, and for the four
4
CUMULATIVE RAINFALL (cm)
[] NE1 + NE 2 o NE 3 zx NE 4
Fig. 8. Modulus of rupture for soil samples NE 1, NE 2, NE 3, and NE 4 versus accumulated rainfall.

GILLETTE: THRESHOLD FRICTION VELOCITIES FOR AGRICULTURAL DUST EMISSION 12,659
7.00 ,
6.00 -
B.00 -
4.00 -
3.00 -
2.00 -
1.00 -
0.00
Ma/ Jun Jul Aug Sep Oct Nov Dec Jan Feb Mac Ape May Jun Jul
[] MOD. RUP. + TH/CKNESS o RAIN
Fig. 9. Modulus of rupture, crust thickness, and maximum precipitation for consecutive-day storms for the period of sampling for the NM 3 soil samples versus the day number of sampling.
calcareous textures of WEG 4L (calcareous loam, silt loam, clay loam, and silty clay loam) have been extrapolated. We felt justified in lumping silt loams with loam soils, because many of our sampled loam soils had been mapped in the field as silty loam soils. Indeed, the properties of the silt loam soils and the loam soils that we sampled did not differ greatly. Likewise, some of the clay-textured soils that we sampled were mapped as silty clay soils. We felt justified in lureping them, because of the
difficulty in recognizing the exact texture in soil mapping and because of similar soil properties that led to this difficulty in recognition.
6. EFFECT OF VEGETATION AND VEGETATIVE RESIDUE ON THRESHOLD FRICTION VELOCrFY
The values for threshold friction velocities in section 5 all
apply to situations of barren or effectively barren soil. The effect
œ
1.9 -
1.8 -
1.7 -
1.6 -
1.5 -
1.4 -
1.3 -
1.2 -
1.1 -
1 -
0.9 -
0.8 -
OJ -
0.• -
0.5 -
0.4 -
0.3 -
0.• -
0.1 -
0
0
o
CUMULATIVE RAINFALL (cm) [] NE 1 + NE 2 o NE 3 • NE 4
Fig. 10. Bulk density of soil samples NE 1, NE 2, NE 3, and NE 4 versus accumulated precipitation, in which the initial condition of the soil was smooth-loose. The time frame is the same as for Figure 4.

12,660 GILL•-TT•: THRESHOLD FRICTION V•.LOCITI•.S FOR A6mCULTURAL DUST EMISSION
1.8
1.7
1.6 -
2 4 6 • 10 1,= ø 14 16
CUMULATIVE RAINFALL (cm)
[] NE 1 + NE 2 o NE :3 A NE 4
Fig. 11. Bulk density of soil samples NE 1, NE 2, NE 3, and NE 4 versus accumulated precipitation, in which the initial condition of the soil was cloddy.
of vegetation or of vegetative residue is to absorb some of the momentum that otherwise would have gone into the work of moving soil particles. Theoretical analyses of this momentum partitioning and experimental investigations [e.g. Marshall, 1971] have shown that the effect of live or dead vegetation (nonerodible elements) is virtually another threshold. Because low concentrations of surface material have almost no effect on
erosion, and concentrations in excess of the amount needed to fully protect the soil have no erosion effect, and the difference in surface concentrations of live or dead vegetation between these two states is not large, we approximate the rather steep protective function of surface concentration of live or dead vegetation as a step function, that is, as a threshold. Presence of the material above a certain concentration stops wind erosion; presence of the vegetative material below the threshold concentration does not alter the erosion physics substantially.
For the present study we have observed several eroding fields and have noted the following threshold vegetative residue amounts for specific crops: 1500 lb/acre (168 gin-2), soybeans, peanuts, cotton; 750 lb/acre (84 gm'2), any grain crop including corn; and grass, wheat, barley, hay, sorghum, vegetable crops. It should be noted that none of the vegetative residues measured for the soil samples in this paper was greater than these threshold values. Indeed, the effect of the vegetative residue was nil. Vegetative residue cover (grass) for soil sample TX 4 was 92% of the threshold surface concentration but soil erosion fluxes
were virtually the same as for soil samples TX 1 and TX 2, which had much smaller surface concentrations of vegetative residue. Soil sample TX 7 was near the threshold for cotton residue, but again fully developed erosion occurred. For highly erodible loose soils observed by us as having vegetative residue exceeding these thresholds, however, erosion was effectively prevented. Observations of vegetative residue in eroding and noneroding fields as well as the experimental results of Marshall [1971] and of Lyles and Allison [1976] point to the importance of
the geometry of the residue: height of stubble, area covered, etc. Indeed, research being pursued by us on the effects of nonerodible spherical particles mixed with erodible spherical particles has emphasized the complexity and importance of this area of research.
Presence of live vegetation usually precludes active wind erosion damage. Such a situation was present in sample CO 1, where winter wheat plants effectively prevented wind erosion for friction velocities in excess of 90 cm s 4. In some cases, however, such as sample NE 6, winter wheat was not sufficient to prevent wind erosion damage caused by sand incursion from an upwind flat sandy area having a low friction threshold velocity. Indeed, several observers have noted that wind erosion often spreads into agricultural fields from upwind eroding areas, such as unpaved roads, barrow pits, or other agricultural fields. Several examples have been noted of erosion taking place in fields having sufficient cloddiness to prevent erosion, or in fields having sufficient vegetative residue to prevent erosion, by the incursion of sandblasting sand from an upwind source having a low threshold friction velocity.
7. EFFECT OF AGRICULTURAL PRACTICES ON THRESHOLD FRICTION VELOCITY
Agricultural methods have been designed and developed to minimize wind erosion and to conserve soil moisture. Those
methods, along with an evolution toward larger farms, more powerful farm machinery, and an economy that avoids the widespread economic depression, such as that of the disastrous 1930's dust bowl help to avoid widespread and long term intense wind erosion. Agricultural practices that alleviate wind erosion are as follows: (1) Fallowing of fields, (2) shelterbelts, (3) cover crops, (4) deep plowing, (5) irrigation, and (6) minimum fillage.
Fallowing offields. To conserve soil moisture, many fields are left fallow (dormant), with vegetative residue protecting its

GILLETTE: TttRESHOLD FRICTION VELOCITIES FOR AGRICULTURAL DUST E/mSS•ON 12,661
TABLE 7. Change in Threshold Velocity u,. (cm s -1) Caused by Intense Rainfall or Melting of Snow Followed by Dry•ing, for Three Initial Soil Conditions
Loose, Erodible Cloddy, Resists Erosion Crusted, Resists Erosion
Texture Change U, t U, t U, t U, t U, t U, t
Before After Change Before After Change Before After
Sand none 20-30 20-30 clods >100 20-30 none 30-40 30-40 melt
Loamy sand none 25-35 25-35 clods >100 20-30 none 30-4 30-40 melt
Sandy loam crust 25-45 >70 melt, > 100 >70 none >70 >70 forms crust
Clay* crust 40-70 200->70 melt, >100 >100 none >100 >100 forms crust
Silty clay crust 40-70 200->70 melt, >100 >100 none >100 >100 forms crust
Silty clay crust 60-90 150t melt, >100 >100 none >100 >100 loam forms crust
Silt loam crust 60-110 150t melt, >100 >100 none >100 >100 forms crust
Sandy clay crust 60-90 150't melt, > 100 > 100 loam forms crust
Loam crust 60-90 150• melt >100 >100 none >100 >100 forms
Calcareous crust 70 150•' melt > 1 O0 > 1 O0 none > 1 O0 > 1 O0 limey loam, forms silt loam, silty clay loam, clay loam
Values of u,t are in centimeters per second. *Clay must be distinguished between that high in organics (mollisolic) or that low in organic (as in arid
regions). •'High winds during the drying process cause drying and erosion of a thin surface layer and much dust
production, while the remaining soil is saturated with water.
surface. In western Nebraska, for example, fallowing typically takes place every third year. By vegetative decay and farm tillage operations, the residue is gradually reduced. In some cases, it is reduced to less than the amount needed for wind
erosion protection. Shelterbelts. Shelterbelts were heavily planted during dust
bowl crises of the 1930's and 1950's in several states in order to
reduce the effect of wind by providing a sheltered area, of a width equivalent to about 10 times the tree heights. They are still widely used in such states as North Dakota and Nebraska.
Cover crops. A temporary "cover crop" is planted in certain areas such as North Dakota during periods of high wind-erosion hazard. This practice takes advantage of the protective properties of live plants in preventing wind erosion. The cover crops are subsequently plowed under and fields are replanted for the next growing season.
Deep plowing. In areas of sandy soils, such as west Texas, deep plowing is used to bring up soil richer in clay and moisture, so that the high threshold velocities of cloddy soil reduce wind erosion.
Irrigation. Irrigation prevents much wind erosion for nonsandy dry soils in areas where the water table has not been depleted, such as western Kansas and western Nebraska. Unfortunately, in certain areas the aquifer is virtually depleted, and irrigation is no longer economically viable.
Minimum tillage. Methods have been developed, such that residue from the previous crop is not plowed under. Such practices maximize the protective effect of standing vegetative residue.
8. EFFE• OF A PROLONGED DROUGHT ON THRESHOLD
FRICTION VELOCITY
The effect of a prolonged drought would be to reduce vegetative residue from a given crop and reduce soil moisture levels. With the same farming operations, less soil moisture would result in reduced cloddiness of the soil. A combination of
reduced cloddiness, less vegetative residue, and reduced crusting of the soil would result in lower threshold friction velocities and,
for the same distribution of wind speeds, increased wind erosion.
9. CONCLUSIONS
We organized threshold friction velocities for agricultural soils according to texture of the surface soil. Soil composition was used to organize the soils for clay and silty clay textures with respect to organic-rich and organic-poor soils. Calcareous loams, silt loams, silty clay loams and clay loams (soils of the WEG 4L classification) were distinguished from noncalcareous soils of the same textural classes. Threshold friction velocities increase from
a minimum for sand textures to a maximum for loamy soils. The effects of wetting the soils by precipitation is minimal for the low threshold velocity soils and high for the high threshold velocity soils. The timing of high, drying winds after thorough soil wetting is critical for loamy soils. If the wind occurs while the soil is still wet, wind erosion is quite likely to occur; if it follows after surface crusting has taken place, wind erosion is avoided. A summary of results appears in Tables 6 and 7.
Acknowledgments. This work has been supported by The National Oceanic and Atmospheric Administration (NOAA) as part of the
12,662 GILLETTE: THRESHOLD FRICTION VELOCITIES FOR AGRICULTURAL DUST EMISSION
National Acid Precipitation Assessment Program (NAPAP). Harold Dregne of Texas Tech University has been extremely helpful in many discussions of the problem. Gary Nordstrom graciously allowed us access to the National Resources Inventory of the USDA. The author gratefully acknowledges the contribution of many other researchers, whose names are arranged alphabetically. Albert Bedard very generously provided data from the NOAA Boulder Atmospheric Observatory. Charles Fenster of the University of Nebraska was extremely helpful in locating sites in western Nebraska. Robert Gibbens obtained soil crusts for us from three sites for over 1 year at the USDA Jomada Experimental Range. Steven Holzhey kindly agreed to do 20 soil samples at the U.S. Department of Agricultur13 Soil Conservation Service (SCS) National Soil Laboratory in Lincoln, Nebraska. Patricia Jacobberger, of the Smithsonian Air and Space Museum, located sites for us in westem Kansas. Rolf Kihl performed high-quality laboratory characterizations at the University of Colorado Institute for Arctic and Alpine Research. Tom Nightingale provided us with valuable information and sampling sites at the University of Nebraska High Plains Experiment Station. Norman Prochnow located sampling sites for us in North Dakota and provided us with valuable suggestions and discussions. C. Murrell Thompson provided the authors with inspirational discussions and suggestions and several sampling locations in west Texas.
REFERENCES
Arvidson, R. E., Aeolian processes on Mars: Erosive velocities, setting velocities, and yellow clouds, Geol. Soc. Am. Bull., 83, 1503-1508, 1972.
Bagnold, R. A., The Physics of Blown Dust and Desert Dunes, Methuen, London, 1941.
Chepil, W. S., Dynamics of wind erosion, II, Initiation of soil movement, Soil Sci., 60,397-411, 1945.
Chepil, W. S., and N. P. Woodruff, The physics of wind erosion and its control, in Advances in Agronomy, vol. 15, edited by A. G. Norman, pp. 1-301, Academic, San Diego, Calif., 1963.
Gillette, D., Tests with a portable wind tunnel for determining wind erosion threshold velocities. Atmos. Environ., 12, 2309-2313, 1978.
Gillette, D., Threshold velocities for wind erosion on natural terrestrial arid surfaces (a summary), in Precipitation Scavenging, Dry Deposition, and Resuspension, edited by H. Pruppacher, R. Semonin, and G. Slinn, pp. 1047-1057, Elsevier Science, New York, 1984.
Gillette, D., Wind erosion, in Soil Conservation, Assessing the National Resources Inventory, Committee on Agriculture, National Resource Council, Chap. 5, pp. 129-158, National Academy Press, Washington D.C., 1986.
Gillette, D., J. Adams, A. Endo, D. Smith, and R. Kihl, Threshold velocities for input of soil particles into the air by desert soils, J. Geophys. Res., 85, 5621-5630, 1980.
Gillette, D., J. Adams, D. Muhs, and R. Kihl, Threshold friction velocities and rapture moduli for crusted desert soil for the input of soil particles into the air, J. Geophys. Res., 87, 9003-9015, 1982.
Greeley, R., J. D. Iversen, J. B. Pollack, and B. R. White, Wind tunnel studies of Martian aeolian processes, Proc. R. Soc. London, Ser. A., 341, 331-336, 1974.
Hess, S. L., Martian winds and dust clouds, Planet. Space Sci., 21, 1549-1557, 1973.
Ishihara, T., and Y. Iwagaki, On the effect of sand storm in controlling the mouth of the Kiku River, Bull. 2, Disaster Prey. Res. Inst., Kyoto Univ., Kyoto, Japan, 1952.
Iversen, J. D., R. Greeley, J. B. Pollack, and B. R. White, Simulation of the Martian aeolian phenomena in the atmospheric wind tunnel, Proceedings of the Seventh Conference on Space Simulation, NASA Spec. Publ., NASA SP-336, pp. 191-213, 1973.
Iversen, J. D., J. Pollack, R. Greeley, and B. White, Saltation threshold on Mars: The effect of interparticle force, surface roughness, and low atmospheric density, Icarus, 29, 381-393, 1976.
Jackson, M. L., Soil Chemical Analysis, Prentice-Hall, Englewood Cliffs, N.J., 1965. (Now available from M. L. Jackson, Department of Soil Science, University of Wisconsin, Madison, Wisc.).
Lettau, K., and H. Lettau, Experimental and micrometeorological field studies of dune migration, Exploring the World's Driest Climate, Inst. for Environ. Studies Rep. 101, edited by H. Lettau and K. Lettau, pp. 110-147, Univ. of Wisc., Madison, 1978.
Lyles, L. and Allison B., Wind erosion: The protective role of simulated standing stubble, Trans. Agric. Eng., 19, 61-64, 1976.
Marshall, J., Drag measurments in roughness arrays of varying density and distribution. Agric Meteorol., 8, 269-292, 1971.
Phillips, M., A force balance model for particle entrainment in a fluid stream. J. Phys. D, 13,221-233, 1980.
Priestley, C. H. B., Turbulent Transfer in the Lower Atmosphere, 130 pp., University of Chicago Press, Chicago, II1., 1959.
Richards, L., Modulus of rupture as an index of crusting of soil, Soil Sci. Soc. Am. Proc., 17, 321-323, 1953.
Ryan, J. A., Notes on the Martian yelow clouds, J. Geophys. Res., 69, 3750-3770, 1964.
Sagan, C., and J. Pollack, Wind blown dust on Mars, Nature, 223, 791-794, 1969.
Wood, G. P., W. Weaver, and R. Henry, The minimum free-stream wind for initiating motion of surface material on Mars, NASA Tech. Memo., NASA TM X-71959, NASA Langley Research Center, Hampton, Va., 1974.
Wooding, R. A., A low-speed wind tunnel for model studies in micrometeorology, I, General design considerations, Tech. Pap. 25, pp. 3-214, Aust. Div. Plant Ind., Commonwealth Sci. and Ind. Res. Organ., Canberra City, A.C.T., 1968.
D. A. Gillette, Geophysical Monitoring for Climatic Change, Air Resources Laboratory, NOAA, R•/AR4, 325 Broadway, Boulder, CO 80303.
(Received February 17, 1988; revised June 14, 1988;
accepted June 14, 1988.)