three studies examining the effects of psychological
TRANSCRIPT

University of Central Florida University of Central Florida
STARS STARS
Electronic Theses and Dissertations, 2004-2019
2015
Three Studies Examining the Effects of Psychological Distance on Three Studies Examining the Effects of Psychological Distance on
Judgment and Decision Making in Accounting Judgment and Decision Making in Accounting
Martin Weisner University of Central Florida
Part of the Accounting Commons
Find similar works at: https://stars.library.ucf.edu/etd
University of Central Florida Libraries http://library.ucf.edu
This Doctoral Dissertation (Open Access) is brought to you for free and open access by STARS. It has been accepted
for inclusion in Electronic Theses and Dissertations, 2004-2019 by an authorized administrator of STARS. For more
information, please contact [email protected].
STARS Citation STARS Citation Weisner, Martin, "Three Studies Examining the Effects of Psychological Distance on Judgment and Decision Making in Accounting" (2015). Electronic Theses and Dissertations, 2004-2019. 1316. https://stars.library.ucf.edu/etd/1316

THREE STUDIES EXAMINING THE EFFECTS OF PSYCHOLOGICAL DISTANCE ON
JUDGMENT AND DECISION MAKING IN ACCOUNTING
by
MARTIN M. WEISNER
B.S.B.A. University of Nevada, Las Vegas, 2001
M.B.A. Thunderbird School of Global Management, 2008
A dissertation submitted in partial fulfillment of the requirements
for the degree of Doctor of Philosophy
in the Kenneth G. Dixon School of Accounting
in the College of Business Administration
at the University of Central Florida
Orlando, Florida
Spring Term
2015
Major Professor: Steve G. Sutton

ii
ABSTRACT
This dissertation comprises three studies, a literature review and two experimental
studies, that center on the effects of psychological distance on judgment and decision-making in
accounting. Construal level theory (CLT) of psychological distance (Liberman and Trope 1998;
Trope and Liberman 2003), a framework recently developed in the field of social psychology,
constitutes the theoretical foundation for each study.
The first study reviews extant literature on CLT and illustrates the theory’s potential for
investigating previously unexplained phenomena within the accounting domain. Selected
publications that apply CLT in contexts that are of particular interest to accounting researchers
are emphasized and a series of broad, CLT-based research questions pertaining to various
accounting domains are offered. The second study applies CLT to the audit context by
investigating whether the performance of common auditing tasks that require varying degrees of
abstract thinking affect decision-makers’ overall mindset and hence their subsequent judgment.
Results from the second study have important implications for audit practice as auditors work in
environments that require frequent shifts in focus due to multiple client or project demands. The
third study applies CLT to the enterprise risk management context by examining how spatial
distance from a risk assessment object and risk category (i.e., the type of risk) affects decision-
makers’ assessment of the probability that the risk will materialize. The third study thus informs
the corporate governance literature by identifying psychological distance as a potential source for
judgment bias during the risk assessment process.
Overall, the results reported in this dissertation suggest that psychological distance
systematically affects individuals’ judgment subject to the caveat that the judgment of concern

iii
falls within the domain of the decision-maker’s routine cognition. By presenting empirical
evidence from both the audit and the risk management domain, the studies contribute to our
understanding of the heuristics and biases in judgment and decision-making in professional
settings that are of interest to accounting research.

iv
ACKNOWLEDGMENTS
Completion of this dissertation would not have been possible without considerable
assistance and support from numerous individuals. I would like to express my gratitude to my
committee members, Vicky Arnold, Sean Robb and Bill Messier for their helpful feedback,
support and patience throughout the entire dissertation process. Most importantly, I would like to
thank my dissertation chair, Steve Sutton, who guided and inspired me ever since I entered the
Ph.D. program. Both Steve and Vicky have been phenomenal mentors and academic role
models. Any accomplishments in my future academic career are due to their inspiration,
guidance and continued support.
Faculty members who provided critical assistance with my data collection efforts are
Anthony Amoruso, Darryl Allen, David Donnelly, Jeffrey Reinking, Kristina Demek, Lisa
Baudot, and Steven Hornik. I would like to thank them for their time and support and feel
privileged to consider them all my colleagues. I am also grateful to Margaret Clark for her
guidance throughout the statistical analysis process, to Yaacov Trope for providing a critical
experimental instrument, to Cheryl Wakslak for providing invaluable advice, and to the Institute
of Management Accountants (IMA) for financial support.
Lastly, I am grateful to doctoral students who offered insightful suggestions and
facilitated the recruitment of participants for my experiments. Specifically I would like to thank
Amy Donnelly, Anis Triki, Bonnie Brown, Bradley Lang, Irina Malaescu, Jared Eutsler, Jared
Koreff, Kazeem Akinyele, and Leif Bang.

v
TABLE OF CONTENTS
LIST OF FIGURES ....................................................................................................................... ix
LIST OF TABLES .......................................................................................................................... x
GENERAL INTRODUCTION ....................................................................................................... 1
Study One: Using Construal Level Theory to Motivate Accounting Research: A Literature
Review ......................................................................................................................................... 2
Study Two: The Impact of Construal Mindset Orientation on Auditors’ Probability Assessment
..................................................................................................................................................... 4
Study Three: The Impact of Spatial Distance and Risk Category on Probability Assessment ... 6
Overall Contribution ................................................................................................................... 7
References ................................................................................................................................... 9
STUDY ONE: USING CONSTRUAL LEVEL THEORY TO MOTIVATE ACCOUNTING
RESEARCH: A LITERATURE REVIEW .................................................................................. 11
Introduction ............................................................................................................................... 11
Basic Research on Construal Level Theory .............................................................................. 16
Selected Applications of Construal Level Theory .................................................................... 25
Research on Temporal Distance ............................................................................................ 25
Research on Spatial Distance ................................................................................................ 29
Research on Social Distance.................................................................................................. 31
Research on Hypotheticality .................................................................................................. 32
Overall Mindset Implications of Psychological Distance ..................................................... 33
CLT-Informed Accounting Research .................................................................................... 38
Implications for Accounting Research ...................................................................................... 42
Accounting Information Systems (AIS) ................................................................................ 44
Audit ...................................................................................................................................... 45

vi
Financial and Managerial Accounting ................................................................................... 47
Tax ......................................................................................................................................... 52
Conclusion ................................................................................................................................. 53
References ................................................................................................................................. 55
Tables ........................................................................................................................................ 64
STUDY TWO: THE IMPACT OF CONSTRUAL MINDSET ORIENTATION ON
AUDITORS’ PROBABILITY ASSESSMENT ........................................................................... 85
Introduction ............................................................................................................................... 85
Background ............................................................................................................................... 90
Theory and Hypotheses ............................................................................................................. 94
Research Method ..................................................................................................................... 103
Overview ............................................................................................................................. 103
Independent and Dependent Variables ................................................................................ 104
Experiment 1 ........................................................................................................................... 105
Participants .......................................................................................................................... 105
Experimental Procedures ..................................................................................................... 107
Manipulation Checks ........................................................................................................... 113
Debriefing Questions ........................................................................................................... 113
Results ................................................................................................................................. 114
Experiment 2 ........................................................................................................................... 119
Participants .......................................................................................................................... 119
Experimental Procedure ...................................................................................................... 121
Debriefing Questions ........................................................................................................... 124
Results ................................................................................................................................. 124
Additional Analyses ................................................................................................................ 128
Supplemental and Exploratory Measures ................................................................................ 132

vii
Conclusion ............................................................................................................................... 139
References ............................................................................................................................... 143
STUDY THREE: THE IMPACT OF SPATIAL DISTANCE AND RISK CATEGORY ON
PROBABILITY ASSESSMENT................................................................................................ 146
Introduction ............................................................................................................................. 146
Background ............................................................................................................................. 153
Theory and Hypotheses ........................................................................................................... 162
Experiment 1 ........................................................................................................................... 173
Participants .......................................................................................................................... 174
Experimental Procedures ..................................................................................................... 176
Manipulation Checks ........................................................................................................... 177
Debriefing Questions ........................................................................................................... 178
Results ................................................................................................................................. 178
Experiment 2 ........................................................................................................................... 180
Participants .......................................................................................................................... 181
Experimental Task ............................................................................................................... 184
Independent and Dependent Variables ................................................................................ 185
Manipulation Checks ........................................................................................................... 188
Debriefing Questions ........................................................................................................... 189
Results ................................................................................................................................. 190
Additional Analyses ............................................................................................................ 193
Conclusion ............................................................................................................................... 198
References ............................................................................................................................... 202
GENERAL CONCLUSION ....................................................................................................... 209
References ............................................................................................................................... 215
APPENDIX A: STUDY 2 - EXPERIMENT 1: CASES AND QUESTIONNAIRE ................. 216

viii
Condition 1: Abstract / Event .................................................................................................. 217
Condition 2: Abstract / Complement ...................................................................................... 233
Condition 3: Concrete / Event ................................................................................................. 249
Condition 4: Concrete / Complement ..................................................................................... 266
APPENDIX B: STUDY 2 – EXPERIMENT 2: CASES AND QUESTIONNAIRE ................. 283
Condition 1: Abstract / Event .................................................................................................. 284
Condition 2: Abstract / Complement ...................................................................................... 294
Condition 3: Concrete / Event ................................................................................................. 304
Condition 4: Concrete / Complement ..................................................................................... 314
APPENDIX C: STUDY 3 – EXPERIMENT 1: CASES AND QUESTIONNAIRE ................. 324
Condition 1 – Likely Risk ....................................................................................................... 325
Condition 2 – Unlikely Risk ................................................................................................... 331
APPENDIX D: STUDY 3 – EXPERIMENT 2: CASES AND QUESTIONNAIRE ................. 337
Condition 1: Proximate / Operational ..................................................................................... 338
Condition 2: Proximate / Non-Operational ............................................................................. 351
Condition 3: Remote / Operational ......................................................................................... 364
Condition 4: Remote / Non-Operational ................................................................................. 377
APPENDIX E: IRB APPROVALS ............................................................................................ 390

ix
LIST OF FIGURES
Figure 1: Overview of Construal Level Theory ............................................................................ 18
Figure 2: Expected Results - H1 ................................................................................................. 100
Figure 3: Expected Results - H2 ................................................................................................. 102
Figure 4: Experimental Procedures - Experiment 1 .................................................................... 112
Figure 5: Estimated Means - Experiment 1: H1 ......................................................................... 115
Figure 6: Estimated Means - Experiment 1: H2 ......................................................................... 117
Figure 7: Experimental Procedures - Experiment 2 .................................................................... 123
Figure 8: Estimated Means - Experiment 2: H1 ......................................................................... 125
Figure 9: Estimated Means - Experiment 2: H2 ......................................................................... 126
Figure 10: Risk Assessment Process........................................................................................... 161
Figure 11: Illustrative Risk Map ................................................................................................. 162
Figure 12: Expected Results - Experiment 2 .............................................................................. 173
Figure 13: Estimated Marginal Means - Experiment 2 ............................................................... 191

x
LIST OF TABLES
Table 1: Basic CLT Research & Related Syntheses ..................................................................... 64
Table 2: Temporal Distance Research .......................................................................................... 68
Table 3: Spatial Distance Research ............................................................................................... 73
Table 4: Social Distance Research ................................................................................................ 75
Table 5: Hypotheticality Research ................................................................................................ 77
Table 6: Construal Mindset Orientation Research ........................................................................ 78
Table 7: CLT-Informed Accounting Studies ................................................................................ 83
Table 8: Demographics - Experiment 1 ...................................................................................... 106
Table 9: Experimental Conditions - Experiment 1 ..................................................................... 112
Table 10: Results - Experiment 1: H1......................................................................................... 115
Table 11: Results - Experiment 1: H2......................................................................................... 119
Table 12: Demographics - Experiment 2 .................................................................................... 120
Table 13: Experimental Conditions - Experiment 2 ................................................................... 123
Table 14: Results - Experiment 2: H1......................................................................................... 125
Table 15: Results - Experiment 2: H2......................................................................................... 127
Table 16: Post-hoc Tests ............................................................................................................. 130
Table 17: Additional Questions .................................................................................................. 135
Table 18: Demographics - Experiment 1 .................................................................................... 175
Table 19: Results - Experiment 1................................................................................................ 180
Table 20: Demographics - Experiment 2 .................................................................................... 183
Table 21: Risk Factors - Experiment 2 ....................................................................................... 187
xi
Table 22: Results - Experiment 2................................................................................................ 192
Table 23: Individual Risk Factors - Experiment 2 ...................................................................... 194
Table 24: Additional Analyses - Experiment 2: Macroeconomic Risk Factors ......................... 195
Table 25: Additional Analyses - Experiment 2: Strategic Risk Factors ..................................... 197

1
GENERAL INTRODUCTION
Construal level theory (CLT) of psychological distance (Liberman and Trope 1998;
Trope and Liberman 2003) has been recognized as a prominent contemporary social psychology
theory and comprehensive framework for judgment and decision-making that shows potential to
further the growing academic inquiry into behavioral decision theory and social cognition
(Fiedler 2007). The three studies incorporated in this dissertation are built around this theory.
According to CLT, the notion of psychological distance signifies a mutual meaning
shared by four related distance dimensions: temporal distance, social distance, spatial distance,
and hypotheticality (i.e., distance from actuality). The fundamental idea is that psychological
distance is tied to the level of mental construal (i.e., mental representation) such that more distant
objects (or situations) are construed at a higher level and higher-level construals evoke thoughts
of more distant objects (Trope and Liberman 2010). Simply stated, whenever individuals direct
their thoughts at something (or someone) that exists outside their direct experience (i.e., not here
and now), the process of abstraction is used to extract the core meaning and central aspects of
whatever one thinks about (Trope and Liberman 2010). According to CLT, the extent to which
abstraction is employed is affected by the degree to which thoughts are directed away from one’s
direct experience. As a consequence, individuals are said to have adopted either an abstract
mindset orientation (i.e., abstract or high-level construal; abstract thinking) or a concrete mindset
orientation (i.e., concrete or low-level construal; concrete thinking). CLT further suggests that
mental construals influence evaluation, prediction, and behavior (Trope et al. 2007).
This research comprises three separate studies, a literature review and two experimental
studies, all centered on the insights derived from CLT. The first study reviews the extant CLT

2
literature and offers broad, CLT-based research questions pertaining to various accounting
domains. The second study applies CLT to the audit context by investigating whether the
performance of common auditing tasks that require varying degrees of abstract thinking affect
decision-makers’ overall mindset and hence their subsequent judgment. The third study applies
CLT to the enterprise risk management (ERM) context by examining how spatial distance from a
risk assessment object and risk category (i.e., the type of risk) affects decision-makers’ risk
assessment. The following subsections provide additional detail on each chapter by highlighting
the underlying motivation for each study, the research method employed, and the contributions
of each study to the accounting literature. The overall contribution of this dissertation is
summarized in the last subsection.
Study One: Using Construal Level Theory to Motivate Accounting Research: A Literature
Review
The central argument of Study One is that CLT provides the potential for a better
understanding of the heuristics and biases in judgment and decision-making that are associated
with decision environments in which judgments are influenced by, or focused on, either: (1)
temporal distance (i.e., thoughts about the future or the past); (2) spatial distance (i.e., thoughts
about geographically remote locations); (3) social distance (i.e., thoughts about other
individuals); (4) hypotheticality (i.e., consideration of hypothetical, rather than actual situations
or events); or a combination of (1) – (4). To this end, Study One provides a detailed review of
extant CLT literature with an emphasis on publications that apply the theory in contexts that are
of particular interest to accounting researchers. CLT’s underlying theoretical logic is explained
and commonalities and differences between CLT and related or competing theories in terms of
their prediction and focus are highlighted.

3
Findings from the reviewed literature point toward converging support for the CLT
proposition that psychological distance, effected through temporal distance, spatial distance,
social distance, or through hypotheticality, affects decision-makers’ predictions (e.g.,
correspondence bias; prediction confidence), evaluations (e.g., differential weighting of primary
versus secondary features; desirability versus feasibility concerns; pro versus con
considerations), and behavior (e.g., logrolling willingness in negotiation; performance on
abstract vs. concrete tasks; susceptibility to the sunk-cost bias). Furthermore, CLT research
suggests that the identified effects are mediated by the degree of abstractness with which
decision-makers mentally present the objects, persons, situations, or events that are the focus of
their decision.
Given those findings, it is argued that CLT’s focus on mediating cognitive mechanisms
should offer accounting researchers the opportunity to gain a deeper understanding of how
accounting professionals, organizational actors, and other decision-makers who rely on
accounting information predict situations, express preferences, evaluate situations, or act upon
considerations that encompass varying degrees of psychological distance. It is further argued that
the predictions and insights provided by CLT warrant exploration by behavioral accounting
researchers as accounting, auditing, and business in general becomes increasingly global and
geographically dispersed. To facilitate such inquiry, 23 broad research questions related to
various accounting disciplines are put forward.
By explaining the core tenants of CLT through a review of selected studies that are of
particular interest to accounting researchers and by highlighting commonly applied methods
associated with experimental manipulations, Study One motivates behavioral accounting
researchers to consider CLT as a basis for exploring critical research questions in the judgment

4
and decision-making domain. As such, the study elaborates on the theoretical foundation for
Study Two and Study Three and contributes, more generally, to the accounting literature by
identifying avenues for future inquiry.
Study Two: The Impact of Construal Mindset Orientation on Auditors’ Probability Assessment
Study Two applies CLT to the audit context. The experimental study explores the effects
of task-induced mindset on subsequent decisions in a multi-task, multi-client environment in
which auditors perform dissimilar tasks for different clients within a short period of time.
Research on the effects of task and client sequencing on auditor decisions (e.g., Lindberg
and Maletta 2003; O’Donnell and Schultz, Jr. 2005; Bhattacharjee et al. 2007, 2013) has
identified undesirable carryover effects as a common form of information processing and recall-
related errors. Those studies provide converging evidence that working, within a short period of
time, on multiple tasks for the same client or on similar tasks for multiple clients affects auditors’
judgments. However, the arguably more ubiquitous situation in which an auditor needs to render
judgments associated with successive tasks that are entirely unrelated (i.e., different client and
dissimilar task) has largely been ignored. Accordingly, Study Two focuses on such a scenario by
investigating whether the performance of common auditing tasks that require varying degrees of
abstract thinking affect auditors’ overall mindset and hence their subsequent judgment.
Two experiments, each following a 2 × 2 between-subjects design are conducted. Each
experiment involves two separate and completely unrelated tasks. The first task (Task 1) differs
between Experiment 1 and Experiment 2 while the second task (Task 2) remains the same (i.e.,
an accounts receivable task that calls for a probability assessment related to an outstanding
balance). The two independent variables for both experiments are construal mindset (abstract vs.

5
concrete) and focus of the probability assessment question (collectible vs. uncollectible; that is,
how the probability question is asked). Experiment 1 manipulates construal mindset by asking
experienced auditors to complete an audit task that requires either a high-level, abstract
perspective or a low-level, concrete perspective. Experiment 2, which uses accounting students
as participants, manipulates construal mindset via a priming task developed in the psychology
literature. The dependent variable, which is captured in Task 2, is participants’ probability
assessment concerning the ability of an audit client to collect a customer’s accounts receivable
balance.
Results from both experiments are mixed. Auditors who adopt an abstract mindset
orientation as a result of an unrelated preceding audit task, compared to those who adopt a
concrete mindset orientation, provide lower probability assessments as predicted. However, no
support is found for the hypothesized interaction between construal mindset orientation and
focus of the probability question. Moreover, neither the predicted main effect for construal
mindset nor the predicted interaction effect is found to be significant for student participants.
Results from additional analyses suggest that the probability-related predictions derived from
CLT may be limited to situations in which the judgment of concern is relatively familiar to the
decision-maker in terms of decision domain and how the judgment question is posed.
By illustrating that task sequencing can affect judgment in the absence of any meaningful
relationship between an earlier task and a latter one the study closes a research gap in the
accounting literature and offers initial insights into the consequences of task abstractness on
subsequent judgments that are important for further investigations into post-evaluative behavior.

6
Study Three: The Impact of Spatial Distance and Risk Category on Probability Assessment
Study Three applies CLT to the enterprise risk management (ERM) context by examining
how spatial distance from a risk assessment target (i.e., an object that is evaluated with respect to
the risks it faces) and the nature of the risk under consideration (i.e., risk category or risk type)
affects decision-makers’ assessment of the probability that the risk will materialize. As such, the
study is motivated by a COSO-commissioned research study which highlights the importance of
identifying factors that may introduce judgment bias in board decisions (KPMG 2012) and by
academic calls for research on risk assessment tools such as risk maps for which probability
judgments constitute a core criteria for visualizing the organizational risk landscape (Jordan et al.
2013). Additional motivation for Study Three originates from recent survey research which
suggests that corporate board members would like to receive more information about actual
ERM processes - including procedures related to the estimation of risk probability (see Ballou et
al. 2011). The experimental method employed in Study Three addresses this concern.
An experiment is conducted in which participants are asked to predict whether a highly
likely risk or a highly unlikely risk, depending on experimental condition, is going to materialize
at a proximate or remote location. Contrary to expectations derived from CLT, the results do not
suggest that individuals intuitively associate the occurrence of low-probability risks with distant
locations and the occurrence of high-probability risks with proximate locations. A possible
explanation for this finding is that the requested judgment may have fallen outside the M.B.A.
participants’ area of expertise and thus outside their routine cognition.
In a second experiment, both spatial distance and risk category are manipulated.
Experiment 2 follows a 2 × 2 between-subjects design and uses professional risk managers as
participants. The independent variables are spatial distance (proximate vs. remote) and risk

7
category (operational vs. non-operational). The dependent variable is participants’ probability
assessment concerning the occurrence of five critical risk factors identified by a recent risk
management survey conducted by Protiviti Inc. and North Carolina State University’s ERM
Initiative (see Protiviti 2014a). As predicted, the results show that risk managers who evaluate a
spatially remote object assess the probability that various risk factors will materialize to be lower
than those who evaluate a spatially proximate object. Moreover, risk managers provide lowest
probability estimates when assessing a non-operational risk factor for a spatially remote object.
Additional analyses reveal that risk managers perceive operational risk factors as more likely to
occur than strategic risk factors, but not more likely than macroeconomic risk factors.
The study contributes to the corporate governance literature by identifying psychological
distance as a potential source for judgment bias during the risk assessment process. It also
informs designers of risk registers and centralized risk databases about the potential impact of
risk description abstractness – which is associated with various risk categories – on probability
judgments.
Overall Contribution
Even though CLT is considered a prominent contemporary theory and comprehensive
framework for judgment and decision-making (Fiedler 2007), behavioral accounting research,
with few exceptions, has largely ignored the theory’s predictions and insights. The three studies
reported in this dissertation are centered on the propositions offered by CLT. Combined, the
three studies aim at making CLT more accessible to behavioral accounting researchers by
providing a detailed explanation of the key insights from CLT (Study One) and by illustrating
how those insights can be applied to various accounting settings (Study Two and Study Three).

8
To achieve the latter goal, CLT is used to predict judgment and decision-making outcomes in
both audit and risk management settings.
Results from Study Two and Study Three support several, but not all, predictions derived
from CLT. Overall, the studies show that psychological distance (or, more broadly, construal
mindset orientation) affects decision-makers’ judgment as long as the judgment of concern is
relatively familiar to the decision-maker, thus permitting routine decision-making. Although both
studies are concerned with professional decision-makers’ probability assessments and thus
inform the literature on probabilistic judgment, the conceptual implications of those judgments
are quite different. Probability judgments in Study Two constitute a specific manifestation of the
overall behavioral implications associated with the adoption of an abstract or concrete mindset
orientation. Judgments other than those related to probabilities could have been explored and
thus could potentially have informed the audit literature about the effects of mindset orientation
on auditors’ decision-making. In contrast, probability assessment was the core focus of Study
Three in which professional decision-makers’ judgment with respect to risk-related probabilities
constitutes a key decision that, combined with organizational impact assessment, reflect the most
prominent criteria used in risk management practice (COSO 2004, 2013).
In sum, the three studies presented in this dissertation contribute to our understanding of
the heuristics and biases in judgment and decision-making that are associated with distance-
affected decision environments, and suggest that CLT has the potential for supporting the
investigation of previously unexplained phenomena within the accounting domain.

9
References
Ballou, B., D. L. Heitger, and D. Stoel. 2011. How boards of directors perceive risk management
information. Management Accounting Quarterly 12 (4): 14-22.
Bhattacharjee, S., M. J. Maletta, and K. K. Moreno. 2007. The cascading of contrast effects on
auditors’ judgments in multiple client audit environments. The Accounting Review 82 (5):
1097-1117.
Bhattacharjee, S., M. J. Maletta, and K. K. Moreno. 2013. Auditors’ judgment errors when
working on multiple tasks and in multiple client environments: A research summary and
practice implications. Current Issues in Auditing 7 (1): 1-8.
Committee of Sponsoring Organizations of the Treadway Commission (COSO). 2004.
Enterprise Risk Management – Integrated Framework. New York, NY: AICPA.
Committee of Sponsoring Organizations of the Treadway Commission (COSO). 2013. Internal
Control – Integrated Framework. Executive Summary. Available at:
http://www.coso.org/documents/990025P_Executive_Summary_final_may20_e.pdf.
Fiedler, K. 2007. Construal level theory as an integrative framework for behavioral decision-
making research and consumer psychology. Journal of Consumer Psychology 17 (2):
101-106.
Jordan, S., L. Jorgensen, and H. Mitterhofer. 2013. Performing risk and the project: Risk maps as
mediating instruments. Management Accounting Research 24 (2): 156-174.
KPMG LLP. 2012. Enhancing Board Oversight: Avoiding Judgment Traps and Biases. Available
at: http://www.coso.org/documents/COSO-EnhancingBoardOversight_r8_Web-
ready%20(2).pdf.
Liberman, N., and Y. Trope. 1998. The role of feasibility and desirability considerations in near
and distant future decisions: A test of temporal construal theory. Journal of Personality
and Social Psychology 75 (1): 5-18.
Lindberg, D. L., and M. J. Maletta. 2003. An examination of memory conjunction errors in
multiple client audit environments. Auditing: A Journal of Practice & Theory 22 (1):
127-141.
O’Donnell, E., and J. J. Schultz, Jr. 2005. The halo effect in business risk audits: Can strategic
risk assessment bias auditor judgment about accounting details? The Accounting Review
80 (3): 921-939.

10
Protiviti. 2014a. Executive Perspectives on Top Risks for 2014. Available at:
http://www.protiviti.com/en-US/Documents/Surveys/NC-State-Protiviti-Survey-Top-
Risks-2014.pdf.
Trope, Y., and N. Liberman. 2003. Temporal construal. Psychological Review 110 (3): 403-421.
Trope, Y., and N. Liberman. 2010. Construal-level theory of psychological distance.
Psychological Review 117 (2): 440-463.
Trope, Y., N. Liberman, and C. Wakslak. 2007. Construal levels and psychological distance:
Effects on representation, prediction, evaluation, and behavior. Journal of Consumer
Psychology 17 (2): 83-95.

11
STUDY ONE: USING CONSTRUAL LEVEL THEORY TO MOTIVATE
ACCOUNTING RESEARCH: A LITERATURE REVIEW
Introduction
Accounting professionals, like all other decision-makers frequently direct their thoughts
towards actions, situations, objects, persons, or events outside the realm of their direct
experience. That is, they think about the future or the past (e.g., with respect to investment
decisions), distant locations (e.g., foreign subsidiaries), other individuals’ perceptions or
experiences (e.g., supervisors or clients), or hypothetical events rather than actual events (e.g.,
potential risk factors). They also make plans (e.g., budgets), render judgments (e.g., approve an
organizational course of action), and make choices (e.g., decide whether or not a new technology
should be adopted) based upon, or influenced by those thoughts (see Liberman and Trope 2008;
Trope and Liberman 2010). Construal level theory (CLT) of psychological distance1 (Liberman
and Trope 1998; Trope and Liberman 2003) offers accounting researchers the opportunity to
gain new insights into heuristics and biases associated with thoughts and decisions and promises
a deeper comprehension of judgment and decision-making in distance-affected decision
environments.2 Such insights, enabled by CLT’s focus on cognitive processes, are increasingly
relevant as accounting, auditing, and business in general becomes ever more global and
geographically dispersed.
1 While early CLT studies focused on the temporal distance effects on preferences and referred to the theory as
temporal construal theory, this literature review uses the more inclusive term CLT for ease of exposition. This
terminological convention is in line with the majority of research published after Trope and Liberman’s (2003)
seminal article. 2 Such environments include those in which decisions are influenced by, or focused on, either: (1) temporal distance
(i.e., thoughts about the future or the past); (2) spatial distance (i.e., thoughts about geographically remote
locations); (3) social distance (i.e., thoughts about other individuals); (4) hypotheticality (i.e., consideration of
hypothetical, rather than actual situations or events); or a combination of (1) – (4).

12
The purpose of this study is to provide a review of extant literature on CLT, which not
only details the psychological underpinnings and logics of CLT, but also highlights the theory’s
potential for application in behavioral accounting research. CLT is a broad theory which argues
that the process of abstraction enables individuals to direct thoughts at actions, objects,
situations, events, or persons that reside outside their direct experience (Trope and Liberman
2010). Abstraction is the process of extracting the core meaning and central aspects of whatever
one thinks about by peeling away peripheral, less essential aspects of the object of thought.
According to CLT, the extent to which abstraction is employed is affected by the degree to
which thoughts are directed away from one’s direct experience. The resulting mental
representation of the thought-object should, in turn, affect one’s predictions, evaluations, and
actions (Liberman and Trope 2008; Trope and Liberman 2010). Consider, for example, two
auditors who need to decide whether or not to implement a new audit technology. One of the
auditors considers using the new technology a year from now whereas the other auditor considers
utilizing the new technology next week. According to CLT, the former auditor is more likely to
base his decision on the broad advantages or disadvantages of employing the new technology
and to be less influenced by secondary aspects of the implementation decision (e.g., how to
document audit findings based on output from the new technology.). CLT offers similar
predictions when one of the auditors considers implementing the technology for the audit of a
spatially distant client whereas the other auditor considers implementing the technology for the
audit of a spatially proximate client.
CLT has important implications for accounting research and practice as accounting
professionals, organizational actors, and other decision-makers who rely on accounting
information, routinely predict situations (e.g., financial performance of a company), express

13
preferences (e.g., render a choice among alternative courses of action), evaluate situations (e.g.,
decide whether to enter into a joint-venture), or act upon considerations that encompass varying
degrees of psychological distance (Trope and Liberman 2010). According to Trope and
Liberman (2010) “Psychological distance refers to the perception of when an event occurs, where
it occurs, to whom it occurs, and whether it occurs (p. 442). Specific CLT propositions about how
those predictions, evaluations, preferences, and actions are affected should thus enable
behavioral accounting researchers to gain a deeper understanding of the heuristics and biases
associated with judgment and decision-making in distance-affected decision environments.
Rooted in research on the psychology of predictions, CLT focused initially on
individuals’ mental representation of future conditions in order to explain time-dependent
disparities in preferences (Trope and Liberman 2000). Early CLT research thus aligns with a
variety of research streams that investigate variation in reactions to future events depending on
temporal distance: behavioral economics research points to excessive temporal discounting rates,
decision-making research indicates higher risk tolerance and greater confidence when individuals
consider distant future situations, and research on self-control and gratification-delay suggests
that it is easier to postpone gratification pertaining to more distant future outcomes (Liberman et
al. 2002). Common to all extant theories that explain future decision phenomena is the principle
of time discounting (Trope 2004).3
However, prior research has paid scant attention to mediating
cognitive mechanisms that may underlie the observed temporal effects on decisions, evaluations,
and judgments (Liberman et al. 2002). To remedy this shortcoming, Trope and Liberman (2003)
3 Frederick et al. (2002) define the term time-discounting as a concept that includes “…any reason for caring less
about a future consequence, including factors that diminish the expected utility generated by a future consequence,
such as uncertainty or changing tastes” (p. 352).

14
proposed CLT as a potential common mechanism that could explain various aspects of temporal
discounting identified by earlier theories (Trope 2004).
In an effort to extend the scope of temporal construal research, Trope and Liberman
(2003) proposed that distance dimensions aside from temporal distance may be linked to
construal level and thus be combined in a joined theory of psychological distance. The proposed
psychological distance dimensions include temporal distance, social distance (e.g., in-group vs.
out-group, oneself vs. others, and active social role vs. inactive social role), spatial distance, and
hypotheticality. In a nutshell, “The basic premise of CLT is that distance is linked to level of
mental construal, such that more distant objects will be construed at a higher level, and high-
level construal will bring to mind more distant objects” (Trope and Liberman 2010, 444).
Construal level, conceptualized as “a type of mental representation that is invoked by distance
rather than as a distance dimension in its own right” (Liberman et al. 2007a, 114), affects
predictions, evaluations, and behavior (Trope et al. 2007). The underlying reason for the
association between psychological distance and construal level is presumed to stem from
differential knowledge about near and distant events; the farther an event is removed from direct
experience, the less dependable information is usually available, leading to the construction of
more schematic (abstract) mental representations. CLT research shows that this association is
overgeneralized such that it affects construal level even in the presence of comparable
information about proximate and distant situations (Trope et al. 2003, 2007; Liberman et al.
2007a; Nussbaum et al. 2003). This basic research is the focus of section two of this review.
Research on CLT began to emerge in 1998 and gained significant momentum in 2006.
Today, CLT is considered a prominent contemporary theory and comprehensive framework for
judgment and decision-making (Fiedler 2007). A March 2015 Google Scholar search for

15
“Construal Level Theory” identified 49 articles on CLT published between 1998 and 2005, 545
articles published between 2006 and 2010, and roughly 1,770 articles between January 2011 and
March 2015. Within the academic business literature, CLT is most heavily used by marketing
researchers, followed by organizational behavior and management scholars.
Given the scope of CLT research, this review will necessarily be focused on CLT studies
that are of particular interest to accounting researchers and highlight those articles’ main
theoretical contributions. Since the purpose of this review is to illustrate CLT’s potential to
facilitate the investigation of unexplained phenomena within the accounting domain, much detail
is devoted to the literature’s explanation of the theory’s underlying logic and its explanatory
power compared to related or competing theories; furthermore, interesting and commonly
applied methods associated with experimental manipulations are highlighted. This results in an
effort to include all seminal articles on CLT focusing on articles elaborating on key relationships
or highlighting theoretical extensions, along with a few working papers with insights of
particular interest to accounting researchers.
The remainder of this literature review is structured into four sections. Section two
summarizes seminal articles which explain CLT in terms of its core insights and its relationship
to related or competing theories. The third section reviews articles that explore CLT’s core
propositions with respect to the four dimensions of psychological distance. Section four presents
broad research questions for behavioral accounting research while section five offers concluding
remarks.

16
Basic Research on Construal Level Theory
Accounting professionals, organizational actors, and decision-makers in general routinely
think about actions, situations, objects, persons, or events outside the realm of their direct
experience. That is, they think about the future or the past, distant locations rather than proximate
locations, other individuals’ perceptions or experiences, or hypothetical events rather than actual
events. They also make plans, render judgments, and make choices based upon, or influenced by
those thoughts. More broadly speaking, individuals frequently direct their thoughts away from
what they actually experience themselves at their present location (the ‘here’) at the present time
(the ‘now’) (Liberman and Trope 2008; Trope and Liberman 2010).
According to CLT, directing one’s thoughts away from the ‘here’ and ‘now’, shifting
attention to other individuals’ experiences, or considering hypothetical events constitutes a
traversal of spatial distance (i.e., away from the ‘here’), temporal distance (i.e., away from the
‘now’), social distance (i.e., away from oneself), or hypotheticality (i.e., away from actuality).
Proponents of CLT argue that the “human capacity for abstract processing of information”
(Liberman and Trope 2008, 1201) permits individuals to traverse temporal distance, spatial
distance, social distance, and hypotheticality. The theory further posits that temporal distance,
spatial distance, social distance, and hypotheticality constitute four interrelated manifestations of
distance that map onto a single, underlying construct termed ‘psychological distance’.
Accordingly, the aforementioned manifestations of distance are referred to as the four
dimensions of psychological distance (Liberman et al. 2007c).
The cognitive process of abstraction, which operates similarly with respect to all four
dimensions of psychological distance, leads to mental representations of varying degrees of
abstractness, depending on the magnitude of psychological distance. In other words, the farther

17
the object of one’s thoughts is distanced from the self at the present location and time along
either dimension of psychological distance (or a combination thereof) the more abstract the
object will be presented. Moreover, the relationship between mental representation (i.e.,
construal level) and psychological distance is bidirectional, implying that abstract mental
construals prompt individuals to think of objects that are psychologically farther away. While the
object of one’s thoughts may be a course of action, an object, a person, an event, or a situation,
the CLT literature commonly uses the terms ‘objects’ or ‘targets’ in order to simplify discussion.
CLT refers to mental representations as ‘construals’ and distinguishes those construals based on
their degree of abstractness. Accordingly, an object may be construed at a higher or lower level
depending on the individuals’ subjective perception about the degree to which the object is
removed from direct experience in terms of temporal distance, spatial distance, social distance,
or hypotheticality. Importantly, the manner of mental representation affects individuals’
prediction as well as their evaluations, preferences, and behaviors (Liberman and Trope 2008;
Trope and Liberman 2010).
The basic premise of this literature review is that the former proposition has important
implications for accounting research and practice as accounting professionals, organizational
actors, and other decision-makers routinely predict events, express preferences, evaluate
situations, or act upon considerations that encompass varying degrees of psychological distance.
Figure 1 illustrates the process discussed above.

18
Figure 1: Overview of Construal Level Theory
Source: Trope and Liberman (2003)
19
Liberman and Trope’s (1998) article on temporal construal theory (TCT) may justifiably
be considered the foundation for an entire literature stream on construals culminating in CLT.
The authors explain that prior research on time-dependent variations in expectations attributed
overconfidence and the planning fallacy to the omission of non-schematic aspects of reality (i.e.,
aspects not included in the construction of the scenario) during the construction of future events
and argue for a differentiation between gradations of schematicity. Specifically, Liberman and
Trope (1998) distinguish between low-level construals which contain more concrete,
contextualized, and subordinate features of a situation, and high-level construals which contain
rather abstract, superordinate, decontextualized, and global aspects (see Figure 1). Given this
distinction and the assumption that incidental and subordinate details are more easily brought to
mind when a near future situation is assessed, TCT links temporal distance directly to the level
of mental construal (Liberman and Trope 1998). Low-level construals thus dominate our
thinking when the near future is considered and high-level construals when the distant future is
of concern. Distant future thinking may thus suppress concrete, contextualized and peripheral
aspects of a given situation (or replace the former with more abstract aspects), thereby
facilitating a clearer depiction of the situation (Liberman and Trope 1998). Given the above
discussed attributes of low and high-level construals, time dependent variations in values can be
explained as follows: as positive or negative values may be attributed to the high or low-level
features of a construal, the value assigned to high-level [low-level] aspects should be weighted
higher [lower] in distant future construals. Thus, while the value attributed to high-level
construals will grow over time, the value ascribed to low-level construals will be subject to
temporal discounting. The value attributed to a high-level [low-level] construal should therefore

20
drive the perceived overall value of a situation or event in the distant [near] future (Liberman and
Trope 1998).
Arguing that feasibility concerns (i.e., the subordinate how aspects according to goal
subordination theory) represent low-level construals while desirability concerns (i.e., the
superordinate why aspects according to goal subordination theory) represent high-level
construals of alternative courses of action, Liberman and Trope (1998) show that desirability
considerations are more heavily weighted than feasibility concerns when decisions about distant
future actions or plans are rendered. The authors note that various aspects of their findings
cannot be explained by competing theories such as action identification theory (Vallacher and
Wegner 1987) or Gollwitzer’s (1990) action phase theory (cf. Liberman et al. 2002). The
researchers also rule out future optimism as a sole driver of their results since this concept is
incapable of accounting for time-sensitive variations in the weighting of desirability concerns in
decisions. Lastly, conflict models theory (Lewin 1951; Miller 1944) is ruled out as an alternative
theoretical explanation as the predictions from this theory would not support the authors’ finding
that easy but undesirable alternatives are more [less] appealing in the near [distant] future
(Liberman and Trope 1998).
Continuing this research, Trope and Liberman (2000) illustrate how preferences for
activities, objects, and events are influenced by temporal distance notwithstanding constant
decision-relevant information. The authors show that options that contain positive [negative]
high-level construals but negative [positive] low-level construals are chosen [rejected] for the
distant future and that either decision may be regretted as the realization of the choice
approaches. A major contribution of Trope and Liberman (2000) is their discussion of the results
from the perspective of competing time-discounting theories. With reference to the diverse

21
spectrum of social science research which has examined time-dependent variation in preferences,
Trope and Liberman (2000) draw attention to two influential hypotheses: the valence-dependent
time-discounting hypothesis (Lewin 1951; Miller 1944) and the affect-dependent time-
discounting hypothesis (e.g., Loewenstein 1996; Vallacher 1993). While the former theory
suggests that negative values are subject to greater time discounting than positive values, the
latter suggests that the relative importance of cognitive value [affective value] increases
[decreases] with temporal distance. Interestingly, Trope and Liberman’s (2000) findings can only
be partially explained by those competing theories. Contrary to predictions derived from
valence-dependent time-discounting, results indicate that if the negative features of mixed
options are high-level construals, the option’s appeal decreases with temporal distance. Likewise,
the results from one of their studies contradict predictions based on affect-dependent time-
discounting; when the high-level construal is affective rather than cognitive, the weight
attributed to affective value increases with temporal distance. Apparently, whether value is
discounted or augmented depends on the level of construal to which value is attached (Trope and
Liberman 2000).
Extending selected results from Liberman and Trope (1998) to objects and levels of
construal other than actions and associated hierarchies (e.g., social situations), Liberman et al.
(2002) find support for CLT-predicted temporal distance effects with respect to breadth of
categorization, the degree to which anticipated experiences are expected to be prototypical, and
the structural complexity of preferences. Events expected in the more distant future are construed
more coherently and in more abstract, systematic, and simple terms. Liberman et al. (2002) also
discuss construal levels in relation to differences between heuristic vs. systematic processing and
note that high-level construals may only occasionally require less processing effort. Heuristic

22
processing entails the retention of easy-to-process aspects and ignorance of harder-to-process
aspects, whereas high-level construal requires retention of central, relevant aspects and ignorance
of contextual, subordinate aspects. Thus, as relevant aspects are not necessarily easy-to-process
aspects, contradictory inferences can be expected. Further, CLT may provide a theoretical
foundation to explain phenomena associated with counterfactual thinking, and prediction errors
stemming from underweighting of contextual features such as overconfidence, the planning
fallacy, and focalism (Liberman et al. 2002).
In a second seminal article, Trope and Liberman (2003) stress that a central aspect of
high-level construals is that variation in their associated features lead to significant alterations in
situational interpretation. Moreover, competing theories such as hyperbolic time discounting,
magnitude effects, action identification theory, Gollwitzer’s (1990) mind set theory, or future
optimism cannot explain the results of prior studies as consistently as CLT. The latter argument
is reiterated by Trope (2004) who stresses CLT’s high explanatory power.
Detailed discussions of psychological distance and the concept of construal are also
provided by Liberman et al. (2007c) who explain that the four manifestations of psychological
distance are fixed on a single, zero-distance reference point (i.e., the direct experience of the
present time and location) and that all other reference points are mental constructs. The authors
also posit that the various dimensions of psychological distance are not only related to one
another and somewhat interchangeable, but also produce effects that are alike and mediated by
construal level. An interesting point raised by Liberman et al. (2007c) in connection with the
effects of social distance concerns a comparison between the actor-observer effect in attribution
(Jones and Nisbett 1972) and CLT. Unlike the actor-observer effect, CLT also explains that
people construe themselves in more abstract terms when assuming a third person perspective.

23
This finding is certainly difficult to attribute to a lesser degree of knowledge about the target of
construal (Liberman et al. 2007c).
In a contemporaneous article, Liberman et al. (2007a) emphasize the similarities among
the various distance dimensions, but also point to notable differences among them with respect to
inter vs. intra-individual variation (see Lynch and Zauberman 2007), dimensionality (e.g., time is
unidimensional while spatial distance is not), controllability (e.g., social distance is more
controllable than time), and valence (e.g., positive perceptions decline with social distance but
usually increase with temporal distance). Rather than complicating analyses, those differences
may be used to disentangle distance-related from other effects. Moreover, Fiedler’s (2007)
argumentation for the inclusion of additional dimensions of psychological distance into the CLT
framework is objected in Liberman et al.’s (2007a) response on the grounds that the proposed
dimensions lack objectivity.
Up to this point in the CLT development stage, the association between construal level
and psychological distance had only been explored from a perspective that focused on the link
between target attributes and the manner in which these targets are processed (Bar-Anan et al.
2006). However, later studies provide even stronger evidence for the relationship between level
of construal and psychological distance by showing that (1) the association also exists on a pure
conceptual level (i.e., in the absence of construal targets and their situation-specific context)
(Bar-Anan et al. 2006); and (2) that the relationship is subconsciously activated (Bar-Anan et al.
2007). The theoretical insights of those studies are fundamental to CLT since they not only
establish initial evidence for the assertion that all four dimensions of distance are manifestations
of a single core construct (i.e., psychological distance) (Fiedler et al. 2012), but also that this
construct is activated automatically (Bar-Anan et al. 2007).

24
Two recent studies that also investigate the association among all four distance
dimensions are Fiedler et al. (2012), who show consistent positive correlations among all
distance dimensions (across decision-makers and decision targets), and Maglio et al. (2013), who
find support for Liberman et al.’s (2007a) proposition that distancing on one dimension leads to
decreased marginal sensitivity toward a certain extent of distance on a second dimension (i.e.,
cross-dimensional distancing leads to effects similar to those associated with within-dimension
distancing). Maglio et al. (2013) also find that a person’s individual sensitivity to a second
distance dimension mediates the impact of the first distance dimension on choice; and that a first
instantiation of distance concurrently lowers sensitivity to additional distance manifestations
both cross-dimensional and within-dimensional.
Several literature reviews on emerging CLT research have accompanied the theoretical
development stage marked by, but not limited to, the majority of the above discussed research.
Trope et al. (2007), for example, present a comprehensive review of CLT research concerning
the link between distance and prediction, distance and evaluation (e.g., primary versus secondary
features; desirability versus feasibility concerns; pros versus cons), and distance and behavior
(e.g., forecasting intentions from values and overall attitudes; logrolling willingness in
negotiation; susceptibility to the sunk-cost bias; perception of risk and time frames). A more
concise review which places the human capacity for abstraction into an evolutionary context is
provide by Liberman and Trope (2008). Their article addresses the bi-directional relationship
between psychological distance and construal level and discusses research findings that illustrate
this relationship in the context of perception, categorization, and inference.4
In an even more
4 Readers interested in the most comprehensive discussion of the CLT framework and associated research findings
should refer to Trope and Liberman (2010) who also offer directions for future research.

25
focused literature review, Ledgerwood et al. (2010) explore the role of construal level on the
consistency and flexibility of evaluations and the associated implications for social relations.
Signals about psychological distance impact the degree to which evaluations diverge or remain
constant across diverse social situations, and this fluctuation in consistency is exceedingly
practical from a societal perspective. Table 1 summarizes basic CLT research and related
syntheses papers.
Selected Applications of Construal Level Theory
Research on Temporal Distance
A majority of CLT-based research has focused on the impact of temporal distance on
construal level and related consequences for judgments and preferences, predictions, perceptions,
evaluations, and behaviors. Temporal distance effects on decision-makers’ judgment and
preferences are not confined to variations in actual temporal distance from a situation or event,
but also arise by variations in subjective temporal outlook (e.g., Kivetz and Tyler 2007; Rogers
and Bazerman 2008). With respect to temporal distance effects associated with variations in
actual temporal distance, research provides evidence of asymmetric weighting of payoffs
(representing desirability concerns) and probability (representing feasibility concerns) in
situations that are influenced by random processes (Sagristano et al. 2002; Liberman and Trope
1998). Further, the assessment of existing options is affected by merely considering an appealing,
yet unattainable alternative (Borovoi et al. 2010). Moreover, the aforementioned effects may
hold irrespective of actual event timing given that research suggests that priming decision-
makers with a near future temporal outlook raises the appeal of instrumental incentives (e.g.,
cash bonuses) while a distant future temporal outlook leads to a preference of identity incentives

26
(e.g., preferential treatment) (Kivetz and Tyler 2007). A similar conclusion with respect to the
efficacy of temporal priming can be drawn from Rogers and Bazerman (2008) who show that in
situations which require an instant, binding decision, individuals are more likely to favor
‘should-choices’ when those go into effect in the distant future and that this ‘future-lock-in
effect’ may also be achieved by merely changing decision-makers’ temporal focus. Further,
mental simulation can be deployed to change construal levels in order to reduce intertemporal
preference discrepancies (Zhao et al. 2007). Maybe even more important, decision-makers’
activities immediately prior to their decision affect the degree of present bias5 inherent in their
decision, depending on whether the prior tasks require an abstract processing mode or a concrete
processing mode. Such effects can be attributed to the prior activity’s impact on the decision-
maker’s construal mindset orientation (Malkoc et al. 2010).
As CLT suggests that psychologically distant actions and events foster a ‘big picture’
perspective (see Förster et al. 2004; Liberman et al. 2002), predictions of distant future actions
and outcomes should be construed in more abstract and cross-situational stable terms. Cross-
situational stability, in turn, should lead to higher prediction confidence. Indeed, individuals
display higher confidence in their predictions of other individuals’ distant future behavior
(Nussbaum et al. 2003). The temporally asymmetric weighting of dispositional vs. context-
specific factors also applies to behavioral intentions related to oneself; plans for the distant future
seem to be more consistent across contexts than those for the more proximate future (Eyal et al.
2009). More generally, the level of construal moderates the impact of temporal distance on
prediction confidence (Nussbaum et al. 2006). Prediction-related CLT research also provides
5 Present bias reflects the tendency to use higher discount rates for shorter time delays (i.e., hyperbolic discounting)
(Malcok et al. 2010).
27
evidence of the bi-directional relationship between construal level and temporal distance by
showing that individuals primed to adopt high-level [low-level] construals of a situation estimate
the situation to occur in the distant [near] future (Liberman et al. 2007b).
CLT research concerned with temporal effects on perception shows that superordinate
[subordinate] commonalities and differences are the primary drivers of perceived similarity
between distant [near] future events or situations (Day and Bartels 2008). Those findings point to
important implications for studies of cognition since similarity has been identified as a critical
factor for memory, problem solving, inference generation, and knowledge transfer and
generalization. In addition, temporal construals affect plans to engage in risk prevention
activities, such that the strength of intentions is negatively related to the difficulty of the
preventive action only when the risk is construed as temporally distant. Moreover, given that
negative outcome valence leads to a focus on risk while positive outcome valence leads to a
focus on absence of risk, a reversal of the above described framing effects accompanies a focus
on the absence of risk and affects behavioral intentions and the efficacy of risk communication
accordingly (Chandran and Menon 2004; Bonner and Newell 2008).
Several studies stress the profound impact of temporal distance on evaluation. Those
studies have broad implications for accounting research as the evaluation of a proposed course of
action or the assessment of alternatives constitute a common judgment among accounting
professionals, financial statement users, and regulators. A key theoretical insight is that in the
evaluation of future actions, pro considerations constitute high-level, superordinate construal
aspects, whereas con considerations reflect low-level, subordinate construal aspects. That is,
while the latter become decision-irrelevant in the absence of pro considerations, the reverse is
not true (Eyal et al. 2004). In line with earlier CLT research indicating asymmetry in conditional

28
relevance of desirability versus feasibility features, the relative importance of pro and con
aspects of a future activity is contingent on temporal distance (Eyal et al. 2004). It is easier to
generate pro-arguments for distant future actions and con-arguments for near future actions
(Herzog et al. 2007).
Research also indicates that an abstract [concrete] construal, associated with the
assessment of distant [near] future situations facilitates [hinders] processing of nonalignable
aspects (Malkoc et al. 2005) and aids focus on high-level arguments (Fujita et al. 2008). The
latter finding suggests that communications highlighting desirability [feasibility] or goal-related
[goal-unrelated] issues garner greater attention and lead to larger attitude changes when
associated with distant [near] future experiences (Fujita et al. 2008). Therefore, the compatibility
between temporal mindset and message abstractness raises the message’s persuasive power
through perceived fluency (Kim et al. 2009; Chandran and Menon 2004; Bonner and Newell
2008). Those findings, applied to the management information systems and interactive decision
aid (IDA) context, provide valuable insights for accounting information systems researchers;
performance evaluations are more positive (i.e., higher likelihood of advice acceptance) when a
concrete [abstract] communication design is matched with low [high] temporal distance between
IDA recommendation and product or service consumption; or with immediate [delayed] advice
delivery (Köhler et al. 2011).
With a focus on temporal distance effects on actual behavior, research suggests beneficial
effects of adopting a temporally distant perspective when creative action (Förster et al. 2004) or
Pareto-efficient negotiation outcomes (Henderson et al. 2006b) are desired. With respect to
creative action, a distant time perspective simplifies [hinders] abstract [concrete] thinking and
thereby facilitates [impedes] performance at creative [analytical] tasks (Förster et al. 2004). With

29
respect to negotiation outcomes, greater temporal distance from a negotiation process, or the
target event of the negotiation, facilitates integrative behavior throughout the negotiation process
(Henderson et al. 2006b; DeDreu et al. 2009). Furthermore, with respect to construal level effects
on temporal perspective (i.e., reverse causality), inducing a concrete construal of a task lowers
the likelihood for procrastination of task performance (McCrea et al. 2008; Liberman et al.
2007b). Lastly, decision-makers consider large temporal distance from an anticipated event a
sunk cost (independent of monetary sunk cost) that affects their behavioral intentions and
commitment to the future event (Park and Jang 2014). Table 2 summarizes CLT literature
focused on the temporal distance dimension of psychological distance.
Research on Spatial Distance
Research on the spatial distance dimension of psychological distance is comparatively
sparse and recent. However, the study of how individuals transcend the ‘here’ comes to be
increasingly relevant as people continue to expand their geographic horizons (Henderson et al.
2006a), particularly since technological advancements continue to reduce barriers for
collaboration and interaction across large distances (Jia et al. 2009). Research suggests that
individuals prefer to identify behavior as ends [means to an end] when the behavior is thought to
occur at a distant [nearby] location and that purportedly distant [proximate] behavior is described
in more abstract [concrete] terms (Fujita et al. 2006a). Moreover, decision-makers seem less
inclined to extrapolate from outlier data when rendering forecasts about spatially remote events;
and that prototypical [atypical] events are considered more [less] probable to occur at
geographically more remote locations (Henderson et al. 2006a). Concerning social judgments,
individuals exhibit greater correspondence bias when evaluating spatially remote behavior

30
(Henderson et al. 2006a) and the associated spontaneous trait inferences (containing dispositional
information) are formed subconsciously (Rim et al. 2009).
Spatial distance research also complements findings from earlier temporal construal
research with respect to psychological distance effects on behavior in terms of creativity (Förster
et al. 2004) and negotiation outcomes (Henderson et al. 2006b). With respect to creativity, a
simple cue such as the origin of an assignment can prompt higher-level construals and thereby
more abstract cognition, leading to more creative problem solutions and creative insights (Jia et
al. 2009). In the negotiation context, experiments in which negotiators believed to be either
spatially close or spatially distant from their negotiation partner confirm that greater perceived
spatial distance leads to more Pareto-efficient outcomes due to more adequate tradeoffs across
high and low-importance issues (Henderson 2011). Lastly, a recent study examining desirability
and feasibility aspects of an exogenous shock shows that greater shock distance and more
optimistic organizational capability perceptions prompt managers to focus more on opportunities
and less on threats associated with an external shock (Barreto and Patient 2013).
Accounting researchers interested in spatial distance effects on decision-makers’ mental
representation, judgment, and behavior are referred to Henderson and Wakslak (2010) who
present a comprehensive review of spatial distance related CLT research and articulate paths for
future research. In a complementary study, Henderson et al. (2011) review CLT research that has
examined the bidirectional relationship between spatial distance and construal level. The authors
also discuss important covariates and unique aspects of the spatial distance dimension of
psychological distance. Table 3 summarizes CLT literature focused on the spatial distance
dimension of psychological distance.
31
Research on Social Distance
CLT-informed social distance research suggests that increased interpersonal similarity
prompts individuals to construe and process information regarding another individual’s activities
in more concrete terms. Consequently, the actions performed and judgments rendered by others
who are considered similar are identified and judged to a greater extent based on incidental,
subordinate features relative to core, superordinate features (Liviatan et al. 2008). Based on
earlier CLT studies which document that moral transgressions are judged less leniently from a
psychologically distant perspective (e.g., Eyal et al. 2008), increased consideration of contextual
information associated with the evaluation of a socially proximate leader prompts better ethical
leadership ratings (Tumasjan et al. 2011). Moreover, higher moral evaluations following an
ethical transgression correlate with a more positive evaluation of the leader-subordinate
relationship.
Economic implications from social distancing are highlighted in a study that investigates
the impact of social distance on rational decision-making in the ultimatum game; negative
emotional arousal (i.e., a peripheral concern) associated with an unfair offer is more likely to be
discounted when the decision is made on behalf of another individual rather than for oneself
(Kim et al. 2013) (see related discussion of self-control and far-sightedness, Fujita et al. 2006b;
Loewenstein 1996). Furthermore, with respect to decision-makers’ behavior, social distancing
(i.e., acting on behalf of another individual) has similar effects on creativity as temporal and
spatial distancing (Polman and Emich 2011). Decision-makers display lower willingness to
allocate resources to a target when the target is construed in more abstract terms (Stephan et al.
2011).

32
How social distance and temporal distance combined influence the assessment of
products with contradictory high and low-level features (e.g., positive core attributes and
negative peripheral attributes) has also been examined. In conditions which reflect proximity on
both temporal and social distance, product assessments seem to be driven by the value attributed
to the low-level construals, whereas in conditions characterized by remoteness on either distance
dimension (or both), product assessments seem to be more affected by the value attributed to
high-level construals (Kim et al. 2008). Table 4 summarizes CLT literature focused on the social
distance dimension of psychological distance.
Research on Hypotheticality
The impact of hypotheticality on mental representation has been largely ignored in the
literature on the generation and utilization of probability judgments and in research on decisions
under uncertainty (e.g., expected utility theory; prospect theory) (Wakslak et al. 2006).
Addressing this research gap, Wakslak et al. (2006) find that probability is inversely (and bi-
directionally) related to level of construal: unlikely events cause individuals to focus on the
events’ abstract, superordinate, global aspects while more likely events draw attention to detail-
level, specific, subordinate aspects. Wakslak et al. (2006) offer two intriguing predictions with
respect to preferences and options: (1) higher level features (e.g., personal values) should
determine choices about less likely events; and (2) with respect to multi-feature outcomes, the
less likely the attainment of the outcome, the more weight should be given to superordinate,
global aspects of the outcome compared to subordinate aspects. Todorov et al. (2007) explore the
latter and show that desirability considerations are more prominent than feasibility consideration
when outcome-probability is low. However, as the outcome probability rises (that is,

33
psychological distance decreases), feasibility concerns may become even more prominent (but
not less) than desirability concerns.
Probability judgments are also affected by individuals’ overall cognitive mindset in
addition to their affective state; an abstract mindset fosters the perception of improbability
whereas a concrete mindset fosters the perception of likelihood (Wakslak and Trope 2009).
Further, individuals relate probability to spatial distance and temporal distance and consequently
anticipate that less [more] likely events happen at remote [proximate] locations and in the distant
[near] future (Wakslak 2012). Table 5 summarizes CLT literature focused on the hypotheticality
dimension of psychological distance.
Overall Mindset Implications of Psychological Distance
Many CLT studies are not primarily focused on either one of the psychological distance
dimensions, but rather on the effects of a concrete versus abstract construal mindset itself,
irrespective of how either mindset orientation is initiated (e.g., through distancing on either
psychological distance dimension, or through procedural priming). One such stream of CLT
research investigates how construal mindset orientation affects perceptions of other individuals’
self-regulatory efforts (e.g., Freitas et al. 2004) and one’s own ability to exert self-control (e.g.,
Fujita et al. 2006b; Agrawal and Wan 2009; Fujita and Han 2009). With respect to the former,
mindset orientation directs attention to either long-term (abstract mindset orientation) or short-
term (concrete mindset orientation) goal-relevant aspects of others’ situations; the mindset-
induced focus, in turn, affects the prediction and guidance of the observed individual’s self-
regulatory actions (Freitas et al. 2004). Concerning one’s own self-regulatory efforts, individuals
who adopt an abstract mindset stand a better chance at maintaining self-control (Fujita et al.

34
2006b; Fujita and Han 2009) as they have less trouble relating temptations to negativity (Fujita
and Han 2009). Further, the negative impact of resource depletion on individuals’ ability to
exercise self-discipline in consecutive self-control challenges is only evident among those who
adopt a low-level construal mindset (Agrawal and Wan 2009). An abstract construal of an
activity’s purpose assists people in focusing their decisions towards the values, objectives, and
characteristics inherent to their ideal self-perception (Freitas et al. 2008). Researchers interested
in gaining additional insights into the domain of self-regulation should refer to Fujita and
Carnevale (2012) who review the self-control literature and discuss evidence of the effect of
construal level on self-control in terms of temporal discounting, choice and action, and
prospective self-control.
Closely related to studies of self-control is research concerned with ethical decision-
making. Eyal et al. (2008) explore how moral evaluations are influenced by temporal and social
distance from the appraised action. Individuals evaluate moral [immoral] actions as more
virtuous [objectionable] when the actions are psychologically distant rather than proximate.
Taylor and Curtis (2013) draw on those findings and propose that the psychological closeness
among audit team members may bias their assessment of the severity of a colleagues’
transgression downward and accordingly lower their willingness for whistleblowing.
CLT research also offers valuable insights into the domain of feedback seeking and
suggests that obtaining accurate, but possibly negative feedback (i.e., realistic self-assessment) is
the core goal of self-evaluation and hence reflects desirability concerns. Not surprisingly then,
individuals who adopt a high-level [low-level] construal mindset seek realistic [positive]
feedback (Freitas et al. 2001). Moreover, lower-level [higher-level] construal promotes [lowers]
information search desirability in situations that involve the potential discovery of unpleasant

35
truths about prior decisions (e.g., whether the failure to invest in a rising stock was really a
missed opportunity) (Shani et al. 2009).
CLT-informed communication medium studies explore both how words compared to
pictures affect perceived psychological distance (see Amit et al. 2009) and conversely, how
psychological distance affects individuals’ preference for either communication medium (see
Amit et al. 2013). Given that words convey meaning, reflect entire categories, and are usually
context-independent, verbal representations constitute high-level construals whereas pictorial
representations, which are situational and specific representations, constitute low-level
construals. Pictures [words] are more suitable for the representation of psychologically
proximate [distant] targets (Amit et al. 2009). Individuals’ relative preference of words over
pictures rises with increased psychological distance from the message recipient. This relationship
is bidirectional such that given the availability of a specific medium individuals prefer
communication with a proximal (for pictorial messages) or distant (for verbal messages)
recipient (Amit et al. 2013). Importantly, the message-medium congruency is positively related
to recipients’ likelihood of following a communicated recommendation. From a theoretical
perspective, the aforementioned communication-medium studies are informed by more basic
CLT research by Liberman and Förster (2009) who focus exclusively on visual representation
and thus on levels of perceptual construal. Priming with temporal, spatial, or social distance
makes it easier to attend to global (Gestalt) features and harder to attend to specific details in a
visual task.
CLT may also explain a wide variety of economic decisions and behaviors that are often
counterintuitive from the perspective of economic models that take preference consistency and
expected utility maximization for granted (Leiser et al. 2008). Specifically, it has been proposed

36
that the discrepancy between one’s own risk preferences and those predicted for others can not
only be explained in terms of CLT, but also be reduced through CLT-informed de-biasing
mechanisms. Given that risk-neutral preferences are high-level construals (maximize long-term
payoff), they are more likely to be attributed to others (who are socially distant); accordingly, an
individual who predicts others’ risk preferences (e.g., a manager who must decide whether to
offer a cash bonus or stock options) may render more precise forecasts when construing the
target person at a lower level. Economics-based research also explores how construal level
priming may be effectively used to encourage cooperation in situations characterized by social
dilemmas and further encourages research to investigate other construal level effects on mixed-
motivation interactions (e.g., Prisoner’s Dilemma scenarios) (see Sanna et al. 2009). Sanna et al.
(2009) show that high-level construal of a social dilemma scenario leads to greater cooperation,
thus alleviating what Hardin (1968) termed the tragedy of the commons.
Exploring the association between power and cognition, Smith and Trope (2006) provide
experimental as well as initial neuropsychological evidence that individuals with power are more
inclined to construe available information at a higher level. Specifically, priming subjects with
the notion of being in a powerful position promotes ‘big picture’ thinking and a focus on critical
issues. The contention that an abstract mindset facilitates focus on decision-critical issues was
later tested by Cantor and Macdonald (2009). The results indicate that participants who adopt an
abstract problem-solving style outperform those who adopt a concrete problem-solving style
when a limited amount of information is available. However, research also points to negative
consequences associated with abstract cognition by identifying a critical link between mindset
orientation and the illusion of explanatory depth (IOED) (e.g., Rozenblit and Keil 2002). IOEDs
arise as a consequence of mistaking knowledge about high-level concepts with a deep

37
understanding of the target’s underlying, concrete aspects (Alter et al. 2010). Thus, whenever
individuals automatically embrace a high-level construal style, they may mistakenly believe that
they possess detail-level knowledge and thus forgo further information search. Further support
for these conclusions is provided in a study showing that power seems to have a detrimental
effect on managers’ capability to design proper incentive systems (Magee et al. 2011).
Potential implications for time-related phenomena, such as planning, assessments, and
performance are highlighted by research that demonstrates that individuals experience time
differently depending on whether they adopt a concrete or abstract construal mindset. Based on
earlier CLT studies which have shown that low-level construal leads to higher segmentation of a
given situation (e.g., Henderson et al. 2006a; Wakslak et al. 2006), concrete mental
representation should prompt the perception of more situational variation, and hence the
experience that “time flies” (Hansen and Trope 2013). Variation of high-level [low-level]
features of a situation prompts individuals with an abstract [concrete] mindset to perceive time as
passing quicker.
CLT’s underlying assumption that the absence of experience is directly related to
construal level has been explored in experiments using subliminal exposition to unfamiliar
stimuli (see Förster 2009) as well in experiments comparing direct vs. indirect product exposure
effects on construal level (see Hamilton and Thompson 2007). The aggregate results confirm that
deviance from direct experience leads to higher level construal and abstract information
processing. Further, preferences based on direct and indirect experiences converge when
individuals are prompted to adopt a low-level construal prior to their indirect product experience
(Hamilton and Thompson 2007).

38
Wilson et al. (2013) not only extends CLT from a theoretical perspective, but also places
the extension in a context that should be of interest to accounting researchers. The authors apply
CLT to the domain of distributed (virtual) teams and identify contextual moderators of the
association between objective distance and psychological distance. The contextual factors
identified include organizational structural assurance; feedback loops; leadership intervention;
interaction history; team structure, composition and work practices; and technology affordances.
Based on this theoretical extension, the authors offer several interesting propositions: (1) higher
team task interdependence as well as increased stability of team membership will lessen the
impact of objective distance on psychological distance; (2) higher degree of technology
adaptation to the group-specific needs lessens the impact of objective distance on psychological
distance; (3) selecting a lower-bandwidth medium if a higher-bandwidth medium is accessible
magnifies the impact of objective distance on psychological distance; and (4) better historical
team performance lowers the impact of objective distance on psychological distance. Focusing
on IT teams, Cha and Park (2014) show that proximity along various psychological distance
dimensions has beneficial effects on both teamwork quality and performance. Specifically,
spatial, temporal, and social distance not only affect different teamwork quality factors (i.e., team
communication, coordination, collaboration, and cohesion), but also vary with respect to their
strength of impact. Table 6 summarizes construal mindset oriented CLT research.
CLT-Informed Accounting Research
Only a few accounting studies to date, most of them at the working-paper stage, draw on
CLT as a theoretical foundation. Among those, several examine how overall mindset orientation
affects decision-makers’ behavior and judgment. Those studies show that mindset orientation has

39
important implications for the decisions rendered and actions taken by professional (e.g., Backof
et al. 2013; Backof et al. 2014; Rasso 2014) and non-professional decision-makers (e.g., Elliott
et al. 2014; McPhee 2014).
Managerial accounting research indicates that the effectiveness of different incentive
types not only hinges on the type of task the incentive is intended to motivate, but also on
temporal considerations (McPhee 2014). Specifically, promising cash incentives to be paid in the
near future (which prompts a concrete mindset orientation) is most suitable for motivating high
performance on an analytical task. However, with respect to creative tasks, promising non-cash
incentives to be awarded in the distant future (which induces an abstract mindset orientation) is
equally effective (and possibly more cost-effective). This research points to the importance of
aligning information processing orientation, instantiated by properly matching reward type and
temporal distance, with behavior (i.e., performance).
Audit research has investigated how auditor skepticism is affected by (a) the manner in
which management presents evidence for its complex accounting estimates (i.e., graphical versus
verbal presentation) and (b) auditors’ judgment framework (how versus why considerations)
(Backof et al. 2014). Building on Amit et al.’s (2009) findings that pictorial presentation,
compared to verbal communication, leads to lower level construal, Backof et al. (2014) show
that pictorial presentation facilitates the detection of trend deviations. The researchers also
identify a CLT-based intervention mechanism that increases professional skepticism: prompting
auditors to reflect on how (rather than why) management arrived at its assumptions draws their
attention to concrete deviations from historical trends, that is, to contradictory information.
However, Backof et al. (2013) identify circumstances under which a deliberative (i.e., abstract)
mindset achieved by considering why-questions effectively increases professional skepticism.

40
Increased psychological distance improves auditors’ ability to restrain aggressive financial
reporting by drawing attention towards the economic substance of a transaction. Rasso (2014)
bridges Backof et al. (2014) and Backof et al. (2013) by showing that an abstract mindset
orientation, induced by simple CLT-informed audit documentation instructions, can increase
auditors’ professional skepticism when a piecemeal evidence gathering process accompanies the
evaluation of complex estimates (i.e., in situations in which auditors face incomplete evidence
sets). The author shows that auditors’ ability to see the big picture and to assimilate large
amounts of evidence is enhanced when auditors are challenged to evaluate audit evidence
broadly and to question why the client’s estimate may be materially misstated or fairly presented.
Within the financial accounting domain, research indicates that mindset orientation
affects professional and non-professional investors’ judgment and behavior. Lundholm et al.
(2014) conduct a textual analysis of corporate earnings press releases and Management’s
Discussion and Analysis (MD&A) sections of 10-K filings and find that both the frequency of
numerical statements and the overall readability of the examined publications increases with
geographic distance between the foreign firm and the U.S. The authors conclude that foreign
firms may effectively lower potential U.S. investors’ psychological distance by providing more
concrete (i.e., numerical, based on CLT) and more readable disclosures.
Elliott et al. (2015) demonstrate that Corporate Social Responsibility (CSR) performance
reports which properly match pursued corporate CSR strategy (e.g., focus on local vs. global
activities) with communication style (i.e., by highlighting pictures vs. words) promote processing
fluency and subsequently non-professional investors’ willingness to invest. Results also indicate
that the fit between described strategic efforts and presentation style subconsciously affects

41
investors’ willingness to invest and that the aforementioned results apply only to investors who
are less numerate (i.e., those who tend to rely more on non-numerical information).
The remaining three CLT-informed accounting studies examine specific dimensions of
psychological distance by exploring spatial distance effects (Elliott et al. 2014; Weisner and
Sutton 2015) and temporal distance effects (White 2014) on judgment and behavior. Set within
the financial accounting context, Elliott et al. (2014) show that investors are more willing to
invest in a firm when concrete language, rather than abstract language, is highlighted in an
investment prospectus. This relationship is particularly pronounced when the spatial distance
between investor and firm is large given that increased psychological distance is associated
lower investor comfort.
With a focus on temporal distance effects on investors’ decision-making, White (2014)
demonstrates that investors’ investment horizon (i.e., temporal outlook) affects their sensitivity
to disclosed uncertainty. Specifically, investors who are focused on short-term rather than long-
term financial performance exhibit greater sensitivity to variations in fair value input level and
related measurement disclosures when assessing the uncertainty associated with a disclosed
estimate. Moreover, sensitivity to uncertainty and related disclosures also affects judgments of
overall firm value, potentially leading to biases in investor decision-making.
Lastly, CLT-informed audit research shows how spatial distance can affect audit
professionals’ judgment even in situations in which geographic proximity is decision-irrelevant.
Combining insights from basic CLT research and theoretical extensions proposed by Wilson et
al. (2013), Weisner and Sutton (2015) show that increased spatial distance between an audit
client and a management-appointed, teleworking specialist reduces auditors’ reliance on the
work of the specialist. Further, the reliance decision interacts with the auditors’ historical

42
experience with their client’s internal audit function (IAF) such that reliance is lowest when prior
experience indicates a weak IAF. The authors also developed and validated instruments for
assessing individuals’ propensity toward spatial and cultural sensitivity. Table 7 summarizes the
CLT-informed accounting literature.
Implications for Accounting Research
The link between distance and prediction, distance and evaluation (e.g., primary versus
secondary features, desirability versus feasibility concerns, pros versus cons, alignable versus
non-alignable features), and distance and behavior (e.g., forecasting intentions from values and
overall attitudes, logrolling willingness in negotiation, exertion of self-control, susceptibility to
the sunk-cost bias) is summarized by Trope et al. (2007) and illustrated via numerous articles
reviewed in the preceding section. Based on this review, this study argues that accounting
academicians should further explore those links and associated implications for prediction,
evaluation, and behavior in accounting relevant settings.
The following paragraphs offer broad research questions for behavioral accounting
researchers of various disciplines. While the research questions are grouped by discipline
(accounting information systems, audit, financial and managerial accounting, and tax), some
overlap may exist. Most research questions make reference to psychological distance in general
rather than specific dimensions in order to avoid repeating the research question whenever more
than one manifestation of psychological distance is of interest.6 Another word of caution seems
appropriate. Not all research questions presented are claimed to address formerly disregarded
areas of investigation; however, CLT-based inquiry and the associated focus on underlying,
6 See Liberman et al. (2007c) for a discussion of the interchangeability of the various distance dimensions with
respect to their effects on prediction, evaluation, and behavior.

43
mediating cognitive processes may deepen our understanding of various phenomena previously
examined through another lens or framework. Furthermore, the four dimensions of psychological
distance are not purported to be equally relevant (or interesting) to each accounting discipline
and related research questions. For example, while the temporal distance dimension may be of
particular interest in the domain of managerial accounting (e.g., forecasting associated with
capital projects) or auditing (e.g., engagement timing), the investigation of the impact of other
dimensions of psychological distance (particularly spatial distance and hypotheticality) may offer
more novel insights. The reason for this is that fewer alternative theories that may lead to
equivalent predictions (e.g., refer to the earlier discussion of competing time-discounting
theories) are available for researchers to draw upon. However, as several of the reviewed articles
illustrate, the broad CLT framework may also explain preference reversal phenomena or identify
asymmetry in focus on decision-relevant features that contradict extant theories. A CLT
approach offers the opportunity to revisit earlier studies that failed to find expected results.
Another fruitful avenue for revisiting extant research and for exploring the research
questions explicated below would be to focus on multiple dimensions of psychological distance
(i.e., cross-dimensional distancing; see Maglio et al. 2013). Once sufficient support for the
applicability of core CLT propositions to the accounting context has been established, the
intersection between CLT and other theories commonly applied in behavioral accounting
research should be investigated. Examples of more specific future research opportunities are
discussed in the following subsections.

44
Accounting Information Systems (AIS)
As illustrated by several of the reviewed studies, research finds overwhelming support for
the CLT proposition that, depending on psychological distance, decision-makers differentially
weight desirability versus feasibility considerations associated with a course of action or object.
Moreover, this research shows that preference reversal may occur. Accounting information
systems researchers could explore whether technology implementation decisions are affected by
psychological distance.
RQ1a: How does psychological distance affect technology implementation
decisions?
RQ1b: Does the weight attributed to desirability vs. feasibility considerations
change as a result of shifting psychological distance?
Another fundamental question for AIS researchers, which is derived from the CLT
proposition that construal mindset affects decision-makers’ predictions and judgments (e.g.,
Trope et al. 2007), concerns decision aid design. AIS researchers may want to investigate how
decision aid design influences users’ construal mindset orientation and hence their interpretation
and acceptance of the decision aid’s output.
RQ2a: Does decision aid design affect construal mindset orientation? Can
decision aids be designed to mitigate CLT biases?
RQ2b: Which decision aid design features should allow for flexibility such that
congruency between decision task type and mindset orientation is
maximized?
Several other interesting avenues for future research are offered by Wilson et al. (2013).
A closer look at Wilson et al.’s (2013) model and related propositions is recommended as a

45
wealth of research opportunities are presented. Particularly Proposition 7A on technology
adaptation and Proposition 7B on media choice should draw attention from AIS researchers as
either proposition could be tested in the context of distributed audit teams or in the context of
dispersed corporate accounting team members.
Audit
Building on insights from Henderson et al. (2006), audit researchers may wish to explore
how the timing of negotiations between auditors and their clients affects negotiation outcome
and consequential satisfaction of either party. Similarly, the effect of spatial distance in
technology-facilitated negotiations may be explored through a CLT-lens.
RQ3: Is auditor-client negotiation outcome affected by psychological distance?
Future research could also apply CLT insights concerning data patterns (refer to RQ9 for
a brief explanation) to the audit context. For example, researchers could investigate whether
going-concern opinions are more likely to be issued to a spatially distant client, compared to a
spatially proximate client, if graphically displayed financial information supplements other
decision-relevant information.
RQ4: How does psychological distance from an audit client affect the
interpretation of graphically presented financial information or other
types of audit evidence?
Another avenue for audit research would be to explore whether asking why versus how
questions (see Wakslak and Trope 2009; Backof et al. 2013, 2014) - for example during a pre-
engagement brainstorming session - affects cognitive orientation and subsequently audit risk

46
judgments. Such inquiry could offer interesting, cognition-based insights for the professional
skepticism literature.
RQ5: Is client risk assessment affected by overall mindset orientation?
Aside from informing auditors’ judgment related to their client, CLT may also be used to
investigate various phenomena concerning the audit firm’s internal processes and related
employee perceptions. For example, McCrea et al.’s (2008) finding that individuals are less
prone to procrastinate when they receive instruction that triggers more concrete construal
suggests that more concrete review notes lead to less delay in clearing ‘points’.
RQ6: Are auditors less prone to procrastinate when review points are framed
concretely?
Additionally, research opportunities identified by Wilson et al. (2013) and Wakslak et al.
(2008) may be adapted to inform the audit literature on performance reviews and feedback.
Applied to an audit setting, Wilson et al. (2013) can be interpreted as suggesting that accounting
professionals may find it particularly hard to accept the receipt of negative feedback for behavior
at a remote location as such behavior may have run counter to their perceived core identity and
associated professional values. Relatedly, Wakslak et al. (2008) suggest that one could
hypothesize and test whether negative feedback (e.g., in an audit review setting) prompts weaker
spillover effects in situations in which the feedback refers to something associated with the near
future.
RQ7: How is auditors’ acceptance of negative feedback affected by
psychological distance?
From the perspective of the reviewer and adapted to the audit context, Wilson et al.
(2013) may be interpreted as suggesting that researchers investigate how performance reviews of

47
geographically distant versus proximate audit team members vary based on supervisors’
attention to global versus contextualized performance aspects. This research question, adapted
from Wilson et al. (2013), is based on the authors’ argument that memory about performance
should be differentially stored and retrieved and thus should lead to different evaluations.
RQ8: How are performance reviews affected by psychological distance?
Financial and Managerial Accounting
An interesting research question for financial accounting researchers comes directly from
Henderson et al. (2006a) who find that psychological distance affects the interpretation of data
trend patterns. The authors suggest that an “implication of [their] studies is that when individuals
(e.g., U.S.-affiliated stock brokers) make decisions (e.g., investments) based on information
about spatially near events (e.g., stock market information on Wall Street) rather than distant
events (e.g., the stock market in Tokyo), they will be more likely to exaggerate the significance
of small departures from general data patterns” (p. 853). Interpreted more broadly, accounting
researchers could investigate how the interpretation of graphically depicted data patterns varies
based on distancing on any psychological distance dimension.
RQ9: How does psychological distance from an investment target affect the
interpretation of graphically presented financial information?
This research question is not limited to studies of (non-) professional investor decision-making.
Application in a managerial budgeting context involving projected financial data would seem
equally interesting.
Another appealing research question comes from Liberman et al. (2007a) who argue that
if certain investment decisions are susceptible to bias due to risk aversion, taking a distal

48
perspective may mitigate this problem. This argument is based on Liberman et al.’s (2007a)
conclusion that risk, which is a lower-level attribute, will decline in salience with increasing
psychological distance. Researchers could thus investigate if the use of established de-biasing
mechanisms (e.g., considering the why aspects of a decision) reduces investors’ or managerial
decision-makers’ risk aversion.
RQ10: Can psychological distancing reduce risk aversion related to financial
decisions?
CLT findings with respect to the consideration of alternative courses of action may also
open multiple avenues for accounting research. Liberman et al. (2007a), for example, argue that
as psychological proximity increases, conceptual alternatives (e.g., insurance vs. savings) may
become less salient while contextual alternatives (e.g., the number of insurance plans likely to be
considered) draw increased attention. Accounting researchers would be well equipped to explore
this proposition in the domain of risk management. Similarly, the effect of psychological
distance on consideration-set choice could be investigated in the context of corporate investment
decisions and capital budgeting.
RQ11: How is the consideration of alternative risk management practices
affected by psychological distance?
RQ12: How is the consideration of alternative corporate investment options
affected by psychological distance?
Another highly relevant research question related to the domain of risk management can
be traced back to Henderson et al. (2006a). Henderson et al. (2006a) suggest that with respect to
distant events (e.g., operations at remote corporate divisions), individuals (e.g., risk managers)

49
may be more inclined to devote scarce resources towards preparation for rather common
contingencies than for the preparation for more unusual risk factors.
RQ13: Does psychological distance affect the selection of risk response choices
(e.g., through variation in the weight attributed to desirability vs.
feasibility considerations)?
Additionally, CLT-based risk management research could examine whether Chandran
and Menon’s (2004) findings hold in the context of business or investment risk communications
and explore whether organizational commitment to risk-mitigating actions mirror those identified
for individuals in the context of health risks. Such inquiry could be informative to managerial
and financial accounting researchers alike.
RQ14: How is the communication of business risk to external and internal
stakeholders affected by psychological distance?
RQ15: How is commitment to risk mitigating practices affected by psychological
distance?
The literature on management credibility may also benefit from extensions inspired by
psychology-based CLT research. For example, Fujita et al.’s (2008) and Kim et al.’s (2009)
finding that the persuasiveness of a communication is enhanced through careful alignment
between psychological distance and focus on either high-level or low-level aspects of the
message could be explored in the context of executive communications with investors or
shareholder activists. For example, revealing the location of an apologetic CEO (Elliott et al.
2012) and hence his spatial distance from the message recipient may affect psychological
distance and consequently the recipient’s focus on different attributes of the message.
Alternatively, management credibility could be investigated in the context of MD&A discussions

50
or news releases in which management describes the prospects of a new venture occurring in the
near future or distant future or at a proximate vs. distant location.
RQ16: How are perceptions of management credibility affected by psychological
distance?
A number of appealing research questions related to managerial probability judgments
can either be directly traced to Wakslak (2012) or inferred from her directions for future inquiry.
One interesting proposition from Wakslak (2012) is to investigate judgments about the likelihood
that a bid for a proximate versus remotely located project will succeed. Another recommendation
by the author can be interpreted as encouraging the investigation of how the likelihood that a
‘black swan’ event occurs is affected by temporal distance. Lastly, Wakslak (2012) suggests that
research take a closer look at managerial assessment of the probability that a remotely
supervised, compared to a proximately supervised, team member does not complete a project in
time. Clearly, the latter question also seems a prime target for investigation in an audit context.
More broadly stated the following research question could be explored in a variety of settings:
RQ17: Does psychological distance affect managerial probability assessment?
Another likely target for application of CLT to the managerial accounting domain would
be the analysis of (1) whether critical budgeting decisions (or make-or-buy decisions) are
influenced by psychological distance to the target; and (2) whether psychological distance affects
managers’ commitment to long-term capital projects. CLT would predict that a project
manager’s spatial distance from a capital project she oversees affects her consideration of
desirability versus feasibility concerns. This may have important consequences for the escalation
of commitment and related resource allocation decisions (see also Park and Jang 2014 with
respect to temporal distance related perceptions of sunk cost). Similarly, a project manager’s

51
perception of the likelihood that a new, risky capital project will succeed may be affected by
temporal distance between the likelihood assessment and the planned commencement of the
project and hence affect her support of the project. More broadly stated:
RQ18a: How does psychological distance affect corporate budgeting decisions?
RQ18b: Does the weight attributed to desirability vs. feasibility considerations
change as a result of shifting psychological distance?
RQ19: How is managerial support of a capital project affected by psychological
distance?
RQ20: Is the escalation of commitment in a corporate budgeting setting
moderated by psychological distance?
The impact of psychological distance on decision-makers’ ability to generate pros and
cons for a course of action represents another consistent finding in the CLT literature that may
have implications for corporate planning efforts as well as for business advisory services
(including tax planning) in a variety of settings. Accounting researchers may thus want to
investigate how the timing of brainstorming or planning sessions (in relation to the decision-
implementation stage) affects support for the decision-target.
RQ21: Does the timing of brainstorming sessions influence outcome?
Aside from informing probability judgments and budgetary decisions, CLT may also
offer a novel framework through which business ethics research can be advanced. Particularly
the insights from CLT-based self-regulation studies may enable researchers to gain a deeper
understanding of the cognitive processes associated with ethical decision-making in a corporate
context. Accounting researchers could, for example, investigate how temptations to engage in
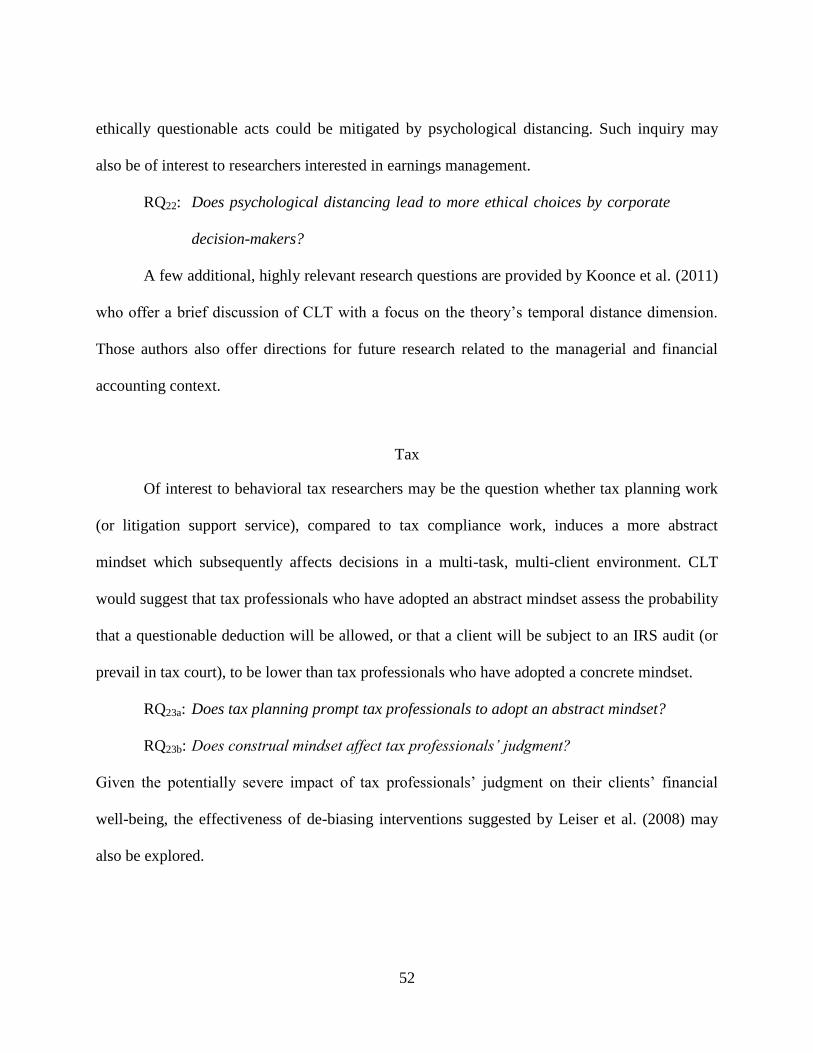
52
ethically questionable acts could be mitigated by psychological distancing. Such inquiry may
also be of interest to researchers interested in earnings management.
RQ22: Does psychological distancing lead to more ethical choices by corporate
decision-makers?
A few additional, highly relevant research questions are provided by Koonce et al. (2011)
who offer a brief discussion of CLT with a focus on the theory’s temporal distance dimension.
Those authors also offer directions for future research related to the managerial and financial
accounting context.
Tax
Of interest to behavioral tax researchers may be the question whether tax planning work
(or litigation support service), compared to tax compliance work, induces a more abstract
mindset which subsequently affects decisions in a multi-task, multi-client environment. CLT
would suggest that tax professionals who have adopted an abstract mindset assess the probability
that a questionable deduction will be allowed, or that a client will be subject to an IRS audit (or
prevail in tax court), to be lower than tax professionals who have adopted a concrete mindset.
RQ23a: Does tax planning prompt tax professionals to adopt an abstract mindset?
RQ23b: Does construal mindset affect tax professionals’ judgment?
Given the potentially severe impact of tax professionals’ judgment on their clients’ financial
well-being, the effectiveness of de-biasing interventions suggested by Leiser et al. (2008) may
also be explored.

53
Conclusion
This research reviews the literature on construal level theory (Liberman and Trope 1998;
Trope and Liberman 2003) - a theory of social cognition (e.g., Amit et al. 2009) and leading
framework of contemporary theorization on the composition of psychological distance (Williams
and Bargh 2008). The reviewed literature finds converging evidence for the CLT proposition that
psychological distance, effected through temporal distance, spatial distance, social distance, or
through hypotheticality, affects decision-makers’ predictions, evaluations, and behavior; and that
those effects are mediated by the degree of abstractness with which objects, persons, situations,
or events are mentally presented. Psychological distance effects on prediction include variation
in the degree of confidence with which predictions are rendered and variation in the degree of
correspondence bias. Psychological distance effects on evaluation (or judgment/preference/
perception) include variations in the consideration of primary versus secondary features;
desirability versus feasibility concerns; pros versus cons; idealistic versus pragmatic concerns;
and alignable versus non-alignable features. Lastly, psychological distance effects on behavior
include variations in forecasting intentions from values and overall attitudes, logrolling
willingness in negotiation, exertion of self-control, performance on abstract vs. concrete tasks,
susceptibility to the sunk-cost bias, perception of risk and time frame, and client impatience.
Given those findings, as accounting, auditing, and business in general becomes increasingly
global and geographically dispersed, behavioral accounting researchers should no longer ignore
the predictions and insights provided by CLT. Accounting professionals, organizational actors,
and other decision-makers who rely on accounting information regularly predict situations,
express preferences, evaluate situations, or act upon considerations that encompass varying
degrees of psychological distance. Specific CLT propositions about how those predictions,

54
evaluations, and behaviors are influenced by psychological distance should therefore enable
accounting researchers to gain a deeper understanding of the heuristics and biases associated
with judgment and decision-making in distance-affected decision environments.
As is evident from the discussion of the reviewed accounting papers, CLT research in the
accounting domain has just recently emerged. Moreover, extant CLT-based accounting research
is not only limited with respect to applied accounting domains (i.e., financial accounting,
managerial accounting, and auditing), but also with respect to psychological distance dimensions
(i.e., spatial and temporal distance). This literature review argues that a host of research
questions spanning multiple accounting domains and psychological distance dimensions await
exploration by behavioral accounting researchers. This research strives to illustrate how CLT,
through its focus on mediating cognitive mechanisms, may offer accounting academicians the
opportunity to gain a deeper understanding of the predictions, judgments, preferences,
perceptions, evaluations, and behaviors of accounting professionals, corporate managers, and
(non-) professional investors. To this end, several broad research questions related to various
accounting disciplines are put forward.
Throughout the article, the theory’s underlying logic is explained and commonalities and
differences between CLT and related or competing theories in terms of their prediction and focus
are highlighted. By documenting interesting and frequently applied experimental manipulations
and providing a variety of research questions, this research hopes to motivate behavioral
accounting researchers to consider CLT as a basis for exploring critical research questions in the
judgment and decision-making domain.

55
References
Agrawal, N., and E. W. Wan. 2009. Regulating risk or risking regulation? Construal levels and
depletion effects in the processing of health messages. Journal of Consumer Research 36
(3): 448-462.
Alter, A. L., D. M. Oppenheimer, and J. C. Zemla. 2010. Missing the trees for the forest: A
construal level account of the illusion of explanatory depth. Journal of Personality and
Social Psychology 99 (3): 436-451.
Amit, E., C. Wakslak, and Y. Trope. 2013. The use of visual and verbal means of
communication across psychological distance. Personality and Social Psychology
Bulletin 39 (1): 43-56.
Amit, E., D. Algom, and Y. Trope. 2009. Distance-dependent processing of pictures and words.
Journal of Experimental Psychology: General 138 (3): 400-415.
Backof, A. G., E. M. Bamber, and T. D. Carpenter. 2013. More precise versus less precise
accounting standards: The effect of auditor judgment frameworks in constraining
aggressive reporting. Working Paper. Available at
https://execed.mccombs.utexas.edu/~/media/Files/MSB/Departments/Accounting/Brown
bag%20papers/CarpenterPaper.PDF.
Backof, A. G., J. M. Thayer, and T. Carpenter. 2014. Auditing complex estimates: Management-
provided evidence and auditors’ consideration of inconsistent evidence. Working Paper.
Available at SSRN: http://ssrn.com/abstract=2279138.
Bar-Anan, Y., N. Liberman, and Y. Trope. 2006. The association between psychological distance
and construal level: Evidence from an implicit association test. Journal of Experimental
Psychology: General 135 (4): 609-622.
Bar-Anan, Y., Y. Trope, N. Liberman, and D. Algom. 2007. Automatic processing of
psychological distance: Evidence from a stroop task. Journal of Experimental
Psychology: General 136 (4): 610-622.
Barreto, I., and D. L. Patient. 2013. Toward a theory of intraorganizational attention based on
desirability and feasibility factors. Strategic Management Journal 34 (6): 687-703.
Bonner, C., and B. R. Newell. 2008. How to make a risk seem riskier: The ratio bias versus
construal level theory. Judgment and Decision Making 3 (5): 411-416.
Borovoi, L., N. Liberman, and Y. Trope. 2010. The effects of attractive but unattainable
alternatives on the attractiveness of near and distant future menus. Judgment and
Decision Making 5 (2): 102-109.

56
Cantor, D. E., and J. R. Macdonald. 2009. Decision-making in the supply chain: Examining
problem solving approaches and information availability. Journal of Operations
Management 27 (3): 220-232.
Cha, M., and J. Park. 2014. Effects of team member psychological proximity on teamwork
performance. Team Performance Management 20 (1/2): 81-96.
Chandran, S., and G. Menon. 2004. When a day means more than a year: Effects of temporal
framing on judgments of health risk. Journal of Consumer Research 31 (2): 375-389.
Day, S. B., and D. M. Bartels. 2008. Representation over time: The effects of temporal distance
on similarity. Cognition 106 (3): 1504-1513.
DeDreu, C. K. W., M. Giacomantonio, S. Shalvi, and D. Sligte. 2009. Getting stuck or stepping
back: Effects of obstacles and construal level in the negotiation of creative solutions.
Journal of Experimental Social Psychology 45 (3): 542-548.
Dutton, J. E., L. Fahey, and V. K. Narayanan. 1983. Toward understanding strategic issue
diagnosis. Strategic Management Journal 4 (4): 307-323.
Ekstrom, R. B., J.W. French, H. H. Harman, H. H., and D. Derman. 1976. Kit of factor-
referenced cognitive tests. Princeton, NJ: Educational Testing Service.
Elliott, W. B., F. D. Hodge, and L. M. Sedor. 2012. Using online video to announce a
restatement: Influences on investment decisions and the mediating role of trust. The
Accounting Review 87 (2): 513-535.
Elliott, W. B., K. M. Rennekamp, and B. J. White. 2014. Does concrete language in disclosures
increase willingness to invest? Review of Accounting Studies: 1-27.
Elliott, W. B., S. M. Grant, and K. M. Rennekamp. 2015. How disclosure features of corporate
social responsibility reports interact with investor numeracy to influence investor
judgment. Working Paper. Available at SSRN: http://ssrn.com/abstract=2425731.
Eyal, T., M. D. Sagristano, Y. Trope, N. Liberman, and S. Chaiken. 2009. When values matter:
Expressing values in behavioral intentions for the near vs. distant future. Journal of
Experimental Social Psychology 45 (1): 35-43.
Eyal, T., N. Liberman, and Y. Trope. 2008. Judging near and distant virtue and vice. Journal of
Experimental Social Psychology 44 (4): 1204-1209.
Eyal, T., N. Liberman, Y. Trope, and E. Walther. 2004. The pros and cons of temporally near
and distant action. Journal of Personality and Social Psychology 86 (6): 781-795.

57
Fiedler, K. 2007. Construal level theory as an integrative framework for behavioral decision-
making research and consumer psychology. Journal of Consumer Psychology 17 (2):
101-106.
Fiedler, K., J. Jung, M. Wänke, and T. Alexopoulos. 2012. On the relations between distinct
aspects of psychological distance: An ecological basis of construal-level theory. Journal
of Experimental Social Psychology 48 (5): 1014-1021.
Förster, J. 2009. Cognitive consequences of novelty and familiarity: How mere exposure
influences level of construal. Journal of Experimental Social Psychology 45 (2): 444-447.
Förster, J., R. Friedman, and N. Liberman. 2004. Temporal construal effects on abstract and
concrete thinking: Consequences for insight and creative cognition. Journal of
Personality and Social Psychology 87 (2): 177-189.
Frederick, S., G. Loewenstein, and T. O’Donoghue. 2002. Time discounting and time preference:
A critical review. Journal of Economic Literature 40 (2): 351-401.
Freitas, A. L., P. Salovey, and N. Liberman. 2001. Abstract and concrete self-evaluative goals.
Journal of Personality and Social Psychology 80: 410-424.
Freitas, A. L., K. L. Langsam, S. Clark, and S. J. Moeller. 2008. Seeing oneself in one's choices:
Construal level and self-pertinence of electoral and consumer decisions. Journal of
Experimental Social Psychology 44 (4): 1174-1179.
Freitas, A. L., P. Gollwitzer, and Y. Trope. 2004. The influence of abstract and concrete
mindsets on anticipating and guiding others' self-regulatory efforts. Journal of
Experimental Social Psychology 40 (6): 739-752.
Fujita, K. 2008. Seeing the forest beyond the trees: A construal level approach to self-control.
Social and Personality Psychology Compass 2 (3): 1475-1496.
Fujita, K., and H. A. Han. 2009. Moving beyond deliberative control of impulses. The effect of
construal levels on evaluative associations in self-control conflicts. Psychological Science
20 (7): 799-804.
Fujita, K., and J. J. Carnevale. 2012. Transcending temptation through abstraction: The role of
construal level in self-control. Current Directions in Psychological Science 21 (4): 248-
252.
Fujita, K., M. D. Henderson, J. Eng, Y. Trope, and N. Liberman. 2006a. Spatial distance and
mental construal of social events. Psychological Science 17 (4): 278-282.
Fujita, K., T. Eyal, S. Chaiken, Y. Trope, and N. Liberman. 2008. Influencing attitudes toward
near and distant objects. Journal of Experimental Social Psychology 44 (3): 562-572.

58
Fujita, K., Y. Trope, N. Liberman, and M. Levin-Sagi. 2006b. Construal levels and self-control.
Journal of Personality and Social Psychology 90 (3): 351-367.
Gollwitzer, P. M. 1990. Action phases and mindsets. In E.T. Higgins & R. M. Sorrentino (Eds.),
Handbook of motivation and cognition: Foundations of social behavior (Vol. 2, pp. 53-
92). New York: Guilford Press.
Hamilton, R. W., and D. V. Thompson. 2007. Is there a substitute for direct experience?
Comparing consumers' preferences after direct and indirect product experiences. Journal
of Consumer Research 34 (4): 546-555.
Hansen, J., and Y. Trope. 2013. When time flies: How abstract and concrete mental construal
affect the perception of time. Journal of Experimental Psychology: General 142 (2): 336-
347.
Hardin, G. 1968. Tragedy of the commons. Science 162 (3859): 1243-1248.
Henderson, M. D. 2011. Mere physical distance and integrative agreements: When more space
improves negotiation outcomes. Journal of Experimental Social Psychology 47 (1): 7-15.
Henderson, M. D., and C. J. Wakslak. 2010. Over the hills and far away: The link between
physical distance and abstraction. Current Directions in Psychological Science 19 (6):
390 - 394.
Henderson, M. D., C. J. Wakslak, K. Fujita, and J. Rohrbach. 2011. Construal level theory and
spatial distance: Implications for mental representation, judgment, and behavior. Social
Psychology 42 (3): 165-173.
Henderson, M. D., K. Fujita, Y. Trope, and N. Liberman. 2006a. Transcending the "here": The
effect of spatial distance on social judgment. Journal of Personality and Social
Psychology 91 (5): 845-856.
Henderson, M. D., Y. Trope, and P.J. Carnevale. 2006b. Negotiation from a near and distant time
perspective. Journal of Personality and Social Psychology 91 (4): 712-729.
Herzog, S. M., J. Hansen, and M. Wänke. 2007. Temporal distance and ease of retrieval. Journal
of Experimental Social Psychology 43 (3): 483-488.
Jia, L., E. R. Hirt, and S. C. Karpen. 2009. Lessons from a faraway land: The effect of spatial
distance on creative cognition. Journal of Experimental Social Psychology 45 (5): 1127-
1131.

59
Jones, E. E., and R. E. Nisbett. 1972. The actor and the observer: Divergent perceptions of the
causes of behavior. In E. E. Jones, D. E. Kanouse, H. H. Kelley, R. E. Nisbett, S. Valins,
& B. Weiner (Eds.), Attribution: Perceiving the causes of behavior (pp. 79-94).
Morristown, NJ: General Learning Press.
Kahneman, D., and A. Tversky. 1979. Prospect theory: An analysis of decision under risk.
Econometrica 47 (2): 263-291.
Kim, H., A. R. Rao, and A. Y. Lee. 2009. It's time to vote: The effect of matching message
orientation and temporal frame on political persuasion. Journal of Consumer Research 35
(6): 877-889.
Kim, H., S. Schnall, D. Yi, and M. P. White. 2013. Social distance decreases responders'
sensitivity to fairness in the ultimatum game. Judgment and Decision Making 8 (5):632-
638.
Kim, K., M. Zhang, and X. Li. 2008. Effects of temporal and social distance on consumer
evaluations. Journal of Consumer Research 35 (4): 706-713.
Kivetz, Y. and T. R. Tyler. 2007. Tomorrow I'll be me: The effect of time perspective on the
activation of idealistic versus pragmatic selves. Organizational Behavior and Human
Decision Processes 102 (2): 193-211.
Köhler, C. F., E. Breugelmans, and B. G. C. Dellaert. 2011. Consumer acceptance of
recommendations by interactive decision aids: The joint role of temporal distance and
concrete versus abstract communications. Journal of Management Information Systems
27 (4): 231-260.
Koonce, L., N. Sybert, and J. Smith. 2011. Causal reasoning in financial reporting and voluntary
disclosure. Accounting, Organizations and Society 36 (4-5): 209-225.
Ledgerwood, A., Y. Trope, and N. Liberman. 2010. Chapter 6 - Flexibility and consistency in
evaluative responding: The function of construal level. Advances in Experimental Social
Psychology 43: 257-295.
Leiser, D., O. H. Azar, and L. Hadar. 2008. Psychological construal of economic behavior.
Journal of Economic Psychology 29 (5): 762-776.
Lewin, K. 1951. Field theory in social science: Selected theoretical papers. D. Cartwright (Ed.),
New York: Harper & Row.
Liberman, N., and J. Förster. 2009. The effect of psychological distance on perceptual level of
construal. Cognitive Science 33 (7): 1330-1341.

60
Liberman, N., and Y. Trope. 1998. The role of feasibility and desirability considerations in near
and distant future decisions: A test of temporal construal theory. Journal of Personality
and Social Psychology 75 (1): 5-18.
Liberman, N., and Y. Trope. 2008. The psychology of transcending the here and now. Science
322 (5905): 1201-1205.
Liberman, N., M. D. Sagristano, and Y. Trope. 2002. The effect of temporal distance on level of
mental construal. Journal of Experimental Social Psychology 38: 523-534.
Liberman, N., Y. Trope, and C. Wakslak. 2007a. Construal level theory and consumer behavior.
Journal of Consumer Psychology 17 (2): 113-117.
Liberman, N., Y. Trope, S. M. McCrea, and S. J. Sherman. 2007b. The effect of level of
construal on the temporal distance of activity enactment. Journal of Experimental Social
Psychology 43 (1): 143-149.
Liberman, N., Y. Trope, and E. Stephan. 2007c. Psychological distance. In A. W. Kruglanski &
E. T. Higgins (Eds.), Social psychology: Handbook of basic principles (Vol. 2, pp. 353–
383). New York, NY: Guilford Press.
Liviatan, I., Y. Trope, and N. Liberman. 2008. Interpersonal similarity as a social distance
dimension: Implications for perception of others' actions. Journal of Experimental Social
Psychology 44 (5): 1256-1269.
Loewenstein, G. F. 1996. Out of control: Visceral influences on behavior. Organizational
Behavior and Human Decision Processes 65 (3): 272-292.
Lundholm, R. J., R. Rogo, and J. L. Zhang. 2014. Restoring the tower of Babel: How foreign
firms communicate with U.S. investors. The Accounting Review 89 (4): 1453-1485.
Lynch, J. G., Jr., and G. Zauberman. 2007. Construing Consumer Decision Making. Journal of
Consumer Psychology 17 (2): 107-112.
Magee, J. C., G. J. Kilduff, and C. Heath. 2011. On the folly of principal's power: Managerial
psychology as a cause of bad incentives. Research in Organizational Behavior (31): 25-
41.
Maglio, S. J., Y. Trope, and N. Liberman. 2013. Distance from a distance: Psychological
distance reduces sensitivity to any further psychological distance. Journal of
Experimental Psychology: General 142 (3): 644-657.
Malkoc, S. A., G. Zauberman, and C. Ulu. 2005. Consuming now or later? The interactive effect
of timing and attribute alignability. Psychological Science 16 (5): 411-417.

61
Malkoc, S. A., G. Zauberman, and J. R. Bettman. 2010. Unstuck from the concrete: Carryover
effects of abstract mindsets in intertemporal preferences. Organizational Behavior and
Human Decision Processes 113 (2): 112-126.
Markman, A. B., and D. Gentner. 1993. Splitting the differences: A structural alignment view of
similarity. Journal of Memory and Language 32 (4): 517-535.
McCrea, S. M., N. Liberman, Y. Trope, and S. J. Sherman. 2008. Construal level and
procrastination. Psychological Science 19 (12): 1308-1314.
McPhee, G. 2014. The effects of tangible rewards, payoff timing, and task type on performance.
Working Paper. Florida International University.
Miller, N. E. 1944. Experimental studies of conflict. In J. McV. Hunt (Ed.), Personality and the
behavior disorders (Vol. 1, pp. 431-465). New York: Ronald Press.
Nussbaum, S., N. Liberman, and Y. Trope. 2006. Predicting the near and distant future. Journal
of Experimental Psychology: General 135 (2): 152-161.
Nussbaum, S., Y. Trope, and N. Liberman. 2003. Creeping dispositionism: The temporal
dynamics of behavior prediction. Journal of Personality and Social Psychology 84 (3):
485-497.
Ocasio, W. 1997. Towards an attention-based view of the firm. Strategic Management Journal,
Summer Special Issue 18 (S1): 187-206.
Park, J., and S. Jang. 2014. Sunk costs and travel cancellation: Focusing on temporal cost.
Tourism Management 40: 425-435.
Polman, E., and K. J. Emich. 2011. Decisions for others are more creative than decisions for the
self. Personality and Social Psychology Bulletin 37 (4): 492-501.
Rasso, J. T. 2014. Construal instructions and professional skepticism in evaluating complex
estimates. Working Paper. Available at SSRN: http://ssrn.com/abstract=2505531
Rim, S., J. S. Uleman, and Y. Trope. 2009. Spontaneous trait inference and construal level
theory: Psychological distance increases nonconscious trait thinking. Journal of
Experimental Social Psychology 45 (5): 1088-1097.
Rogers, T., and M. H. Bazerman. 2008. Future lock-in: Future implementation increases
selection of 'should' choices. Organizational Behavior and Human Decision Processes
106 (1): 1-20.
Rozenblit, L. and F. C. Keil. 2002. The misunderstood limits of folk science: An illusion of
explanatory depth. Cognitive Science 26 (5): 521-562.

62
Sagristano, M. D., Y. Trope, and N. Liberman. 2002. Time-dependent gambling: Odds now,
money later. Journal of Experimental Psychology: General 131 (3): 364-376.
Sanna, L. J., E. C. Chang, C. D. Parks, and L. A. Kennedy. 2009. Construing collective concerns.
Increasing cooperation by broadening construals in social dilemmas. Psychological
Science 20 (11): 1319-1321.
Shani, Y., E. R. Igou, and M. Zeelenberg. 2009. Different ways of looking at unpleasant truths:
How construal levels influence information search. Organizational Behavior and Human
Decision Processes 110 (1): 36-44.
Smith, P. K., and Y. Trope. 2006. You focus on the forest when you're in charge of the trees:
Power priming and abstract information processing. Journal of Personality and Social
Psychology 90 (4): 578-596.
Stephan, E., N. Liberman, and Y. Trope. 2011. The effects of time perspective and level of
construal on social distance. Journal of Experimental Social Psychology 47 (2): 397-402.
Taylor, E. Z., and M. B. Curtis. 2013. Whistleblowing in audit firms: Organizational response
and power distance. Behavioral Research in Accounting 25 (2): 21-43.
Taylor, and S. K. Schneider. 1989. Coping and the simulation of events. Social Cognition 7 (2):
174-194.
Todorov, A., A. Goren, and Y. Trope. 2007. Probability as a psychological distance: Construal
and preferences. Journal of Experimental Social Psychology 43 (3): 473-482.
Trope, Y. 2004. Theory in social psychology: Seeing the forest and the trees. Personality and
Social Psychology Review 8 (2): 193-200.
Trope, Y., and N. Liberman. 2000. Temporal construal and time-dependent changes in
preference. Journal of Personality and Social Psychology 79 (6): 876-889.
Trope, Y., and N. Liberman. 2003. Temporal construal. Psychological Review 110 (3): 403-421.
Trope, Y., and N. Liberman. 2010. Construal-level theory of psychological distance.
Psychological Review 117 (2): 440-463.
Trope, Y., N. Liberman, and C. Wakslak. 2007. Construal levels and psychological distance:
Effects on representation, prediction, evaluation, and behavior. Journal of Consumer
Psychology 17 (2): 83-95.
Tumasjan, A., M. Strobel, and I. Welpe. 2011. Ethical leadership evaluations after moral
transgression: Social distance makes the difference. Journal of Business Ethics 99 (4):
609-622.

63
Vallacher, R. R. 1993. Mental calibration: Forging a working relationship between mind and
action. In D. M. Wegner & J. W. Pennebaker (Eds.), Handbook of mental control (pp.
443-472). Englewood Cliffs, NJ: Prentice Hall.
Vallacher, R. R., and D. M. Wegner. 1987. What do people think they’re doing? Action
identification and human behavior. Psychological Review 94 (1): 3-15.
Vallacher, R. R., and D. M. Wegner. 1989. Levels of personal agency: Individual variation in
action identification. Journal of Personality and Social Psychology 57 (4): 660-671.
Wakslak, C. J. 2012. The where and when of likely and unlikely events. Organizational
Behavior and Human Decision Processes 117 (1): 150-157.
Wakslak, C. J., S. Nussbaum, N. Liberman, and Y. Trope. 2008. Representations of the self in
the near and distant future. Journal of Personality and Social Psychology 95 (4): 757-
773.
Wakslak, C. J., Y. Trope, N. Liberman, and R. Alony. 2006. Seeing the forest when entry is
unlikely: Probability and the mental representation of events. Journal of Experimental
Psychology: General 135 (4): 641-653.
Wakslak, C., and Y. Trope. 2009. The effect of construal level on subjective probability
estimates. Psychological Science 20 (1): 52-58.
Weber, E. U. 1994. From subjective probabilities to decision weights: The effect of asymmetric
loss functions on the evaluation of uncertain outcomes and events. Psychological Bulletin
115 (2): 228-242.
Weisner, M. M., and S. G. Sutton. 2015. When the world isn’t always flat: The impact of
psychological distance on auditors’ reliance on specialists. International Journal of
Accounting Information Systems 16: 23-41.
White, B. J. 2014. How do fair value disclosures affect investors’ judgments of estimate
uncertainty and firm value? The role of investment horizon. Working Paper. Available at
SSRN: http://ssrn.com/abstract=2224077.
Wilson, J., C. B. Crisp, and M. Mortensen. 2013. Extending construal-level theory to distributed
groups: Understanding the effects of virtuality. Organization Science 24 (2): 629-644.
Zhao, M., S. Hoeffler, and G. Zauberman. 2007. Mental simulation and preference consistency
over time: The role of process-versus outcome-focused thoughts. Journal of Marketing
Research 44 (3): 379-388.

64
Tables
Table 1: Basic CLT Research & Related Syntheses
Panel A: Basic Research
Study Construct(s)
of Interest Task
Key Methodological
Implications Primary Contribution(s)
Liberman and
Trope (1998)
Temporal
distance
Consideration of
desirability vs.
feasibility aspects
of a situation or
event
Effects reflected in:
activity / event
description
choice
perceived importance
time planning
The value assigned to high-level [low-level]
considerations is weighted higher [lower] in distant
future construals and grows over time [and is subject
to temporal discounting].
Desirability considerations are more heavily
weighted than feasibility concerns when decisions
about distant future actions or plans are rendered.
Trope and
Liberman
(2000)
Temporal
distance
Indication of
preferences for
activities, objects,
and events
Effects hold despite
constant decision-relevant
information
Options that contain positive [negative] high-level
construals but negative [positive] low-level
construals are chosen [rejected] for the distant
future.
Decisions may be regretted as the realization of the
choice approaches.
Liberman et
al. (2002)
Temporal
distance
Reflection on social
experiences and
situations
Effects reflected in:
categorization
expectation of
prototypical
experiences
preferences
Experiences and situations expected in the more
distant future are construed more coherently and in
more abstract, systematic, and simple terms.

65
Study Construct(s)
of Interest Task
Key Methodological
Implications Primary Contribution(s)
Bar-Anan et
al. (2006)
Psychological
distance
Implicit
Association Test
(Greenwald et al.
1998; Greenwald et
al. 2002) (word-
pairing task)
Association between
level of construal and
psychological distance
exists in the absence of
construal targets and their
situation-specific context.
Shows that the association between level of
construal and psychological distance also exists on a
pure conceptual level.
Individuals relate psychological proximity [distance]
to low-level [high-level] construal to a greater
degree than the other way around.
Bar-Anan et
al. (2007)
Psychological
distance
Stroop task
(Stroop, 1935)
(picture-word
version)
NA Psychological distance is subconsciously activated
regardless of its relevance to the required action and
even in situations in which it potentially hinders
performance
Fiedler et al.
(2012)
Psychological
distance
Judge distance
associated with
imagined or
recalled social
behavior
Effects hold irrespective
of whether imagined
future situations or
actually experienced past
situations are evaluated.
Consistent positive correlations among all distance
dimensions, across decision-makers and decision
targets exist.
Maglio et al.
(2013)
Psychological
distance
Judgments and
decisions reflecting
sensitivity to a
second instantiation
of distance
Cross-dimensional
distancing leads to same
effects as within-
dimensional distancing.
A first instantiation of distance lowers sensitivity to
additional distance instantiations.
Subjective sensitivity to a second distance dimension
mediates the impact of the first distance dimension
on choice.

66
Panel B: Syntheses & Reevaluations of the State of CLT Research
Study Construct(s)
of Interest Task
Key Methodological
Implications Primary Contribution(s)
Trope and
Liberman
(2003)
Temporal
distance
NA NA Summarizes theoretical insights and findings from
previous studies and highlights explanatory
shortcomings of competing explanations / theories.
Suggests that construal level may determine
perceived temporal distance (reverse causality).
Proposes a joined theory of psychological distance
(i.e., CLT).
Trope (2004) Temporal
distance
NA NA Explains that CLT conceptually integrates more
restrictive theories and reconciles diverging results
by accounting for both the discounting as well as the
augmentation phenomena associated with temporal
delay.
Argues that CLT is broader in scope than existing
time-perspective theories.
Liberman et
al. (2007a)
Psychological
distance
NA NA Discusses similarities, differences, and interactions
among the four psychological distance dimensions.
Liberman et
al. (2007c)
Psychological
distance;
Construals
NA NA Reviews CLT literature and provides detailed
explanations of the psychological distance and level
of construal concepts.

67
Study Construct(s)
of Interest Task
Key Methodological
Implications Primary Contribution(s)
Trope et al.
(2007)
Psychological
distance
NA NA Illustrates the association between psychological
distance and (1) prediction; (2) evaluation; and (3)
behavior.
Liberman and
Trope (2008)
Psychological
distance
NA NA Emphasizes the bi-directional relationship between
psychological distance and construal level.
Ledgerwood
et al. (2010)
Construal level NA NA Explores the role of construal level on the
consistency and flexibility of evaluations and the
associated implications for social relations.
Trope and
Liberman
(2010)
Psychological
distance
NA NA Highlights the cognitive association among distance
dimensions; their bidirectional relationship with level
of construal; and their comparable effects on
prediction, preferences, and behavior.
Panel C: Commentaries
Study Construct(s)
of Interest Task
Key Methodological
Implications Primary Contribution(s)
Fiedler
(2007)
Psychological
distance
NA NA Highlights how CLT can explain preference
reversals.
Lynch and
Zauberman
(2007)
Psychological
distance
NA NA Discusses the applicability of CLT to consumer
decision-making.

68
Table 2: Temporal Distance Research
Study Task Key Methodological
Implications Primary Contribution(s)
Sagristano et al.
(2002)
Gambling
decision Results mirror those found
in desirability vs. feasibility
studies in which the
outcome was controllable
(see Liberman and Trope
1998).
Temporal distance raises [lowers] individuals’ preferences for
gambles with a low [high] probability of receiving a large [small]
payoff.
Decision-makers fail to render judgments consistent with the
symmetry between payoffs and probability.
Nussbaum et al.
(2003)
Social prediction
and attributional
inference
NA Predictions about distant future behavior are characterized by:
o Greater correspondence bias
o Higher cross-situational consistency
o Greater reliance on dispositional factors.
Chandran and
Menon (2004)
Self-risk
assessment and
indication of
intentions to take
preventive action
NA Self-positivity bias is moderated by temporal frames which, in
turn, are moderated by the effort-intensity of preventive actions
and the valence of associated consequences.
A risk presented in a day [year] frame is construed as more
proximal [distant] and specific [abstract], thereby increasing
[decreasing] the efficacy of a risk communication that stresses
negative outcomes.
Eyal et al. (2004) Generation of pro
and con
arguments
Other drivers of construal
level (e.g. desirability vs.
feasibility features) may
moderate the effects of pros
versus cons on the level of
construal.
The relative importance of pro and con aspects of a future activity
is contingent on temporal distance such that the salience of pros
[cons] is augmented [decreased] with temporal distance from a
course of action.

69
Study Task Key Methodological
Implications Primary Contribution(s)
Förster et al.
(2004)
Insight task and
generation of
abstract solutions
Effects hold even when
temporal distance is not
directly manipulated (i.e.,
adopting a temporally
distant perspective
suffices).
A distant time perspective simplifies [hinders] abstract [concrete]
thinking, thereby facilitating [impeding] performance at creative
[analytical] tasks.
Malkoc et al.
(2005)
Choice between
two options;
preference rating
Shows that temporal
distance moderates the
predictions derived from
structural alignment theory
(Markman & Gentner,
1993).
Abstract [concrete] construal, associated with the assessment of
distant [near] future situations facilitates [hinders] processing of
nonalignable aspects.
Henderson et al.
(2006b)
Negotiation Temporal distance can
relate to either negotiations
themselves or the timing of
the negotiated target event.
A distant future oriented outlook encourages joint consideration of
multiple negotiation points and more adequate, systematic
concessions (i.e., it leads to integrative behavior and Pareto-
efficient outcomes).
Nussbaum et al.
(2006)
Prediction The level of construal
moderates the impact of
temporal distance on
prediction confidence.
When high certainty is attributed to high-level [low-level]
construals, temporal distancing leads to [does not lead to] greater
confidence in forecasting distant future outcomes.
Herzog et al.
(2007)
Generation of pro
and con
arguments
The impact of temporal
distance on attitudes
towards the action is
mediated by the ease of
retrieval.
Individuals produce a fixed number of pro-arguments [counter-
arguments] more easily when the activity relates to the distant
[near] instead of the near [distant] future.
Individuals display a more favorable attitude towards actions
related to the distant future.

70
Study Task Key Methodological
Implications Primary Contribution(s)
Kivetz and Tyler
(2007)
Indication of
identity versus
instrumental
preferences
The activated ‘self’
mediates the impact of
temporal outlook on
incentive preference.
A distant future orientation triggers the idealistic self, while a near
future orientation triggers the pragmatic self.
When the idealistic self is triggered, identity incentives (e.g.
preferential treatment) gain in appeal, whereas when the pragmatic
self is triggered, instrumental incentives (e.g. cash bonuses)
become more attractive.
Liberman et al.
(2007b)
Prediction of
when a situation
will occur
Effects can be achieved by
prompting individuals to
consider an action’s
abstract attributes.
Individuals primed to adopt high-level [low-level] construals of a
situation estimate the situation to occur in the distant [near] future.
Zhao et al. (2007) Choice and
indication of
preference
Suggests a direct link
between CLT and the two
simulation types identified
by mental simulation theory
(Taylor and Schneider,
1989).
Process simulation [outcome simulation] prompts a low-level
[high-level] construal, emphasizing the concrete [abstract]
feasibility-relevant [desirability-relevant] features of an object or
situation.
Outcome [process] simulation can bring near [distant] future
preferences closer to natural preferences for the distant [near]
future.
Bonner and
Newell (2008)
Self-risk
assessment CLT and the ratio bias offer
opposing predictions with
respect to risk frequency
framing effects.
The ratio bias dominates the predictions derived from CLT (year
framing results in greater perceived risk).
Day and Bartels
(2008)
Similarity
perception Results are similar when
temporal distance relates to
the past.
Individuals judge situations with high-level [low-level],
superordinate [subordinate] commonalities to be more alike when
considered from a distant [near] future perspective.

71
Study Task Key Methodological
Implications Primary Contribution(s)
Fujita et al.
(2008)
Indication of an
event’s or
product’s appeal
Suggests that temporal
distance moderates the
previously taken-for-
granted dominance of
specific examples over
classes with respect to
persuasive impact.
Communications emphasizing positive high-level attributes (e.g.,
primary attributes; desirability criteria; broad categories) have a
larger influence on feelings toward attitude objects (e.g., a new
college course) in the distal (as opposed to the proximate) future.
McCrea et al.
(2008)
Questionnaire
completion Effects are independent of
task appeal, relevance, or
perceived effort
requirement.
Participants are less inclined to postpone task performance when
instructions trigger more concrete construals.
Rogers and
Bazerman (2008)
Indication of
support for:
public policy;
donation; self-
improvement
Changing individuals’
temporal focus is sufficient
to achieve a ‘future-lock-in
effect’.
Individuals are more likely to favor ‘should-choices’ when those
are to go into effect in the distant future, compared to the near
future.
De Dreu et al.
(2009)
Negotiation NA Temporal distance facilitates overcoming of obstacles during
negotiation.
Negotiation hurdles themselves do not prompt individuals to adopt
a broader, more abstract approach to reasoning.
Eyal et al. (2009) Indication of
likelihood to
perform a given
behavior
NA Values [feasibility considerations] are a better predictor of
temporally distant [proximate] behavioral intentions.
Plans for the distant future are more consistent across contexts
than those for the more proximate future.

72
Study Task Key Methodological
Implications Primary Contribution(s)
Kim et al. (2009) Evaluation of a
political message Effect is most pronounced
for less informed
participants.
Messages that emphasize abstract [concrete] why-aspects [how-
aspects] are more persuasive in situations in which the decision
concerns the distant [near] future than in situations in which the
decision concerns the near [distant] future.
Borovoi et al.
(2010)
Assessment of
alternative
choices
NA The presence of an Attractive but Unattainable Alternative (AUA)
interacts with temporal distance such that AUAs lower [do not
lower and even elevate] the attractiveness of a set of alternatives
when the choice set is considered for the near [distant] future.
Malkoc et al.
(2010)
Indication of
timing preference
(acceptance of
delay)
Identifies several new ways
of manipulating construal
mindset orientation
Present-bias is lower [higher] for individuals who have adopted a
high-level [low-level] construal mindset.
Mindset abstraction may be determined by the decision-maker’s
earlier tasks and judgments – even if unrelated to the intertemporal
decision.
A low-level construal mindset is the default.
Köhler et al.
(2011)
Evaluation of a
Web-based
interactive
decision aid
Shows that the congruency
between communication
design and time-dependent
construal raises perceived
transparency.
Interactive decision aid (IDA) performance evaluations are more
positive when a concrete [abstract] communication design is
matched with low [high] temporal distance between IDA
recommendation and product or service consumption; or with
immediate [delayed] advice delivery.
Park and Jang
(2014)
Indication of
willingness to
cancel travel
plans
Shows that prior experience
moderates the identified
effects.
Decision-makers consider large temporal distance from an
anticipated event a sunk cost (independent of monetary sunk cost)
which lowers their willingness to cancel the event.

73
Table 3: Spatial Distance Research
Study Task Key Methodological
Implications Primary Contribution(s)
Fujita et al.
(2006a)
Interpretation of
social events
NA Individuals prefer to identify behavior as ends [means to an end]
when the behavior is thought to occur at a distant [nearby]
location.
Purportedly distant [proximate] behavior is described in more
abstract [concrete] terms.
Henderson et al.
(2006a)
Social judgments NA Prototypical [atypical] events are considered more [less] probable
to occur at spatially more remote locations.
Evaluating spatially remote behavior leads to greater
correspondence bias and broader categorization of observed
behavior.
Individuals are less inclined to extrapolate from outlier data when
rendering forecasts about spatially remote events.
Jia et al. (2009) Linguistic skills
task; creative
insight problems
Shows that a minimal cue
may be sufficient to affect
participants’ creativity.
Individuals offer more creative answers and insightful problem
solutions when they are informed that the creativity task was
developed at a remote location.
Rim et al. (2009) Recall of photo-
word pairings Priming via consideration
of superordinate categories
leads to similar effects.
Individuals are more likely to generate spontaneous trait inferences
when the observed behavior relates to a spatially (or temporally)
distant other person.

74
Study Task Key Methodological
Implications Primary Contribution(s)
Henderson and
Wakslak (2010)
NA NA Synthesis of spatial distance research; suggests that future studies
explore the unique impact of spatial distance, particularly in
important contexts such as financial decision-making.
Henderson (2011) Negotiation NA Greater perceived spatial distance leads to more Pareto-efficient
outcomes.
When participants are prompted to adopt a high-level construal
mindset, spatial distance does not affect the achievement of
integrative outcomes.
Henderson et al.
(2011)
NA NA Synthesis of research which describes the consequences of spatial
distance with respect to construal, prediction, social judgment, and
behavior; discusses research which has focused on the impact of
construal on perceived spatial distance.
Provides suggestions for future research and discusses important
covariates and unique aspects of the spatial distance dimension.
Barreto and
Patient (2013)
Interpretation of
a situation in
terms of
opportunities and
threats
Combines insights from the
attention-based view of the
firm (Ocasio, 1997), CLT,
and strategic issue
diagnosis theory (Dutton et
al. 1983).
Greater distance from an external shock and more optimistic
organizational capability perceptions prompt managers to focus
more on opportunities and less on threats associated with the
external shock.
Shock distance (a superordinate aspect) and organizational
capability perception (a subordinate aspect) are asymmetrically
weighted.
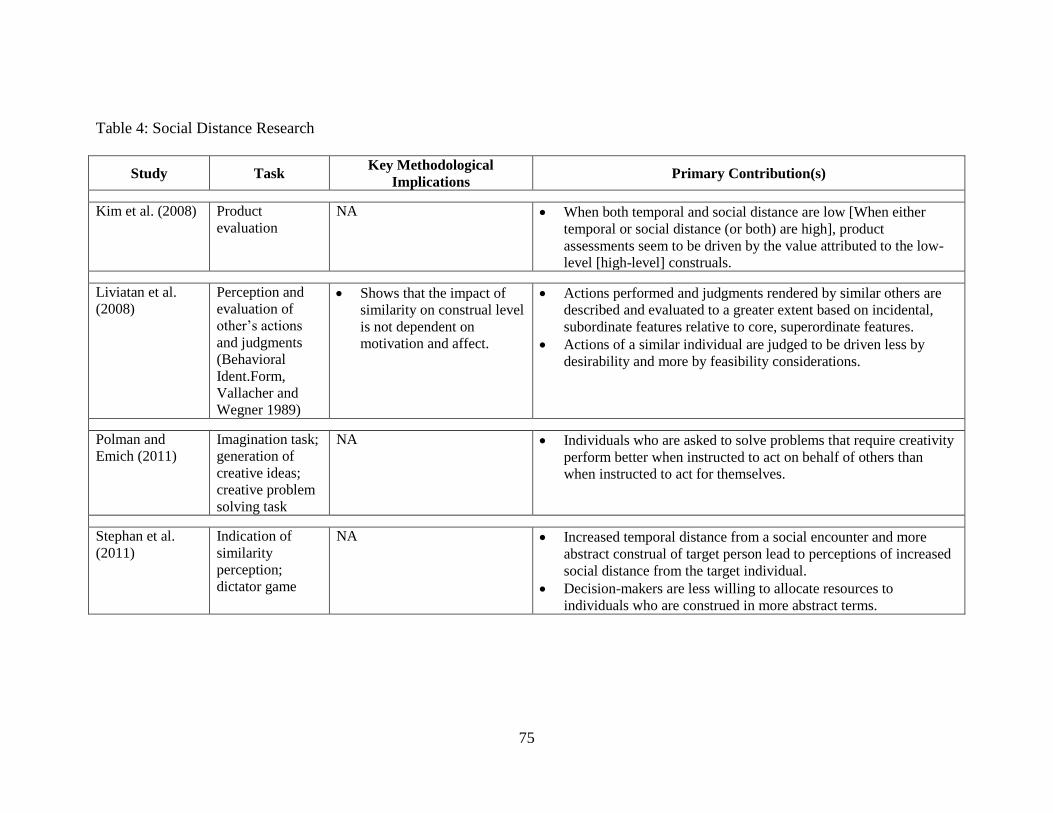
75
Table 4: Social Distance Research
Study Task Key Methodological
Implications Primary Contribution(s)
Kim et al. (2008) Product
evaluation
NA When both temporal and social distance are low [When either
temporal or social distance (or both) are high], product
assessments seem to be driven by the value attributed to the low-
level [high-level] construals.
Liviatan et al.
(2008)
Perception and
evaluation of
other’s actions
and judgments
(Behavioral
Ident.Form,
Vallacher and
Wegner 1989)
Shows that the impact of
similarity on construal level
is not dependent on
motivation and affect.
Actions performed and judgments rendered by similar others are
described and evaluated to a greater extent based on incidental,
subordinate features relative to core, superordinate features.
Actions of a similar individual are judged to be driven less by
desirability and more by feasibility considerations.
Polman and
Emich (2011)
Imagination task;
generation of
creative ideas;
creative problem
solving task
NA Individuals who are asked to solve problems that require creativity
perform better when instructed to act on behalf of others than
when instructed to act for themselves.
Stephan et al.
(2011)
Indication of
similarity
perception;
dictator game
NA Increased temporal distance from a social encounter and more
abstract construal of target person lead to perceptions of increased
social distance from the target individual.
Decision-makers are less willing to allocate resources to
individuals who are construed in more abstract terms.

76
Study Task Key Methodological
Implications Primary Contribution(s)
Tumasjan et al.
(2011)
Ethical leadership
assessment
Moral reasoning fully mediates
the effect of social distance on
ethical leadership evaluation.
Increased consideration of contextual information associated with
the evaluation of a socially proximate leader prompts better ethical
leadership ratings.
Higher moral evaluations following an ethical transgression
correlate with a more positive evaluation of the leader-subordinate
relationship.
Kim et al. (2013) Ultimatum game NA Individuals are less likely to reject unfair offers when they render
decisions on behalf of a socially distant other than when they make
decisions for either themselves or a close acquaintance.

77
Table 5: Hypotheticality Research
Study Task Key Methodological
Implications Primary Contribution(s)
Wakslak et al.
(2006)
Categorization /
segmentation;
visual processing
tasks
Effects hold even under
circumstances in which
individuals have identical
knowledge about unlikely
and likely events.
Probability is inversely related to level of construal: unlikely
events cause individuals to focus on an event’s abstract,
superordinate aspects while more likely events draw attention to
detail-level, subordinate aspects.
Todorov et al.
(2007)
Choice among
potential
outcomes /
rewards.
Means-related features are
judgment-relevant only in
high probability situations;
however, variations in
probability are irrelevant in
joint evaluations.
Desirability concerns are more prominent than feasibility concerns
when the probability of an outcome is low.
As outcome probability rises, feasibility concerns may become
even more prominent (but not less) than desirability concerns.
Wakslak and
Trope (2009)
Probability
judgments
NA An abstract mindset fosters the perception of improbability
whereas a concrete mindset fosters the perception of likelihood.
Wakslak (2012) Gambling
decisions;
indication of
occurrence
expectations
Effects are demonstrated in
both within-subjects and
between-subjects
experimental designs
Individuals expect that less [more] likely events happen at remote
[proximate] locations and in the distant [near] future.

78
Table 6: Construal Mindset Orientation Research
Study Task Key Methodological
Implications Primary Contribution(s)
Freitas et al.
(2001)
Indication of
preference for
feedback type
NA Individuals who adopt a high-level [low-level] construal mindset
seek realistic [positive – i.e., downward social comparison]
feedback.
Freitas et al.
(2004)
Predictions and
recommendations
related to other
individuals’ self-
regulatory
preferences and
behaviors
Shows that prompting
individuals to reflect on the
‘why’ [‘how’] aspects of an
activity induces an abstract
[concrete] mindset
orientation.
An abstract mindset orientation leads individuals to predict and
recommend to a greater degree that other individuals seek
realistic instead of excessively positive self-relevant feedback.
Fujita et al.
(2006b)
Reaction to
temptations and
indication of self-
control intentions
Shows that how the
mindset orientation is
initiated is irrelevant.
Individuals who consider situations concretely [abstractly] turn
more short-sighted [exhibit more self-control] and behave in line
with lower-level [higher-level] concerns.
Smith and Trope
(2006)
Categorization
task; detection of
relationships and
patterns; Gestalt
Completion Task
(Ekstrom et al.
1976)
Offers initial
neuropsychological
evidence in support of their
results.
High-power primed individuals (compared to low-power primed
individuals)
o are better at extracting the core elements from presented
data with a focus on critical issues and the detection of
structural relationships
o group data into broader categories.

79
Study Task Key Methodological
Implications Primary Contribution(s)
Hamilton and
Thompson (2007)
Product evaluation NA Preferences based on direct and indirect experiences (i.e., greater
focus on feasibility and desirability attributes, respectively)
converge when individuals are prompted to adopt a low-level
construal prior to their indirect product experience.
Increasing social distance (i.e. selecting a product for another
person) reduces the difference between preferences based on
direct versus indirect product experience.
Eyal et al. (2008) Evaluation of
morally
questionable
scenarios
Shows that psychological
distance moderates the
impact of common moral
values on judgments.
Individuals evaluate moral [immoral] actions as more virtuous
[objectionable] when the actions are psychological distant rather
than proximate.
Freitas et al.
(2008)
Indication of
voting behavior
and evaluation of
advertisements
NA Desiring for oneself the characteristics of a political candidate
predicts positive assessment and voting for that candidate more
among individuals who hold a distant future perspective.
Individuals who inherently construe activities at high levels react
positively to commercials which appealed to their preferred self-
image.
Leiser et al.
(2008)
NA NA Synthesizes CLT studies which have direct implications for
economic decision-making and identifies associated research
opportunities.
Agrawal and
Wan (2009)
Reading health-
related articles Shows that a focus on goal
achievement mediates the
effect of resource depletion
on subsequent self-control.
The negative impact of resource depletion on individuals’ ability
to exercise self-control is only evident among those who adopt a
low-level construal mindset.

80
Study Task Key Methodological
Implications Primary Contribution(s)
Amit et al.
(2009a)
Timed
classification task
NA Pictures [words] are more suitable for the representation of
psychologically proximate [distant] targets.
Cantor and
Macdonald
(2009)
Supply-chain game NA Individuals who adopt an abstract problem-solving style
outperform those who adopt a concrete problem-solving style
when a limited amount of information is available.
Förster (2009) Symbol
recognition task;
invention of
meanings
associated with
symbols
Suggests that abstract
construal facilitates
integration of a new
situation with existing
knowledge structures.
Lack of familiarity promotes abstract, high-level construal
whereas acquaintance promotes detailed, low-level construals.
Fujita and Han
(2009)
Indication of
preference for one
of two food
choices
NA Temptations construed at a higher level are perceived to be more
negative than those construed at a lower level, thus facilitating the
exertion of self-control.
Liberman and
Förster (2009)
Navon’s task
(Navon 1977) Shows a perceptual
relationship between
psychological distance and
construal level.
Priming with temporal, spatial, or social distances [proximity]
makes it easier [harder] to attend to global features and harder
[easier] to attend to specific details in a visual task.
Sanna et al.
(2009)
Social dilemma
scenario
(overfishing)
NA High-level construal of a social dilemma scenario leads to greater
cooperation.

81
Study Task Key Methodological
Implications Primary Contribution(s)
Shani et al.
(2009)
Indication of
preference for
additional
information
Suggests that the emotional
goal of alleviating negative
feelings mediates the
impact of construal level
on information search.
Lower-level [higher-level] construal promotes [lowers]
information search desirability in situations that involve the
potential discovery of unpleasant truths about prior decisions.
Alter et al. (2010) Explain how
various objects
work and rate own
understanding
Suggests a link between the
illusion of explanatory
depth (IOED) (e.g.
Rozenblit and Keil, 2002)
and CLT.
Individuals who have adopted a high-level construal style may
mistakenly believe that they possess detail-level knowledge.
Encouraging people to adopt a lower level perspective may
prompt them to search for further information which then may
lead to better decision-making.
Magee et al.
(2011)
NA NA Power seems to have a detrimental effect on managers’ capability
to design proper incentive systems.
Power-induced abstract construal promotes a focus on desirability
aspects and organizational goals over those related to feasibility
and subordinates’ potential reactions to the proposed incentives.
Fujita and
Carnevale (2012)
NA NA Synthesizes self-control literature and identifies personal attitudes
and asymmetric associations between goals and temptations as
mechanisms through which high-level construals can enhance
self-control.

82
Study Task Key Methodological
Implications Primary Contribution(s)
Amit et al. (2013) Indication of
preference for
either verbal or
pictorial
communication
Illustrates that individuals
consider their
communication target’s
perspective when selecting
a communication medium.
Individuals’ relative preference of words over pictures escalates
with increased psychological distance from the message recipient.
The available communication medium affects preference for
communicating with a proximal [for pictorial messages] or distant
[for verbal messages] recipient.
Message – distance congruency promotes advice taking.
Hansen and
Trope (2013)
Estimation of time
elapsed while
performing a task /
watching a
presentation
Suggests implications
associated with time-
related phenomena, such as
planning, assessments, and
performance.
Variation of high-level [low-level] features of a situation prompts
individuals with an abstract [concrete] mindset to perceive time as
passing quicker.
Wilson et al.
(2013)
NA NA Introduces extended CLT framework and compares CLT to
competing theories used in distributed (virtual) team research.
Identifies - in the context of virtual teams - contextual moderators
of the relationship between objective distance and psychological
distance.
Cha and Park
(2014)
NA - Survey NA Proximity along various psychological distance dimensions has
beneficial effects on both teamwork quality and performance.
Spatial, temporal, and social distance not only affect different
teamwork quality factors (i.e., team communication, coordination,
collaboration, and cohesion), but also vary with respect to their
strength of impact.

83
Table 7: CLT-Informed Accounting Studies
Study Task Key Methodological
Implications Primary Contribution(s)
Backof et al.
(2013)
Indicate choice of
most acceptable
accounting
method
Shows that a deliberative
mindset can be achieved by
prompting auditors to ask
why-questions related to a
transaction.
Increased psychological distance improves auditors’ judgment
quality by drawing attention towards the economic substance of a
transaction.
White (2014) Judge uncertainty
associated with
fair value
disclosures
NA Investors with a short-term investment horizon, compared to those
with a long-term investment horizon, exhibit greater sensitivity to
variations in fair value input level and related measurement
disclosures when assessing the uncertainty associated with a
disclosed estimate.
Sensitivity to uncertainty and related disclosures affects judgments
of overall firm value, potentially leading to biases in investor
decision-making.
Backof et al.
(2014)
Assess
reasonableness of
management’s
fair value
estimate
Shows that the
consideration of how-
questions can serve as an
effective debiasing
mechanism.
Graphical presentation of audit evidence, compared to verbal
presentation, facilitates the detection of trend deviations and makes
it easier to spot evidence that contradicts management’s aggressive
assumptions.
Skepticism is highest when a low-level construal judgment
framework is combined with the examination of graphically
presented evidence.
Elliott et al.
(2014)
Reveal comfort
in ability to
evaluate a firm
and indicate
willingness to
invest
NA Investors are more willing to invest in a firm when concrete
language, rather than abstract language, is highlighted in an
investment prospectus - particularly when the spatial distance
between investor and firm is large.
Psychological distance is associated lower investor comfort.

84
Study Task Key Methodological
Implications Primary Contribution(s)
McPhee (2014) Decoding task;
creative word
association task
NA Promising cash incentives to be paid the near future is most
suitable for motivating high performance on an analytical task.
Promising non-cash incentives to be awarded in the distant future
is equally effective as a cash incentive promised for the near future
for motivating high performance on a creative task.
Lundholm et al.
(2014)
N/A - Archival Shows how textual analysis
can be used to infer the
effect of a message on
readers’ construal level.
Foreign firms can lower potential U.S. investors’ psychological
distance by providing more concrete and more readable
disclosures.
MD&A and press release readability as well as the use of numbers
within those publications increases with geographic distance from
the U.S.
Rasso (2014) Collect and
review audit
evidence to
determine
reasonableness of
client’s fair value
estimate
Illustrates how simple audit
documentation instructions
can improve auditor
skepticism when
incomplete evidence sets
are evaluated.
Documentation instructions that prompt abstract construal lead to
higher professional skepticism and skeptical actions as evidenced
by time spent on audit task and amount of evidence gathered.
Auditors who adopt an abstract [concrete] mindset orientation are
more [less] effective in processing accumulated evidence and rate
fair value estimates as more [less] risky.
Elliott et al.
(2015)
Evaluate a firm
and indicate
willingness to
invest
Shows that processing
fluency is particularly
important for less numerate
individuals.
Corporate Social Responsibility (CSR) performance reports that
properly match pursued corporate CSR strategy with
communication style promote processing fluency and subsequently
non-professional investors’ willingness to invest.
Weisner and
Sutton (2015)
Indicate
willingness to
rely on a
management
appointed
specialist
Develops and validates
instruments to measure
propensity toward spatial
and cultural sensitivity.
Increased spatial distance between an audit client and a
management-appointed, teleworking specialist reduces auditors’
reliance on the work of the specialist.
Reliance is lowest when the auditor’s prior experience with his
client’s internal audit function (IAF) indicates a weak IAF.

85
STUDY TWO: THE IMPACT OF CONSTRUAL MINDSET
ORIENTATION ON AUDITORS’ PROBABILITY ASSESSMENT
Introduction
Working on multiple tasks and multiple clients within a single work session is a
prevailing reality in the assurance service industry. Bhattacharjee et al. (2013) draw attention to
the profound effects of such work environments on audit professionals’ decision-making and
subsequent implications for audit effectiveness and efficiency. The influence of task and client
sequencing on auditor decisions is evident from the relatively recent, albeit limited stream of
research by judgment and decision-making scholars who have identified undesirable carryover
effects as a common form of information processing and recall-related errors. For example,
O’Donnell and Schultz, Jr. (2005) illustrate in the context of performing multiple tasks for a
single client how strategic risk assessment affects auditors’ sensitivity toward account-level
fluctuations that are inconsistent with their holistic evaluation of their client’s business model.
Other research has focused on performing similar tasks for multiple clients within a short period
of time. While Bhattacharjee et al. (2007) find that exposure to comparable judgment
information in a multiple-client setting promotes contrast effects, Lindberg and Maletta (2003)
show that the likelihood of committing memory conjunction errors is a complex function of the
relationship between the memory trace and its origin, its target for memory reconstruction
purposes, and audit risk. Together, those studies provide converging evidence that working on
multiple tasks and multiple clients within a short period of time affects auditors’ judgments.
However, the implications of such work environments on auditors’ judgments in situations in
which sequential tasks are neither related to the same client nor related in terms of domain-
specific information has largely been ignored. This seems somewhat surprising given that the

86
likelihood that auditors face similar judgment tasks upon switching between clients or tasks
seems far lower than the likelihood that they encounter dissimilar judgment tasks. To address
this research gap, the current study focuses on the effects of task-induced mindset on subsequent
decisions in a multi-task, multi-client environment in which two successive tasks are entirely
unrelated with respect to the client for which they are performed and with respect to their
particular nature.
The purpose of this research is to investigate how the degree of high-level (i.e., abstract)
thinking associated with performing a task affects auditors’ judgment on subsequent tasks, even
when the latter is neither related to the same client nor to the domain of the original task. As
such, the study follows Bhattacharjee et al.’s (2007) call for additional research on situations in
which individuals render sequential judgments about diverse targets.
This study draws on construal level theory of psychological distance (CLT; Liberman and
Trope 1998; Trope and Liberman 2003) in order to examine how the performance of common
auditing tasks that require varying degrees of abstract thinking affects decision-makers’ overall
mindset and hence their subsequent judgments. CLT emphasizes the critical role of mental
construal (i.e., mental representation) for individual judgment and decision-making and
introduces the level of abstraction as a distinctive attribute of various mental construals (Fujita
and Han 2009). Critical to the context of this study, Wakslak and Trope (2009) show that
prompting abstract construals leads individuals to focus on the unlikelihood of a given event,
thereby decreasing their assessment of the event’s probability. The researchers conclude that an
abstract mindset promotes perceptions of improbability whereas a concrete mindset imparts a
sense of likelihood.

87
Based on Wakslak and Trope (2009), this study predicts that auditors who initially
perform a task requiring high-level, abstract thinking [low-level, concrete thinking] adopt an
abstract [concrete] mindset which subsequently affects their probability assessment associated
with an unrelated task such that lower [higher] probabilities are assessed by participants who
have adopted an abstract [concrete] mindset.7 In line with CLT and contrary to normative
expectations, it is further predicted that this result holds regardless of whether the probability
assessment concerns the occurrence of an event or its complement (i.e., the probability of the
event not occurring). This latter prediction is suggestive of a judgment bias in the abstract
mindset orientation condition as evidenced by combined probability assessments (i.e., for the
event and its complement) that do not sum to 1. As noted by Mandel (2005), the detection of
“coherence violations [is] of practical value because, while it is true that coherent judgments do
not imply accurate judgments, incoherent judgments do imply that, at best, only one of the
judgments elicited may be accurate” (p. 286). Accordingly, the determinants of judgment
coherence investigated in the present study inform forecasting accuracy despite the fact that the
measurement of probability assessment accuracy is not the focal point of this study (Mandel
2005).
To test the predictions derived from CLT, two experiments are conducted, each following
a 2 × 2 between-subjects factorial design. Each experiment consists of two separate and
7 In the audit context, considerations related to the distant future (e.g., planning / budgeting for next year’s busy
season; evaluating the reasonableness of management’s long-term forecasts), judgments involving spatially remote
decision-objects (e.g., going concern judgments related to foreign subsidiaries), tasks involving broad
categorizations (e.g., deciding whether footnote-disclosed client segment information adequately reflects the
organizational structure of the client), or tasks involving the consideration of overarching goals (e.g., considering the
overall goal of a given audit procedure rather than the means by which the procedure will be performed) are
examples of tasks that are expected to promote an abstract mindset orientation. In contrast, a concrete mindset
orientation – which is the default (see Malkoc et al. 2010) – would prevail in situations where auditors focus on the
details of a task (e.g., reconciling balances), render judgments about near future situations, or evaluate spatially
proximate decision-objects.

88
completely unrelated tasks. The two independent variables for both experiments are construal
mindset (abstract vs. concrete) – manipulated in Task 1 - and focus of the probability assessment
question (hereafter: focus) (event vs. complement) – manipulated in Task 2. The dependent
variable, which is captured in Task 2, is participants’ probability assessment concerning the
ability of an audit client to collect a customer’s accounts receivable balance. Experiment 1,
which represents the primary analysis, uses 90 experienced auditors. Construal mindset is
manipulated in Task 1 by asking auditors to complete a task that requires either a high-level,
abstract perspective or a low-level, concrete perspective. Either task is related to client “Wittim”
and has no relationship to the subsequent task (Task 2) of assessing the probability that client
“Premier Electro Tech” will be able to collect a customer’s outstanding accounts receivable
balance in full. The second experiment, which uses 118 undergraduate accounting students, is
designed to provide further evidence that construal mindset rather than the nature of the
experimental audit task drives participants’ probability assessment. The purpose of Experiment 2
is to broaden the generalizability of the findings from Experiment 1 and to provide preliminary
evidence that other audit tasks may also prompt the adoption of an abstract mindset orientation
and similarly affect auditors’ subsequent judgment. In Experiment 2, a construal mindset priming
task developed in the psychology literature is administered prior to asking participants to render
their probability assessment with respect to client Premier Electro Tech.
As predicted, the results from Experiment 1 show that auditors who adopt an abstract
mindset orientation, compared to those who adopt a concrete mindset orientation, provide lower
probability assessments. However, no support is found for the hypothesized interaction. In
contrast, results from the second experiment show that student participants who adopt an abstract
mindset orientation, compared to those who adopt a concrete mindset orientation, do not provide

89
lower probability assessments. However, the hypothesized interaction effect is significant.
Additional analyses suggest that the probability-related predictions derived from CLT may be
limited to situations in which the judgment of concern is relatively familiar to the decision-maker
in terms of decision-domain and how the judgment question is posed.
Through an emphasis on task-induced mindset, this research has important implications
for audit practice as the study illustrates that task sequencing can affect judgment in the absence
of any meaningful relationship between the earlier task and the latter one. This finding is of
interest to auditors who work in environments that require frequent shifts in focus due to
multiple client or project demands. Awareness of the fact that evaluations of an event’s
likelihood of occurrence may be affected by the degree of abstract thinking required for a
preceding task may help auditors avoid making overly optimistic (or pessimistic) probability
assessments.
This study also contributes to the accounting literature since the focus on decision-
makers’ mindset suggests the possibility for future research to explore further task-induced
mindset implications, which may affect auditors as well as other accounting professionals. As
noted by Trope et al. (2007), mental construals not only guide evaluations, but also predictions,
and actions. Initial insights into the consequences of task abstractness on subsequent judgments,
as provided by this research, are therefore important for further investigations into post-
evaluative behavior.
Finally, this study contributes to the psychology literature by corroborating a relatively
under-researched implication of CLT, that is, the impact of construal mindset on probability
assessment. To this author’s knowledge, prior CLT research has not examined how construal
mindset affects professional decision-makers’ subsequent probability assessment in situations

90
that require skilled judgment within a work environment characterized by strong organizational
guidelines and professional constraints. The importance of testing the predictive power of
psychology theories in accounting settings is evident from Trotman and Wright’s (2000) review
of audit research on order and recency effects. Based on the mixed results from a large body of
audit research, the authors conclude that the Hogarth and Einhorn (1992) model requires
adaptation to the unique nature of audit tasks before additional research in this area is warranted.
The unique or more relevant characteristics of audit tasks, which may similarly impact
predictions derived from CLT, “include asymmetric loss functions, levels of accountability, need
for justification, professional training and experience, and time constraints” (Trotman and
Wright 2000, pgs. 179-180).
The remainder of this chapter is organized as follows: The next section reviews
accounting literature on task sequencing. The third section provides theoretical foundations and
develops the hypotheses. Section four describes the overall methodological approach. Sections
five and six discuss Experiment 1 and 2 along with results, respectively. Section seven reports
the results from additional analyses and Section eight discusses supplemental and exploratory
measures. The last section draws conclusions, addresses some limitations, and offers directions
for future research.
Background
A recent practitioner-oriented literature review by Bhattacharjee et al. (2013) refers to the
authors’ earlier finding (see Bhattacharjee et al. 2007) that auditors address issues pertaining to a
single audit client in only 25 percent of their work sessions. Noting that the majority of
uninterrupted work periods (75 percent) are characterized by work on two or more clients, the

91
authors argue that the complex multi-client, multitasking audit environment may have profound
impact on audit professionals’ decision-making. The associated concern with potentially
dysfunctional outcomes (with respect to audit effectiveness and efficiency) and task and client
sequencing is highlighted by a relatively recent, yet limited stream of research by judgment and
decision-making scholars (e.g., Lindberg and Maletta 2003; O’Donnell and Schultz, Jr. 2005;
Bhattacharjee et al. 2007).
This research has identified undesirable carryover effects as a common form of
information processing and recall-related errors. Carryover effects occur when auditors
subconsciously allow information obtained from work on a prior task or audit client to influence
their judgment on a current task or audit client (Bhattacharjee et al. 2013). With a focus on
performing multiple tasks for a single client O’Donnell and Schultz, Jr. (2005) illustrate how
strategic risk assessment affects auditors’ sensitivity toward account-level fluctuations that are
inconsistent with their holistic evaluation of their client’s business model. The researchers
hypothesize and find that auditors who perform strategic risk assessment, compared to those who
do not perform such analysis, display greater tolerance for inconsistent account-level fluctuations
in their assessment of account-level risk. Furthermore, when the developed (or endowed)
strategic risk assessment indicates low risk, sensitivity to inconsistent account-level fluctuations
is lower than when the strategic risk assessment indicates high risk. O’Donnell and Schultz, Jr.
(2005) explain their findings in terms of halo theory and rule out alternative explanations such as
auditors’ attention, effort, or expectations.
Complementing O’Donnell and Schultz, Jr.’s (2005) investigation of judgment effects
resulting from the performance of multiple tasks for a single client is research which focuses on
judgment effects stemming from the performance of similar tasks for multiple clients. For

92
example Lindberg and Maletta (2003) and Grossman and Welker (2011) document how auditors
may commit memory conjunction errors when multi-tasking involves more than one audit client.
According to Lindberg and Maletta (2003), memory conjunction errors transpire when memory
bits related to one situation are improperly associated with another situation during the memory
reconstruction process. In the assurance context, auditors may associate audit evidence obtained
from one client to another audit client, thereby negatively affecting audit effectiveness or
efficiency, depending on the valence of the evidence. Lindberg and Maletta’s (2003) experiment
shows that the likelihood of committing memory conjunction errors is a complex function of the
relationship between the memory trace and its origin, its target for memory reconstruction
purposes, and audit risk. More specifically, the authors show that the combination of high audit
risk, consistency of the audit evidence with the target client, and simultaneous inconsistency
between the audit evidence and the client to which it actually pertains, leads to the highest
likelihood that auditors falsely recognize the evidence as belonging to the target client. Grossman
and Welker (2011) extend this research by showing that auditors’ propensity to commit memory
conjunction errors is higher when audit evidence is arranged in a causal sequence rather than in a
traditional working paper order or in a random order. The authors reason that potentially
shallower encoding of specific pieces of evidence and weaker cognitive association among
evidence items and their respective source may result from causal ordering. Consequently,
auditors may garner a sense of familiarity from the causal association between a client’s storyline
and the audit evidence of concern which may lead to attribution of the evidence to the wrong
client. However, Bhattacharjee et al. (2007) show that even when memory bits are attributed to
the proper client, judgment errors may occur as a result of contrast effects. Specifically, the
researchers show that auditors, upon exposure to comparable judgment information, base their

93
assessment of a current client’s information on a comparison of the former with similar
information related to a prior client. This finding is consistent with psychology research that,
according to the authors, has shown that in situations involving sequential judgments within a
specific domain, antecedent judgment tasks establish a prime against which information
pertaining to the subsequent judgment task may be compared. More importantly, Bhattacharjee
et al. (2007) illustrate that this contrast effect cascades and affects indirectly associated,
succeeding decisions for which comparable information is unavailable. Both, the initial contrast
effect as well as its cascading effect are shown to systematically influence auditors’
documentation of target client evidence.
Together, those studies provide converging evidence that working on multiple tasks and
multiple clients within a short period of time affects auditors’ judgments. However, the
implications of such work environments on auditor’s judgments in situations in which sequential
tasks are neither related to the same client (as in O’Donnell and Schultz, Jr. 2005) nor related in
terms of domain-specific information (as in Lindberg and Maletta’s 2003 and Bhattacharjee et al.
2007) has largely been ignored. I argue that the investigation of such situations, which are
arguably more commonplace,8 calls for attention to the cognitive effects of performing an earlier
task on the decision-maker’s overall mindset. The reason for this is that in such situations
decisions about a subsequent task cannot possibly be affected by additional information cues
from either the same entity (whether relevant or irrelevant) or analogous information from
8 Anecdotal evidence suggests that auditors – particularly higher rank auditors who review the work of their
subordinates – direct their attention to a variety of clients and diverse client issues throughout the day (see also
Bhattacharjee et al. 2013). For example, an audit senior may be ‘wrapping-up’ a particular engagement (e.g.,
resolving unexpected issues; conducting final analytical procedures; addressing high-level partner comments etc.)
while also providing on-site supervision of staff auditors’ working on a different client. Likewise, a manager may be
at the site of client A, reviewing working papers related to client B, and answer occasional questions from staff
conducting fieldwork at client A. Nevertheless, whether such scenarios are more likely than scenarios in which task-
switching involves the same client or similar tasks remains an empirical question.

94
another entity which may or may not be justifiably relied upon to inform the latter decision. This
research thus examines the deeper psychological effects which underlie auditor judgment and
decision-making and argues that those psychological effects have broader explanatory power
given that the likelihood of facing completely unrelated judgment tasks upon transitioning from
one client to another seems far greater than the likelihood of facing highly similar tasks.
Theory and Hypotheses
This study draws on construal level theory of psychological distance (CLT; Liberman and
Trope 1998; Trope and Liberman 2003) in order to examine how the performance of common
auditing tasks that require varying degrees of abstract thinking affects decision-makers’ overall
mindset and hence their subsequent judgments. CLT emphasizes the critical role of mental
construal (i.e., mental representation) for individual judgment and decision-making and
introduces the level of abstraction as a distinctive attribute of various mental construals (Fujita
and Han 2009) that, in turn, influence evaluation, prediction, and behavior (Trope et al. 2007).
The core premise of CLT is that psychological distance is tied to the level of mental
construal (Bar-Anan et al. 2006; Trope and Liberman 2010), such that more distant objects, that
is, objects that are psychologically farther removed from the here and now, are construed at a
higher level (Trope and Liberman 2010). While high-level construals of an object, event or
situation are rather abstract and emphasize superordinate, decontextualized, and global aspects,
low-level construals contain more concrete, contextualized, and subordinate features (Liberman
and Trope 1998). Moreover, the relationship between psychological distance and mental
construal is bidirectional such that higher-level (i.e., more abstract) construals evoke thoughts of
more distant objects (Trope and Liberman 2010). According to Trope and Liberman (2010, p.

95
442), “Psychological distance refers to the perception of when an event occurs, where it occurs,
to whom it occurs, and whether it occurs”. In other words, the psychological distance dimensions
proposed by CLT include social distance (e.g., in-group vs. out-group, oneself vs. others, and
active social role vs. inactive social role), spatial distance, and hypotheticality (Trope and
Liberman 2010). The underlying reason for the association between psychological distance and
construal level is assumed to stem from differential knowledge about near and distant events: the
farther an event is removed from direct experience, the less dependable information is usually
available, leading to the construction of more schematic (abstract) mental representations. CLT
research shows that this association is overgeneralized such that it affects construal level even in
the presence of equivalent information about near and distant situations (Trope and Liberman
2003; Trope et al. 2007; Liberman et al. 2007).
Several recent CLT studies focus more or less exclusively on the probability dimension
of psychological distance which is of particular interest to this research. Wakslak et al. (2006),
for example, argue for an inverse relationship between probability and level of construal since an
event that could have occurred or one that is merely possible is farther removed from one’s direct
experience (i.e., the here and now) than an event that actually occurred or one that is certain to
occur. Hence, unlikely events should cause individuals to focus on the events’ abstract,
superordinate, global aspects (high-level construal) while more likely events should draw
attention to detail-level, specific, subordinate aspects (low-level construal). Moreover, this
relationship is expected to persist even under circumstances in which individuals have identical
knowledge about low-probability and high-probability events (Wakslak et al. 2006). Wakslak et
al. (2006) confirm the predicted relationship through seven studies in which they directly
measure the effects of probability on the construal of various events. In the first six studies in

96
Wakslak et al. (2006) participants were either prompted to think about an event as probable (low-
level condition) or as improbable (high-level condition) while the seventh study uses a semantic
priming task (i.e., low- or high probability sentences) to initiate a concrete (low-level condition)
or abstract (high-level condition) processing orientation. Experimental results indicate that
participants in low-probability conditions (compared to those in high-probability conditions)
categorize objects into broader, more inclusive segments; demonstrate a greater preference for
generic rather than detailed activity descriptions; decompose action into fewer segments; are
more effective in detecting structure contained in visual information; are less effective in
detecting details omitted from a coherent picture; and prefer to categorize behaviors in terms of
their ends rather than their means (in an action identification task) (Wakslak et al. 2006). Taken
together, Wakslak et al.’s (2006) results provide strong evidence for the hypothesized inverse
relationship between probability and construal level and illustrate how a focus on either low- or
high probability events affects individuals’ behavior and preferences.
Todorov et al. (2007) further explore the CLT proposition that probability affects
preferences through its impact on the level of construal. The authors propose that desirability
concerns should be more prominent than feasibility concerns when the probability of an outcome
is low (i.e., in high psychological distance conditions). However, as the outcome probability rises
(that is, psychological distance decreases), feasibility concerns may become even more
prominent (but not less) than desirability concerns. Todorov et al.’s (2007) experimental results
confirm the predicted patterns and show that in low probability situations subjects favored
outcomes which they considered highly desirable albeit difficult to obtain to outcomes deemed
less desirable but easily achievable. In high probability scenarios, subjects either expressed
reverse preferences or indifference. Additionally, Todorov et al. (2007) find that the weight

97
attributed to the means-related aspects of a decision are more sensitive to variations in
probability than the weight attributed to ends-related aspects. It is important to note that those
findings contradict normative behavior which suggests that preferences should not be influenced
by the likelihood of an outcome.
Most relevant to the present investigation is a study by Wakslak and Trope (2009) who
propose that individuals use their general cognitive orientation (that is, the degree of abstraction
in their thinking) as a signal to inform probability judgments. Hence, the authors investigate the
impact of construal level (i.e., cognitive mindset orientation) on probability rather than the
reverse direction of causality which was the focus of earlier studies (see Walkslak et al. 2006;
Todorov et al. 2007). Given that the uncertainty surrounding specific attributes of improbable
events may cause individuals to generally construe unlikely events at a higher level (i.e., in more
abstract terms), the authors hypothesize that prompting an abstract mindset will lead individuals
to focus on the unlikelihood of a given event, thereby decreasing their assessment of the event’s
probability. In short, an abstract mindset orientation should promote perceptions of improbability
whereas a concrete mindset orientation should impart a sense of likelihood. This argumentation
is in line with Liberman and Trope’s (2008) literature review in which they argue “…activating
high-level construals should lead people to think of events in psychologically more distant
situations” (p. 1204). Moreover, Wakslak and Trope (2009) suggest that this relationship is
predicted to hold regardless of how the general mindset orientation is initially activated (e.g., by
manipulation via an unrelated task). Results from five studies support their propositions
(Wakslak and Trope 2009).
A major contribution of Wakslak and Trope (2009) is that they illustrate how a myriad of
diverse manipulations, even when entirely unrelated to the situation being evaluated, may affect

98
the assessment of probability. The construal level manipulations used by the authors include a
task where participants compare products with either alignable attributes (concrete condition) or
nonalignable attributes (abstract condition); a categorization task which prompts participants to
either identify a superordinate category (abstract condition) or a subordinate example (concrete
condition) for each emphasized word on the experimental instrument; a priming task which
prompts participants in the abstract [concrete] condition to link a described activity “…to
increasingly abstract goals by answering a series of ‘why?’ questions” [“…to increasingly
concrete activities by answering a series of ‘how?’ questions”] (p. 55); Navon’s (1977) task in
which participants are asked to either identify the large letters (abstract condition) or small letters
(concrete condition) of “…a series of large letters, each of which was composed of repetitions of
a given small letter” (p. 56); and a hierarchical shape task which requires participants to circle
either each large shape (abstract condition) or each small shape (concrete condition) in “…a
series of large shapes made up of smaller shapes” (p. 56). Given that this variety in mindset
manipulations led to consistent support of Wakslak and Trope’s (2009) hypothesis suggests that
other tasks which may occur more naturally in a work environment could similarly affect overall
mindset orientation and hence affect subsequent probability assessments. Moreover, probability
assessments unrelated to the mindset-influencing preceding task may be affected as Wakslak and
Trope’s (2009) results show that construal mindset serves as a cue to inform prospect assessment
even in situations in which such cue stems from a stimulus external to the evaluation task.
In sum, as discussed above, the literature suggests that probability is a dimension of
psychological distance and as such is tied to the level of mental construal (Trope and Liberman
2003, 2010; Wakslak et al. 2006; Todorov et al. 2007; Wakslak and Trope 2009). Based on CLT,
objects or events that are psychologically farther removed from direct experience (the here and
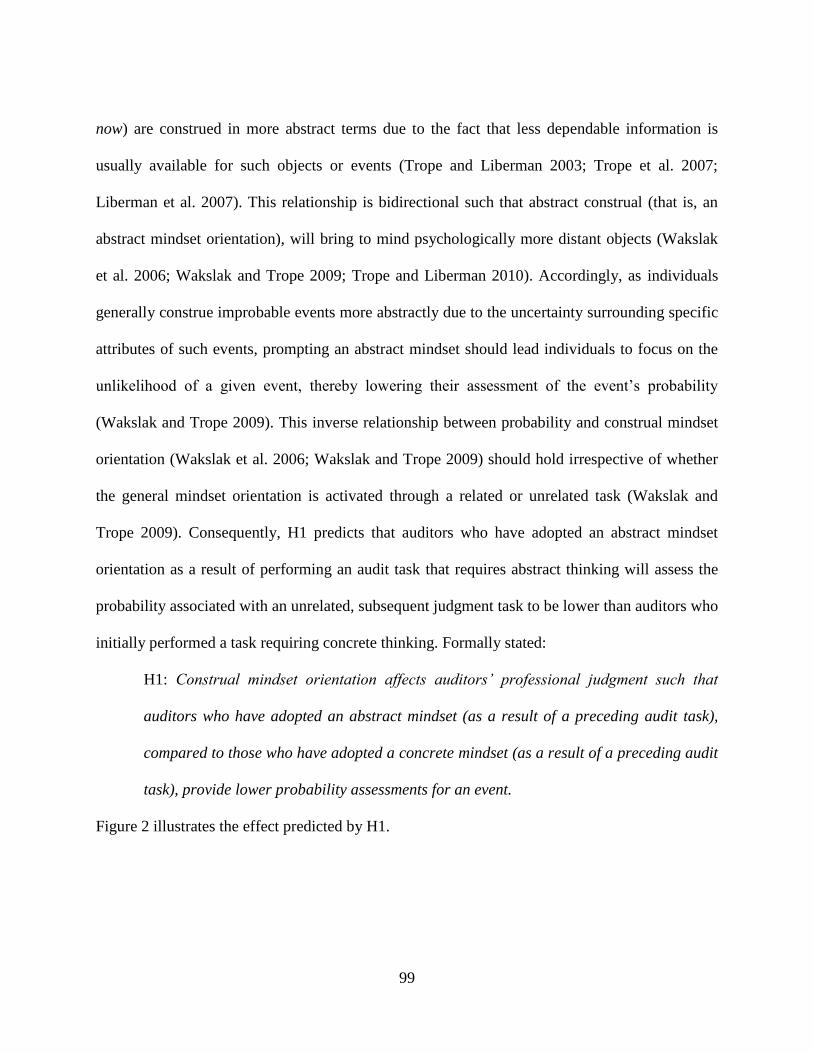
99
now) are construed in more abstract terms due to the fact that less dependable information is
usually available for such objects or events (Trope and Liberman 2003; Trope et al. 2007;
Liberman et al. 2007). This relationship is bidirectional such that abstract construal (that is, an
abstract mindset orientation), will bring to mind psychologically more distant objects (Wakslak
et al. 2006; Wakslak and Trope 2009; Trope and Liberman 2010). Accordingly, as individuals
generally construe improbable events more abstractly due to the uncertainty surrounding specific
attributes of such events, prompting an abstract mindset should lead individuals to focus on the
unlikelihood of a given event, thereby lowering their assessment of the event’s probability
(Wakslak and Trope 2009). This inverse relationship between probability and construal mindset
orientation (Wakslak et al. 2006; Wakslak and Trope 2009) should hold irrespective of whether
the general mindset orientation is activated through a related or unrelated task (Wakslak and
Trope 2009). Consequently, H1 predicts that auditors who have adopted an abstract mindset
orientation as a result of performing an audit task that requires abstract thinking will assess the
probability associated with an unrelated, subsequent judgment task to be lower than auditors who
initially performed a task requiring concrete thinking. Formally stated:
H1: Construal mindset orientation affects auditors’ professional judgment such that
auditors who have adopted an abstract mindset (as a result of a preceding audit task),
compared to those who have adopted a concrete mindset (as a result of a preceding audit
task), provide lower probability assessments for an event.
Figure 2 illustrates the effect predicted by H1.

100
Figure 2: Expected Results - H1
Notably, the impact of construal mindset on probability assessment predicted by CLT and
articulated as a main effect in H1 does not discriminate with respect to the focus of the
probability assessment task. To meet the mandates of extensional logic, a comparatively low
probability assessment for the occurrence of an event (as a result of the adoption of an abstract
mindset orientation) should be complemented with a comparatively high probability assessment
for the non-occurrence of the same event so that the combined probabilities sum to 1.
Conversely, a comparatively high probability assessment for the occurrence of an event (as a
result of the adoption of a concrete mindset orientation) should be complemented with a
comparatively low probability assessment for the non-occurrence of the same event so that the
combined probabilities sum to 1. If, however, both of those requirements are met, the prediction
articulated in H1 would not hold as the complementary probability associated with the abstract
mindset condition would be larger than the complementary probability associated with the
0%
10%
20%
30%
40%
50%
60%
70%
80%
90%
100%
Concrete Abstract
Pro
bab
ilit
y o
f C
oll
ecta
bil
ity
P(Event)

101
concrete mindset condition. The prediction based on CLT therefore implies that a probability
assessment bias would be introduced. Such a bias could be reflected in combined probabilities
(i.e., assessed probabilities for both the occurrence and the non-occurrence of the event) for
either or both construal mindset conditions. However, given that a concrete mindset is the default
mindset (Malkoc et al. 2010) combined probabilities of less than 1 are expected in the abstract
mindset condition and close to 1 in the concrete mindset condition. This, in turn, would point to a
probability assessment bias introduced by the abstract mindset orientation condition. As noted by
Wakslak and Trope (2009) with respect to non-sequential evaluations, abstraction should not
only lower one’s likelihood assessment for an event (e.g., probability of A occurring) but also
that for its complement (probability of A not occurring), depending on the focus of the judgment
task.
This line of argumentation is best illustrated through an example. Assume auditors who
have adopted a concrete mindset assess the probability of an event’s occurrence at .7 while those
who have adopted an abstract mindset assess the probability of the same event’s occurrence at .6
(i.e., lower, as predicted by CLT). Based on those initial assessments, the complementary
probabilities would be .3 and .4, respectively. However, CLT suggests that auditors who have
adopted an abstract mindset will also assess the probability associated with the event’s non-
occurrence lower than auditors who have adopted a concrete mindset. Accordingly, auditors who
have adopted an abstract mindset may assess a .25 probability (rather than a .4 probability) for
the event’s non-occurrence which is lower than the .3 probability assessment rendered by
auditors who have adopted a concrete mindset. However, a .25 probability assessment for the
event’s non-occurrence would suggest a .75 complementary probability (i.e., the event’s
occurrence) which is higher than the initial assessment of .6. Figure 3 illustrates the expected

102
pattern in probability assessments based on the above assumed probabilities. The hyphenated
line 1-P[Complement] depicts the complimentary probability assuming that auditors in the
abstract mindset orientation will assess the probability of the event’s non-occurrence to be .25
rather than the normative probability of .4 based on a .6 probability assessment for the event’s
occurrence. In other words, absent any bias, line 1-P[Complement] which represents the same
assessment as line P[Event], should be superimposed on the latter line (i.e., the lines should not
diverge). Line 1-P[Complement] thus represents the implied probability assessment for the event.
Figure 3: Expected Results - H2
Given the basic CLT proposition that abstract construal lowers perceived probability
regardless of the focus of the probability assessment task, H2 predicts that auditors who have
adopted an abstract mindset orientation will render combined probability assessments that will
diverge from 1 to a greater extent than those of auditors who have adopted (or maintained) a
concrete mindset orientation. Formally stated:
0%
10%
20%
30%
40%
50%
60%
70%
80%
90%
100%
Concrete Abstract
Pro
bab
ilit
y o
f C
oll
ecta
bil
ity
P(Event)
1- [P(Complement)]

103
H2: Combined probability assessments for the occurrence and the non-occurrence of an
event will be closer to 1 for auditors who have adopted a concrete mindset orientation
(as a result of a preceding audit task) than for auditors who have adopted an abstract
mindset orientation (as a result of a preceding audit task).
Research Method
Overview
To test the hypotheses, two experiments each following a 2 x 2 between-subjects factorial
design, were conducted. The design of each experiment fully crosses construal mindset
orientation (MINDSET) and focus of the probability assessment question (FOCUS) between
participants. Both experiments incorporate two unrelated decision-tasks: Task 1 and Task 2.
Upon completing Task 2, participants in both experiments responded to various debriefing,
manipulation check, and biographic questions before submitting their responses (see respective
subsections). Experiment 1, which uses an audit task as Task 1 and experienced auditors as
participants, represents the primary analysis. Experiment 2, which uses a well-established
psychology-based priming task as Task 1 and undergraduate accounting students as participants,
serves as a robustness test for the results derived from the first experiment. Moreover,
Experiment 2 is designed to shed light on the underlying psychological processes activated in the
auditor participants. Qualtrics was used to randomize the assignment of participants to the
experimental conditions and to obtain approximately equal cell sizes. Appendices A and B
illustrate the experimental material for Experiment 1 and Experiment 2, respectively. Participants
in Experiment 1 took an average of 14.2 minutes (s.d. = 9.75) (no difference across conditions; p

104
= 0.489) to complete the experiment,9 while participants in Experiment 2 took an average of 15.4
minutes (s.d. = 12.01) (no difference across conditions; p = 0.306) to complete the experiment.
Independent and Dependent Variables
The two independent variables for both experiments are MINDSET (abstract vs.
concrete) and FOCUS (event vs. complement). MINDSET is manipulated in Task 1 and FOCUS
is manipulated in Task 2. Task 1 differs between Experiment 1 and Experiment 2 and is
explained in the respective subsections (see sections “Experiment 1” and “Experiment 2” and
related Figures 4 and 7).
In the context of the experimental material, ‘event’ refers to the collectability of a
customer’s outstanding accounts receivable balance whereas ‘the event’s complement’ refers to
the uncollectibility of a customer’s outstanding accounts receivable balance. Participants in the
event condition responded to the question “Based on the above information, what is your
estimate of the probability that the receivable will be collectible next year?” Participants in the
complement condition responded to the question “Based on the above information, what is your
estimate of the probability that the receivable will be uncollectible next year?” Thus, the primary
dependent variable in both experiments is the participants’ probability assessment pertaining to a
hypothetical client’s ability to collect a customer’s outstanding accounts receivable balance.
Participants responded on a sliding scale with a minimum of 0% and a maximum of 100%.
Percentages selected were displayed and recorded at each 1% increment. The case material for
9 For purposes of calculating the average time, four participants who took more than 51 minutes (2 standard
deviations from the mean) were eliminated. Given that two of those participants took approximately 24 and 48
hours, respectively it was assumed that either the Qualtrics timer failed or that those participants accessed the link
and did not start taking the survey until a later time.

105
Task 2, which is identical for both experiments and described in more detail in the discussion of
Experiment 1, is adapted from Joyce and Biddle (1981 – Experiment 3a).
Experiment 1
Participants
Participation for Experiment 1 was solicited from personal contacts at audit firms as well
as from a survey company.10
All participants accessed the Qualtrics-based experimental material
online and only those who indicated in the screening questions that they had “at least 2 years’ of
audit experience” and that they are “currently working in public accounting” were permitted to
proceed.11
The survey software randomly assigned participants to the four experimental
conditions. To ensure that only auditors who paid sufficient attention to the experimental
material were recruited through the survey company, participants who either failed the
manipulation check question (discussed below) or an attention question (see Appendix A), were
exited from the survey.
A total of 90 auditors, 66 from personal contacts and 24 from the survey company,
completed the experimental material. Participants’ mean age was 35.4 years and mean years of
audit experience was 9.3 years. The sample consists of 60 male (66.7%) and 30 female (33.3%)
auditors. Sixty auditors (66.7%) indicated that they work for a national, international, or Big 4
audit firm, while the remaining 30 auditors (33.3%) indicated that they work for a local or
regional firm. The sample consists of 23 staff auditors (25.6%), 28 senior auditors (31.1%), 22
10
Participants recruited from the survey company were compensated for their participation. The amount of
compensation is unknown to the researcher. 11
Participants recruited from personal contacts were not asked to answer the screening questions since only those
who met the required criteria were contacted.

106
managers (24.4%), 9 directors (10.0%), and 8 partners (8.9%). With respect to education, 36
participants (40.0%) declared a Bachelor’s degree as the highest level of education attained, 45
auditors (50.0%) a Master’s degree, and 9 auditors (10.0%) a doctoral degree. Well over half of
the participants (67.8%) indicated that they hold a CPA license. No significant differences with
respect to any of the demographic measures (age, years of audit experience, gender, position,
education, and professional licenses) exist across experimental conditions (all p-values > 0.25).
Table 8 presents the demographic information.
Table 8: Demographics - Experiment 1
(N = 90)
Age
Mean 35.4
Median 34.5
Minimum 23.0
Maximum 68.0
Standard Deviation 9.4
Years of audit experience
Mean 9.3
Median 7.0
Minimuma 1.0
Maximum 45.0
Standard Deviation 7.9
Number Percentb
Gender
Male 60 66.7%
Female 30 33.3%
Firm Size
Big 4 13 14.4%
International 29 32.2%
National 18 20.0%
Regional 17 18.9%
Local 13 14.4%

107
Number Percentb
Position
Staff 23 25.6%
Senior 28 31.1%
Manager 22 24.4%
Director 9 10.0%
Partner 8 8.9%
Highest academic degree
Bachelor’s 36 40.0%
Master’s 45 50.0%
Doctoral 9 10.0%
Professional licensesc
CPA 61 67.8%
CA 10 11.1%
Other 31 34.4%
a Two participants indicated only 1 year of audit experience even though the qualification criteria specified a
minimum of two years’ audit experience. Eliminating those participants from the analyses does not alter the overall
reported results. b Percentages are rounded and do not always add up to 100%
c Several participants indicated that they hold more than one professional license. Totals do therefore not add up to
N=90 and 100%, respectively.
Experimental Procedures
Experiment 1 manipulates construal mindset by asking auditors to conduct a plausible
audit task which requires either a high-level, abstract perspective or a low-level, concrete
perspective. Each task is related to fraud risk assessment. Recent literature on fraud risk
assessment (see Wilks and Zimbelman 2004b and Favere-Marchesi 2013) finds beneficial effects
from decomposing fraud-risk assessments (i.e., individually assessing the risk stemming from
management attitudes, opportunities, and incentives prior to rendering a judgment about the
overall fraud risk) and suggests the possibility that auditors who decompose their assessments
first engage in categorization in order to reduce cognitive load (Favere-Marchesi 2013).

108
While present PCAOB standards do not require auditors to categorize fraud-risk into one
of three categories identified by AU Section 316 (SAS 99) (PCAOB 2002) (i.e.,
Incentives/Pressures, Opportunities, Attitudes/Rationalizations)12
, Favere-Marchesi (2013),
argues “categorization is a reasonable first step in auditors’ fraud-risk assessments” (p. 203).
With references to psychology research, he further explains that the inclination to categorize is a
ubiquitous facet of human thought and a natural response to decision-makers’ limited
information-processing capacity as categorization is critical for problem-solving and reasoning.
CLT research adds to this literature by pointing out that the association between
psychological distance and construal level has critical implications for categorization (Liberman
and Trope 2008). A firmly established finding within the CLT literature is that broad
categorization is associated with abstract construal (e.g., Liberman et al. 2002; Fujita et al.
2006a; Smith and Trope 2006; Wakslak and Trope 2009). Given that Wakslak and Trope (2009)
suggest that tasks requiring the grouping of objects into broad categories prompt an abstract
mindset and that, within the accounting literature, Wilks and Zimbelman (2004a) note that
“categorization may help auditors think more broadly” (p. 177), a categorization task involving
three broad categories to induce an abstract mindset orientation was used.
The abstract mindset condition of Task 1 requires participants to categorize a randomly
ordered listing of 30 statements pertaining to a hypothetical audit client (“Wittim”) into three
broad fraud risk factor categories (incentives/pressures, opportunities, and
attitudes/rationalizations). Specifically, participants were asked to “consider carefully the
implications of each statement and assign each statement to one of the above listed categories.”
12
While AU Section 316 (SAS 99) “suggests a consideration of fraud-risk factors classified in those three
components” (Farvere-Marchesi 2013, p. 203), only an overall fraud-risk assessment rather than an assessment for
each component is required.

109
Each statement is modeled after one of the fraud risk factors identified by AU Section 316.
Participants read a brief client description adopted from Morrill et al. (2012) (introductory
paragraph only), and were informed that a member of their audit team compiled the 30
statements about Wittim. Twenty-one of those statements indicate the presence of a risk while
the remaining 9 statements (three within each fraud risk category) do not suggest heightened
risk. The latter are constructed by negating the wording of various AU Section 316 statements
and serve a twofold purpose: first, their inclusion renders the task slightly more difficult which
may prompt auditors to devote more thought to the task; second, their inclusion should lead to a
more balanced assessment of fraud risk factors related to the client (rather than an assessment
that may be considered excessively negative). The case material was designed to contain
information similar to that which would be used by experienced auditors in rendering a fraud risk
assessment during the planning phase of the audit. The fraud risk category definitions included in
the experimental material are adopted from Wilks and Zimbelman (2004b).
Participants in the concrete mindset orientation condition received identical background
information, fraud risk category definitions, and statements about Wittim. In contrast to the
abstract mindset orientation condition, however, the same 30 statements were already grouped
according to the three fraud risk factor categories. Rather than categorizing the statements,
participants were instructed to “consider carefully how the information contained in each
statement affects [their] assessment of risk related to the respective risk category.” Differently
stated, participants were asked to evaluate the significance of the fraud risk factors. Participants
responded to category-specific questions about how they perceive each statement to affect the
risk of misstatements arising from fraudulent financial reporting. Answers were captured on a 5-
point Likert scale anchored at 1 (“substantially decreases”) and 5 (“substantially increases”). The

110
reason for capturing responses on a 5-point Likert scale rather than merely asking whether each
statement indicates heightened risk or not is that the former method was considered more
suitable for prompting participants to devote more thought to each statement (as would likely be
required in an actual audit).
Given that Malkoc et al. (2010) argue that a concrete mindset is the default mindset and
that participants will not be prompted to think in terms of higher-level categories (that is, to
group risk factors), the argument in this study is similarly that this task will sustain or promote a
concrete mindset orientation. Furthermore, the experimental material asked participants to
consider the implications of each statement in the form of how-questions. While those how-
questions do not strictly prompt the consideration of a process (as in Wakslak and Trope 2009),
they are somewhat similar in that they require sequential reasoning. That is, participants needed
to evaluate each statement with respect to its impact (if any) on the risk of misstatement arising
from fraudulent financial reporting attributable to the specific risk category.
Task 2, adapted from Joyce and Biddle (1981 – Experiment 3a) asked participants to
estimate the probability that the accounts receivable balance owed to an audit client (“Premier
Electro Tech”) by a single customer will be collectible or uncollectible. Participants are informed
that their review of an audit client’s allowance for uncollectible receivables reveals that a very
large account - material to the audit – is 6 months past due from a single customer who has
provided a positive confirmation that the balance is correct. Participants are further informed
that, based on their past “experience with Premier Electro Tech [that] the company has been able
to collect receivables that are 6 months past due about half of the time.” The case scenario
continues explaining that the audit client’s controller believes that the entire amount will be
recoverable. Additionally, the audit client’s credit manager clarifies that although the customer’s

111
“average payment time on accounts receivable has steadily increased” the delay in payment is
attributable to an inadequate accounting system – which is currently being replaced – rather than
to problems with generating cash flows. Participants were then asked either to estimate the
probability that the accounts receivable balance owed to Premier Electro Tech will be collectible
or that it would be uncollectible. Participants responded on a sliding scale with a minimum of
0% and a maximum of 100%.
Appendix A illustrates the experimental material for Experiment 1. Note that either
condition of the mindset manipulation task required auditors to render 30 decisions in the domain
of fraud risk assessment (Task 1; fraud risk assessment task). The 30 statements, which are based
on fraud risk factors identified in AU Section 316 (SAS 99), and modified to describe a
hypothetical audit client, are identical for either mindset manipulation condition. Aside from
requiring an equal number of decisions, the conditions were expected to require a similar amount
of effort. Perceived difficulty associated with Task 1 was captured in the debriefing questions
(see below). Task 1 is related to client Wittim and has no relationship to the subsequent task of
estimating the probability that the accounts receivable balance owed to client Premier Electro
Tech will be collectible or uncollectible (Task 2; probability assessment task). After completing
Task 2, participants who passed the manipulation check questions responded to debriefing
questions and provided biographic information before submitting their results. Figure 4 depicts
the experimental procedures. The experimental conditions are summarized in Table 9.

112
Figure 4: Experimental Procedures - Experiment 1
Table 9: Experimental Conditions - Experiment 1
Condition Mindset
Orientation
Manipulation Method (Task 1) Focus of Probability
Assessment Task
1 Abstract Categorization of Risk Factors Event
2 Abstract Categorization of Risk Factors Complement
3 Concrete Risk Factor Significance Evaluation Event
4 Concrete Risk Factor Significance Evaluation Complement
This table illustrates the four conditions of the experimental material and relates the mindset orientation
manipulation to the respective version of Task 1. The focus of the probability assessment task is
manipulated within Task 2.

113
Manipulation Checks
Given the nature of the experimental tasks and the research question, it is critical that
participants understand that their decisions associated with Task 1 and Task 2 relate to different
audit clients. Accordingly, participants were asked to indicate whether the following statement is
correct or false (true/false format): “The two preceding tasks (‘Fraud Risk Factor Task’ and
‘Accounts Receivable Task’) were related to the same audit client”. Only participants who were
recruited from personal contacts were able to proceed after failing the manipulation check
question. Responses from seven auditors who failed the manipulation check question were
subsequently eliminated in order to ensure equal treatment of participant pools (see also
discussion in section “Participants”).
Debriefing Questions
A debriefing question inquired about the perceived difficulty of the fraud risk factor task.
Responses were provided on a 5-point Likert scale anchored by 1 (“very easy”) and 5 (“very
difficult”). Overall, auditors judged the fraud risk factor task to be neither easy nor difficult
(mean = 2.80, s.d. = 0.90). Difficulty assessments did not differ across conditions (p = .924)
suggesting that the fraud risk factor categorization task (i.e., the abstract version of Task 1) was
considered as difficult as the fraud risk factor significance evaluation task (i.e., the concrete
version of Task 1). Participants were also asked to indicate whether they had experience with
rendering a probability assessment similar to the one described in the experimental material.
Answers were captured in yes/no format. The majority of auditors (68%) indicated such
experience (no difference across conditions: p = .527). Lastly, for exploratory purposes, a
debriefing question was incorporated to capture auditors’ perception about whether completion

114
of the fraud risk factor task (client Wittim – Task 1) required “abstract thinking” or “concrete
thinking”. Prior to answering this question, participants were introduced to the abstract versus
concrete thinking concepts through a plain-English definition of those terms, followed by a
categorization exercise involving ten potential audit tasks. In this exercise, auditors selected
either “Abstract Thinking” or “Concrete Thinking” as the required type of cognition associated
with completing the described tasks. Five of the described audit tasks require abstract thinking
whereas the remaining five audit tasks call for concrete thinking.13
Although auditors scored high
on the classification task (mean: 7.8 out of 10 correctly classified; no difference between
conditions: p = .314) and thus seem to have internalized the difference between abstract thinking
and concrete thinking, their ability to correctly categorize the fraud risk factor task varied by
condition. While 77.3% of participants in the abstract mindset conditions correctly identified
their version of Task 1 as requiring abstract thinking, only 19.6% of participants in the concrete
mindset conditions correctly identified their version of Task 1 as requiring concrete thinking.
Results
H1 predicts that construal mindset orientation affects auditors’ professional judgment
such that auditors who have adopted an abstract mindset provide lower probability assessments
for an event than auditors who have adopted a concrete mindset. To test H1, a t-test comparing
the mean probabilities assessed by participants in the ‘concrete mindset / event’ condition with
those of the ‘abstract mindset / event’ condition was conducted. Results shown in Table 10
reveal that, on average, auditors in the concrete mindset condition assessed the probability that
the accounts receivable will be collectible moderately higher (mean = 68.84, s.d. = 12.53) than
13
A pretest of the ten items with several Accounting Ph.D. students resulted in 100% identical categorizations – in
line with the researcher’s expected classifications.

115
auditors in the abstract mindset condition (mean = 61.43, s.d. = 18.85). This difference is
moderately significant (t33.73 = 1.539, one-tailed p = .067) and represents a small- to medium-
sized effect (Cohen’s d = .47; r = .26) (Cohen 1988, 1992).14
The downward sloping trend line
shown in Figure 5 supports this prediction. H1 is therefore supported.
Figure 5: Estimated Means - Experiment 1: H1
Table 10: Results - Experiment 1: H1
T-Test Results
Effect Size
Condition N Mean S.D. t df p-valuea d r
Concrete / Event 25 68.84 12.53 1.539 33.73 .067
b .47 .26
Abstract / Event 21 61.43 18.85
a One-tailed significance level
b Since homogeneity of variance was violated (Levene statistic = .008) a Welch test was performed. Results are
identical to those from the independent sample t-test (F = 2.368; one-tailed p = .067).
14
The t-test was conducted with approximately half the sample size (n = 46). Therefore, the effect size was not
expected to be strong.
0%
10%
20%
30%
40%
50%
60%
70%
80%
90%
100%
Concrete Abstract
Pro
bab
ilit
y o
f C
oll
ecta
bil
ity
P(Event)

116
H2 predicts that the combined probability assessments for the occurrence and the non-
occurrence of an event will be closer to 1 for auditors who have adopted a concrete mindset
orientation than for auditors who have adopted an abstract mindset orientation. As such, H2
predicts an interaction between MINDSET and FOCUS.
Auditors’ mean probability assessments are graphically depicted in Figure 6. Both lines
in Figure 6 represent auditors’ “event” assessment (i.e., the estimated probability that the
accounts receivable balance will be collectible) even though the hyphenated line is derived (i.e.,
calculated as 1 minus probability of complement) and thus contingent on the assumption that
participants in the complement condition would have provided perfectly complementary
assessments had they been exposed to both the “event” and the “complement” version of the
probability assessment question. Contrary to expectations, the hyphenated trend line slopes
downward, does not meet the solid line in the concrete condition, and lies below the solid line.
As such, the trend lines point toward a second, unexpected main effect associated with
independent variable FOCUS. Differently stated, the lack of anticipated slope change suggests
that the ordinal interaction predicted in H2 (compare to Figure 3) is not supported.

117
Figure 6: Estimated Means - Experiment 1: H2
To test H2, data from the complete sample (n = 90) was used. Probability assessments
provided by auditors in the complement conditions were transformed into implied event
probability assessments (i.e., calculated as 1 minus probability of complement) such that all
responses relate to the same dependent variable measure and thus permit ANOVA testing.
Prior to conducting hypothesis testing for H2 via traditional ANOVA, a linear regression
(untabulated) was performed in order to identify potential covariates. All demographic variables
(age, gender, audit experience, position in firm, firm size, education, and professional licenses)
were simultaneously regressed on the dependent variable. As none of the demographic variables
was significant, the ANOVA results reported below do not incorporate covariates.15
15
ANOVA using the full sample size violates the assumption of equal error variances based on Levene’t test (p =
.018) and Hartley’s FMax test (untabulated). To deal with this potential problem, the analysis was repeated with equal
cell sizes (Glass 1972). A random number generator (https://www.random.org/) was used in order to select four
observations in the’ concrete mindset / event’ condition and two observations in the ‘abstract mindset / complement’
condition for elimination, resulting in equal cell sizes (21 observations per cell). Although ANOVA results with
equalized cell sizes (untabulated) show lower p-values for both independent variables as well as for the interaction
0%
10%
20%
30%
40%
50%
60%
70%
80%
90%
100%
Concrete Abstract
Pro
bab
ilit
y o
f C
oll
ecta
bil
ity
P(Event)
1- [P(Complement)]
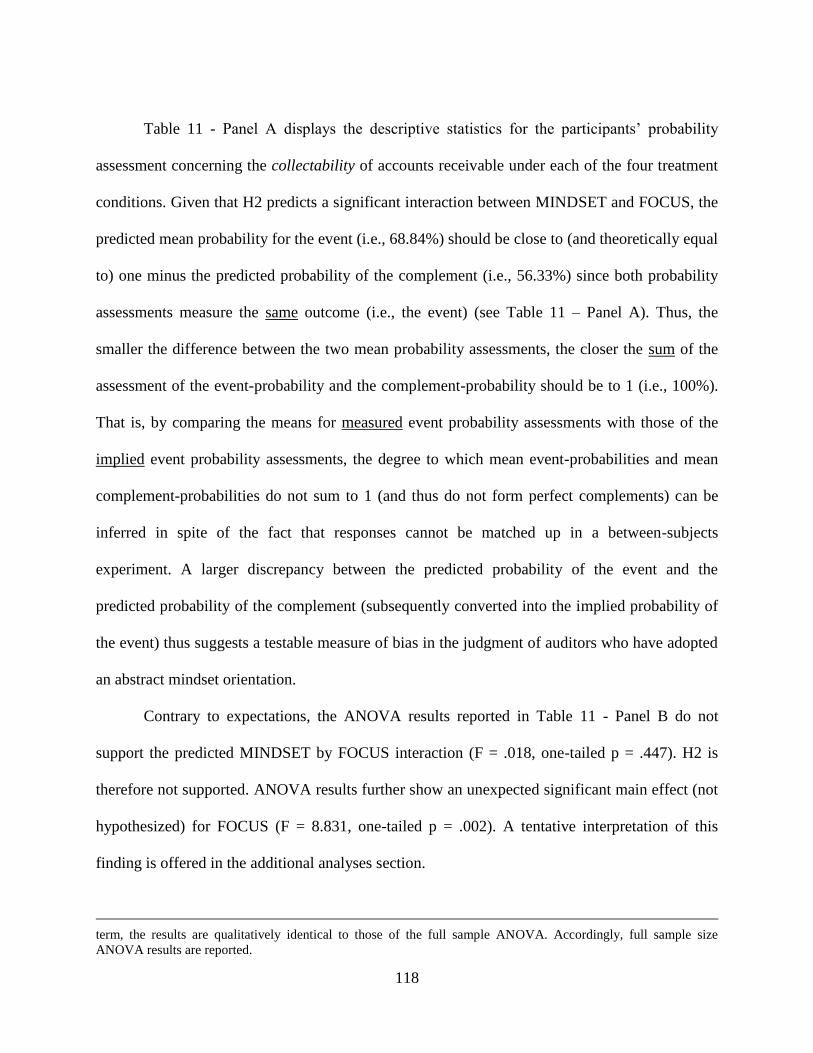
118
Table 11 - Panel A displays the descriptive statistics for the participants’ probability
assessment concerning the collectability of accounts receivable under each of the four treatment
conditions. Given that H2 predicts a significant interaction between MINDSET and FOCUS, the
predicted mean probability for the event (i.e., 68.84%) should be close to (and theoretically equal
to) one minus the predicted probability of the complement (i.e., 56.33%) since both probability
assessments measure the same outcome (i.e., the event) (see Table 11 – Panel A). Thus, the
smaller the difference between the two mean probability assessments, the closer the sum of the
assessment of the event-probability and the complement-probability should be to 1 (i.e., 100%).
That is, by comparing the means for measured event probability assessments with those of the
implied event probability assessments, the degree to which mean event-probabilities and mean
complement-probabilities do not sum to 1 (and thus do not form perfect complements) can be
inferred in spite of the fact that responses cannot be matched up in a between-subjects
experiment. A larger discrepancy between the predicted probability of the event and the
predicted probability of the complement (subsequently converted into the implied probability of
the event) thus suggests a testable measure of bias in the judgment of auditors who have adopted
an abstract mindset orientation.
Contrary to expectations, the ANOVA results reported in Table 11 - Panel B do not
support the predicted MINDSET by FOCUS interaction (F = .018, one-tailed p = .447). H2 is
therefore not supported. ANOVA results further show an unexpected significant main effect (not
hypothesized) for FOCUS (F = 8.831, one-tailed p = .002). A tentative interpretation of this
finding is offered in the additional analyses section.
term, the results are qualitatively identical to those of the full sample ANOVA. Accordingly, full sample size
ANOVA results are reported.

119
Table 11: Results - Experiment 1: H2
Panel B: Results of ANOVA with Event Probability Assessment as Dependent Measure
Source S.S d.f. M.S. F-Ratio p-valuea
Mindset Orientationb 1433.446 1 1433.446 3.297 .037
Focusc 3839.806 1 3839.806 8.831 .002
Mindset Orientation * Focus 7.828 1 7.828 .018 .447
Error 37391.604 86 434.786
Total 354168.000 90
a One-tailed significance level
b Mindset orientation was manipulated between participants at two levels: abstract and concrete. In the ‘abstract’
condition, participants performed a categorization task related to fraud risk factors. In the ‘concrete’ condition,
participants performed a fraud risk factor significance evaluation task. c Focus was manipulated by varying the dependent variable measure question. In the ‘event’ condition participants
were asked, “Based on the above information, what is your estimate of the probability that the receivable will be
collectible next year?” In the ‘complement’ condition participants were asked, “Based on the above information,
what is your estimate of the probability that the receivable will be uncollectible next year?” Participants responded
on a sliding scale with a minimum of 0% and a maximum of 100%. Percentages selected were displayed and
recorded at each 1% increment.
Experiment 2
Participants
A total of 118 undergraduate accounting students were recruited for Experiment 2 and
completed the experimental material online. Participants’ mean age was 26.1 years and mean
Panel A: Descriptive Statistics – Mean (Standard Deviation) [Sample Size]
Focus Overall
Mindset Orientation Event Complement Mindset Orientation
Concrete 68.84 (12.53) [25] 56.33 (25.14) [21] 63.13 (20.11) [46]
Abstract 61.43 (18.85) [21] 47.74 (25.12) [23] 54.27 (23.15) [44]
Overall Focus 65.46 (15.99) [46] 51.84 (25.21) [44] 58.80 (21.98) [90]

120
years of work experience was 4.8 years.16
The sample consists of 57 male (48.3%) and 61 female
(51.7%) students. One-hundred and thirteen students (95.8%) indicated that they have taken (or
are currently taking) an audit class. With respect to students’ intention to work as an auditor
upon graduation, 26 participants (22.0%) answered “Yes”, 32 (27.1%) answered “No”, and the
remaining 60 students (50.8%) answered “Don’t know”. No significant differences with respect
to any of the demographic measures (age, gender, audit class taken or in progress, work
experience, and intention to work as an auditor) exists across experimental conditions, (all p-
values > 0.28). Table 12 presents the demographic information.
Table 12: Demographics - Experiment 2
(N = 118)
Age
Mean 26.1
Median 22.0
Minimum 19.0
Maximum 56.0
Standard Deviation 8.0
Years of work experience
Mean 4.8
Median 2.0
Minimum 0.0
Maximum 33.0
Standard Deviation 6.2
16
Audit experience (incl. internships) among participants was very low (mean = 1 month) (untabulated).

121
Number Percent
Gender
Male 57 48.3%
Female 61 51.7%
Audit class taken or in progress
Yes 113 95.8%
No 5 4.2%
Intention to work as an auditor
Yes 26 22.0%
No 32 27.1%
Don’t know 60 50.8%
Experimental Procedure
Experiment 2 is designed to provide further evidence that construal mindset rather than
the nature of the experimental audit task drives participants’ probability assessment. While
Experiment 1 was designed to illustrate that thinking about broad categories in a realistic audit
context induces an abstract mindset orientation and subsequently affects auditors’ judgment, it
could be argued that such categorization tasks are the only tasks that would lead to the
hypothesized effects. Support of the hypotheses through Experiment 2 would thus broaden the
generalizability of the results from Experiment 1 and suggest that other audit tasks that prompt
the adoption of an abstract mindset orientation may similarly affect auditors’ subsequent
judgment. In Experiment 2, a construal mindset priming task developed and tested in the
psychology literature (Freitas et al. 2004; Fujita et al. 2006b – Experiment 3; Wakslak and Trope
2009 – Study 2) was administered prior to asking participants to render their probability
assessment in Task 2 (for a description of Task 2 refer to Experiment 1). Experiment 2 thus
differs from Experiment 1 with respect to Task 1 as it uses a cognitive priming task rather than

122
an auditing-related task in order to manipulate the independent variable construal mindset.
Participants were exposed to the same probability assessment task as participants in Experiment
1. Given that Task 1 involves a psychology-based mindset manipulation, the use of student
subjects for Experiment 2 is justified. The psychology-based mindset manipulation of Task 1
also serves as a robustness test for the corresponding Task 1 in Experiment 1.
The cognitive priming task for the abstract mindset condition required participants to
complete 30 sentences by generating a superordinate category for the capitalized word (e.g.,
COLLEGE, SENATOR) within each sentence (e.g., “A______ is an example of ______”).
Participants in the concrete mindset condition completed 30 sentences by generating a
subordinate exemplar for the capitalized word within each sentence (e.g., “An example of a
SPORT is ______”). The second task (Task 2) and the associated manipulation of the
independent variable focus were identical to Experiment 1. Figure 7 depicts the experimental
procedures and Table 13 summarizes the four conditions. The experimental material is illustrated
in Appendix B.
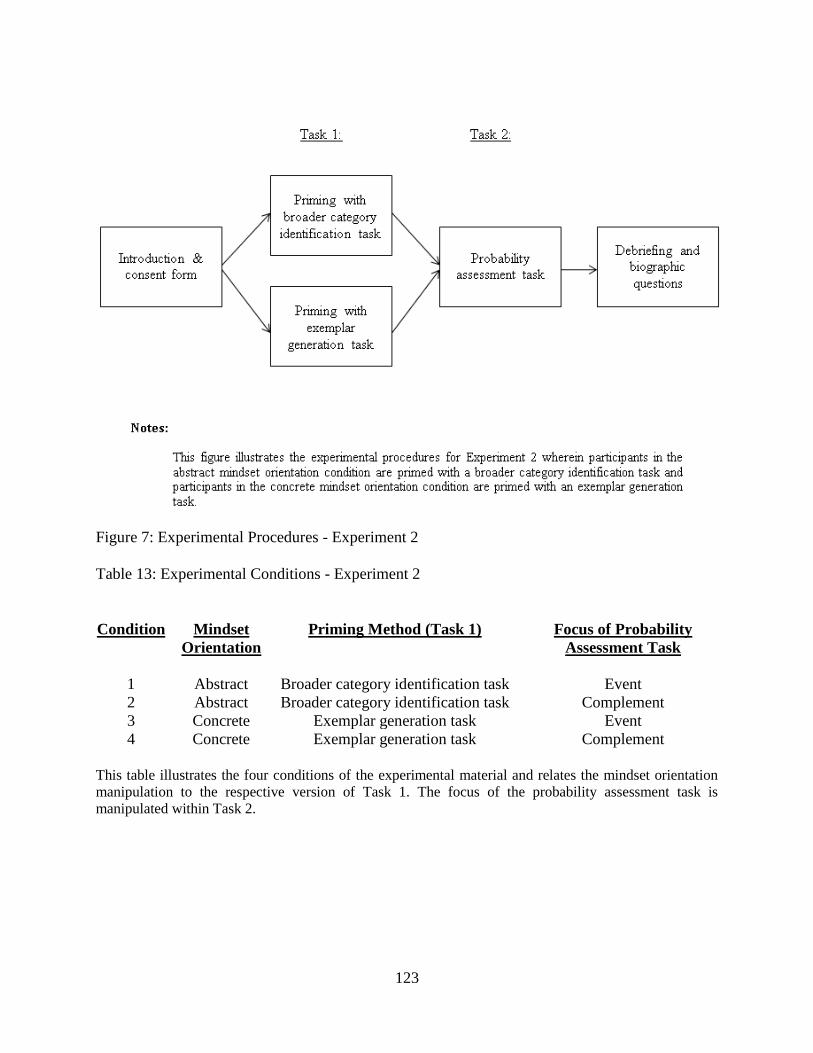
123
Figure 7: Experimental Procedures - Experiment 2
Table 13: Experimental Conditions - Experiment 2
Condition Mindset
Orientation
Priming Method (Task 1) Focus of Probability
Assessment Task
1 Abstract Broader category identification task Event
2 Abstract Broader category identification task Complement
3 Concrete Exemplar generation task Event
4 Concrete Exemplar generation task Complement
This table illustrates the four conditions of the experimental material and relates the mindset orientation
manipulation to the respective version of Task 1. The focus of the probability assessment task is
manipulated within Task 2.

124
Debriefing Questions
Student participants completed the same audit task categorization exercise as the auditors
in Experiment 1 (see debriefing questions for Experiment 1). However, students were not asked
to classify their version of Task 1 as either requiring abstract or concrete thinking since no
additional insights were expected to result from such inquiry. The sole purpose for including the
task was to further validate the researcher’s subjective classification of the ten described audit
tasks. Overall, agreement between the student participants’ classifications and those of the
researcher was high (mean: 8.8 out of 10 ‘correctly’ classified; no difference between
conditions: p = .795).
Results
Similar to the analysis for Experiment 1, a t-test comparing the mean probabilities
assessed by participants in the ‘concrete mindset / event’ condition with those of the ‘abstract
mindset / event’ condition was conducted. On average, participants in the concrete mindset
condition assessed the probability that the accounts receivable will be collectible higher (mean =
64.41, s.d. = 14.62) than participants in the abstract mindset condition (mean = 60.33, s.d. =
16.84). Although this difference was not statistically significant (t57 = .993, one-tailed p = .163),
effect size estimates suggest a small effect (d = .26; r = .13) (Cohen 1988, 1992). The downward
sloping trend line shown in Figure 8 illustrates this effect. H1 is not supported.

125
Figure 8: Estimated Means - Experiment 2: H1
Table 14: Results - Experiment 2: H1
T-Test Results
Effect Size
Condition N Mean S.D. t df p-valuea d r
Concrete / Event 29 64.41 14.62 .993 57 .163 .26 .13
Abstract / Event 30 60.33 16.84
a One-tailed significance level
Recall that H2 predicts that the combined probability assessments for the occurrence and
the non-occurrence of an event will be closer to 1 for participants who have adopted a concrete
mindset orientation than for participants who have adopted an abstract mindset orientation. As
such, H2 predicts an interaction between MINDSET and FOCUS.
Participants’ mean probability assessments are graphically depicted in Figure 9. As
explained in connection with the corresponding Figure 6 in Experiment 1, both lines in Figure 9
represent participants’ “event” assessment even though the hyphenated line is derived (i.e.,
0%
10%
20%
30%
40%
50%
60%
70%
80%
90%
100%
Concrete Abstract
Pro
bab
ilit
y o
f C
oll
ecta
bil
ity
P(Event)

126
calculated as 1 minus probability of complement). While the hyphenated line has the predicted
upward slope, it lies below the solid line. The overall pattern shown in Figure 9 thus deviates
from expectations illustrated in Figure 3.
Figure 9: Estimated Means - Experiment 2: H2
To test H2, data from the complete sample (n = 118) was used. As in Experiment 1,
probability assessments provided by participants in the complement conditions were transformed
into implied event probability assessments (i.e., calculated as 1 minus probability of
complement) such that all responses relate to the same dependent variable measure and thus
permit ANOVA testing.
Prior to conducting hypothesis testing for H2 via traditional ANOVA, a linear regression
(untabulated) was performed in order to identify potential covariates. All demographic variables
(age, gender, audit class taken or in progress, audit experience, non-audit work experience, and
intentions to work as an auditor) were simultaneously regressed on the dependent variable
0%
10%
20%
30%
40%
50%
60%
70%
80%
90%
100%
Concrete Abstract
Pro
bab
ilit
y o
f C
oll
ecta
bil
ity
P(Event)
1- [P(Complement)]

127
probability assessment. As none of the demographic variables was significant, the ANOVA
results reported below do not incorporate covariates.
Table 15 – Panel A shows descriptive statistics for the participants’ probability
assessment concerning the collectability of accounts receivable under each of the four treatment
conditions. ANOVA results shown in Table 15 - Panel B show a moderately significant effect for
the predicted MINDSET by FOCUS interaction (F = 2.622, one-tailed p = .054). However, H2
lacks support since combined probability assessments for the event and the complement appear
closer for auditors who have adopted an abstract mindset orientation. Moreover, similar to the
results reported for Experiment 1, Table 15 - Panel B shows an unexpected moderately
significant main effect (not hypothesized) for FOCUS (F = 2.436, one-tailed p = .061). A
tentative interpretation of this finding is offered in the additional analyses section.
Table 15: Results - Experiment 2: H2
Panel A: Descriptive Statistics – Mean (Standard Deviation) [Sample Size]
Focus Overall
Mindset Orientation Event Complement Mindset Orientation
Concrete 64.41 (14.62) [29] 53.55 (21.92) [29] 58.98 (19.26) [58]
Abstract 60.33 (16.84) [30] 60.53 (19.97) [30] 60.43 (18.31) [60]
Overall Focus 62.34 (15.78) [59] 57.10 (21.07) [59] 59.72 (18.72) [118]

128
Panel B: Results of ANOVA with Event Probability Assessment as Dependent Measure
Source S.S d.f. M.S. F-Ratio p-valuea
Mindset Orientationb 62.055 1 62.055 .180 .336
Focusc 838.147 1 838.147 2.436 .061
Mindset Orientation * Focus 902.215 1 902.215 2.622 .054
Error 39220.340 114 344.038
Total 461843.000 118
a One-tailed significance level
b Mindset orientation was manipulated between participants at two levels: abstract and concrete. In the ‘abstract’
condition, participants were primed with a broader category identification task adopted from the psychology
literature. In the ‘concrete’ condition, participants were primed with an exemplar generation task adopted from the
psychology literature. c Focus was manipulated by varying the dependent variable measure question. In the ‘event’ condition participants
were asked, “Based on the above information, what is your estimate of the probability that the receivable will be
collectible next year?” In the ‘complement’ condition participants were asked, “Based on the above information,
what is your estimate of the probability that the receivable will be uncollectible next year?” Participants responded
on a sliding scale with a minimum of 0% and a maximum of 100%. Percentages selected were displayed and
recorded at each 1% increment.
Additional Analyses
Given the unexpected significant main effect for independent variable FOCUS in both
experiments and the absence of a significant interaction effect in Experiment 1, additional testing
was performed in order to shed light into those results. Post-hoc tests explore the discussion
connecting H1 and H2, that is, the prediction that individuals who have adopted an abstract
mindset orientation also assess complement probabilities to be lower than individuals who have
adopted a concrete mindset orientation. In other words, post-hoc tests compare the mean
probability assessments provided by participants in the ‘concrete mindset / complement’
condition with those provided by participants in the ‘abstract mindset / complement’ condition.
As such, the post-hoc tests offer a direct measure of an implicit assumption inherent to H2.
Given that post-hoc tests were conducted with approximately half the sample size each, weaker
effect sizes are expected.

129
A t-test applied to data from Experiment 1 reveals that, on average, auditors in the
concrete mindset condition assessed the probability that the accounts receivable will be
uncollectible lower (mean = 43.67, s.d. = 25.14) than auditors in the abstract mindset condition
(mean = 52.26, s.d. = 25.12). While the means compared in this t-test point in directions that
contradict the aforementioned discussion, the difference was not statistically significant (t42 =
1.113, one-tailed p = .132).17
Table 16 – Panel A illustrates those results.
A corresponding t-test applied to data from Experiment 2 reveals a different pattern. On
average, participants in the concrete mindset condition assessed the probability that the accounts
receivable will be uncollectible higher (mean = 46.45, s.d. = 21.92) than participants in the
abstract mindset condition (mean = 39.47, s.d. = 19.97), in support of the argumentation leading
to H2. While the difference was not statistically significant (t57 = 1.280, one-tailed p = .103),
effect size estimates suggest a small effect (d = .33; r = .17) in the predicted direction (Cohen
1988, 1992). Table 16 – Panel B illustrates those results.
17
The small effect size based on Cohen’s d and Pearson’s correlation coefficient does not support the prediction
derived from CLT since the higher mean is associated with the abstract mindset orientation condition.

130
Table 16: Post-hoc Tests
Panel A: Experiment 1
Effect Size
DV (Probability Question) Conditiona N Mean S.D. t df p d r
Based on the above information, what is your estimate of the
probability that the receivable will be uncollectible next year?
C / C 21 43.67 25.14 1.113 42 .132 .34 .17
A / C 23 52.26 25.12
Panel B: Experiment 2
Effect Size
DV (Probability Question) Conditiona N Mean S.D. t df p d r
Based on the above information, what is your estimate of the
probability that the receivable will be uncollectible next year?
C / C 29 46.45 21.92 1.280 57 .103 .33 .17
A / C 30 39.47 19.97
a C/C = Concrete/Complement; A/C = Abstract/Complement

131
With respect to Experiment 1, the primary analysis for testing H1 combined with the
above reported t-test suggest that H1 is supported for auditors who assess the probability of an
event, but not for auditors who assess the event’s complement. A potential explanation for this
finding may be that the probability assessment predictions derived from CLT only hold when
decision-makers evaluate a familiar hypothesis.18
While it remains an empirical question, it could
be argued that experienced auditors are more accustomed to judge the collectability of accounts
receivable than the uncollectibility.19
The notably higher variances in the complement
conditions (overall variance: 25.21) compared to those in the event conditions (overall variance:
15.99) seems to support the conclusion that presenting auditors with a non-customary hypothesis
takes them out of routine cognition mode and thus outside the domain of CLT.
This conclusion would also permit reconciliation of the results reported for Experiment 1
and those for Experiment 2. Even though a firmly-established psychology task was utilized in
order to prime student participants with either an abstract or concrete mindset orientation, the
observed effects on probability judgments did not cross into statistical significance. The rather
small effect sizes detected in both t-tests (i.e., in primary analysis and in post-hoc testing) could
be interpreted as an indication that the accounts receivable task was outside the routine decision
domain of at least some student participants and thus outside the domain of CLT with respect to
those subjects. Moreover, while the overall variance in the complement conditions (21.07 – see
18
The extant CLT literature on probability related judgments (e.g., Todorov et al. 2006, Wakslak and Trope 2009,
Wakslak 2012) uses predominantly undergraduate students as participants and examines judgments encountered in
everyday situations (e.g., the prediction of whether a highly unlikely gambling outcome would occur in the near or
distant future). Moreover, the only study that directly investigates how construal level affects probability estimates,
Wakslak and Trope (2009), uses exclusively students who render rather ordinary judgments such as the likelihood
that an item is on sale or that someone is going to do something (see Wakslak and Trope 2009). The generalizability
of findings from the aforementioned psychology studies to situations in which decision-makers are confronted with
a non-routine probability judgment may thus be limited. 19
A focus on uncollectibility seems more appropriate for the evaluation of the account “Allowance for Uncollectible
Accounts”.

132
Table 15 – Panel A) was also higher than the overall variance in the event conditions (15.78 –
see Table 15 – Panel A), the discrepancy was less prominent than in Experiment 1 (25.21 and
15.99, respectively – see Table 11 Panel A). This may suggest that the effect of FOCUS on
probability assessment is less pronounced for students than for auditors who may be well-
accustomed to thinking about collectability. ANOVA results reported in Table 11 – Panel B and
Table 15 – Panel B support this conclusion: FOCUS is statistically significant at the .05 level in
Experiment 1 (one-tailed p-value = .002) but only at the .1 level in Experiment 2 (one-tailed p-
value = .061). Moreover, even for student participants for whom the assessment of probabilities
related to accounts receivable constitutes a rather non-routine task in general, the assessment of
uncollectibility of accounts receivable may seem even more unnatural than the assessment of
collectability.
While this interpretation of post-hoc results tentatively points to additional domain
limitations of CLT, such findings should not be considered unusual. As noted in the introduction
to this manuscript, a corresponding conclusion was drawn by Trotman and Wright (2000) with
respect to the predictions associated with order and recency effects applied to an audit setting.
Accordingly, further exploration of the applicability of CLT-derived predictions with respect to
probability assessments seems warranted.
Supplemental and Exploratory Measures
Participants in both experiments also responded to four additional questions incorporated
for exploratory purposes. The first question is closely related to the primary dependent variable
and asks participants to indicate whether they believe that “…the accounts receivable balance is
materially misstated?” (Yes/No format). Chi-square tests for independence of classification

133
reveal no significant relationship between independent variable FOCUS and participants’
perception of whether or not the accounts receivable balance is materially misstated (Experiment
1: X2 = 2.333, two-tailed p-value = .127; Experiment 2: X
2 = .035, two-tailed p-value = .851).
Responses to the aforementioned question, which presumably provides a better indication of
participants’ intention to adjust further audit steps, were further used to determine whether
FOCUS affects participants’ ability to sufficiently align their binary decision with their
corresponding probability judgment rendered for the primary dependent variable question. That
is, participants who estimated the probability that the receivable will be collectible to be lower
than 50% should have answered “Yes” while those who provided probability assessments larger
than 50% should have answered “No”.20
Results (untabulated) indicate that approximately two-
thirds of participants rendered a choice that is consistent with their probability assessment
(Experiment 1: 66.20%; Experiment 2: 64.20%). No significant difference between participants
in the ‘event’ condition and those in the ‘complement’ condition with respect to choice
consistency exists (Experiment 1: p = .941; Experiment 2: p = .352). Overall, those results
suggest that the majority of participants seem to incorporate their prior probability assessment
into a subsequent decision that may have important consequences for further audit procedures.
The focus of the probability assessment question did not seem to affect their ability to do so.
The remaining three questions called for probability assessments on a sliding scale with a
minimum of 0% and a maximum of 100%, similar to the primary dependent variable measure.
However, none of the three questions could be reasonably answered based on the information
provided in the case scenario for Task 1 (client Premier Electro Tech). Those questions are: 1.
“What is your estimate of the probability that the controller of Premier Electro Tech will try to
20
Participants who estimated exactly 50% were ignored for purposes of this analysis.

134
overstate collectibles?”; 2. “What is your estimate of the probability that the “new computerized
accounting system” installed by Premier Electro Tech’s customer will work as expected?”; and
3. “What is your estimate of the probability that the PCAOB will issue new guidance related to
audit procedures concerning the collectability of receivables?” The purpose of those questions
was to explore whether the hypothesized MINDSET effects on participants’ probability
judgment carry over to additional probability judgments. Responses from both experiments
suggest that none of the questions prompted statistically significant lower probability
assessments for participants who have adopted an abstract mindset. Given the exploratory nature
of the four additional questions, the further interpretation of those results is left to future inquiry.
Table 17 summarizes the results for Experiment 1 (Panel A) and Experiment 2 (Panel B).

135
Table 17: Additional Questions
Panel A: Experiment 1
Test of Independence between Focus and Perception of Material Misstatementa
Focus Yes No Total
Event Count 23 23 46
Expected Count 26.6 19.4 46
% within Focus 50.0% 50.0% 100%
Complement Count 29 15 44
Expected Count 25.4 18.6 44
% within Focus 65.9% 34.1% 100%
Total Count 52 38 90
Expected Count 52 38 90
% within Focus 40.0% 60.0% 100%
Chi-square (d.f. = 1) 2.333
p-value (two-tailed) .127

136
Effect Size
Probability Question Mindset N Mean S.D. t df pb d r
What is your estimate of the probability that the controller of
Premier Electro Tech will try to overstate collectibles?
Concrete 46 41.11 26.47 2.322 88 .023 .49 .24
Abstract 44 54.45 28.06 What is your estimate of the probability that the “new
computerized accounting system” installed by Premier Electro
Tech’s customer will work as expected?
Concrete 46 56.24 22.19 1.232 88 .221 .26 .13
Abstract 44 61.77 20.32
What is your estimate of the probability that the PCAOB will
issue new guidance related to audit procedures concerning the
collectability of receivables?
Concrete 46 54.26 26.61 .337 88 .737 .07 .04
Abstract 44 56.23 28.73
a Participants responded to the following forced choice item: “Given your knowledge of Premier Electro Tech and the explanation provided by the company's
credit manager do you believe that the accounts receivable balance is materially misstated?” Response options: “Yes”, “No”. b Two-tailed significance level

137
Panel B: Experiment 2
Test of Independence between Focus and Perception of Material Misstatementa
Focus Yes No Total
Event Count 24 35 59
Expected Count 23.5 35.5 59
% within Focus 40.7% 59.3% 100%
Complement Count 23 36 59
Expected Count 23.5 35.5 59
% within Focus 39.0% 61.0% 100%
Total Count 47 71 118
Expected Count 47 71 118
% within Focus 40.0% 60.0% 100%
Chi-square (d.f. = 1) .035
p-value (two-tailed) .851

138
Effect Size
Mindset N Mean S.D. t df pb d r
Probability Questions
What is your estimate of the probability that the controller of
Premier Electro Tech will try to overstate collectibles?
Concrete 58 49.55 23.38 .335 116 .369 .06 .03
Abstract 60 47.97 27.73 What is your estimate of the probability that the “new
computerized accounting system” installed by Premier Electro
Tech’s customer will work as expected?
Concrete 58 55.21 18.39 .758 116 .225 .14 .07
Abstract 60 57.97 21.02
What is your estimate of the probability that the PCAOB will
issue new guidance related to audit procedures concerning the
collectability of receivables?
Concrete 58 55.50 23.43 .060 116 .477 .01 .01
Abstract 60 55.78 27.90
a Participants responded to the following forced choice item: “Given your knowledge of Premier Electro Tech and the explanation provided by the company's
credit manager do you believe that the accounts receivable balance is materially misstated?” Response options: “Yes”, “No”. b Two-tailed significance level

139
Conclusion
This study draws on CLT in order to investigate how the performance of common
auditing tasks that require varying degrees of abstract thinking affect decision-makers’ overall
mindset and hence their subsequent judgment even if the latter is neither related to the same
client nor to the domain of the preceding task. It is predicted that participants who have adopted
an abstract mindset orientation as a result of an unrelated preceding task provide lower
probability estimates concerning the ability of an audit client to collect a customer’s accounts
receivable balance than participants who have adopted a concrete mindset orientation. Given that
CLT also suggests that this result holds regardless of whether the probability assessment is
focused on the collectability of accounts receivable or the uncollectibility of accounts receivable,
it is further predicted that combined probability assessments (i.e., the sum of probability
estimates concerning the collectability and those concerning the uncollectibility of accounts
receivable) are farther from 1 for participants who have adopted an abstract mindset orientation.
Results from two experiments, one using experienced auditors and one using student
participants, are mixed. In Experiment 1, auditors who adopt an abstract mindset orientation as a
result of an unrelated preceding audit task, compared to those who adopt a concrete mindset
orientation, provide lower probability assessments. However, no support is found for the
hypothesized interaction. In Experiment 2, student participants who adopt an abstract mindset
orientation as a result of a construal mindset priming task, compared to those who adopt a
concrete mindset orientation, do not provide lower probability assessments. Moreover, the
hypothesized interaction effect is not supported. Additional analyses suggest that the probability-
related predictions derived from CLT may be limited to situations in which the judgment of

140
concern is relatively familiar to the decision-maker in terms of decision domain and how the
judgment question is posed.
A limitation to the present study is that the nature of the research question necessitated a
between-subjects design and the evaluation of implied probability assessments for approximately
half of the participants. The detected effects reported in the main analysis may thus be artificially
small. Another shortcoming to this study is that the extent to which participants paid attention to
their respective tasks could not be consistently measured. Accordingly, it is possible that the
intended mindset orientation manipulation did not work for some participants. If the number of
participants who did not pay close attention to the mindset manipulation task (i.e., Task 1) varied
by condition, the reported results may have been affected. Lastly, the online administration of the
experimental material did not prevent participants from taking a break between the mindset
manipulation task and the subsequent probability assessment task. As a consequence, the
initiated mindset orientation may have been reversed, depending on the nature of the activity in
which the participant engaged during the interruption.
In spite of those limitations and the mixed results discussed above, the findings from this
research make several important contributions. By demonstrating that the abstractness of a
preceding task can lower customarily encountered probability judgments, the present study
draws attention to potentially biased decision-making among audit professionals. Given the
pervasiveness of likelihood judgments in professional decision-making, the reported results may
be of interest to a broad range of practitioners and academics. Moreover, the study identifies a
potential scope limitation associated with the probability-related predictions derived from CLT.
Construal mindset orientation may only affect subsequent probability assessments when the
judgment of concern is relatively familiar to the decision-maker in terms of how the judgment

141
question is posed. This tentative conclusion may be of interest to psychology researchers and
accounting academics alike.
Through a focus on the effects of task-induced mindset on subsequent decisions in a
multi-task, multi-client environment the study follows Bhattacharjee et al.’s (2007) call for
additional research on situations in which individuals render sequential judgments about diverse
targets. The study’s focus on auditors’ mindset suggests the possibility for future research to
explore similar task-induced mindset implications for professional decision-makers in audit-
relevant contexts. If the robust results documented in the psychology literature translate into the
accounting domain, an abstract mindset may also be prompted by accounting tasks that require
the decision-maker to compare objects with nonalignable rather than alignable features (e.g.,
potential merger targets operating in different industries); to consider the why rather than the how
aspects of a given situation (e.g., questioning the motives for a proposed joint venture rather than
focusing on implementation steps); to adopt another person’s perspective; or to envision making
a decision in the distant future. Accordingly, research could explore whether tasks other than
broad categorization prompts an abstract mindset and hence leads to the probability assessment
patterns found in this study.
Another promising area for future research might be to build directly on CLT research
which investigates the mental associations among various dimensions of psychological distance.
For example, Wakslak (2012), who highlights the importance of understanding the relationship
between hypotheticality and spatial / temporal distance, finds that individuals anticipate that less
[more] likely events happen at remote [proximate] locations and in the distant [near] future.
Accounting researchers could thus explore how tax professionals assess the probability that a
remote versus proximate client will be able to successfully defend a proposed tax position in

142
court; how partners assess the likelihood that a bid for a proximate versus remotely located audit
or consulting client will be accepted; and, in the context of risk management, how risk managers
assess the likelihood that a catastrophic event occurs in the distant versus near future. Exploring
the association between social distance and the aforementioned distance dimensions in various
accounting contexts similarly offers a host of research opportunities.

143
References
Bar-Anan, Y., N. Liberman, and Y. Trope. 2006. The association between psychological distance
and construal level: Evidence from an implicit association test. Journal of Experimental
Psychology: General 135 (4): 609-622.
Bhattacharjee, S., M. J. Maletta, and K. K. Moreno. 2007. The cascading of contrast effects on
auditors’ judgments in multiple client audit environments. The Accounting Review 82 (5):
1097-1117.
Bhattacharjee, S., M. J. Maletta, and K. K. Moreno. 2013. Auditors’ judgment errors when
working on multiple tasks and in multiple client environments: A research summary and
practice implications. Current Issues in Auditing 7 (1): 1-8.
Favere-Marchesi, M. 2013. Effects of decomposition and categorization on fraud-risk
assessments. Auditing: A Journal of Practice & Theory 32 (4): 201-219.
Cohen, J. 1988. Statistical power analysis for the behavioral sciences (2nd
ed.). New Jersey:
Lawrence Erlbaum Associates.
Cohen, J. 1992. A power primer. Psychological Bulletin 112 (1): 155-159.
Freitas, A. L., P. Gollwitzer, and Y. Trope. 2004. The influence of abstract and concrete
mindsets on anticipating and guiding others' self-regulatory efforts. Journal of
Experimental Social Psychology 40 (6): 739-752.
Fujita, K., and H. A. Han. 2009. Moving beyond deliberative control of impulses. The effect of
construal levels on evaluative associations in self-control conflicts. Psychological Science
20 (7): 799-804.
Fujita, K., M. D. Henderson, J. Eng, Y. Trope, and N. Liberman. 2006a. Spatial distance and
mental construal of social events. Psychological Science 17 (4): 278-282.
Fujita, K., Y. Trope, N. Liberman, and M. Levin-Sagi. 2006b. Construal levels and self-control.
Journal of Personality and Social Psychology 90 (3): 351-367.
Glass, G.V., Peckham, P.D., and Sanders, J.R. 1972. Consequences of failure to meet
assumptions underlying the fixed effects analyses of variance and covariance. Review of
Educational Research 42 (3): 237-288.
Grossman, A. M., and R. B. Welker. 2011. Does the arrangement of audit evidence according to
causal connections make auditors more susceptible to memory conjunction errors?
Behavioral Research in Accounting 23 (2): 93-115.

144
Hogarth, R. M., and H. J. Einhorn. 1992. Order effects in belief updating: The belief-adjustment
model. Cognitive Psychology 24 (1): 1-55.
Joyce, E. J., and G. C. Biddle. 1981. Are auditors’ judgments sufficiently regressive? Journal of
Accounting Research 19 (2): 323-349.
Liberman, N., and Y. Trope. 1998. The role of feasibility and desirability considerations in near
and distant future decisions: A test of temporal construal theory. Journal of Personality
and Social Psychology 75 (1): 5-18.
Liberman, N., and Y. Trope. 2008. The psychology of transcending the here and now. Science
322 (5905): 1201-1205.
Liberman, N., M. D. Sagristano, and Y. Trope. 2002. The effect of temporal distance on level of
mental construal. Journal of Experimental Social Psychology 38: 523-534.
Liberman, N., Y. Trope, and E. Stephan. 2007. Psychological distance. In A. W. Kruglanski & E.
T. Higgins (Eds.), Social psychology: Handbook of basic principles (Vol. 2, pp. 353–
383). New York, NY: Guilford Press.
Lindberg, D. L., and M. J. Maletta. 2003. An examination of memory conjunction errors in
multiple client audit environments. Auditing: A Journal of Practice & Theory 22 (1):
127-141.
Malkoc, S. A., G. Zauberman, and J. R. Bettman. 2010. Unstuck from the concrete: Carryover
effects of abstract mindsets in intertemporal preferences. Organizational Behavior and
Human Decision Processes 113 (2): 112-126.
Mandel, D. R. 2005. Are risk assessments of a terrorist attack coherent? Journal of Experimental
Psychology: Applied 11 (4): 277-288.
Morrill, J. B., C. K. J. Morrill, and L. S. Kopp. 2012. Internal control assessment and
interference effects. Behavioral Research in Accounting 24 (1): 73-90.
Navon, D. 1977. Forest before trees: The precedence of global features in visual perception.
Cognitive Psychology 9 (3): 353-383.
O’Donnell, E., and J. J. Schultz, Jr. 2005. The halo effect in business risk audits: Can strategic
risk assessment bias auditor judgment about accounting details? The Accounting Review
80 (3): 921-939.
Public Company Accounting Oversight Board (PCAOB). 2002. Consideration of Fraud in a
Financial Statement Audit.AU Section 316. Washington, D.C. Available at:
http://pcaobus.org/standards/auditing/pages/au316.aspx.

145
Smith, P. K., and Y. Trope. 2006. You focus on the forest when you're in charge of the trees:
Power priming and abstract information processing. Journal of Personality and Social
Psychology 90 (4): 578-596.
Todorov, A., A. Goren, and Y. Trope. 2007. Probability as a psychological distance: Construal
and preferences. Journal of Experimental Social Psychology 43 (3): 473-482.
Trope, Y., and N. Liberman. 2003. Temporal construal. Psychological Review 110 (3): 403-421.
Trope, Y., and N. Liberman. 2010. Construal-level theory of psychological distance.
Psychological Review 117 (2): 440-463.
Trope, Y., N. Liberman, and C. Wakslak. 2007. Construal levels and psychological distance:
Effects on representation, prediction, evaluation, and behavior. Journal of Consumer
Psychology 17 (2): 83-95.
Trotman K. T., and A Wright. 2000. Order effects and recency: where do we go from here?
Accounting and Finance 40 (2): 169-182.
Wakslak, C. J., Y. Trope, N. Liberman, and R. Alony. 2006. Seeing the forest when entry is
unlikely: Probability and the mental representation of events. Journal of Experimental
Psychology: General 135 (4): 641-653.
Wakslak, C., and Y. Trope. 2009. The effect of construal level on subjective probability
estimates. Psychological Science 20 (1): 52-58.
Wilks, T. J., and M. F. Zimbelman. 2004a. Using game theory and strategic reasoning concepts
to prevent and detect fraud. Accounting Horizons 18 (3): 173-184.
Wilks, T. J., and M. F. Zimbelman. 2004b. Decomposition of fraud-risk assessments and
auditors’ sensitivity to fraud cues. Contemporary Accounting Research 21 (3): 719-745.

146
STUDY THREE: THE IMPACT OF SPATIAL DISTANCE AND RISK
CATEGORY ON PROBABILITY ASSESSMENT
There is no commonly accepted definition for the term risk – neither in the sciences nor
in public understanding. All risk concepts have one element in common, however: the
distinction between reality and possibility. If the future were either predetermined or
independent of present human activities, the term ‘risk’ would make no sense.
Ortwin Renn, 1998
Introduction
With his 2007 bestselling book “The Black Swan – The Impact of the Highly
Improbable” statistician and philosopher Nassim Taleb brought wide-spread attention to a risk
category21
that would, within months of the book’s first publication, catapult to the forefront of
economic and financial concerns as a result of an event that profoundly influenced the discourse
on risk management. The event is the global financial crisis and the risk category so superbly
analyzed by Taleb is that of ‘black swan events’. Often referred to as emerging or global risks22
in the practitioner and academic literature (e.g., PricewaterhouseCoopers 2009, 2013a,b; Ballou
et al. 2011; Gates et al. 2012; World Economic Forum 2014), ‘black swans’ are highly
improbable events with massive consequences that are only with hindsight easy to explain
(Taleb, 2007). The ineffective management of such risks which arguably led to the economic
meltdown of 2007-2008 had far-reaching consequences for risk management practice and board-
level risk oversight.
21
The term risk category is used to refer to the broad classes of risks with which an organization may be confronted.
Examples include operational risks, macroeconomic risk, and strategic risks. 22
Those terms are often used more loosely as they may not be limited to extremely low likelihood events.

147
Academic research on enterprise risk management (ERM)23
is published in a variety of
finance, accounting, and practitioner-oriented journals and spans archival methods, field-based
case research, and survey studies. The two main streams of ERM literature are concerned with
ERM performance aspects and ERM implementation differences, respectively.
The ERM performance literature stream finds a number of positive effects from the use
of ERM, particularly for companies with high-quality ERM systems in place. One of the main
dependent variables used by archival studies within this literature stream is firm value measured
by Tobin’s Q (e.g., Hoyt and Liebenberg 2011; McShane et al. 2011; Baxter et al. 2013). Other
evidence for positive ERM effects comes from findings which suggest that ERM improves
corporate governance (Baxter et al. 2013) and accountability (Gates et al. 2012); facilitates risk
communication, management consensus, and decision-making (Gates et al. 2012); and increases
an organization’s ability to adapt to new regulatory requirements (Arnold et al. 2011). From an
extended-enterprise perspective, ERM is credited for reducing B2B risk and associated global
business risk (Arnold et al. 2012); building trust in such relationships (Arnold et al. 2014); and
for improving the chances for entering into successful support service outsourcing agreements
(Raiborn et al. 2009).
The literature stream concerned with ERM implementation differences is mostly
comprised of case studies and focuses on the organizational actors responsible for successful
ERM deployment (e.g., Beasley et al. 2005; Arena et al. 2010); the effect of various
organizational cultures and ERM styles on ERM functionality (e.g., Mikes 2009, 2011); and the
23
This article does not distinguish between ERM and ‘strategic’ ERM. COSO (2004) defines ERM as follows:
Enterprise risk management is a process, effected by an entity’s board of directors, management and other
personnel, applied in strategy setting and across the enterprise, designed to identify potential events that may affect
the entity, and manage risk to be within its risk appetite, to provide reasonable assurance regarding the achievement
of entity objectives. For a definition of ‘strategic’ ERM see Frigo and Anderson (2011).

148
evolvement of ERM over time (e.g., Arena et al. 2010). While several of these studies make
reference to the risk assessment process, they devote little attention to the psychological factors
affecting corporate decision-makers’ assessment of critical risks with respect to the most
prominent criteria used in risk management practice: likelihood of occurrence and organizational
impact (COSO 2004, 2013). To address this shortcoming, the present research strives to open the
‘black box’ representing the probability assessment module within the risk assessment process
described by the Committee of Sponsoring Organizations of the Treadway Commission 2004
Enterprise Risk Management – Integrated Framework (hereafter, COSO 2004).
The purpose of this study is to investigate how spatial distance from a risk assessment
target and the nature of the risk under consideration (i.e., risk category or risk type) affects
decision-makers’ assessment of the likelihood that the risk will materialize. Inspiration for this
research stems both from a COSO-commissioned thought paper targeted at board members and
academic calls for research on risk assessment tools. While the COSO-commissioned research
study by KPMG LLP alerts board members to various judgment traps and biases and thus
highlights the importance of identifying other potential factors that may introduce judgment bias
(KPMG 2012), academic inquiry by Jordan et al. (2013) encourages additional research on risk
management tools such as risk registers. Furthermore and closely related to risk register research
is an earlier call for research by Ballou et al. (2011) who note that it would be informative to
know whether risk category affects how risks are assessed or prioritized. Those authors also
argue that board members would like to receive more information about actual ERM processes -
including procedures related to the estimation of risk probability.
Enhanced understanding of the risk assessment process is critical as recent survey data by
PricewaterhouseCoopers (PwC) suggests that a majority of corporations fail to properly match

149
risk exposure with resources devoted to risk management efforts (PwC 2009). According to the
PwC study, this mismatch is most clearly reflected in under-resourcing of strategic and low-
probability, high-impact emerging risks compared to the more familiar risk categories of
financial, operational, and compliance risks (PwC 2009). Those findings appear startling given
that the increased pressure on boards worldwide to improve their oversight of risk management
practices and the painful experience associated with the financial crisis of 2007-2008 would lead
one to expect that companies have profoundly reallocated risk management resources among
various risk categories.
This study draws on construal level theory (CLT) of psychological distance (Liberman
and Trope 1998; Trope and Liberman 2003; Trope et al. 2007) in order to investigate how spatial
distance from a risk assessment target and risk category influences decision-makers’ assessment
of the probability that the risk will materialize. CLT explains how psychological distance affects
decision-makers’ predictions and evaluations (Trope et al. 2007). According to CLT, both spatial
distance and hypotheticality constitute dimensions of psychological distance; distancing a
situation along either of these dimensions results in higher level construal of the situation (Trope
et al. 2007; Liberman et al. 2007a; Liberman and Trope 2008). Furthermore, CLT posits that
low-probability scenarios - which are psychologically distant on the hypotheticality dimension -
are cognitively associated with remote locations and high-probability scenarios are cognitively
associated with proximate locations (Liberman and Trope 2008; Wakslak 2012). Based on CLT,
it is expected that decision-makers will predict that a low-probability risk will materialize at a

150
distant location (i.e., at a remote risk target) and a high-probability risk will materialize at a
proximate location (i.e. at a proximate risk target).24
To test those predictions an experiment involving 80 first-year M.B.A. students is
conducted. The experiment asks participants to predict whether a highly likely risk or a highly
unlikely risk, depending on experimental condition, is going to materialize at a proximate or
remote location. Contrary to expectations, the results from Experiment 1 do not suggest that
individuals intuitively associate the occurrence of low-probability risks with distant locations and
the occurrence of high-probability risks with proximate locations. While the results from
Experiment 1 fail to support the basic association between probability and spatial distance25
, the
findings are silent with respect to professional decision-makers’ specific probability judgment
concerning various risk factors when spatial distance from the risk assessment target is given. A
second experiment that more directly addresses the research question was conducted.
Given that prior CLT research (see Wakslak and Trope 2009) also shows that prompting
higher-level mental representations or construals (e.g., through distancing a scenario on either
psychological distance dimension) leads individuals to lower their assessment of the scenario’s
probability, it is expected that decision-makers who evaluate a spatially remote risk target will
assess the probability that various risk factors will materialize to be lower than those who
evaluate a spatially proximate risk target. Furthermore, risk factors may themselves be construed
at a higher (i.e., more abstract) or lower (i.e., more concrete) level, based on the manner in which
they are portrayed. According to CLT (e.g., Liberman et al. 2002), narrow, more specific
24
Throughout this text, the term “risk target” is used to refer to any object that is evaluated with respect to the risks
it faces. For example, when considering the risk of fire at a warehouse location, the warehouse would be referred to
as a proximate or remote risk target, depending on spatial distance from the decision-maker. 25
A possible explanation for this unexpected finding is that the requested judgment may have resided outside the
first-year M.B.A. participants’ area of expertise and thus outside their routine cognition.

151
descriptions should lead to lower level construal than broader, less specific descriptions. While
lower level (or concrete) risk descriptions seem to be associated with the risk category
‘operational risks’, higher level (or abstract) risk descriptions appear to be associated with the
risk category ‘non-operational risks’ (that is, strategic or macroeconomic risk factors).
Accordingly, it is predicted that decision-makers attribute a higher occurrence probability to
operational risk factors than to non-operational risk factors. Lastly, an interaction between risk
category and spatial distance of the risk assessment target is expected since Maglio et al. (2013)
suggest that distancing on one dimension (e.g., spatial distance) will lead to decreasing marginal
sensitivity to further distancing on a second dimension (e.g., hypotheticality). Accordingly, the
effect of risk category on construal level should be lower when decision-makers evaluate a
spatially remote target than when they evaluate a spatially proximate target. Thus, decision-
makers should provide lowest probability estimates when assessing a non-operational risk factor
for a spatially remote risk target.
To test those predictions, a 2 × 2 between-subjects experiment involving 161 risk
managers is conducted. The two independent variables are spatial distance (proximate vs.
remote) and risk category (operational risk vs. non-operational risk). The dependent variable is
an average score of the participants’ probability assessment concerning the occurrence of five
critical risk factors (either operational or non-operational, depending on the experimental
condition) identified by a recent survey conducted by Protiviti Inc. and North Carolina State
University’s ERM Initiative (see Protiviti 2014a).
As anticipated, results show that risk managers who evaluate a spatially remote risk target
judge the probability that various risk factors will materialize to be lower than their counterparts
who evaluate a spatially proximate risk target. While no support is found for the prediction that

152
risk managers perceive operational risk factors as more likely to occur than non-operational risk
factors, results confirm the hypothesized interaction between spatial distance and risk category.
Risk managers judge the probability that a risk will materialize to be lowest when assessing a
remote risk target and the risk factor is non-operational. Additional analyses reveal that the
predicted main effect for risk category holds only when strategic risks (i.e., a subcategory of non-
operational risk factors) are considered. Together, the findings offer preliminary evidence that
professional decision-makers’ risk probability judgments are systematically affected by spatial
distance from the risk assessment target and that the interaction between spatial distance effects
and the effects stemming from risk category prompts decision-makers to provide lowest
probability assessments when estimating the likelihood that non-operational risk factors will
materialize at spatially remote locations.
This research addresses the dearth of research exploring the underlying cognitive
processes associated with judgment and decision-making related to risk assessment within an
ERM context. Through a focus on psychological factors affecting the probability assessment step
within the risk assessment process described by COSO 2004, the present study makes several
important contributions. First, this research contributes to the corporate governance literature by
identifying psychological distance as a potential source for judgment bias during the corporate
risk assessment process. As such, this research adds to the list of potential biases identified in a
recent COSO-commissioned research study by KPMG LLP which alerts board members to
various judgment traps such as confirmation bias, framing, and anchoring effects (KPMG 2012).
Second, this research has practical implications that are of interest to corporate staff that
develop risk registers or centralized risk databases and to designers of risk management software
or similar decision aids. By identifying the abstractness associated with various risk categories

153
as a factor that influences probability assessment, the study cautions developers of (or
contributors to) risk registers to consider the psychological distance implications associated with
the description of various risk factors. Accordingly, the present study responds to Jordan et al.’s
(2013) call for research on risk registers and addresses Ballou et al.’s (2011) concern about the
lack of knowledge about the risk category - risk assessment relationship. Lastly, this research
contributes to the psychology literature by addressing calls for research that investigates the
impact of spatial distance on decision-makers’ judgment in a highly applicable, real-world
setting (see Henderson et al. 2011). Such research is important as prior accounting literature
suggests that certain characteristics of the professional decision-making context may warrant
adaptation to otherwise established theoretical models (see Trotman and Wright 2000).
The remainder of this chapter is structured as follows: The next section provides background
information on ERM and reviews the related literature. The third section provides theoretical
foundations and develops the hypotheses. Sections IV and V discuss Experiments 1 and 2, along
with expected results, respectively. The last section draws conclusions, addresses some
limitations, and offers directions for future research.
Background
Ineffective risk management, which arguably led to the economic meltdown of 2007-
2008, had far-reaching consequences for risk management practice and board-level risk
oversight. Recent literature on ERM (e.g., Beasley et al. 2010; Ballou et al. 2011; McShane et al.
2011; Gates et al. 2012; Mikes and Kaplan 2014) points to U.S. Securities and Exchange
Commission (SEC) requirements to describe board of directors’ risk management oversight
involvement, to various stock exchange requirements for risk management governance, and to

154
credit-rating agencies’ decision to include risk management practices into their credit evaluation
process. COSO 1992 Internal Control – Integrated Framework (hereafter: COSO 1992) provides
a solid foundation upon which effective risk management practices can be built. Given that both
the AICPA (AICPA 2006) and the PCAOB (PCAOB 2007) reference this framework as an
adequate tool for management and auditors to discharge their respective responsibilities, it is not
surprising that COSO 1992 quickly gained dominance among internal control frameworks
(Janvrin et al. 2012) with 65% of public companies reporting the adoption of the framework as
of 2010 (Beasley et al. 2010). In May 2013, COSO released an updated framework – 2013
Internal Control – Integrated Framework - which was designed and drafted by PwC under
guidance from the COSO board. Unlike the 1992 framework, the 2013 version presents 17
principles which reflect basic concepts related to the five internal control components (control
environment, risk assessment, control activities, information & communication, and monitoring
activities – that is, the rows of the original 1992 COSO cube). Furthermore, so-called ‘points of
focus’ support each of the 17 principles (77 in total) in order to provide more concrete guidance
to management. Another noteworthy change is that the new framework considers four different
types of reporting: internal financial reporting, internal non-financial reporting, external financial
reporting, and external non-financial reporting. COSO 2013 superseded the 1992 framework on
December 15, 2014 (Protiviti 2014b).
Compared to internal control, ERM is broader in scope and attends more directly to risk.
Accordingly, internal control can be considered an integral part of ERM, which itself is a
component of an organization’s overall governance process (Chambers 2012; Protiviti 2014b).
Arena et al. (2010) explain that ERM aims to connect risk management with corporate strategy
and goal-setting, thereby influencing corporate control, accountability and the decision-making

155
process. Importantly, the conceptualization of ERM incorporates non-quantifiable risks (e.g.,
reputational or environmental risks) which are increasingly considered worthy of monitoring and
risk management efforts. Landmark developments in corporate governance such as the reports
issued by the Treadway Commission (Enterprise Risk Management – Integrated Framework)
(COSO 2004) and the Turnbull Committee (ICAEW 1999) promote ERM as a framework for
identifying critical risks from a perspective that stresses the attainment of a company’s strategic
goals (Mikes 2009).26
With growing interest in corporate governance and board of directors’ heightened
attention to risk management practices, organizational routines are progressively structured
around risk. Risk management practices, which are ever more linked to the domain of
management accounting, include the identification, assessment, treatment, and monitoring of risk
along with gauging the effectiveness of managerial risk-control procedures (Soin and Collier
2013). Another driving force for increased risk awareness and larger scale implementation of
risk-focused organizational practices is the movement toward global government regulation via
risk-based regulation that stresses improved internal control processes (Soin and Collier 2013).
As a result of those developments, the traditional compartmentalization of risk management
(e.g., risk silos concerned with insurance or credit management) and its narrow management by
the accounting and finance functions (e.g., focus on disclosures; use of derivative instruments)
gave way to a more holistic appreciation of risk as evidenced in the move to ERM (Beasley and
Frigo 2007; Frigo and Anderson 2011; Soin and Collier 2013).
26
In contrast to the Turnbull framework which basically equates internal control with risk management, COSO
2004 regards the internal control framework as a component of ERM (Fraser and Henry 2007). For a comparison of
COSO 2004 and ISO 31000:2009 (another highly regarded ERM framework issued by the International
Organization for Standardization) see Frigo and Anderson (2014).

156
Recent academic literature on ERM includes archival studies, field-based case research,
and a variety of survey studies. Archival ERM studies focus predominantly on performance
aspects of ERM systems. Among the first such studies are Gordon et al. (2009) who developed
an index of ERM effectiveness with respect to an entity’s capability to attain its strategic,
operational, reporting, and compliance objectives. The authors identify five contextual factors
(environmental uncertainty, industry competition, firm size, firm complexity, and monitoring of
the firm by its board of directors) that are positively related to the need for an ERM system. The
authors conclude that superior matching between the identified contingency factors and ERM
implementation distinguishes better performing organizations from their worse performing
counterparts. Other studies investigate the relationship between ERM (or its quality) and firm
value. For example, Hoyt and Liebenberg (2011) show that Tobin’s Q is positively related to the
presence of an ERM program. However, those authors do not distinguish between various levels
of ERM quality. This shortcoming is addressed by McShane et al. (2011) who use Standard and
Poor’s (S&P) five ERM rating categories (Standard & Poor’s 2006) as a proxy for ERM quality.
McShane et al. (2011), who do not control for endogeneity, find that ERM rating and firm value
(measured by Tobin’s Q) are only positively related to rating increases spanning the domain of
traditional risk management practices but not over the two top categories representing the -
subjectively defined - realm of ERM. However, Baxter et al. (2013) who overcome the
limitations associated with a lack of control for endogeneity (as in McShane et al. 2011) and
narrow sample selection (as in Hoyt and Liebenberg 2011) report strong benefits associated with
high quality ERM. The authors who also use S&P’s ERM ratings to investigate the relationship
between ERM quality and various firm characteristics and performance measures find that
investing in high quality ERM is rewarded with better accounting returns and market valuation

157
measured by Tobin’s Q. In addition, Baxter et al. (2013) find that larger organizations have
higher quality ERM programs; that riskier organizations have inferior quality ERM programs;
and that higher quality ERM is related with improved corporate governance. Those latter
findings are in line with other studies that explore the benefits associated with ERM
implementation from a perspective that is less focused on financial results and firm value. For
example, Ballou and Heitger (2008) argue that the integration of corporate governance, ERM,
and business reporting is critical for the attainment of strategic objectives and for transparent
communication with various stakeholders on progress in the domain of risk management.
Improved risk-communication as a result of ERM adoption is also documented by Gates et al.
(2012) who further show that ERM promotes management consensus, better decision-making,
and enhanced accountability. Finally, Arnold et al. (2011) suggest that high quality ERM
processes strengthen an organization’s ability to adapt to new regulatory requirements, in part
through the strategic ERM processes’ positive impact on organizational flexibility and IT
compatibility.
A subset of the above discussed literature stream concerned with performance aspects of
ERM explores the importance of ERM in the context of extended enterprise environments. This
literature stream consists mostly of survey studies (e.g., Sutton et al. 2008; Arnold et al. 2010,
2011, and 2012) and addresses concerns raised by Power (2009) who provides a more critical
review of contemporary ERM practice by arguing that insufficient consideration is given to the
interconnectedness of commercial reality (i.e., outsourcing; strategic alliances). Sutton (2006),
who reviews early research on risks associated with interorganizational relationships draws
attention to the limitations of outdated ‘enterprise-centric’ perspectives and calls for the
advancement of enhanced risk assessment models which accommodate an extended-enterprise

158
risk management perspective. A critical first step towards the improvement of risk assessment is
provided by Sutton et al. (2008) who identify 49 critical risk factors for the evaluation of the
effect of B2B e-commerce on an organization’s overall enterprise risk. The identified risk factors
(comprised of technical, application-user, and business risks) were subsequently used in surveys
by Arnold et al. (2010) and Arnold et al. (2011). While Arnold et al. (2010) find that the outcome
of the risk assessment process critically influences global supply chain partners’ commitment
towards the partnership and their willingness to share relevant information, Arnold et al. (2011)
find that B2B e-commerce risk is strongly related to the desirability to obtain B2B e-commerce
assurance over the trading partner. Relatedly and consistent with Power’s (2007) finding that
ERM procedures establish a government-independent global governance structure, Arnold et al.
(2012) find that ERM strength is positively related to supply chain partner absorptive capacity
and negatively related to B2B risk and associated global business risk. Business risk reduction is
also the focus of a multiple case study by Foerstl et al. (2010). In the context of supply-chain
relationships, the authors identify sustainable supplier management competencies as a source of
competitive advantage and point to supplier risk assessment in terms of profit impact and
likelihood of occurrence as a critical step towards an effective risk mitigation response. Lastly,
Raiborn et al. (2009) highlight the importance of including support service outsourcing risk
assessment into an organization’s ERM efforts as an important step toward increasing the
chances of success associated with such interorganizational relationships.
A second major literature stream is concerned with organizational characteristics related
to the degree of ERM adoption and ERM implementation differences among various
organizations. Concerning organizational characteristics, Beasley et al.’s (2005) survey provides
initial evidence that the degree of ERM implementation is heavily influenced by senior executive

159
and board of director leadership with respect to ERM deployment. Other critical factors
identified include entity size, industry, country of domicile, and type of auditor used by the
organization. Intriguing insights into the way ERM is implemented and adopted by various
organizations is offered by a series of case studies. Mikes (2009) provides field-based evidence
that systematic differences exist in ERM practices. Based on her investigation of banking
organizations, she identifies ERM by the numbers and holistic ERM as two distinct styles of
ERM models, each being the result of a different ‘calculative culture’. In a follow-up discussion
of her field research, Mikes (2011) concludes that Power’s (2009) concern with dysfunctional,
all-encompassing risk management may only apply to organizations whose ‘calculative culture’
is reflective of ‘quantitative enthusiasm’ (i.e. allowing metrics to dominate judgment) rather than
of ‘quantitative skepticism’ (i.e., the envisioning of alternative futures) (see also Kaplan et al.
2009). Evidence from a broader selection of organizations who have adopted ERM is provided
by Arena et al. (2010). Through a longitudinal case-study involving multiple companies, Arena
et al. (2010) illustrate the dynamic nature of ERM and conclude that the combined influence of
various risk rationalities, risk experts, and risk technologies not only affect how ERM is initially
implemented, but also how it evolves over time as it confronts pre-existing practices (Arena et al.
2010).
In addition to the above discussed major ERM research streams, a mixture of academic
and professional surveys shed valuable insights into specific ERM practices and top executives’
perceptions associated with those processes. For example, a recent survey by Ballou et al. (2011)
reveals that board members may have insufficient information about actual ERM processes –
including the estimation of risk probability and their potential impact. This seems troublesome
since it has been suggested that the estimation of risk probability and impact constitutes an

160
integral part of strategic ERM (see Arnold et al. 2011; Collier 2009). Moreover, board members
seem to receive risk information that is excessively focused on operational and compliance risks
and insufficiently focused on strategic and emerging risks. Over half of their respondents
indicated that “more information about emerging risks, risk impact, risk response, or risk
likelihood would be very or extremely beneficial” (Ballou et al. 2011; p. 21). The authors
conclude that the low probability of various emerging risks may prevent those risks from gaining
board attention. In support of this argument, PwC’s 2013 Annual Corporate Directors Survey
(PwC 2013b) reports that 57 percent of corporate directors indicated that their board has only a
moderately adequate understanding of emerging risks that may impact their company. Even
more discouraging are results from a COSO-sponsored survey by Beasley et al. (2010) which
indicate that more than 40% of organizations either entirely lack formal procedures for the
identification and monitoring of emerging strategic risks or have only minimal processes in
place. Those findings are particularly worrisome since an earlier study by PwC (PwC 2009) cites
estimates according to which 60% of risks capable of inducing a rapid decline in shareholder
value (defined as a 50% decline within a 12-month period) are strategic in nature.
Overall, the above reported findings strongly suggest that corporate boards may value
additional insights into organizational risk identification practices and factors influencing the
associated assessment of risks in terms of probability of occurrence and estimated impact. To
address some of those concerns, the present study applies insights from recent advancements in
psychology to the domain of probability judgments in ERM environments. As such, this
exploratory study strives to open the ‘black box’ representing the probability assessment

161
component within the risk assessment process outlined by COSO 2004.27
COSO 2004 depicts
risk assessment as a four-step process which links risk identification and risk response (see
Figure 1). Risk identification may be facilitated through the use of risk registers or centralized
risk databases (Fraser and Henry 2007; Mikes 2009; Mikes and Kaplan 2014). Once risks are
identified, their assessment criteria are determined. Impact and likelihood (i.e. the probability
that a certain event will occur) represent conventional assessment criteria within the framework
although additional criteria (e.g., velocity of impact) may also be used. The criteria for impact
evaluation include operational, financial, reputational, regulatory, security, safety, health,
environmental, customer, and employee effects. Concerning the likelihood criteria, assessments
may be communicated through qualitative terms (e.g., frequent, likely, possible, unlikely, rare),
through a probability percentage, or through specification of a frequency (COSO 2004).
Figure 10: Risk Assessment Process
Adopted from COSO, Enterprise Risk Management – Integrated Framework (2004).
The outcome of the assessment of risk factors with respect to those criteria is frequently
depicted on so-called ‘risk maps’ or ‘heat maps’, which according to Jordan et al. (2013),
constitute a particularly popular risk visualization technology espoused by COSO guidelines as a
means for setting risk appetite (see also Mikes 2009; Mikes and Kaplan 2014). An illustrative
risk map is depicted in Figure 11. The following section discusses recent developments in
27
While the present research references COSO 2004, other ERM frameworks prescribe procedures for risk
assessment that are in essence equivalent to those of the COSO 2004 framework (see Ballou and Heitger 2008).

162
psychology theory which provide valuable insights into the above discussed risk assessment
process.
Impact
Negligible
Minor
Moderate
Major
Huge
Very Unlikely
0 to 1%
Unlikely
1 to 5%
Less likely
5 to 25%
Likely
25 to 50%
Very likely
50 to 100%
Likelihood
Figure 11: Illustrative Risk Map
Adopted from Jordan et al. (2013) (actual monthly report).
Theory and Hypotheses
This research draws on CLT (Liberman and Trope 1998; Trope and Liberman 2003;
Trope et al. 2007) in order to investigate how spatial distance from a risk assessment target and
the nature of the risk under consideration (i.e., risk category) affects decision-makers’
assessment of the probability that the risk will materialize. CLT is a theory of how psychological
distance affects individuals’ cognition and behavior (Trope et al. 2007). The theory highlights
the importance of mental construal (i.e., mental representation) for judgment and decision-
making and introduces the level of abstraction as a distinguishing characteristic of mental

163
representation (Fujita and Han 2009). A central insight from CLT is that the level of mental
construal is intimately linked to psychological distance in a bidirectional relationship (Bar-Anan
et al. 2006; Liberman et al. 2007a, 2007b; Trope et al. 2007; Liberman and Trope 2008; Trope
and Liberman 2010): objects or events that are psychologically farther removed from the here
and now (i.e., the egocentric reference point representing zero distance), invoke higher level
construal and higher-level construal prompts thoughts of more distant objects or events
(Liberman et al. 2007a, 2007b; Liberman and Trope 2008; Trope and Liberman 2010). The close
connection between construal level and psychological distance is presumed to be caused by
differential knowledge about proximal and distal entities. That is, the farther an entity is removed
from the here and now, the less reliable information is typically available, causing individuals to
form more abstract (schematic) mental representations of the entity. CLT research finds that an
overgeneralization of the aforementioned association causes construal level to be affected by
psychological distance even in the presence of equivalent information about near and distant
situations (Trope and Liberman 2003; Liberman et al. 2007a, 2007b; Trope et al. 2007).
Liberman and Trope’s (1998) seminal article explains that high-level construals of an
event or situation are relatively abstract and stress superordinate, decontextualized, and global
features that are rather invariant. Low-level construals, on the other hand, are more concrete, and
highlight contextualized and subordinate aspects. This distinction between abstract and concrete
construals is critical as CLT further proposes that construal level systematically affects
prediction, evaluation, and behavior (Trope et al. 2007; Liberman et al. 2007a; Liberman and
Trope 2008).
Trope and Liberman (2010, p. 442) explain psychological distance as referring “to the
perception of when an event occurs, where it occurs, to whom it occurs, and whether it occurs”.

164
Accordingly, psychological distance as conceptualized by CLT includes temporal distance,
spatial distance, social distance, and hypotheticality (Trope et al. 2007; Liberman et al. 2007a;
Liberman and Trope 2008; Trope and Liberman 2010). With respect to the fourth dimension of
psychological distance, Wakslak (2012) explains that hypotheticality is intimately related to the
concept of likelihood (i.e. probability) as the latter represents a continuum which joins certainty
and hypotheticality. That is, the higher an event’s probability is, the more it belongs to the realm
of certainty and the more proximate it appears (Wakslak 2012). Hypotheticality and spatial
distance are the two dimensions of psychological distance that are of particular relevance to the
present study.
One of the first studies to investigate the effects of spatial distance is Fujita et al. (2006a)
who explore how the interpretation of a social event varies depending on whether the event is
thought to happen at a spatially proximate or remote location. The authors hypothesize and find
that describing a social event as occurring at a remote location will cause individuals to construe
the event in more abstract terms. Participants indicated a preference for identification of behavior
as ends when they thought of the behavior as occurring at a distant location and as means to an
end when they thought of the behavior as occurring at a nearby location. Furthermore,
participants described purportedly distant [proximate] actions in more abstract [concrete] terms.
In a follow-up study within the context of social events, Henderson et al. (2006) theorize and
find that raising the reported spatial distance of an event elevates the effect of high-level features
(e.g., global trends; personality traits) and lowers the effect of low-level features (e.g., unusual
results; context-specific task characteristics) on social judgments, evaluations, and preferences.
Results from four experiments indicate that participants categorized continuous actions into
fewer, more encompassing segments and that they were more likely to ascribe behavior to

165
dispositional characteristics of the actor (greater correspondence bias) when evaluating spatially
remote rather than proximate behavior. In addition, prototypical [atypical] events were more
[less] probable for spatially more remote locations. Participants also displayed less inclination to
extrapolate from outlier data when rendering forecasts about spatially remote events.
Two unrelated studies identify beneficial behavioral effects associated with increased
spatial distance. Jia et al. (2009) propose that a simple cue such as the origin of an assignment
can prompt higher-level construal and thereby more abstract cognition which leads to more
creative problem solving. Results from two experiments show that subjects (a) offered more
creative answers when they were informed that the creativity task was developed at a remote
location compared to a more proximate location, and (b) demonstrated superior performance on
problem solving assignments that called for creative insights. Henderson (2011) investigates
whether increased spatial distance between negotiators promotes more integrative negotiation
outcomes (i.e. logrolling agreements). The author proposes that greater spatial distance should
lead negotiators to construe their actions in terms of higher-level motivations, thus facilitating
the maintenance of proper priorities and ultimately the achievement of mutually beneficial
outcomes due to more adequate tradeoffs across high and low-importance issues. Two
experiments in which negotiators believed to be either spatially close or spatially distant from
their negotiation partner confirm that greater perceived spatial distance leads to more Pareto-
efficient outcomes.
This research as well as two recent literature reviews concerned exclusively with the
spatial distance dimension of psychological distance underscore the profound impact of spatial
distance on construal, prediction, judgment, and behavior (see Henderson and Wakslak 2010 and
Henderson et al. 2011). Not surprisingly, Henderson and Wakslak (2010) conclude that spatial

166
distance may affect representation, judgment, and behavior to an even larger degree than other
manifestations of psychological distance.
Research on the hypotheticality dimension of psychological distance has recently drawn
increased attention among CLT scholars. Wakslak et al. (2006), for example, show how a focus
on either low- or high probability events affects individuals’ behavior and preferences. More
specifically, the authors propose an inverse relationship between probability and construal level,
arguing that events which may have happened or those which are merely plausible are perceived
as more distant from one’s direct experience (i.e., the egocentric reference point) than events that
actually happened or those that are sure to happen. The authors further argue that this association
holds even in situations in which individuals have equal knowledge about low-probability and
high-probability events. Based on this reasoning, low-probability events should draw attention to
the events’ abstract, superordinate, global aspects (high-level construal) while high-probability
events should prompt individuals to focus on the detail-level, specific, and subordinate aspects
(low-level construal) of the event (Wakslak et al. 2006). Results from six experiments show that
participants who are urged to think about an event as unlikely to occur (compared to participants
who are prompted to think about an event as likely to occur) opt for broader, more inclusive
object categorizations; indicate greater preference for broad rather than specific description of an
activity; segment action into fewer parts; are more effective in a task requiring the abstraction of
visual information; and are less successful in a task requiring the detection of details missing
from coherent pictures. Results from a seventh study indicate that participants who are
semantically primed with low probability phrases (compared to participants who are
semantically primed with high probability phrases) prefer to categorize behaviors in ends-related
terms rather than in means-related terms, thus indicating a more abstract processing orientation

167
during the action identification task (Wakslak et al. 2006). The impact of probability on
preferences via level of construal is also investigated by Todorov et al. (2007) who find that
desirability concerns are more influential than feasibility concerns when the probability of an
outcome is low and that this preference may reverse as outcome probability rises. The authors
explain their findings with reference to the CLT prediction that the importance of means-related
aspects (i.e., low-level features) relative to the importance of ends-related aspects (i.e., high-level
features) escalates as probability rises and on Sagristano et al.’s (2002) finding that desirability
and feasibility concerns are asymmetrically weighted in judgments (Todorov et al. 2007).
Together, Wakslak et al.’s (2006) and Todorov et al.’s (2007) results provide converging
evidence for the hypothesized inverse relationship between probability and construal level from a
directional perspective that emphasizes how probability affects preferences (and behavior) via
impact of construal level.
Investigating the opposite direction of causality, Wakslak and Trope (2009), propose that
general mindset orientation (that is, the degree of abstract thinking as affected by construal level)
influences probability judgments. More specifically, the authors propose that prompting high-
level construal will lead individuals to focus on the improbability of a given event, thereby
lowering their assessment of the event’s probability. This reasoning parallels Liberman and
Trope (2008) who contend that “…activating high-level construals should lead people to think of
events in psychologically more distant situations” (p. 1204). Results from five studies which
employed a series of diverse and even task-unrelated mindset manipulations confirm the
hypothesized relationship.
Of particular importance to the present inquiry is a study by Wakslak (2012) which
examines the relationship between probability and two other dimensions of psychological

168
distance - spatial distance and temporal distance. The author posits that individuals relate
probability to the aforementioned distance dimensions and consequently anticipate that less
[more] likely events happen at remote [proximate] locations and in the distant [near] future. This
reasoning is in line with Liberman and Trope (2008) who argue that “remote locations should
bring to mind the distant rather than the near future, other people rather than oneself, and
unlikely rather than likely events” (p. 1202). Wakslak’s (2012) argumentation also builds on the
results from Wakslak et al. (2006), Wakslak and Trope (2009), and Todorov et al. (2007) as
those studies find evidence of an inverse relationship between probability and level of construal
which, in turn, is affected by distancing on either of the psychological distance dimensions.
Results from Wakslak’s (2012) three studies confirm her predictions and demonstrate that the
hypothesized relationship holds irrespective of whether the low probability outcome is
representative of a neutral, positive, or negative situation.
Together, the above discussed CLT literature suggests that both spatial distance and
hypotheticality are dimensions of psychological distance with the consequence that distancing a
situation along either of those dimensions not only prompts a higher level construal of the
situation (i.e., more abstract processing), but also affects its evaluation (Trope et al. 2007;
Liberman et al. 2007a; Liberman and Trope 2008). Given that low-probability events are farther
removed from certainty than high-probability events, the former represent more hypothetical
situations and are thus more distanced on the hypotheticality dimension of psychological
distance (Wakslak et al. 2006; Wakslak 2012). Accordingly, proper matching of distance
dimensions suggests an inverse relationship between probability and spatial distance such that
low-probability situations are perceived to be associated with distant locations and high-
probability situations are perceived to be associated with proximate locations (Liberman and

169
Trope 2008; Wakslak 2012).28
Consequently, it is predicted that decision-makers will predict that
a low-probability risk will materialize at a distant location and a high-probability risk will
materialize at a proximate location. Formally stated:
H1a: Decision-makers will predict that a low-probability risk will materialize at a remote
rather than a proximate location.
H1b: Decision-makers will predict that a high-probability risk will materialize at a
proximate rather than a remote location.
Furthermore, given that spatially more distant events are construed at a higher level
(Liberman et al. 2007a , 2007b; Liberman and Trope 2008; Trope and Liberman 2010) and that
prompting higher-level construal leads individuals to lower their assessment of the event’s
probability (Wakslak and Trope 2009), it is predicted that decision-makers who evaluate a
spatially remote risk target should assess the probability that various risk factors will materialize
to be lower than decision-makers who evaluate a spatially proximate risk target.
H1c: Decision-makers who evaluate a spatially remote target will assign a lower
probability to the occurrence of various risk factors than decision-makers who evaluate a
spatially proximate target.
Given that risks represent hypothetical events which may themselves be construed more
or less abstractly prompts two related questions: First, does the construal of risks affect their
subjective probability assessment? Second, how does the construal of risks interact with other
distance dimensions – in this case spatial distance from the risk assessment target? Liberman et
al. (2007a) who suggest that individuals infer realism from construal level offer a response to the
28
See Bar-Anan et al. 2006 for a discussion of the association among distance dimensions and Zhao and Xie 2011
for a discussion of the ‘fit’ among various distance dimensions.

170
first question by stating that “A low-level construal of hypothetical events, more than a high-
level construal, makes them seem more likely to become real, or, in other words, makes them
seem more probable” (p. 361). In the context of risk management, risk factors that are construed
at a lower level may thus appear more proximate (i.e., real) and accordingly be attributed a
higher level of probability of occurrence. Accordingly, risks that are described with greater
specificity (e.g., succession challenges) should be construed at a lower level than those described
in more vague terms (e.g., an unexpected crisis). This line of argumentation is closely related to
the concept of categorization. Liberman et al. (2002) explain that “abstract categories (e.g., food)
are more inclusive than concrete, subordinate categories (e.g., snacks)” (p. 525) and show that
participants categorize objects into more abstract categories when those objects related to distant
future situations. Similar results are reported by Fujita et al. (2006a) in the context of spatial
distance (preference for abstraction with respect to action taking place at a distance) and by
Smith and Trope (2006) in the context of social distance (power-primed individuals construed
information more abstractly). Given the similarity among distance dimensions with respect to
prediction, evaluation, and behavior (Liberman et al. 2007a; Trope et al. 2007; Liberman and
Trope 2008; Trope and Liberman 2010) and the bidirectional relationship between psychological
distance and level of construal, thinking about abstract categories should facilitate attribution of
those categories to events of lower probability (i.e., events that are distant on the hypotheticality
dimension). In the context of risk assessment, risks may be described with reference to broader
risk categories such as adverse economic conditions or more narrow risk categories such as cyber
threats.
Lastly, with respect to references to out-groups vs. in-groups (i.e., social distance),
Liberman et al. (2007a) suggest that the former are construed more abstractly due to the fact that

171
individuals usually have less direct experience with them. Thus, in the context of risk
assessment, risk factors which indicate lower social distance (e.g., risks associated with key
suppliers) between the source of the risk and the risk target should prompt lower level construal
than risk factors which indicate higher social distance (e.g., entrance of new competitors).
Risk factors in the domain of operational risks fit the characteristics of risk factors that
are construed at a lower level (more specific; socially closer; narrower category) to a greater
extent than non-operational (e.g., macroeconomic or strategic) risk factors. In other words, the
category of non-operational risk factors contains (in general) more abstract risk descriptions than
the category of operational risk factors. This reasoning is also in line with Cantor and Macdonald
(2009) who suggest that the attributes of abstract construal include strategic concerns whereas
those of concrete construal include operational concerns. Accordingly, based on CLT, decision-
makers should attribute a higher occurrence probability to operational risk factors than to non-
operational risk factors. Formally stated:
H2: Decision-makers will perceive operational risk factors as more likely to materialize
than non-operational risk factors.
Given the core CLT proposition that construal level and psychological distance are
closely associated in a bidirectional relationship (Bar-Anan et al. 2006; Liberman et al. 2007a,
2007b; Trope et al. 2007; Liberman and Trope 2008; Trope and Liberman 2010), the effects
predicted in H1c and H2 are hypothesized to interact. The most systematic investigation of the
combined effects of various distances on overall psychological distance is provided by Maglio et
al. (2013). The scholars combine insights from studies of subadditivity (e.g., findings that the
subjective effect of a given time span fluctuates with temporal distance) and interchangeability
among distance dimensions and propose that distancing on one dimension will lead to decreasing

172
marginal sensitivity to further distancing on a second dimension. A series of studies in which the
authors use each distance dimension at least once as the initial and once as the second
instantiation of distance provides converging evidence that cross-dimensional distancing leads to
effects comparable to those attributed to within-dimension distancing. Maglio et al. (2013)
therefore conclude that the psychophysical Weber-Fechner law holds for cross-dimensional
distancing as evidenced by the fact that experiencing any form of distance lowers sensitivity to
distance on a second dimension. In the context of the present study, Maglio et al.’s (2013) result
imply that decision-makers who are tasked with evaluating risk factors pertaining to a remote
target (i.e., the first instantiation of psychological distance) will be less sensitive to further
distancing on any other dimension. This suggests that the effect of risk category on construal
level (which is directly associated with psychological distance in a bidirectional relationship) is
lower when decision-makers evaluate a spatially distant target than when they evaluate a
spatially proximate target. Differently stated, the difference between probability estimates for a
spatially proximate vs. remote risk target should be larger for operational risk factors than for
non-operational risk factors (i.e., the gap in probability estimates should narrow when non-
operational risk factors are considered). The predicted ordinal interaction thus implies that
decision-makers should provide lowest probability estimates when assessing a non-operational
risk factor for a spatially remote risk target. Formally stated:
H3: Decision-makers will assess the probability that a risk will materialize to be lowest
when assessing a remote risk target and the risk factor is non-operational.
The expected results are depicted in Figure 12. The following sections describe the research
method used to test the hypotheses. H1a and H1b are tested in Experiment 1. H1c through H3 are
tested in Experiment 2.

173
Figure 12: Expected Results - Experiment 2
Experiment 1
Experiment 1 is designed to provide preliminary evidence that the assessment of
probability is associated with spatial distance information (see also Wakslak 2012 – Study 1). As
such, Experiment 1 tests hypotheses H1a and H1b which state that decision-makers will predict
that a low-probability risk will materialize at a distant location and a high-probability risk will
materialize at a proximate location, respectively. The experimental material for Experiment 1
contains a case scenario followed by a forced-choice dependent variable measure, manipulation
check questions, a debriefing question, and a biographic questionnaire. Appendix C illustrates
the experimental material.
Operational Risk Non-operational Risk
Lik
elih
ood
of
Occ
urr
ence
Proximate Target
Remote Target

174
Participants
Eighty first-year M.B.A. students participated in the experiment. The controlled
experiment was conducted in paper-and-pencil form during regular class time. Experimental
instruments were randomized and distributed by the researcher in the presence of the instructor.
Students received five extra credit points toward their first mid-term examination as
compensation for their voluntary participation. Participants’ mean age was 31.1 years and mean
years of work experience was 9.9 years. The sample consists of 46 male (57.5%) and 34 female
(42.5%) participants. With respect to the M.B.A. students’ intention to work in accounting,
finance, or risk management upon graduation, 37 participants (46.3%) answered “Yes”, 34
(42.4%) answered “No”, and the remaining 9 participants (11.3%) answered “Don’t know”.
There are no significant differences with respect to any of the demographic measures (age,
gender; work experience; years lived in Orlando; and intention to work in accounting, finance or
risk management upon graduation) across experimental conditions, (all p-values > 0.26).
Demographic information is presented in Table 18.

175
Table 18: Demographics - Experiment 1
(N = 80)
Age
Mean 31.1
Median 28.5
Minimum 22.0
Maximum 68.0
Standard Deviation 7.7
Years of work experience
Mean 9.9
Median 8.0
Minimum 0.0
Maximum 40.0
Standard Deviation 7.6
Years lived in Orlandoa
Mean 15.0
Median 12.0
Minimum 1.0
Maximum 57.0
Standard Deviation 11.2
Number Percent
Gender
Male 46 57.5%
Female 34 42.5%
Intention to work in accounting, finance,
or risk management upon graduation
Yes 37 46.3%
No 34 42.4%
Don’t know 9 11.3%
a One participant failed to provide the requested information. Data is thus based on n = 79

176
Experimental Procedures
The experiment presents participants with a scenario describing a hypothetical company
(ABC Company; ABC) located in Orlando, FL. The company has recently established two
additional subsidiaries, one located Lake Mary, FL and one in Minneapolis, MN.
Both
subsidiaries specialize in different, but equally profitable product lines. Participants are asked to
assume the role of a team leader in charge of risk management for ABC. The risk management
team is in the early stages of developing a formal risk management process for ABC’s
subsidiaries and, as part of this process, needs to consider the occurrence of various critical risks.
Participants are informed that their team ranks risk factors into five categories based on the
likelihood of occurrence and are presented with a corresponding scale adopted from a COSO-
commissioned risk assessment practice guide developed by Deloitte & Touche LLP (Deloitte
2012). Next, participants are informed that “one of the risks under consideration is the risk that a
massive cyber-attack leads to a prolonged interruption of a subsidiary’s order processing
capabilities” and that “another risk under consideration is the risk that a key supplier will be
unable to meet a subsidiary’s demand for supplies for a prolonged period of time.” Participants
are further informed that (a) “based on [their] teams’ analysis, the probability that such a cyber-
attack will target either subsidiary at some point during their respective project-lifetime is less
than 5%” and that their team has classified this risk as “rare” based on the aforementioned
categorization frame; and (b) that “based on [their] teams’ analysis, the probability that key
supplier problems will occur and affect the product line of either subsidiary at some point during
their respective project-lifetime is at least 90%” and that their team has classified this risk as
“almost certain” based on the aforementioned categorization frame. The case material further

177
informs participants that the impact of either risk is equally severe, regardless of whether the risk
materializes at the Lake Mary-based subsidiary or at the Minneapolis-based subsidiary.
Next, participants read the following passage based on Wakslak (2012): “You may feel
that you do not have sufficient information to adequately respond to the following question. If
this happens, do not worry - the study is concerned with your intuitive judgment”. Participants
are then instructed to “Assume [that] the highly likely risk (at least 90% chance of occurrence)
WILL EVENTUALLY materialize” (Condition 1) or to “Assume [that] the highly unlikely risk
(less than 5% chance of occurrence) WILL EVENTUALLY materialize” (Condition 2).
Following those instructions, participants in Condition 1 (Likely Risk Condition) respond to the
forced-choice question “Where do you think the highly likely risk (at least 90% chance of
occurrence) will materialize?” whereas participants in Condition 2 (Unlikely Risk Condition)
respond to the forced-choice question “Where do you think the highly unlikely risk (less than 5%
chance of occurrence will materialize?” The probabilities associated with each risk factor (i.e.,
5% vs. 90%) and their associated classification (e.g., ‘rare’ vs. ‘almost certain’) was
counterbalanced among participants.
Manipulation Checks
After completing the task, participants responded to three manipulation check questions.
Given the nature of the task and the research question, it is crucial that participants pay sufficient
attention to the spatial distance and risk impact components of the experimental material.
Accordingly, the following true/false questions were posed: (1) “The scenario you just read
described that you and your risk management team are located in Orlando, FL”; (2) “The
preceding scenario explained that the impact of a cyber-attack would be equally severe

178
regardless of which subsidiary would be affected by a cyber-attack”; and (3) “The preceding
scenario explained that the impact of a key supplier problem would be equally severe regardless
of which subsidiary would be affected by a key supplier problem”. Sixty-seven participants
(84%) responded correctly to all three manipulation check questions while thirteen participants
(16%) failed either one or two manipulation check manipulation check questions.29
Eliminating
participants who failed one or two manipulation check questions does not lead to a qualitative
change of the results. Hence, the results reported below are based on the full sample.
Debriefing Questions
A debriefing question asked participants to rate their prior experience with risk
management practices. The five answer choices are “Highly experienced (participated in many
risk management projects)”, “Experienced” (participated in several risk management projects)”,
“Knowledgeable (participated in at least one risk management project)”, “Indirect experience
only (e.g., read about risk management practices; worked on a student project related to risk
management)”, and “No experience”. Overall, participants indicated that they had only indirect
experience with risk management practices (mean = 2.15, s.d. = 1.15).30
Experience with risk
management practices did not vary between conditions (p-value = .440).
Results
A chi-square test for independence of classification was used to determine whether a
relationship between spatial distance of the risk assessment target and the occurrence of a low-
likelihood and high-likelihood risk exists. Contrary to expectations, no significant relationship
29
Only two participants failed two manipulation check questions. 30
The mean is significantly lower than the midpoint of the scale (t79 = 6.62, two-tailed p-value < .001)

179
between the two variables of interest was detected (Χ2 = .208, two-tailed p-value = .648). H1a
and H1b are therefore not supported. Participants did not seem to associate the occurrence of a
highly unlikely risk with a remote location and the occurrence of a highly likely risk with a
proximate location. A potential explanation for this phenomenon may be that participants did not
provide intuitive judgments even though the instructions to the experimental material called for
intuitive decision-making. It is possible that in a professional decision-making context the
predictions derived from CLT hold only in situations in which the judgment of interest falls
within individuals’ professional problem domain, that is, within the decision-maker’s routine
cognition. The requested judgment may have resided outside the first-year M.B.A. participants’
area of expertise and thus outside their routine cognition. The potential lack of fit between
participants’ expertise and the intuitive judgment task may thus constitute a limitation of the
present study which could be addressed in future research. Table 19 illustrates the results.

180
Table 19: Results - Experiment 1
Test of Independence between Probability and Distance
Locationa
Probability Proximate Remote Total
Low (“rare”) Count 15 25 40
Expected Count 16 24 40
% within Location 37.5% 62.5% 100%
High (“almost certain”) Count 17 23 40
Expected Count 16 24 40
% within Location 42.5% 57.5% 100%
Total Count 32 48 80
Expected Count 32 48 80
% within Location 40.0% 60.0% 100%
Chi-square (d.f. = 1) .208
p-value .648
a Given the participants’ location, “proximate” refers to Lake Mary, FL and “remote” refers to Minneapolis, MN.
Experiment 2
Experiment 2 constitutes the main analysis by testing hypotheses H1c, H2, and H3. H1c
predicts that decision-makers who evaluate a spatially remote risk target will assess the
probability that various risk factors will materialize to be lower than decision-makers who
evaluate a spatially proximate risk target. H2 predicts that decision-makers will perceive
operational risk factors as more likely to materialize than non-operational risk factors. Lastly, H3
predicts that decision-makers provide the lowest probability assessments when estimating the
likelihood that non-operational risk factors will materialize at spatially remote locations.

181
To test H1c through H3, a web-based process (Qualtrics) was used to administer a 2 x 2
between-subjects experiment and to assign participants to the four experimental conditions on a
random basis. The experimental design fully crosses spatial distance (DISTANCE) and risk
category (CATEGORY) between subjects. The experimental material contains initial screening
questions, a case scenario followed by dependent variable measures, debriefing and manipulation
check questions, and a set of demographic items. Participants who failed a manipulation check
question (discussed below) were exited from the survey in order to ensure that only responses
from individuals who paid sufficient attention to the experimental material are used for the
analyses. Participants took an average of 9.1 minutes (s.d. = 24.75) to complete the experiment
(no difference across conditions: p-value = .283). Appendix D illustrates the experimental
material.
Participants
A survey company was hired to solicit participants for the experiment.31
Only
participants who responded “Yes” to the following three screening questions were permitted to
proceed: (1) “Are you currently working for a company located within a 160 mile radius of
Chicago, IL?”; (2) “Are you currently employed in a position that requires you to render
decisions associated with organizational risk management?”; and (3) “Do you have at least 2
years’ experience with rendering corporate risk management decisions?” Given the critical role
of spatial distance, it was important to identify participants who were able to internalize location-
specific assumptions provided in the case scenario. As the case scenario calls for participants to
assume that they work for a company based out of Chicago, IL, the survey company was
31
Participants recruited from the survey company were compensated for their participation. The amount of
compensation is unknown to the researcher.

182
instructed to identify participants who lived within a 160 mile radius of Chicago, IL. The
decision to use a 160 mile radius was based on the survey company’s ability to locate a sufficient
number of qualified individuals.32
The researcher instructed the survey company to identify
participants who are “primarily responsible for managing / evaluating non-financial risks – that
is, risks associated with operations, supply-chain management, and strategic risks.” For further
clarification, a list of potential job titles that ordinarily identify such individuals was provided to
the survey company.33
As no single job description captures a significant portion of the identified
participants, the term risk manager is used to refer to the participants in Experiment 2.
A total of 161 risk managers completed the experimental material. Participants’ mean
age was 35.9 years and reported mean years of risk management experience and overall work
experience was 7.1 and 13.2 years, respectively. The sample consists of 84 male (52.2%) and 77
female (47.8%) participants. Most participants (85.1%) indicated that they hold a manager or
higher-level position within their firm. Moreover, a large portion of participants (78.9%)
indicated that they hold one or more professional licenses. With respect to education, 79
participants (49.1%) declared a Bachelor’s degree as the highest level of education attained, 58
participants (36.0%) a Master’s degree, 15 participants (9.3%) a doctorate degree, and 9
participants (5.6%) indicated “Other”. No significant differences with respect to demographic
measures age, years of risk management experience, years of overall work experience, gender,
position, and education exist across experimental conditions (all p-values > 0.47). A statistically
32
Participants provided their ZIP code so that the distance between the participant’s location and downtown
Chicago, IL could be estimated. The average distance based on ZIP code was 25.30 miles (s.d. = 28.28). There was
no significant difference in miles across conditions (p-value = .895). 33
For example, Chief Risk Officer, Vice President – Risk Management, Supply Chain Risk Manager / Director,
Business Continuity Manager, Director – (Enterprise) Risk Management, Enterprise Risk Management Analyst /
Specialist, Risk Management Specialist, Associate / Manager / Senior Manager – Risk Management, Corporate
Risk Analyst (non-financial).

183
significant difference between conditions exists only with respect to the number of participants
who indicated that they hold no professional license (p-value = .014).34
However, regression
results discussed in section “Results” indicate that participant responses related to professional
licenses should not be included in the analyses. Table 20 presents the demographic information.
Table 20: Demographics - Experiment 2
(N = 161)
Age
Mean 35.9
Median 35.0
Minimum 20
Maximum 60
Standard Deviation 8.6
Years of experience Risk
management
Overall work
experience
Mean 7.1 13.2
Median 6.0 10.0
Minimuma 1.0 1.0
Maximum 25.0 41.0
Standard Deviation 4.6 8.0
Number Percent
Gender
Male 84 52.2%
Female 77 47.8%
Position
Staff 9 5.6%
Supervisor 15 9.3%
Manager 62 38.5%
Director 49 30.4%
Partner 12 7.5%
C-level Executive 14 8.7%
34
No statistically significant difference exists among conditions with respect to any other professional licenses (all
p-values > .15).

184
Number Percent
Highest academic degree
Bachelor’s 79 49.1%
Master’s 58 36.0%
Ph.D. 15 9.3%
Other 9 5.6%
Professional licensesb
CPA (Certified Public Accountant) 42 26.1%
CIA (Certified Internal Auditor) 28 17.4%
CMA (Certified Management Accountant) 27 16.8%
CRISC (Certified in Risk and Information Systems Control) 37 23.0%
CRMA (Certification in Risk Management Assurance) 29 18.0%
FRM (Financial Risk Manager) 28 17.4%
PRM (Professional Risk Manager) 25 15.5%
None 34 21.1%
Other 9 5.6%
a Three participants indicated only 1 year of risk management experience even though the qualification criteria
specified a minimum of two years’ risk management experience. Eliminating those participants from the analyses
does not alter the overall reported results.
b Several participants indicated that they hold more than one professional license. Totals do therefore not add up to
N=161 and 100%, respectively.
Experimental Task
Experiment 2 presents participants with a scenario describing a hypothetical company
(ABC Company; ABC) located in Chicago, IL that has recently established a subsidiary called
RoboSurge. According to the case material RoboSurge currently sells customized robotic surgery
tools “to most of ABC’s established markets with about 40 percent of sales going to the
emerging markets of India, Eastern Europe, and Brazil… [and] sources key supplies from China
and Western Europe”. According to the case scenario, the risk management team is in the early
stages of developing a formal risk management process for RoboSurge and has to consider the

185
occurrence of various risks that, if they occur, may have a significant negative impact on the
success of the subsidiary. Participants are asked to assume the role of a risk management team
leader charged with assessing a list of critical risk factors with respect to each risk’s likelihood of
occurrence. Specifically, with respect to each described risk, participants are asked to offer a
judgment about the likelihood that “…this risk will occur at some point over the next 10 years”.
The impact of the risk factors is held constant across manipulations by telling participants to
“assume [that their] team has determined that each of those risks could potentially
force…RoboSurge out of business”.
The experimental task is considered realistic given that prior research (e.g., Arena et al.
2010; Mikes and Kaplan 2014) suggests that the risk management function may be centralized
and that accordingly decision-makers not only render judgments about spatially proximate
targets (e.g., corporate headquarters or a nearby branch office), but also about spatially remote
targets (e.g., offshore manufacturing facilities or remote distribution centers). Furthermore, the
use of risk registers or centralized risk databases seems to be common practice (O’Donnell 2005;
Fraser and Henry 2007; Mikes 2009; Mikes and Kaplan 2014). Appendix D illustrates the
experimental material.
Independent and Dependent Variables
Spatial distance [DISTANCE] is manipulated by describing within the setting of the case
scenario that RoboSurge is located in Toronto, Canada (proximate condition) or in Melbourne,
Australia (remote condition). The independent variable risk category [CATEGORY] is
manipulated by providing participants either a list of five operational risk factors or a list of five
non-operational risk factors. All risk factors are adopted from a recent study by North Carolina

186
State University’s ERM Initiative and Protiviti, Inc. that investigated senior executives’
perspective with respect to 22 top risks grouped into three major categories: macroeconomic
risks, strategic risks, and operational risks (Protiviti 2014a). In selecting the risk factors, care was
taken to ensure that both risk categories (operational and non-operational) contain risks of
comparable impact. This was accomplished by using the report’s color-coding scheme for impact
which is based on the responses from over 370 board members and executives who participated
in the survey.
With the exception of replacing various pronouns with the company name (“RoboSurge”)
the risk factors used for the experiment were taken verbatim from the aforementioned study. No
distinction was made between macroeconomic risks and strategic risk for purposes of conducting
the main analyses; that is, the five non-operational risk factors include two risks identified by the
survey as macroeconomic risk factors and three risks identified as strategic risk factors.35
Given
the exploratory nature of this study and the fact that risk description abstractness is argued to
affect probability assessment, a more refined breakdown of risk categories was not deemed
critical. Furthermore, both the academic and the practitioner literature on risk management use
multiple risk taxonomies that cannot unambiguously be reconciled with one another. For
example, Kaplan and Mikes (2012) categorize disruptive technologies as an external risk (rather
than a preventable or strategy risk) and thus as belonging into a risk category that also includes
natural disasters and geopolitical risks. However, Protiviti (2014a) classifies disruptive
35
Some authors (e.g., Kaplan and Mikes 2012) argue that assigning probabilities to external risks is not very
practical. However, others take the position that the probability of almost any risk factor should be considered. For
example, the COSO-commissioned risk assessment practice guide (Deloitte 2012) provides an illustrative heat map
which displays likelihood assessment scores for risks such as ‘exchange rate fluctuations’, and ‘economic
downturn’.

187
technological innovations as a strategic risk. As alluded to by the opening quote to this study, no
single definition of risk is consistently applied. Table 21 lists the selected risk factors.
Table 21: Risk Factors - Experiment 2
Risk Factors
Operational Risk Factorsa
Risk Factor 1: Uncertainty surrounding the viability of key suppliers or scarcity of supply will make it
difficult to deliver [company’s] products and services.
Risk Factor 2: Cyber threats have the potential to significantly disrupt [company’s] core operations.
Risk Factor 3: [Company’s] existing operations may not be able to meet performance expectations
related to quality, time to market, cost and innovation as well as its competitors.
Risk Factor 4: Succession challenges and the ability to retain top talent may limit [company’s] ability
to achieve operational targets.
Risk Factor 5: Inability to utilize data analytics and "big data" to achieve market intelligence and
increase productivity and efficiency is likely to affect [company’s] management of core
operations and strategic plan.
Non-Operational Risk Factors
Risk Factor 1b: Potential changes in trade restrictions or other government sanctions will limit
[company’s] ability to operate effectively and efficiently in international markets.
Risk Factor 2b: Economic conditions in markets [company name] currently serves will significantly
restrict growth opportunities for the organization.
Risk Factor 3c: Ease of entrance of new competitors into the industry and marketplace will threaten
[company’s] market share.
Risk Factor 4c: Shifts in social, environmental, and other customer preferences and expectations will be
difficult for [company name] to identify and address on a timely basis.
Risk Factor 5c: An unexpected crisis would likely have a significant impact on [company’s] reputation
given the organization's existing preparedness.
a As classified by Protiviti (2014a)
b Classified as a macroeconomic risk factor by Protiviti (2014a)
c Classified as a strategic risk factor by Protiviti (2014a)
The dependent variable is average probability assessment, a summary measure
representing the average of all five probability judgments provided by each participant. After

188
reading each of the five risk factors, participants responded to the question “How likely do you
think it is that this risk will occur at some point over the next 10 years?” Responses were
captured on a sliding scale with a minimum of 0% and a maximum of 100%. Percentages
selected were displayed and recorded at each 1% increment.
In addition to responding to the dependent variable measure for each risk factor,
participants also answered two loosely related questions designed to capture their subjective
assessment of each risk’s potential impact on RoboSurge’s operations. Given COSO’s (2004,
2013) observation that impact is a critical factor in the determination of organizational risk
management practices, it was considered important to measure impact perceptions in spite of the
fact that the case material was designed to hold impact constant. The first impact-related
question states “Assume this risk materializes at the Toronto [or: Melbourne, depending on
condition] operations. How significant do you think its impact will be?” Responses were
captured on a 5-point Likert scale anchored by 1 (“No impact at all”) and 5 (“Extensive
impact”). The second question asks “How important do you think it is to devote resources to
manage this risk?” Responses were captured on a 5-point Likert scale anchored by 1 (“Not at all
important”) and 5 (“Extremely important”).
Manipulation Checks
After completing the task, participants responded to two manipulation check questions.
Given the research question, it is critical that participants pay sufficient attention to the spatial
distance component of the experimental material. Accordingly, the following true/false items
were included as manipulation checks: (1) “The scenario you just read described that your entire
risk management team is based out of ABC’s headquarter in Chicago, IL”; (2) The preceding

189
scenario described that RoboSurge is located in Toronto, Canada [or: Melbourne, Australia –
depending on spatial condition].” Participants who failed to respond “True” to one or both
questions were exited from the survey.36
Thus, the final sample consists only of participants who
passed both manipulation check questions.
Debriefing Questions
Debriefing questions inquire about participants’ experience with probability assessment
and the use of risk registers. The following questions, both in yes/no format, were posed: (1)
“Have you ever served as a member of a team which had to assess the probability (i.e., the
likelihood) that certain risks will materialize?”; (2) “Have you ever used a checklist or risk
register which lists various risk factors and asks you to make a judgment about the likelihood
that those risks will materialize (e.g., the checklist or risk register may ask you to rate each risk
as “unlikely”, “likely”, “frequent”, “rare”, etc.; alternatively, the checklist or risk register may
ask you for a percentage similar to the preceding task)?” Almost all participants (148 individuals;
91.9%) indicated that they had prior experience with assessing risk probabilities. Moreover, 141
participants (87.6%) indicated that they had previously used a checklist or risk register. There
was no statistically significant difference across experimental conditions with respect to both
questions (p-value = .877 and .139, respectively).
36
A total of 758 participants started the survey. Of those, 597 were eliminated, primarily because of a failure to pass
the screening questions. The final sample of 161 consists of all participants who were paid for by the researcher and
hence by the survey company.

190
Results
H1c predicts that decision-makers who evaluate a spatially remote target will assign a
lower probability to the occurrence of various risk factors than decision-makers who evaluate a
spatially proximate target. As such, H1c predicts a main effect for independent variable
DISTANCE. The second hypothesized main effect, articulated in H2, concerns independent
variable CATEGORY. H2 predicts that decision-makers will perceive operational risk factors as
more likely to materialize than non-operational risk factors. Lastly an interaction between
DISTANCE and CATEGORY is hypothesized in H3 which predicts that decision-makers will
assess the probability that a risk will materialize to be lowest when assessing a remote risk target
and the risk factor is non-operational. As such, a graphical depiction of the results is expected to
reflect the trend line pattern illustrated in Figure 12 in which the trend line for the proximate
target lies above the trend line for the remote target and approaches the latter in the non-
operational risk condition.
Participants’ mean probability assessments are graphically depicted in Figure 13. The
trend line for the proximate target (hyphenated line) lies above the trend line for the remote
target (solid line) and both lines exhibit the predicted downward slope. Furthermore, the
hyphenated trend line appears to approach the solid line in the non-operational risk condition.
While the anticipated slope change is less pronounced than in Figure 12, the ordinal interaction
predicted in H3 appears to be supported.

191
Figure 13: Estimated Marginal Means - Experiment 2
Prior to conducting hypotheses testing for H1c and H2 via ANCOVA, a linear regression
(untabulated) was performed in order to identify potential covariates. All demographic variables
(age, years of risk management experience, years of overall work experience, gender, position,
education, and professional licenses) along with the two risk-impact related measures discussed
in section “Debriefing Questions” were simultaneously regressed on the dependent variable.
None of the demographic variables was significant. However, measured variable impact was
significant. The results reported below therefore include covariate impact.
Table 22 - Panel A displays the descriptive statistics for the participants’ average
probability assessment concerning the occurrence of various organizational risk factors under
each of the four treatment conditions. Panel A reveals that all means point in the predicted
directions. ANCOVA results reported in Table 22 - Panel B show a significant main effect for
DISTANCE (F = 3.078, one-tailed p-value = .041), in line with expectations. H1c is supported.
0%
10%
20%
30%
40%
50%
60%
70%
80%
90%
100%
Operational Risk Non-operational Risk
Lik
elih
oo
d o
f O
ccu
rren
ce
Proximate Target
Remote Target

192
Participants who evaluated the remote risk target assigned a lower probability to the occurrence
of various risk factors than those who evaluated the spatially proximate risk target. Contrary to
expectations, ANCOVA results do not support the predicted main effect for CATEGORY (F =
.159, one-tailed p-value = .345). H2 is therefore not supported. Participants did not perceive
operational risk factors to be more likely to occur than non-operational risk factors.
To test the prediction that probability assessments are lowest when participants assess
non-operational risk factors at a remote risk target (H3), a planned contrast (1, 1, 1, -3) was
conducted. The test examines whether the average probability assessment provided by
participants in the remote target / non-operational risk condition was lower than the
corresponding average probability assessment provided by participants in the other three
conditions. Results from a planned contrast reported in Table 22 – Panel C support H3 (contrast
value = 17.217, d.f. =3, one-tailed p-value = .049). Participants in the remote target / non-
operational risk condition did provide significantly lower average probability assessments.
Table 22: Results - Experiment 2
Panel A: Descriptive Statistics – Mean (Standard Deviation) [Sample Size]
Risk Type Overall
Distance Operational Non-operational Distance
Proximate 59.73 (16.63) [41] 56.26 (20.61) [42] 57.97 (18.72) [83]
Remote 52.16 (20.49) [38] 50.31 (17.52) [40] 51.21 (18.92) [78]
Overall Risk Type 56.09 (18.85) [79] 53.36 (19.28) [82] 54.70 (19.06) [161]

193
Panel B: Results of ANCOVA with Probability Assessment as Dependent Measure
Source S.S d.f. M.S. F-Ratio p-valuea
Distanceb 701.848 1 701.848 3.078 .041
Categoryc 36.367 1 36.367 .159 .345
Distance * Category 66.672 1 66.672 .292 .295
Impact (covariate) 20413.867 1 20413.867 89.520 <.001
Error 35573.921 156 228.038
Total 539814.520 161
Panel C: Planned Contrast (H3)
Contrast Coding: 1, 1, 1, -3
Contrast Value d.f. p-valuea
Remote / non-operational risk
factor condition vs. all other
conditions
17.217 3 .049
a One-tailed significance level
b Spatial Distance was manipulated between participants at two levels: proximate and remote. In the ‘proximate’
condition, participants were informed that the risk assessment target was a subsidiary located in Toronto, Canada. In
the ‘remote’ condition, participants were informed that the risk assessment target was a subsidiary located in
Melbourne, Australia. c Risk Type was manipulated between participants at two levels: operational and non-operational. An average score
was computed for the five operational and the five non-operational risk factors, respectively.
Additional Analyses
The analysis reported above is based on a broad classification of risk factors into two
major risk categories: operational risk factors and non-operational risk factors. As discussed
earlier, dichotomous classification was considered appropriate given the exploratory nature of
this research and the subjectivity inherent in classifying various risks. In additional analyses, a
slightly more refined approach to classifying risk factors is taken. Specifically, the five non-
operational risk factors are separated into macroeconomic risk factors and strategic risk factors
based on the respective risk factors’ original classification in the Protiviti (2014a) survey. That
is, non-operational risk factors number one (trade restrictions) and number two (macro-economic

194
conditions) listed in Table 21 are classified as macroeconomic risk factors and the remaining
three non-operational risk factors are classified as strategic risk factors. Using this breakdown,
separate ANCOVAs are performed. Table 23 reflects this breakdown and displays descriptive
statistics for the participants’ probability assessment concerning the occurrence of each
individual risk factor under both the proximate and remote conditions.
Table 23: Individual Risk Factors - Experiment 2
Probability Assessments by Risk Factor (RF) - Mean (Standard Deviation)
Operational Risk Factorsa Proximate Remote Total
N=41 N=38 N=79
RF 1: key supplier viability 59.22 (22.37) 55.58 (25.90) 57.47 (24.04)
RF 2: cyber threats 67.05 (23.85) 63.16 (24.99) 65.18 (24.32)
RF 3: meeting performance expectations 56.56 (23.23) 48.39 (24.54) 52.63 (24.07)
RF 4: succession challenges 57.41 (24.88) 44.63 (23.68) 51.27 (24.00)
RF 5: data analytics problems 58.39 (23.91) 49.03 (26.07) 53.89 (25.25)
Total – Operational Risk Factors 59.73 (16.63) 52.16 (20.49) 56.09 (18.85)
Non-Operational Risk Factors Proximate Remote Total
Macroeconomic Risk Factorsa N=42 N=40 N=82
RF 1: trade restrictions 54.93 (25.32) 53.65 (23.22) 54.30 (24.18)
RF 2: macro-economic conditions 57.17 (23.12) 48.93 (19.69) 53.15 (21.78)
Total – Macroeconomic Risk Factors 56.05 (21.83) 51.29 (19.57) 53.73 (20.77)
Strategic Risk Factorsa
RF 3: new competitors 58.38 (23.79) 51.18 (19.99) 54.87 (22.18)
RF 4: shifts in social expectations 53.43 (27.35) 48.80 (24.24) 51.17 (25.82)
RF 5: unexpected crisis 57.40 (26.69) 49.00 (26.03) 53.30 (26.55)
Total – Strategic Risk Factors 56. 41 (21.95) 49.66 (19.87) 53.12 (21.11)
Total – Non-Operational Risk Factors 56.26 (20.61) 50.31 (17.52) 53.36 (19.28)

195
a As classified by Protiviti (2014a)
Table 24 - Panel A displays the descriptive statistics for the participants’ average
probability assessment concerning the occurrence of five operational risk factors and the average
probability assessment concerning the occurrence of two macroeconomic risk factors under both
the proximate and remote conditions. Similar to the main analysis, Panel A reveals that all means
point in the predicted directions. ANCOVA results reported in Table 24 - Panel B mirror those
for the main analyses. Results show a significant main effect for DISTANCE (F = 3.818, one-
tailed p-value = .026), in support of H1c. Also similar to the main analyses, the predicted main
effect for CATEGORY is not significant (F = .378, one-tailed p-value = .270). Hence, H2 is not
supported when the non-operational risk factor category is limited to macroeconomic risk
factors. However, results from a planned contrast (1, 1, 1, -3) moderately support H3 (contrast
value = 14.070, d.f. =3, one-tailed p-value = .097).
Table 24: Additional Analyses - Experiment 2: Macroeconomic Risk Factors
Panel A: Descriptive Statistics – Mean (Standard Deviation) [Sample Size]
Risk Type Overall
Distance Operational Macroeconomic Distance
Proximate 59.73 (16.63) [41] 56.05 (21.83) [42] 57.87 (19.41) [83]
Remote 52.16 (20.49) [38] 51.29 (19.57) [40] 51.71 (19.90) [78]
Overall Risk Type 56.09 (18.85) [79] 53.73 (20.77) [82] 54.88 (19.83) [161]

196
Panel B: Results of ANCOVA with Probability Assessment as Dependent Measure
Source S.S d.f. M.S. F-Ratio p-valuea
Distanceb 935.468 1 935.468 3.818 .026
Categoryc 92.514 1 92.514 .378 .270
Distance * Category 19.001 1 19.001 .078 .391
Impact (covariate) 22848.774 1 22848.774 93.255 <.001
Error 38222.228 156 245.014
Total 547859.410 161
Panel C: Planned Contrast (H3)
Contrast Coding: 1, 1, 1, -3 Contrast Value d.f. p-valuea
Remote / macroeconomic risk factor
condition vs. all other conditions
14.070 3 .097
a One-tailed significance level
b Spatial Distance was manipulated between participants at two levels: proximate and remote. In the ‘proximate’
condition, participants were informed that the risk assessment target was a subsidiary located in Toronto, Canada. In
the ‘remote’ condition, participants were informed that the risk assessment target was a subsidiary located in
Melbourne, Australia. c Risk Type was manipulated between participants at two levels: operational and non-operational. An average score
was computed for the five operational and the two macroeconomic risk factors, respectively.
Table 25 - Panel A displays the descriptive statistics for the participants’ average
probability assessment concerning the occurrence of five operational risk factors and the average
probability assessment concerning the occurrence of three strategic risk factors under both the
proximate and remote conditions. Similar to the main analysis, Panel A reveals that all means
point in the predicted directions. ANCOVA results reported in Table 25 - Panel B mirror those
for the main analyses. Results show a moderately significant main effect for DISTANCE (F =
2.313, one-tailed p-value = .065). Again, H1c is supported. Table 25 - Panel B further shows a
significant main effect for CATEGORY (F = 46.316, one-tailed p-value < .001). Participants
perceive operational risk factors to be more likely to occur than strategic risk factors. H2 is
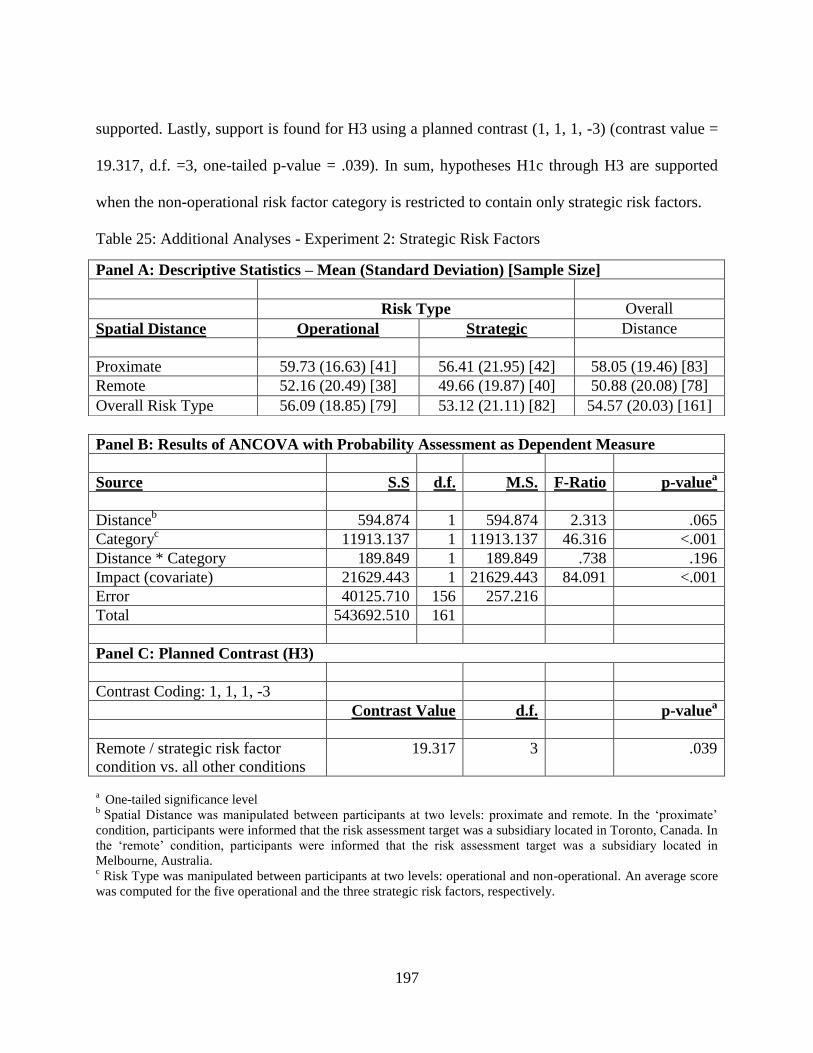
197
supported. Lastly, support is found for H3 using a planned contrast (1, 1, 1, -3) (contrast value =
19.317, d.f. =3, one-tailed p-value = .039). In sum, hypotheses H1c through H3 are supported
when the non-operational risk factor category is restricted to contain only strategic risk factors.
Table 25: Additional Analyses - Experiment 2: Strategic Risk Factors
Panel B: Results of ANCOVA with Probability Assessment as Dependent Measure
Source S.S d.f. M.S. F-Ratio p-valuea
Distanceb 594.874 1 594.874 2.313 .065
Categoryc 11913.137 1 11913.137 46.316 <.001
Distance * Category 189.849 1 189.849 .738 .196
Impact (covariate) 21629.443 1 21629.443 84.091 <.001
Error 40125.710 156 257.216
Total 543692.510 161
Panel C: Planned Contrast (H3)
Contrast Coding: 1, 1, 1, -3
Contrast Value d.f. p-valuea
Remote / strategic risk factor
condition vs. all other conditions
19.317 3 .039
a One-tailed significance level
b Spatial Distance was manipulated between participants at two levels: proximate and remote. In the ‘proximate’
condition, participants were informed that the risk assessment target was a subsidiary located in Toronto, Canada. In
the ‘remote’ condition, participants were informed that the risk assessment target was a subsidiary located in
Melbourne, Australia. c Risk Type was manipulated between participants at two levels: operational and non-operational. An average score
was computed for the five operational and the three strategic risk factors, respectively.
Panel A: Descriptive Statistics – Mean (Standard Deviation) [Sample Size]
Risk Type Overall
Spatial Distance Operational Strategic Distance
Proximate 59.73 (16.63) [41] 56.41 (21.95) [42] 58.05 (19.46) [83]
Remote 52.16 (20.49) [38] 49.66 (19.87) [40] 50.88 (20.08) [78]
Overall Risk Type 56.09 (18.85) [79] 53.12 (21.11) [82] 54.57 (20.03) [161]

198
Conclusion
Responding to Jordan et al.’s (2013) call for research on risk registers and Ballou et al.’s
(2011) call for an investigation of whether risk category affects risks assessment, the present
study draws on construal level theory of psychological distance to examine how spatial distance
from a risk assessment target and risk category affects decision-makers’ assessment of the
probability that a given risk will occur. Two experiments, one involving 80 first-year M.B.A.
students (Experiment 1) and one involving 161 risk managers (Experiment 2) are conducted.
Experiment 1 is considered exploratory and examines whether individuals intuitively
associate the occurrence of low-probability risks with distant locations and the occurrence of
high-probability risks with proximate locations. Contrary to expectations and potentially due a
mismatch between participants’ actual experience and the amount of expertise necessary for
rendering truly intuitive judgments in the domain of risk management, the results from
Experiment 1 do not support the hypothesized association.
Experiment 2 constitutes the main analysis and investigates directly how spatial distance
from a risk assessment target and the type of risk subject to analysis affect risk-related
probability judgments. Results provide evidence of significant spatial distance effects on
decision-makers’ judgment. Risk managers who evaluated a spatially remote risk target judged
the probability that various risk factors will materialize to be lower than their counterparts who
evaluated a spatially proximate risk target. Moreover, while risk managers did not perceive
operational risk factors as more likely to occur than non-operational risk factors, they judged the
probability that a risk will materialize to be lowest when assessing a remote risk target and the
risk factor is non-operational. This finding has potentially important implications for risk
management practice as it could explain why insufficient resources are devoted to managing

199
various strategic or macroeconomic risks (assuming those decisions are centralized). Given the
lack of support for the predicted main effect of risk category in Experiment 2, additional testing
was performed in order to gain a better understanding of the role of risk category on professional
decision-makers’ judgment.
In additional analyses, non-operational risk factors are further separated into
macroeconomic risk factors and strategic risk factors prior to hypotheses testing. That is, the first
analysis dichotomizes risk category into operational and macroeconomic risk factors while the
second analysis dichotomizes risk category into operational and strategic risk factors. Results
from the first analysis mirror those from the primary analysis. Probability assessments were
lower when a spatially remote risk target was considered and lowest when a remote risk target
was considered and the risk factor was macroeconomic. However, results from the second
analysis show a significant main effect for risk category in addition to the predicted main effect
for spatial distance and the predicted interaction effect. Risk managers perceived operational risk
factors as more likely to occur than strategic risk factors. Together, the results reported in this
study provide initial evidence that professional decision-makers’ risk probability judgments are
systematically affected by spatial distance from the risk assessment target and that the interaction
between spatial distance effects and the effects stemming from risk category prompts decision-
makers to provide lowest probability estimates when assessing the likelihood that non-
operational risk factors will materialize at spatially remote locations.
The present research thus offers preliminary insights into the ‘black box’ representing the
probability assessment module within the risk assessment procedure outlined by COSO 2004 and
offers additional information about actual ERM processes as desired by board members. By
identifying psychological distance as a potential cause for judgment bias during the corporate

200
risk assessment process the present research adds to the list of potential judgment traps identified
in a recent COSO-commissioned thought paper and thus contributes to the corporate governance
literature. The study also informs risk management practice by providing tentative evidence that
the abstractness associated with the description of various risks may constitute a factor that
influences probability assessment. Lastly, this study informs the psychology literature by
suggesting that the predictions derived from CLT hold in professional settings as long as the
decision at hand is largely within the experience domain of the decision-maker and thus permits
the influence of intuition.
Similar to most laboratory studies, the absence of accountability and the potential lack of
pertinent information present in a real risk management environment constitute limitations.
Another shortcoming to this study is that only a limited selection of risks was presented to the
participants. Moreover, the ten risk factors incorporated in the experimental material were
subjectively chosen. Results may have differed had a larger variety of risks been selected or if
different risks had been chosen by the researcher. However, all risk factors incorporated in this
study were adapted from a recent large-scale survey of board members and executives and an
effort was made to include only risks that, according to the survey, were considered equally
important in terms of their organizational impact.
Future studies could investigate how other dimensions of psychological distance – e.g.,
temporal distance – affect decision-makers’ judgment in the context of probability assessment
within an ERM environment. Such studies could, for example, focus on the assessment of the
probability that a ‘black swan’ event occurs in the distant versus near future (see Wakslak 2012).
Another promising area for future research is to apply a more fine-tuned examination of the
impact of risk category on risk assessment. Future studies could, for example, attempt to extend

201
Experiment 2 by incorporating a wider variety of risk factors or by directly manipulating the
abstractness of various risk factors. Such analysis may provide more direct evidence of the
effects of risk abstractness on probability judgment. Moreover, while the current study
categorizes risk dichotomously, future studies could use more refined risk taxonomies. Examples
include the risk categories proposed by Kaplan and Mikes (2012): preventable risks, strategy
risks, and external risk; a taxonomy of global risks proposed by the World Economic Forum
(2014): economic risks, environmental risks, geopolitical risks, societal risks, and technological
risks; and, in the domain of interorganizational relationships, the three risk categories associated
with the critical risk factors identified by Sutton et al. (2008): technical risks, application-user
risks, and business risks.

202
References
American Institute of Certified Public Accountant (AICPA). 2006. Understanding the Entity and
Its Environment and Assessing the Risks of Material Misstatement. Statement on
Auditing Standards No. 109. Available at:
http://www.aicpa.org/Research/Standards/AuditAttest/DownloadableDocuments/AU-
00314.pdf.
Arena, M., M. Arnaboldi, and G. Azzone. 2010. The organizational dynamics of enterprise risk
management. Accounting, Organizations and Society 35 (7): 659-675.
Arnold, V., C. Hampton, D. Khazanchi, and S. G. Sutton. 2011. Managing risk in
interorganizational relationships: factors influencing the desirability of e-commerce
assurance. Working Paper.
Arnold, V., T. Benford, C. Hampton, and S. G. Sutton. 2010. Competing pressures of risk and
absorptive capacity potential on commitment and information sharing in global supply
chains. European Journal of Information Systems 19 (2): 134-152.
Arnold, V., T. Benford, J. Canada, and S. G. Sutton. 2011. The role of strategic enterprise risk
management and organizational flexibility in easing new regulatory compliance.
International Journal of Accounting Information Systems 12 (3): 171-188.
Arnold, V., T. S. Benford, C. Hampton, and S. G. Sutton. 2012. Enterprise risk management as a
strategic governance mechanism in B2B-enabled transnational supply chains. Journal of
Information Systems 26 (1): 51-76.
Arnold, V., T. Benford, C. Hampton, and S. G. Sutton. 2014. Enterprise risk management: Re-
conceptualizing the role of risk and trust on information sharing in transnational
alliances. Journal of Information Systems (forthcoming).
Ballou, B., and D. L. Heitger. 2008. Integrating governance risk and reporting to create long-
term value. Strategic Finance 89 (11): 36-41.
Ballou, B., D. L. Heitger, and D. Stoel. 2011. How boards of directors perceive risk management
information. Management Accounting Quarterly 12 (4): 14-22.
Bar-Anan, Y., N. Liberman, and Y. Trope. 2006. The association between psychological distance
and construal level: Evidence from an implicit association test. Journal of Experimental
Psychology: General 135 (4): 609-622.
Baxter, R., J. C. Bedard, R. Hoitash, and A. Yezegel. 2013. Enterprise risk management program
quality: Determinants, value relevance, and the financial crisis. Contemporary
Accounting Research 30 (4): 1264-1295.

203
Beasley, M. S., and M. L. Frigo. 2007. Strategic risk management: Creating and protecting
value. Strategic Finance 88 (11): 25-53.
Beasley, M. S., B. C. Branson, and B. V. Hancock. 2010. Are you identifying your most
significant risks? Strategic Finance 92 (5): 29-35.
Beasley, M. S., R. Clune, and D. R. Hermanson. 2005. Enterprise risk management: An
empirical analysis of factors associated with the extent of implementation. Journal of
Accounting and Public Policy 24 (6): 521-531.
Cantor, D. E., and J. R. Macdonald. 2009. Decision-making in the supply chain: Examining
problem solving approaches and information availability. Journal of Operations
Management 27 (3): 220-232.
Chambers, A. 2012. Notes and Recommendations (at end) on COSO’s December 2011 Exposure
Draft. Available at:
http://www.coso.org/documents/IC_COSO_COMMENTS/PREVIOUS/88-1562905f-
cf18-4d9c-9bab-61e3c88e57fc_New%20COSO_2011_12.pdf.
Collier P. M. 2009. Fundamentals of Risk Management for Accountants and Managers. Elsevier.
Amsterdam.
Committee of Sponsoring Organizations of the Treadway Commission (COSO). 1992. COSO
report: Internal control – An integrated framework. New York: AICPA.
Committee of Sponsoring Organizations of the Treadway Commission (COSO). 2004.
Enterprise Risk Management – Integrated Framework. New York, NY: AICPA.
Committee of Sponsoring Organizations of the Treadway Commission (COSO). 2013. Internal
Control – Integrated Framework. Executive Summary. Available at:
http://www.coso.org/documents/990025P_Executive_Summary_final_may20_e.pdf.
Deloitte & Touche LLP. 2012. Risk Assessment in Practice. Available at:
http://www.coso.org/documents/COSOAnncsOnlineSurvy2GainInpt4Updt2IntrnlCntrlInt
gratdFrmwrk%20-%20for%20merge_files/COSO-
ERM%20Risk%20Assessment%20inPractice%20Thought%20Paper%20OCtober%2020
12.pdf.
Foerstl, K., C. Reuter, E. Hartmann, and C. Blome. 2010. Managing supplier sustainability risks
in a dynamically changing environment – Sustainable supplier management in the
chemical industry. Journal of Purchasing & Supply Management 16 (2): 118-130.
Fraser, I., and W. Henry. 2007. Embedding risk management: structures and approaches.
Managerial Auditing Journal 22 (4): 392-409.

204
Frigo, M. L., and R. J. Anderson. 2011. Strategic risk management: A foundation for improving
enterprise risk management and governance. The Journal of Corporate Accounting &
Finance 22 (3): 81-88.
Frigo, M. L., and R. J. Anderson. 2014. Risk management frameworks: Adapt, don’t adopt.
Strategic Finance 96 (1): 49-53.
Fujita, K., and H. A. Han. 2009. Moving beyond deliberative control of impulses. The effect of
construal levels on evaluative associations in self-control conflicts. Psychological Science
20 (7): 799-804.
Fujita, K., M. D. Henderson, J. Eng, Y. Trope, and N. Liberman. 2006. Spatial distance and
mental construal of social events. Psychological Science 17 (4): 278-282.
Gates, S., J. Nicolas, and P. L. Walker. 2012. Enterprise risk management: A process for
enhanced management and improved performance. Management Accounting Quarterly
13 (3): 28-38.
Gordon, L. A., M. P. Loeb, and C. Tseng. 2009. Enterprise risk management and firm
performance: A contingency perspective. Journal of Accounting and Public Policy 28
(4): 301-327.
Henderson, M. D. 2011. Mere physical distance and integrative agreements: When more space
improves negotiation outcomes. Journal of Experimental Social Psychology 47 (1): 7-15.
Henderson, M. D., and C. J. Wakslak. 2010. Over the hills and far away: The link between
physical distance and abstraction. Current Directions in Psychological Science 19 (6):
390 - 394.
Henderson, M. D., C. J. Wakslak, K. Fujita, and J. Rohrbach. 2011. Construal level theory and
spatial distance: Implications for mental representation, judgment, and behavior. Social
Psychology 42 (3): 165-173.
Henderson, M. D., K. Fujita, Y. Trope, and N. Liberman. 2006. Transcending the "here": The
effect of spatial distance on social judgment. Journal of Personality and Social
Psychology 91 (5): 845-856.
Hoyt, R. E., And A. P. Liebenberg. 2011. The value of enterprise risk management. The Journal
of Risk and Insurance 78 (4): 795-822.
Institute of Chartered Accountants in England and Wales (ICAEW). 1999. Internal Control:
Guidance for Directors on the Combined Code. Available at:
http://www.ecgi.org/codes/documents/turnbul.pdf.

205
International Organization for Standardization (ISO). 2009. ISO 31000 – Risk management.
Available at: http://www.iso.org/iso/home/standards/iso31000.htm.
Janvrin, D. J., E. A. Payne, P. Byrnes, G. P. Schneider, and M. B. Curtis. 2012. The updated
COSO internal control – integrated framework: Recommendations and opportunities for
future research. Journal of Information Systems 26 (2): 189-213.
Jia, L., E. R. Hirt, and S. C. Karpen. 2009. Lessons from a faraway land: The effect of spatial
distance on creative cognition. Journal of Experimental Social Psychology 45 (5): 1127-
1131.
Jordan, S., L. Jorgensen, and H. Mitterhofer. 2013. Performing risk and the project: Risk maps as
mediating instruments. Management Accounting Research 24 (2): 156-174.
Kaplan, R. S., A. Mikes, R. Simons, P. Tufano, and M. Hofmann. 2009. Managing risk in the
new world. Harvard Business Review 87 (10): 68-75.
Kaplan, R. S., and A. Mikes. 2012. Managing risks: A new framework. Harvard Business
Review 90 (6): 48-60.
KPMG LLP. 2012. Enhancing Board Oversight: Avoiding Judgment Traps and Biases. Available
at: http://www.coso.org/documents/COSO-EnhancingBoardOversight_r8_Web-
ready%20(2).pdf.
Liberman, N., and Y. Trope. 1998. The role of feasibility and desirability considerations in near
and distant future decisions: A test of temporal construal theory. Journal of Personality
and Social Psychology 75 (1): 5-18.
Liberman, N., and Y. Trope. 2008. The psychology of transcending the here and now. Science
322 (5905): 1201-1205.
Liberman, N., M. D. Sagristano, and Y. Trope. 2002. The effect of temporal distance on level of
mental construal. Journal of Experimental Social Psychology 38: 523-534.
Liberman, N., Y. Trope, and E. Stephan. 2007a. Psychological distance. In A. W. Kruglanski &
E. T. Higgins (Eds.), Social psychology: Handbook of basic principles (Vol. 2, pp. 353–
383). New York, NY: Guilford Press.
Liberman, N., Y. Trope, S. M. McCrea, and S. J. Sherman. 2007b. The effect of level of
construal on the temporal distance of activity enactment. Journal of Experimental Social
Psychology 43 (1): 143-149.
Maglio, S. J., Y. Trope, and N. Liberman. 2013. Distance from a distance: Psychological
distance reduces sensitivity to any further psychological distance. Journal of
Experimental Psychology: General 142 (3): 644-657.

206
McShane, M. K., A. Nair, and E. Rustambekov. 2011. Does enterprise risk management increase
firm value? Journal of Accounting, Auditing & Finance 26 (4): 641-658.
Mikes, A. 2009. Risk management and calculative cultures. Management Accounting Research
20 (1): 18-40.
Mikes, A. 2011. From counting risk to making risk count: Boundary-work in risk management.
Accounting, Organizations and Society 36 (4-5): 226-245.
Mikes, A., and R. S. Kaplan. 2014. Towards a contingency theory of enterprise risk
management. Working Paper. Available at SSRN: http://ssrn.com/abstract=2311293.
Navon, D. 1977. Forest before trees: The precedence of global features in visual perception.
Cognitive Psychology 9 (3): 353-383.
O’Donnell, E. 2005. Enterprise risk management: A systems-thinking framework for the event
identification phase. International Journal of Accounting Information Systems 6 (3): 177-
195.
Power, M. 2007. Organized Uncertainty. New York, NY: Oxford University Press, Inc.
Power, M. 2009. The risk management of nothing. Accounting, Organizations and Society 34 (6-
7): 849-855.
PricewaterhouseCoopers (PwC). 2009. Extending Enterprise Risk Management (ERM) to
address emerging risks. Available at: http://www.pwc.com/gx/en/research-
publications/pdf/pwcglobalriskserm.pdf.
PricewaterhouseCoopers (PwC). 2013a. State of the internal audit profession study: Reaching
greater heights: Are you prepared for the journey? Available at:
http://www.pwc.com/en_GR/gr/publications/assets/state-of-internal-audit-2013.pdf.
PricewaterhouseCoopers. 2013b. Boards confront an evolving landscape. PwC’s Annual
Corporate Directors Survey 2013. Available at: http://www.pwc.com/us/en/corporate-
governance/annual-corporate-directors-survey/assets/pdf/pwc-annual-corporate-directors-
survey-full-report.pdf.
Protiviti. 2014a. Executive Perspectives on Top Risks for 2014. Available at:
http://www.protiviti.com/en-US/Documents/Surveys/NC-State-Protiviti-Survey-Top-
Risks-2014.pdf.
Protiviti. 2014b. The Updated COSO Internal Control Framework. Available at:
http://www.protiviti.com/en-US/Documents/Resource-Guides/Updated-COSO-Internal-
Control-Framework-FAQs-Second-Edition-Protiviti.pdf.

207
Public Company Accounting Oversight Board (PCAOB). 2007. An Audit of Internal Control
Over Financial Reporting That Is Integrated with An Audit of Financial Statements.
Auditing Standard No. 5. Washington, DC. Available at:
http://pcaobus.org/standards/auditing/pages/auditing_standard_5.aspx.
Raiborn, C. A., J. B. Butler, and M. F. Massoud. 2009. Outsourcing support functions:
Identifying and managing the good, the bad, and the ugly. Business Horizons 52 (4): 347-
356.
Renn, O. 1998. Three decades of risk research: accomplishments and new challenges. Journal of
Risk Research 1 (1): 49-71.
Sagristano, M. D., Y. Trope, and N. Liberman. 2002. Time-dependent gambling: Odds now,
money later. Journal of Experimental Psychology: General 131 (3): 364-376.
Smith, P. K., and Y. Trope. 2006. You focus on the forest when you're in charge of the trees:
Power priming and abstract information processing. Journal of Personality and Social
Psychology 90 (4): 578-596.
Soin, K., and P. Collier. 2013. Editorial: Risk and risk management in management accounting
and control. Management Accounting Research 24 (2): 82-87.
Standard & Poor’s Financial Services LLC. 2006. Insurance Criteria: Refining the Focus of
Insurer Enterprise Risk Management Criteria. Available at:
https://www.rims.org/resources/ERM_OLD/Documents/InsuranceCriteriaRefining.pdf.
Sutton, S. G. 2006. Extended-enterprise systems’ impact on enterprise risk management. Journal
of Enterprise Information Management 19 (1): 97-114.
Sutton, S.G., C. Hampton, D. Khazanchi, and V. Arnold. 2008. Risk analysis in extended
enterprise environments: Identification of critical risk factors in B2B e-commerce
relationships. Journal of the Association for Information Systems 9 (3&4): 151-174.
Taleb, N. N. 2007. The Black Swan – The Impact of the Highly Improbable. Random House.
New York.
Todorov, A., A. Goren, and Y. Trope. 2007. Probability as a psychological distance: Construal
and preferences. Journal of Experimental Social Psychology 43 (3): 473-482.
Trope, Y., and N. Liberman. 2003. Temporal construal. Psychological Review 110 (3): 403-421.
Trope, Y., and N. Liberman. 2010. Construal-level theory of psychological distance.
Psychological Review 117 (2): 440-463.

208
Trope, Y., N. Liberman, and C. Wakslak. 2007. Construal levels and psychological distance:
Effects on representation, prediction, evaluation, and behavior. Journal of Consumer
Psychology 17 (2): 83-95.
Trotman K. T., and A Wright. 2000. Order effects and recency: where do we go from here?
Accounting and Finance 40 (2): 169-182.
Wakslak, C. J. 2012. The where and when of likely and unlikely events. Organizational
Behavior and Human Decision Processes 117 (1): 150-157.
Wakslak, C. J., Y. Trope, N. Liberman, and R. Alony. 2006. Seeing the forest when entry is
unlikely: Probability and the mental representation of events. Journal of Experimental
Psychology: General 135 (4): 641-653.
Wakslak, C., and Y. Trope. 2009. The effect of construal level on subjective probability
estimates. Psychological Science 20 (1): 52-58.
World Economic Forum. 2014. Global risks 2014. Available at:
http://www.weforum.org/reports/global-risks-2014-report.
Zhao, M., and J. Xie. 2011. Effects of social and temporal distance on consumers' responses to
peer recommendations. Journal of Marketing Research 48 (3): 486-496.

209
GENERAL CONCLUSION
The three studies presented in this dissertation explore the effects of psychological
distance on judgment and decision-making in accounting. Construal level theory (CLT) of
psychological distance (Liberman and Trope 1998; Trope and Liberman 2003), a framework
recently developed in the field of social psychology, constitutes the theoretical foundation for
each study. Study One describes the theory in detail, reviews research that applies the
propositions derived from CLT to various decision domains, and offers broad, CLT-based
research questions that are of interest to accounting researchers. Following this theoretical
discussion, Study Two applies CLT to the audit context by investigating whether the degree of
abstract thinking required for the performance of typical auditing tasks affects decision-makers’
overall mindset and hence their subsequent judgment. Lastly, Study Three applies CLT to the
enterprise risk management (ERM) context by examining how spatial distance from a risk
assessment object and risk category (i.e., the type of risk) affects decision-makers’ risk
assessment. The following paragraphs discuss the unique contributions of each of these studies
from a theory and/or practice perspective.
The literature review presented in Study One highlights the broad applicability of CLT by
reporting theory-consistent results from studies that span judgment and decision-making domains
ranging from everyday decision-tasks reported in the psychology literature to various
professional judgments reported in a variety of business, economics, and decision-science fields.
The reviewed literature suggests that individuals’ predictions, evaluations, preferences,
perceptions, and behaviors are affected by psychological distance, regardless of how
psychological distance is initially invoked (e.g., through distancing on any distance dimensions

210
or through procedural priming). In particular, research shows that individuals’ weigh various
aspects of a situation or event differently, depending on psychological distance associated with
the decision at hand. For example, greater psychological distance focuses decision-makers on
primary rather than secondary features; on desirability rather than feasibility concerns; on pros
rather than cons; on idealistic rather than pragmatic concerns; and on non-alignable rather than
alignable features. Moreover, greater psychological distance promotes the consideration of
values and overall attitudes, the ability to make proper trade-offs during negotiations, and the
ability to exert self-control. Those findings, among others, have the potential to inform a wide
variety of judgments relevant to accounting research and practice since accounting professionals,
organizational actors, and other decision-makers who rely on accounting information regularly
forecast situations, articulate preferences, assess situations, or act upon deliberations that involve
varying degrees of psychological distance. A synthesis of extant CLT-informed accounting
research supports this contention.
Given the relatively sparse amount of accounting studies that use CLT as a theoretical
foundation, the articulation of a variety of broad research questions related to major accounting
disciplines (accounting information systems, audit, financial accounting, managerial accounting,
and tax) constitutes an important contribution of Study One. From a purely theoretical
perspective, Study One also contributes to the accounting literature by underscoring the
commonalities and differences between CLT and related or competing theories that have been
used in behavioral accounting research. Future research can draw on those discussions in order to
combine insights from CLT with those of other prominent theories. Most importantly, Study One
encourages behavioral accounting researchers to gain a deeper understanding of the heuristics

211
and biases associated with judgment and decision-making by considering the mediating
cognitive processes that are the focus of CLT.
Results from Study Two highlight the importance of considering the effects of task
induced mindset orientation on intuitive judgments. Results indicate that auditors, who have
adopted an abstract mindset orientation as a result of an unrelated preceding audit task, provide
lower probability assessments than their counterparts who have adopted a concrete mindset
orientation. However, results do not support the predicted irrelevance of whether the probability
judgment is focused on the event (i.e., the collectability of accounts receivable) or the event’s
complement (i.e., the uncollectibility of accounts receivable). Possibly due to auditors’ relative
unfamiliarity with the manner in which the complement probability question was posed, the
focus of the probability question may have affected auditors’ judgment and counteracted the
hypothesized decision-making bias which was expected to manifest as a significant interaction
effect.
The results from a second experiment, designed to shed light on the underlying
psychological processes activated in the auditor participants, fail to support the hypothesized
effects. In Experiment 2, student participants who have adopted an abstract mindset orientation
as a result of a construal mindset priming task, do not provide lower probability assessments than
their counterparts who have adopted a concrete mindset orientation. Moreover, the hypothesized
judgment bias, related to the combined probability assessments (i.e., probability of the event plus
the probability of the complement) that are farther from 1 for participants who have adopted an
abstract mindset orientation, lacks support.
Together, the results from Experiment 1, Experiment 2, and those from additional
analyses that directly compare complement-focused probability judgments between participants

212
that have adopted an abstract mindset and those who have adopted a concrete mindset, reveal
insights that should be of interest to accounting and psychology researchers alike: the CLT-based
predictions concerning probability judgments may not hold in situations in which the judgment
of concern is relatively unfamiliar to the decision-maker due to lack of prior exposure or focus of
the judgment question. The study thus contributes to the psychology literature as it tests CLT-
based probability assessment predictions in a professional setting and identifies a potential scope
limitation of the theory. Future research could explore this proposition more thoroughly.
Overall, the results from Study Two have important implications for audit practice as
they suggest that task-induced mindset can affect judgment related to a subsequent task even
when the latter is completely unrelated to the initial task. This should be of interest to auditors
who work in a multi-client, multi-task environment that requires frequent shifts in attention.
Without such awareness, potentially mitigating de-biasing mechanism may be ignored or not be
developed in the first place.
By highlighting how task abstractness can influence construal mindset and hence
evaluative judgments, Study Two lays the foundation for future inquiry into the effects of
construal mindset orientation on accounting professionals’ predictions, preferences, and actions.
Moreover, while Study Two uses a categorization task to induce an abstract mindset orientation,
one should not conclude that this is the only way to prompt abstract thinking and hence the
reported effects. The CLT literature suggests several other means for inducing an abstract
mindset, all of which may be explored by future accounting research (e.g., comparing objects
with nonalignable rather than alignable features; considering the why rather than the how aspects
of a given situation; adopting another person’s perspective; or envisioning that a decision is
made for the distant future).

213
Results from Study Three offer critical insights into risk management practice that could
explain why insufficient resources are devoted to managing various strategic risks. In particular,
the study illustrates how both spatial distance from an object that is evaluated in terms of the
risks it faces and risk category (i.e., the nature of the risk; risk type) systematically affect
decision-makers’ judgment concerning the likelihood that a given risk will occur. While the
results from a preliminary experiment fail to support the prediction that decision-makers
intuitively associate the occurrence of low-likelihood risks with remote locations and the
occurrence of high-likelihood risks with nearby locations (possibly because the decision may
have fallen outside the participants’ area of expertise), the importance of spatial distance is
corroborated in a second experiment.
Specifically, results from a second, more elaborate experiment, show that risk managers
who assess a spatially distant corporate subsidiary judge the likelihood that various risk factors
will occur to be lower than those who assess a spatially nearby subsidiary. While the predicted
effect associated with risk category was not supported when risk category was broadly
dichotomized (i.e., divided into operational and non-operational risk factors), a more refined
analysis reveals that risk mangers consider operational risk factors as more likely to occur than
strategic risk factors (but not more likely than macroeconomic risk factors). Furthermore, results
from Experiment 2 show that the evaluation of a spatially distant subsidiary with respect to non-
operational risk factors leads to lowest probability estimates.
Together, the results from this study inform the corporate governance literature and alert
risk management practice to potential judgment biases during the risk assessment process that
may at least partially explain the systematic misallocation of risk management resources
identified by PricewaterhouseCoopers (PwC 2009). Such insights are important to risk managers

214
and corporate staff involved in the development of risk registers, centralized risk databases, or
other risk management tools (e.g., specialized software; decision-aids; risk visualization tools)
that are used to render risk management resource allocation decisions. Awareness of the
identified cognitive effects associated with risk category and spatial distance should encourage
corporate risk managers to seek out potential de-biasing mechanisms. The search for such de-
biasing mechanisms also offers an interesting avenue for future research. Future research could,
for example, explore whether the abstractness associated with the description of various risks
can be equalized among risk categories such that probability assessments will be less biased.
Relatedly, future research could draw on more refined risk taxonomies in order to tease out the
effects associated with risk category and hence risk description abstractness. Moreover, future
inquiry may explore how other instantiations of psychological distance (e.g., temporal distance
or social distance) affect risk managers’ judgment.
In summary, the results reported in this dissertation suggest that psychological distance
systematically affects individuals’ judgment subject to the caveat that the judgment of concern
falls within the domain of the decision-maker’s routine cognition. By presenting empirical
evidence from both the audit and the risk management domain, the studies contribute to our
understanding of the heuristics and biases in judgment and decision-making in professional
settings that are of interest to accounting research. The research questions offered in Study One
as well as those outlined above suggest that CLT constitutes a suitable theoretical foundation for
improving our understanding of the mediating cognitive processes that ultimately determine the
decisions and actions of actors in a wide variety of distance-affected decision environments.

215
References
Liberman, N., and Y. Trope. 1998. The role of feasibility and desirability considerations in near
and distant future decisions: A test of temporal construal theory. Journal of Personality
and Social Psychology 75 (1): 5-18.
PricewaterhouseCoopers (PwC). 2009. Extending Enterprise Risk Management (ERM) to
address emerging risks. Available at: http://www.pwc.com/gx/en/research-
publications/pdf/pwcglobalriskserm.pdf.
Trope, Y., and N. Liberman. 2003. Temporal construal. Psychological Review 110 (3): 403-421.

216
APPENDIX A: STUDY 2 - EXPERIMENT 1:
CASES AND QUESTIONNAIRE

217
Condition 1: Abstract / Event

218
219

220

221

222

223

224

225

226

227

228

229

230

231

232

233
Condition 2: Abstract / Complement

234

235

236

237

238

239

240

241

242

243

244

245

246

247

248

249
Condition 3: Concrete / Event

250
251

252

253

254

255

256

257

258

259

260

261

262

263

264

265
266
Condition 4: Concrete / Complement

267

268

269

270

271

272
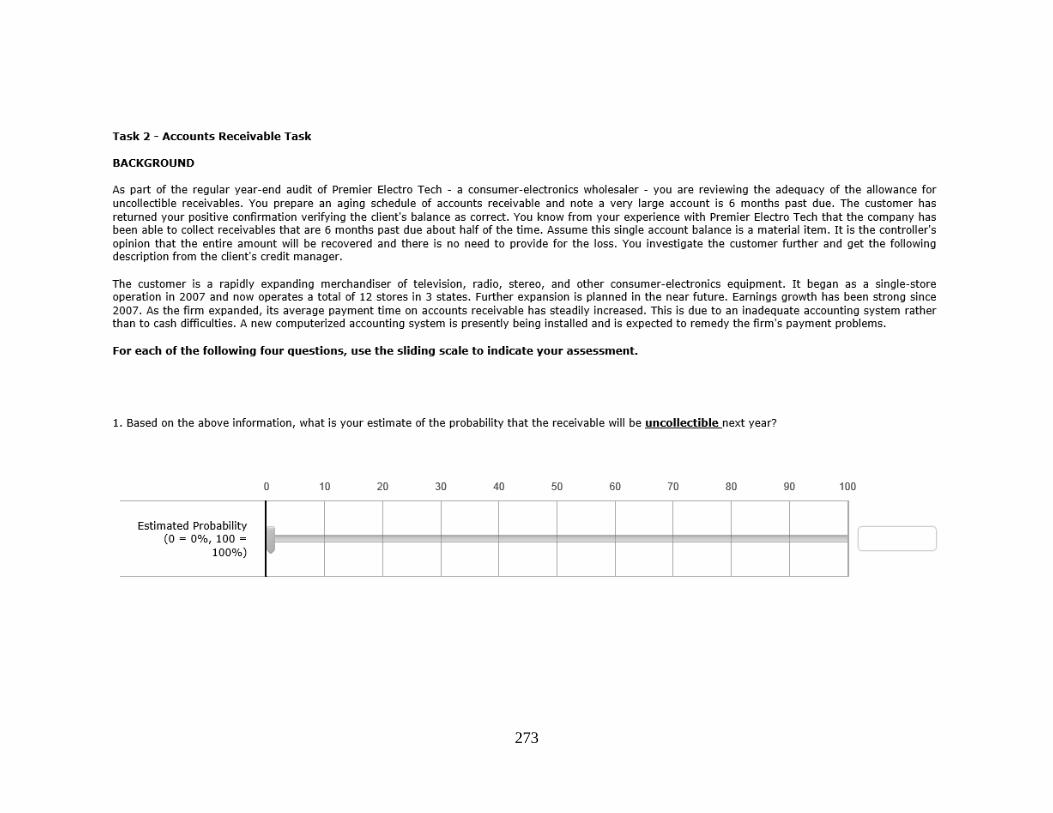
273

274

275

276

277

278

279

280

281

282

283
APPENDIX B: STUDY 2 – EXPERIMENT 2:
CASES AND QUESTIONNAIRE

284
Condition 1: Abstract / Event

285

286

287

288

289

290

291

292

293

294
Condition 2: Abstract / Complement

295

296

297

298
299

300

301

302

303

304
Condition 3: Concrete / Event

305

306

307

308

309

310

311

312

313

314
Condition 4: Concrete / Complement

315

316

317

318

319

320

321

322

323

324
APPENDIX C: STUDY 3 – EXPERIMENT 1:
CASES AND QUESTIONNAIRE

325
Condition 1 – Likely Risk
Research Study Materials
You are invited to participate in a research project conducted by Martin Weisner, Ph.D.
Candidate, and Dr. Steve Sutton, Faculty Supervisor, at the University of Central Florida. You
will be asked to answer questions that will take about 10 minutes of your time. There are no
anticipated potential risks associated with this study. The purpose of this research is to learn
more about risk managers’ judgment and decision-making processes.
The study provides you with some background information about a hypothetical company and
asks you to assume the role of a risk manager for this company. You will then be asked to render
judgments about the occurrence of specific risks. Questions about your understanding of the case
material and demographic questions are asked at the end of the survey. As the results of this
study could be helpful to risk management practice, it is important that you answer each question
in a serious and thoughtful manner.
Please note that participation in this study is voluntary and your responses will be completely
anonymous. Your name will not be collected, and only aggregated data will be included in any
publications or presentations resulting from this study. If you decide to participate, you have the
right to withdraw your consent or discontinue participation at any time without penalty.
If you have questions, concerns, or complaints you may contact Martin Weisner, Ph.D.
Candidate, Dixon School of Accounting, College of Business at (407) 823-1477 (phone) or at
[email protected] (email) or Dr. Steve Sutton, Faculty Supervisor, Dixon School of
Accounting, College of Business at [email protected]. Since this research involves human
participants, it has been approved by the Institutional Review Board (IRB) at the University of
Central Florida. For information about the rights of people who take part in research, please
contact: Institutional Review Board, University of Central Florida, 407-823-2901 (phone) or
[email protected] (email).
By continuing on to the following pages, you are indicating that you understand the above
information and voluntarily consent to participate in the research. You are also affirming that
you are at least 18 years of age. Thank you very much for agreeing to participate.

326
BACKGROUND
Assume you and your family have lived in Orlando, FL for the last 10 years. A few years
ago, you accepted a risk management position with ABC Company, a company that is also
located in Orlando, FL. Since you started your job with Orlando-based ABC, you have been
promoted several times and you are now the leader of a corporate team in charge of risk
management. You and your entire team are based at ABC’s headquarter in Orlando, FL, not far
from where you live.
ABC is a publicly traded electronic equipment manufacturer that sells its products in over 80
countries. The company operates subsidiaries across the globe and has recently established two
additional subsidiaries. One of the subsidiaries is located in Lake Mary, FL less than 20 miles
from ABC’s headquarter; the other subsidiary is located in Minneapolis, MN, around 1,600 miles
from ABC’s headquarter. The operations of both subsidiaries are considered temporary (15-year)
projects that are expected to contribute significant to ABC’s bottom line. Both subsidiaries
specialize in different, but equally profitable product lines in the customized robotic surgery
tools industry.
Your team is in the early stages of developing a formal risk management process for ABC’s
newly established Lake Mary-based and Minneapolis-based subsidiaries. As part of this process,
your team has to consider the occurrence of various risks that - if they occur - have a significant
negative impact on the operations and financial success of the subsidiaries (and thus on ABC). In
line with professional guidelines, your team ranks risk factors into five categories based on the
likelihood of occurrence. The following table illustrates this framework:
Probability Descriptor Definition
Almost certain 90% or greater chance of occurrence over life of project
Likely 65% up to 90% or greater chance of occurrence over life of project
Possible 35% up to 65% chance of occurrence over life of project
Unlikely 10% up to 35% chance of occurrence over life of project
Rare <10% chance of occurrence over life of project
One of the risks under consideration is the risk that a massive cyber-attack leads to a
prolonged interruption of a subsidiary’s order processing capabilities. As a consequence, the
affected subsidiary may be unable to deliver sufficient products for several months. Based on
your teams’ analysis, the probability that such a cyber-attack will target either subsidiary at some
point during their respective project-lifetime is less than 5%. Accordingly, you categorize the
threat of a cyber-attack as “rare”. Further analyses reveal that the overall impact of a cyber-
attack on ABC’s profitability would be equally severe regardless of whether the cyber-attack
targets the Lake Mary-based subsidiary or the Minneapolis-based subsidiary.
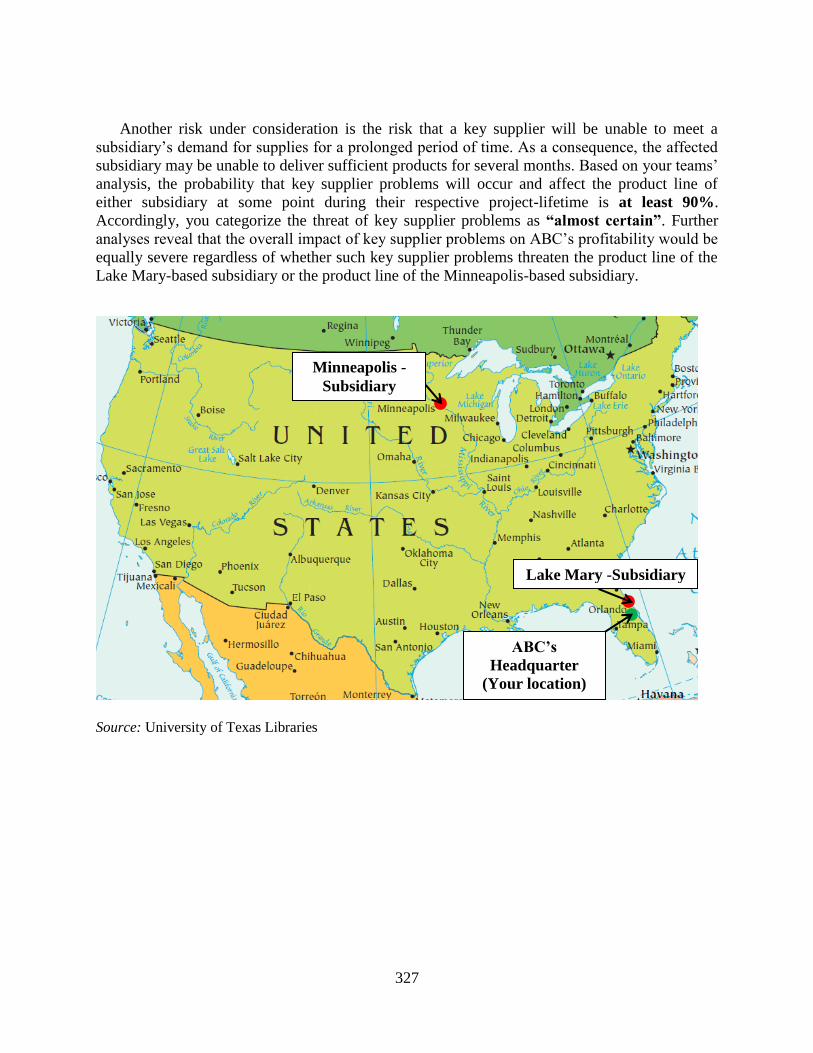
327
Another risk under consideration is the risk that a key supplier will be unable to meet a
subsidiary’s demand for supplies for a prolonged period of time. As a consequence, the affected
subsidiary may be unable to deliver sufficient products for several months. Based on your teams’
analysis, the probability that key supplier problems will occur and affect the product line of
either subsidiary at some point during their respective project-lifetime is at least 90%.
Accordingly, you categorize the threat of key supplier problems as “almost certain”. Further
analyses reveal that the overall impact of key supplier problems on ABC’s profitability would be
equally severe regardless of whether such key supplier problems threaten the product line of the
Lake Mary-based subsidiary or the product line of the Minneapolis-based subsidiary.
Source: University of Texas Libraries
ABC’s
Headquarter
(Your location)
Minneapolis -
Subsidiary
Lake Mary -Subsidiary

328
QUESTION & ANSWER CHOICES:
Note:
You may feel that you do not have sufficient information to adequately respond to the following
question. If this happens, do not worry - the study is concerned with your intuitive judgment.
Instructions:
Assume the highly likely risk (at least 90% chance of occurrence) WILL EVENTUALLY
materialize. Given this assumption, please answer the following question by placing a
checkmark into the appropriate box:
Where do you think the highly likely risk (at least 90% chance of occurrence) will
materialize?
□ Lake Mary subsidiary □ Minneapolis subsidiary

329
PLEASE DO NOT LOOK BACK TO THE CASE SCENARIO WHEN ANSWERING
THE FOLLOWING QUESTIONS:
1. The scenario you just read described that you and your risk management team are located in
Orlando, FL.
______________True
______________False
2. The preceding scenario explained that the impact of a cyber-attack would be equally severe
regardless of which subsidiary would be affected by a cyber-attack.
______________True
______________False
3. The preceding scenario explained that the impact of a key supplier problem would be equally
severe regardless of which subsidiary would be affected by a key supplier problem.
______________True
______________False
4. Please rate your experience with risk management practices?
______________Highly experienced (participated in many risk management projects)
______________Experienced (participated in a several risk management projects)
______________Knowledgeable (participated in at least one risk management project)
______________Indirect experience only (e.g., read about risk management practices;
…………………worked on a student project related to risk management)
______________No experience

330
Biographical Information
RESPONSES TO THE FOLLOWING QUESTIONS WILL BE ANONYMOUS AND
STRICTLY CONFIDENTIAL
PLEASE PROVIDE THE FOLLOWING BIOGRAPHICAL INFORMATION:
1. What is your age?
______________years
2. What is your gender?
______________Male
______________Female
3. How many years of work experience do you have?
______________years
4. Do you plan to work in an accounting, finance, or risk management position upon
graduation?
______________Yes
______________No
______________Don’t know
5. How long have you lived in the Orlando, FL area?
______________Years
______________Months
Thank you for your participation!

331
Condition 2 – Unlikely Risk
Research Study Materials
You are invited to participate in a research project conducted by Martin Weisner, Ph.D.
Candidate, and Dr. Steve Sutton, Faculty Supervisor, at the University of Central Florida. You
will be asked to answer questions that will take about 10 minutes of your time. There are no
anticipated potential risks associated with this study. The purpose of this research is to learn
more about risk managers’ judgment and decision-making processes.
The study provides you with some background information about a hypothetical company and
asks you to assume the role of a risk manager for this company. You will then be asked to render
judgments about the occurrence of specific risks. Questions about your understanding of the case
material and demographic questions are asked at the end of the survey. As the results of this
study could be helpful to risk management practice, it is important that you answer each question
in a serious and thoughtful manner.
Please note that participation in this study is voluntary and your responses will be completely
anonymous. Your name will not be collected, and only aggregated data will be included in any
publications or presentations resulting from this study. If you decide to participate, you have the
right to withdraw your consent or discontinue participation at any time without penalty.
If you have questions, concerns, or complaints you may contact Martin Weisner, Ph.D.
Candidate, Dixon School of Accounting, College of Business at (407) 823-1477 (phone) or at
[email protected] (email) or Dr. Steve Sutton, Faculty Supervisor, Dixon School of
Accounting, College of Business at [email protected]. Since this research involves human
participants, it has been approved by the Institutional Review Board (IRB) at the University of
Central Florida. For information about the rights of people who take part in research, please
contact: Institutional Review Board, University of Central Florida, 407-823-2901 (phone) or
[email protected] (email).
By continuing on to the following pages, you are indicating that you understand the above
information and voluntarily consent to participate in the research. You are also affirming that
you are at least 18 years of age. Thank you very much for agreeing to participate.

332
BACKGROUND
Assume you and your family have lived in Orlando, FL for the last 10 years. A few years
ago, you accepted a risk management position with ABC Company, a company that is also
located in Orlando, FL. Since you started your job with Orlando-based ABC, you have been
promoted several times and you are now the leader of a corporate team in charge of risk
management. You and your entire team are based at ABC’s headquarter in Orlando, FL, not far
from where you live.
ABC is a publicly traded electronic equipment manufacturer that sells its products in over 80
countries. The company operates subsidiaries across the globe and has recently established two
additional subsidiaries. One of the subsidiaries is located in Lake Mary, FL less than 20 miles
from ABC’s headquarter; the other subsidiary is located in Minneapolis, MN, around 1,600 miles
from ABC’s headquarter. The operations of both subsidiaries are considered temporary (15-year)
projects that are expected to contribute significant to ABC’s bottom line. Both subsidiaries
specialize in different, but equally profitable product lines in the customized robotic surgery
tools industry.
Your team is in the early stages of developing a formal risk management process for ABC’s
newly established Lake Mary-based and Minneapolis-based subsidiaries. As part of this process,
your team has to consider the occurrence of various risks that - if they occur - have a significant
negative impact on the operations and financial success of the subsidiaries (and thus on ABC). In
line with professional guidelines, your team ranks risk factors into five categories based on the
likelihood of occurrence. The following table illustrates this framework:
Probability Descriptor Definition
Almost certain 90% or greater chance of occurrence over life of project
Likely 65% up to 90% or greater chance of occurrence over life of project
Possible 35% up to 65% chance of occurrence over life of project
Unlikely 10% up to 35% chance of occurrence over life of project
Rare <10% chance of occurrence over life of project
One of the risks under consideration is the risk that a massive cyber-attack leads to a
prolonged interruption of a subsidiary’s order processing capabilities. As a consequence, the
affected subsidiary may be unable to deliver sufficient products for several months. Based on
your teams’ analysis, the probability that such a cyber-attack will target either subsidiary at some
point during their respective project-lifetime is less than 5%. Accordingly, you categorize the
threat of a cyber-attack as “rare”. Further analyses reveal that the overall impact of a cyber-
attack on ABC’s profitability would be equally severe regardless of whether the cyber-attack
targets the Lake Mary-based subsidiary or the Minneapolis-based subsidiary.

333
Another risk under consideration is the risk that a key supplier will be unable to meet a
subsidiary’s demand for supplies for a prolonged period of time. As a consequence, the affected
subsidiary may be unable to deliver sufficient products for several months. Based on your teams’
analysis, the probability that key supplier problems will occur and affect the product line of
either subsidiary at some point during their respective project-lifetime is at least 90%.
Accordingly, you categorize the threat of key supplier problems as “almost certain”. Further
analyses reveal that the overall impact of key supplier problems on ABC’s profitability would be
equally severe regardless of whether such key supplier problems threaten the product line of the
Lake Mary-based subsidiary or the product line of the Minneapolis-based subsidiary.
Source: University of Texas Libraries
ABC’s
Headquarter
(Your location)
Minneapolis -
Subsidiary
Lake Mary -Subsidiary

334
QUESTION & ANSWER CHOICES:
Note:
You may feel that you do not have sufficient information to adequately respond to the following
question. If this happens, do not worry - the study is concerned with your intuitive judgment.
Instructions:
Assume the highly unlikely risk (less than 5% chance of occurrence) WILL
EVENTUALLY materialize. Given this assumption, please answer the following question by
placing a checkmark into the appropriate box:
Where do you think the highly unlikely risk (less than 5% chance of occurrence) will
materialize?
□ Lake Mary subsidiary □ Minneapolis subsidiary

335
PLEASE DO NOT LOOK BACK TO THE CASE SCENARIO WHEN ANSWERING
THE FOLLOWING QUESTIONS:
5. The scenario you just read described that you and your risk management team are located in
Orlando, FL.
______________True
______________False
6. The preceding scenario explained that the impact of a cyber-attack would be equally severe
regardless of which subsidiary would be affected by a cyber-attack.
______________True
______________False
7. The preceding scenario explained that the impact of a key supplier problem would be equally
severe regardless of which subsidiary would be affected by a key supplier problem.
______________True
______________False
8. Please rate your experience with risk management practices?
______________Highly experienced (participated in many risk management projects)
______________Experienced (participated in a several risk management projects)
______________Knowledgeable (participated in at least one risk management project)
______________Indirect experience only (e.g., read about risk management practices;
…………………worked on a student project related to risk management)
______________No experience

336
Biographical Information
RESPONSES TO THE FOLLOWING QUESTIONS WILL BE ANONYMOUS AND
STRICTLY CONFIDENTIAL
PLEASE PROVIDE THE FOLLOWING BIOGRAPHICAL INFORMATION:
6. What is your age?
______________years
7. What is your gender?
______________Male
______________Female
8. How many years of work experience do you have?
______________years
9. Do you plan to work in an accounting, finance, or risk management position upon
graduation?
______________Yes
______________No
______________Don’t know
10. How long have you lived in the Orlando, FL area?
______________Years
______________Months
Thank you for your participation!

337
APPENDIX D: STUDY 3 – EXPERIMENT 2:
CASES AND QUESTIONNAIRE

338
Condition 1: Proximate / Operational

339

340

341

342

343

344

345

346

347

348

349

350

351
Condition 2: Proximate / Non-Operational

352

353

354

355

356

357

358

359

360

361

362
363

364
Condition 3: Remote / Operational

365

366

367

368

369

370

371

372

373

374

375

376

377
Condition 4: Remote / Non-Operational

378

379

380

381

382

383

384

385

386

387

388

389

390
APPENDIX E: IRB APPROVALS

391

392

393

394

395

396

397

398