three essays on land ownership, gender, and agricultural
TRANSCRIPT

Louisiana State UniversityLSU Digital Commons
LSU Doctoral Dissertations Graduate School
2015
Three Essays on Land Ownership, Gender, andAgricultural Productivity in The Case ofDeveloping CountriesKrishna H. KoiralaLouisiana State University and Agricultural and Mechanical College, [email protected]
Follow this and additional works at: https://digitalcommons.lsu.edu/gradschool_dissertations
Part of the Agricultural Economics Commons
This Dissertation is brought to you for free and open access by the Graduate School at LSU Digital Commons. It has been accepted for inclusion inLSU Doctoral Dissertations by an authorized graduate school editor of LSU Digital Commons. For more information, please [email protected].
Recommended CitationKoirala, Krishna H., "Three Essays on Land Ownership, Gender, and Agricultural Productivity in The Case of Developing Countries"(2015). LSU Doctoral Dissertations. 2208.https://digitalcommons.lsu.edu/gradschool_dissertations/2208

THREE ESSAYS ON LAND OWNERSHIP, GENDER, AND AGRICULTURAL
PRODUCTIVITY IN THE CASE OF DEVELOPING COUNTRIES
A Dissertation
Submitted to the Graduate Faculty of the
Louisiana State University and
Agricultural and Mechanical College
in partial fulfillment of the
requirements for the degree of
Doctor of Philosophy
in
The Department of Agricultural Economics and Agribusiness
by
Krishna H. Koirala
M.S., University of Arkansas at Monticello, 2012
M.S., Louisiana State University, 2015
August 2015

ii
This dissertation is dedicated to my parents, Late Mr. Kul Chandra Koirala and Mrs. Tara
Devi Koirala.

iii
ACKNOWLEDGEMENTS
I would like to express my sincere and deepest appreciation to my major professor and
advisor, Dr. Ashok K. Mishra, for his valuable guidance and support during my doctoral
program. I am grateful to him for advising me at various points of my program. I am able to my
finish my whole doctoral study within three years due to encouragement and motivation from
him. He further encouraged me to do my second master degree here in Louisiana State
University. His academic experience and initiative have greatly smoothed my academic path.
I am also thankful to my other committee members, Dr. Jeffrey Gillespie and Dr. Mark
Schafer for their continuous support and guidance during my doctorate degree. My sincere
thanks go to Dr. Prasanta Subudhi, who served as a Dean’s Representative for my proposal
defense and final examination of this degree. I would like to extend my sincere gratitude and
appreciation to Dr. Cramer (Department Head), Dr. Detre, and Dr. Fannin for providing me
valuable suggestion, whenever needed.
This research would not have been possible without the continuous support of my loving
wife, Diwa Poudel. Thank you for your love and support all these years through graduate school.
I am very grateful to my colleague and officemate, Aditya Raj Khanal, for his help and support
during completion of my doctoral study. Similarly, I am very grateful to my colleagues and
friends Arun, Basu, Isaac, Trina, Joo, Madhav, Surendra and Vikash for all their support during
my doctoral program. I would also like to express my gratitude to the Nepalese Student
Association at LSU and whole Nepalese community of Baton Rouge for making me feel like
home away from home.
Last but not least, this journey has been impossible without support of my family. I
would like to express my deepest gratitude to my parents Late Mr. Kul Chandra Koirala and Mrs.

iv
Tara Devi Koirala. Also, I would like to express thanks to my father-in-law and mother-in-law
for their support and suggestion. Final thanks go to my brothers, brothers-in-law, sisters, and
sisters-in-law, and to all nephews for all things they have provided and done for me in my life.
v
TABLE OF CONTENTS
ACKNOWLEDGEMENTS ........................................................................................................... iii
ABSTRACT .................................................................................................................................. vii
CHAPTER 1: INTRODUCTION ................................................................................................... 1
1.1. Objectives of the Study ........................................................................................................ 6
CHAPTER 2: IMPACT OF LAND OWNERSHIP ON PRODUCTIVITY AND EFFICIENCY
OF RICE FARMERS: THE CASE OF THE PHILIPPINES ......................................................... 7
2.1. Introduction .......................................................................................................................... 7
2.2. Land Ownership in the Philippines ...................................................................................... 9
2.3. Literature Review ............................................................................................................... 12
2.4. Data .................................................................................................................................... 16
2.5. Econometric Model ............................................................................................................ 18
2.5.1. Stochastic Production Frontier (SPF) Models ............................................................. 19
2.5.2. One-step SPF ............................................................................................................... 20
2.5.3. Functional Forms and Variables .................................................................................. 21
2.6. Results and Discussion ....................................................................................................... 22
2.7. Summary and Conclusions ............................................................................................. 26
2.8. References ...................................................................................................................... 28
CHAPTER 3: THE ROLE OF GENDER IN AGRICULTURAL PRODUCTIVITY: THE CASE
OF THE PHILIPPINES ................................................................................................................ 32
3.1. Introduction ........................................................................................................................ 32
3.2. Literature Review ............................................................................................................... 34
3.2.1. Gender Status in the Philippines .................................................................................. 34
3.2.2. Previous Findings ........................................................................................................ 35
3.3. Econometric Model ............................................................................................................ 38
3.4. Data .................................................................................................................................... 42
3.5. Results and Discussion ....................................................................................................... 44
3.6. Summary and Conclusions ................................................................................................. 52
3.7. References .......................................................................................................................... 53
CHAPTER 4: FARM INPUT SUBSIDY PROGRAM AND TECHNICAL EFFICIENCY OF
RURAL MALAWIAN HOUSEHOLDS: DOES GENDER MAKE A DIFFERENCE? ............ 57
4.1. Introduction ........................................................................................................................ 57
4.2. Literature Review ............................................................................................................... 61
4.2.1. Agricultural Sector of Malawi ..................................................................................... 61
4.2.2. Previous Findings ........................................................................................................ 64
4.3. Data .................................................................................................................................... 68
4.4. Econometric Methods ........................................................................................................ 71
4.5. Results and Discussion ....................................................................................................... 73
4.6. Summary and Conclusions ................................................................................................. 79
4.7. References .......................................................................................................................... 80

vi
CHAPTER 5: CONCLUSION ..................................................................................................... 84
VITA ............................................................................................................................................. 86
vii
ABSTRACT
The first essay investigates the impact of land ownership on the productivity and
technical efficiency of rice farmers in the Philippines. We use a 2007-2012 Loop Survey from
the International Rice Research Institute (IRRI) and analyzed it by using a stochastic frontier
function method. Results show that land ownership has a significant impact on technical
efficiency. In particular, counter to the theory, the Comprehensive Agrarian Reform Policy
(CARP) may have reduced the technical efficiency of leasehold farmers compared with owner
operators. Additionally, results show that land area, fuel cost, fertilizer cost, irrigation cost, and
labor cost are significant factors that affect rice production. We found a mean technical
efficiency score of 0.79—still leaving room for improvement.
The second essay investigates the impact of gender on rice production using the average
treatment effect and farm level data from the Philippines. Results indicate that female-headed
farm households, despite having limited access to land, have a higher value of rice production
than their male counterparts. However, there is no significant difference between net farm
incomes earned by male- and female-headed farm households. Female-headed households have
higher fixed costs, consequently earning less total household income. Findings from this study
indicate that women are less efficient in farming, but are more likely to adopt improved seed
varieties. In addition, female-headed farm households are better at controlling farming costs.
The third essay examine how gender affects technical efficiency using a case of maize
production in Malawi. Maize is a staple food crop in sub-Saharan Africa. Using the third
Integrated Household Survey data from Malawi and stochastic production frontier, we estimate
maize productivity and technical efficiency in Malawi for male-headed and female-headed farm
households, separately. Results show that, contrary to expectations, technical efficiency is 5%
higher for female-headed farm households than for male-headed farm households.
1
CHAPTER 1: INTRODUCTION
Demand for agricultural products is expected to increase faster than their production in
the developing countries. A high rate of population growth and income growth is a major factors
for rapid increase in demand in such countries.1 Rice, wheat, and maize are the three major food
crops in the world, sharing 42% of all calories consumed by the entire human population.
According to Childs (2014), global rice production for 2014/15 is projected to be about 475
million tons (milled basis), while global rice consumption in the same period is projected at a
record level of about 483 million tons—leading to a deficit of about 8 million tons. Among these
three major food crops, rice is the most important field crop. Rice farming is the single most
important source of income and employment for the rural population in most developing
countries (GRiSP, 2013). Rice is mainly cultivated in South Asia, including Philippines. African
countries like Malawi and Senegal are also producers and consumers of rice.
The Philippines, a developing country, has a land area of 30 million hectares and only a
third of it is devoted to agriculture. Coconut is the most widely planted crop followed by rice,
corn, banana, pineapple, and others. Rice leads both in planted area and production and is a
staple food for most Filipinos. Incidentally, the Philippines is the world’s eighth-largest rice
producer.2 More than 70 percent of the population is dependent on agriculture. With an area of
4.2 million hectares of rice lands3, Philippines produce about 11 million metric tons (MT) of
milled rice, sufficient for about 90% of its population.
1 USDA, Economic Research Service; Developing countries dominate world demand for agricultural products.
http://www.ers.usda.gov/amber-waves/2013-august/developing-countries-dominate-world-demand-for-agricultural-
products.aspx#.VGonIvmwJBY 2 Philippines produced 18.44 million Metric Tons of rice in 2013, which was 2.5% higher than 2012. Source:
http://countrystat.bas.gov.ph/?cont=10&pageid=1&ma=A10PNVCP 3 3.01 million hectares are irrigated and 1.2 million hectares are non-irrigated land.
2
The Philippines, being the top rice importer country in the world, purchases 1 to 2 million
metric tons (10% of total rice consumption) each year from Thailand and Vietnam (GRiSP,
2013). USDA/ERS (2014) reports that the Philippines 2015 import forecast would rise to about 2
million tons. Bordey (2010) stated that the Green Revolution’s seed-fertilizer technology and
access to irrigation facilities resulted in an increase in rice production by three fold from1970 to
2008. According to Mariano et al., (2012), the establishment of two rice research and
development institutions, namely the Philippine Rice Research Institute (PhilRice) and the
International Rice Research Institute (IRRI), paved the way for the extensive development of
modern rice technologies in the Philippines.4
Findings from previous research studies (GRiSP, 2013; Vargas, 2003) indicated that
climate change, growing population, declining land area, high cost of inputs, poor drainage,
inadequate irrigation, and improper land reform policies are the major constraints to rice
production in the Philippines. Additionally, agricultural land area has been decreasing due to the
conversion to the resettlement areas and industrialization (Reynaldo, 2000). Among several
constraints to rice production, land reforms and underdeveloped land rental markets are the
major constraints in the Philippines.5
Land reform in the Philippines was designed with the objective of redistribution and
correction of inequalities in the distribution of land ownership. The Comprehensive Agrarian
Reform Policy of 1988 (CARP6) was designed to restrict ownership ceilings to 7 hectares. The
land reform policy prohibits the transfer of awarded land except by hereditary succession
4 International Rice Research Institute was established in 1960 while Philippine Rice Research Institute was
established in November, 1985; both are working to make Philippines self-sufficient country in terms of rice. 5 Philippines have one of worse land tenure systems in the world. See more details Vargas (2003). 6 Under CARP, by end of 2012, 4.49 million hectares land are acquired and distributed, which is 84% of the 5.37
million hectares targeted for distribution. See more details Fabella (2014).
3
(Ballesteros and Cruz, 2006; Ballesteros and Bresciani, 2008; Vargas, 2003 Otsuka, 1991;
Otsuka et al., 1992). Land reform policies are said to be successful in the land redistribution
when small-scale farmers are able to engage in agriculture, compete in the market, and increase
their capital. Land ownership and land titling would increase on-farm productivity and technical
efficiency. Additionally, land reform activities provide land access to rural farm households.
Land access to rural poor farmers for agriculture is essential for increasing food production thus
enhancing food security and economic development of a country. Land ownership can increase
investment in land and thus improve farmers’ access to credit (Gerstter, 2011). There is lower
productivity of reform land relative to owned land and rental land. Additionally, sales restrictions
of modern reform land makes land sales prices lower compared to owned land (Deininger et al.,
2008). Therefore, the first objective of this study is to analyze impact of the land ownership to
the agricultural productivity and technical efficiency of rice farmers in Philippines.
Lack of land ownership and control of property is the single most important contributor
to the gender gap in women’s economic well-being, social status, and empowerment (Arun,
1999; FAO, 2011). Women face a surprisingly consistent gender gap in access to productive
assets, inputs, and services. Findings from previous studies (Swaminathan et al., 2012; Arun,
1999; FAO, 2011) concluded that asset ownership7 by women has a positive impact on their
status and bargaining power, and thereby enhances individual and household well-being.
Additionally, land ownership can increase investment in land and enables female farmers to
access credit markets. Finally, asset ownership may also reduce domestic violence for women
and have positive effects on children’s nutrition, education, and health.
7 Asset ownership is defined as land ownership and access to input resources.
4
Gender difference, socially adopted norms, is a crosscutting issue that attracts the
attention of development professionals, policy-makers, and researchers. This is mainly due to the
fact that involvement of women has become compulsory in any development intervention. In the
developing countries where agriculture is the backbone of the economy, participation of women
in the field is very high. Agriculture is the most important source of employment for women in
these countries. Women are farmers, workers, and entrepreneurs. Therefore, agriculture and
women have a dual relationship. Women are important to agriculture and agriculture is important
to women (Doss, 2010).
A rapid rise in the number of rural families with women as head of household is mainly
due to migration of male heads of households to urban centers and other countries; there are
many other related events such as single parenting, widows, and divorces. In spite of increased
numbers of women-headed households, women have unequal access to rural land and credit.
Women are more likely to hold low-wage, part-time, and seasonal employment compared to
men. They tend to be paid less even when their qualifications are equal to or higher than men’s.
Additionally, in the context of labor availability to farming, female-headed households face more
labor constraints than male-headed households mainly due to fewer members and more
dependents. With respect to educational attainment, FAO (2011) notes that in most developing
countries gender differences in education are significant as female heads have less education
than their male counterparts. Similarly, there exists a gender gap in the access to new
technologies including machines and tools, improved plant varieties and animal breeds,
fertilizers, pest control measures, and management techniques. Moreover, adoption of improved
technologies is positively correlated with education.
5
In the Philippines, access to resources, both in society and in the family, has traditionally
been skewed toward men. Land ownership is passed to sons through generations in each family.
Credit markets may treat women and men differently in a discriminatory fashion for example, in
Philippines, male entrepreneurs generally have better access to credit and lending from informal
channels whereas micro-lending institutions give more preference to female entrepreneurs.
However, no special credit program has been created by the government for women
entrepreneurs. The issue of gender differentials in relation to farm productivity and technical
efficiency has been of special interest from the standpoint of public policy in developing
counties. Closing the gender gap is a top priority for agriculture, food security, and society.
Gender difference in agricultural productivity is mostly explained by lower access to inputs.
Gender gaps can be observed in the following areas: (1) access to land; (2) rural labor markets;
(3) financial services; (4) social capital, and (5) technology. However, in developing countries,
there have been number of land reform policies to reduce the gender gap in the context of access
to land. Therefore, the objective of the second essay is to analyze the role of gender on net farm
income, total farm output, farming efficiency, production costs, and total household income.
Finally, there is growing literature concerning gender based farm productivity and
technical efficiency issues across Africa. Most of the previous research estimates of male-female
agricultural productivity differences show that male and female farmers are equally efficient in
controlling inputs levels and human capital (Peterman et al., 2001; Gilbert et al., 2002; Thapa,
2008; Horrell and Krishnan, 2007; Doss, 2010; FAO, 2011), while some studies have concluded
that female-headed farm households are more technically efficient than male-headed farm
households (Dadzie and Dasmani, 2010; Oladeebo and Fajuyigbe, 2007). Additionally, FAO
(2011) estimated that female managed plots would increase their yields by 20-30 percent if they

6
had the same access to productive resources as men. On the other hand, some other studies
concluded that male-headed farm households are more efficient than female-headed farm
households (Udry, 1996; Quisumbing et al., 2001; Holden et al., 2001; Ogunniyi and Ajao,
2010).
The gender gap in agriculture is substantial and closing the gap is not an easy task.
However, carefully designed policies, strategies, and projects can work within existing cultural
norms through the public and private sectors. The dominance of female labor (ranges from 30-80
percent) and a substantial gender gap in agricultural productivity (ranges from 4 to 40 percent)
are the prominent features of African agriculture (Palacios-Lopez and Lopex, 2014).
Additionally, women have less authority for higher average return crop commodities. It is not
surprising to see the presence of gender differences in the rural sector of Malawi. The prime
motivation of this study is the disparity of women in agriculture and the significant gender gap in
agricultural productivity in Malawi. Therefore, the objective of this third essay is to analyze
gender differences on farm productivity and technical efficiency of rural Malawian households.
1.1. Objectives of the Study
The objectives of this study are to determine:
1. The impact of land ownership on productivity and efficiency of rice farmers of
Philippines.
2. The role of gender on agricultural productivity in the Philippines: an average treatment
effect model.
3. The farm productivity and technical efficiency of rural Malawian households: does
gender make a difference?
7
CHAPTER 2: IMPACT OF LAND OWNERSHIP ON PRODUCTIVITY AND
EFFICIENCY OF RICE FARMERS: THE CASE OF THE PHILIPPINES
2.1. Introduction
Agriculture is the main source of income in many developing countries and increased
agricultural productivity has the potential to increase farming income and alleviate poverty in
rural areas. Rice is the single most important agricultural crop in the Philippines, and is therefore
a major source of income for millions of Filipino farmers (Bordey, 2010; Koide et al., 2013).8
Interestingly, rice production in the Philippines increased from 5.32 million metric tons in 1970
to 16.82 million metric tons in 2008. However, because of natural disasters (such as strong
typhoons9), production declined to 15.77 million metric tons in 2010. In 2011, rice production in
the Philippines showed a remarkable improvement and production rose to 16.68 million metric
tons. This increase could be attributed to an increase in total area allocated to rice farming, which
increased by 3.4% during 2011-2012. On the other hand, rice yield increased significantly from
3.71 metric tons per hectare in 2011 to 3.84 metric tons per hectare in 2012. This increase can be
mainly attributed to improved seed-fertilizer technology and increased access to irrigation
facilities.
The literature (Diagne et al., 2013; Rola, 1990; Timmer, 2012) points to several factors,
such as the world food crisis in 2008, high prices of agricultural inputs, limitations on land
ownership, and rising population, that set the Philippines back in its rice-self-sufficiency
efforts—resulting in higher rice imports. The Philippines’ high dependence on rice imports
exposes the country to international market shocks and may have a serious risk for food security
8 The Filipino government still imports rice (about a million tons of rice per year). On average, 20% of the Filipino
household’s food expenditure is allocated to rice. Hence, a slight increase in the price of rice will greatly affect the
standard of living for most Filipinos. 9 Philippines Rice Industry. http://pinoyrkb.com/main/resources/facts-and-figures.

8
(Dawe et al., 2006; Timmer, 2012). Self-sufficiency in rice is a primary goal of agricultural
policy in the Philippines; achieving rice security is directly related to the nation’s struggle in
eliminating extreme hunger and poverty. The access of rural poor people to land for agriculture
is essential for food security and economic development in the Philippines. Finally, the
Philippine government in 2010 implemented a program to support rice self-sufficiency, which
mandated a reduction in imports by 70% from 2.3 million tons in 2010 to 707 thousand tons in
2012.10
Agricultural farms in the Philippines are heterogeneous. On the one hand, you have
small groups of farmers who operate large farms; on the other hand, many farmers operate small
subsistence farms—a large majority of which are still practicing traditional agricultural systems.
The land resource in the Philippines is the major limiting factor in rice production and the cause
of increased imports. Recent data show that the Philippines harvested only 4.69 million hectares
of rice in 2012 compared to major rice-producing countries in Asia. For example, during the
same time period, India, China, Indonesia, and Thailand harvested 44, 29, 12, and 10 million
hectares of rice, respectively. According to the International Rice Research Institute (IRRI,
2014), the main factors that make the Philippines a rice-importing country are (1) limited land
area, (2) population growth, (3) diet, (4) weather, (5) old infrastructure, and (6) lack of land
ownership.
Economic theory predicts that the lack of land ownership may restrict farmers’ access to
land and also access to credit that are required for improved land practices. Since the land is
central to agricultural development, it has attracted the attention of both researchers and
policymakers in the developing countries (Abdulai et al., 2011; Ballesteros and Bresciani, 2008;
10 IRRI. http://irri.org/our-work/locations/philippines.

9
Arun, 1999; Ding, 2013). Land income is the major contributor to farm income. The land rental
market is an important institution in Filipino agriculture. The Filipino government has enacted
several land reform policies to improve accessibility to land. The Philippine land reform law
applies only to tenant areas growing rice and corn. The most recent policy, the Comprehensive
Agrarian Reform Program (CARP), was enacted in 1988 (but is still not fully implemented11), to
redistribute agricultural land to landless farmers and tenants. These land reforms have stipulated
that no more than 7 hectares of all cropland could be owned (Vargas, 2003). The CARP could
have an adverse effect on the efficiency of the land rental market. It may constrain rental activity
because of the possibility that leasing of lands awarded under the CARP could lead to rental
disputes and/or the cancellation of awarded rights to land—perhaps resulting in higher land
rental rates.12
With the self-sufficiency goal in mind, higher rental rates for land could result in a loss of
rice productivity and technical efficiency. Therefore, the objective of the study is to assess the
impact of land ownership on rice production and technical efficiency (TE) of rice producers in
the Philippines. Specifically, using recent farm-level pooled data (2007-2012), we investigate
whether land ownership has an impact on technical efficiency.
2.2. Land Ownership in the Philippines
The Philippines is an archipelago of about 7,100 islands off the coast of Southeast Asia. It covers
an area of 300,000 square kilometers, of which 298,170 square kilometers are land. The
geography of the Philippines has implications for land use and tenure relations. Land of the
Philippines is categorized in two basic categories, namely Alienable and Disposable (A&D)
11 Though the law was passed in 1988, the implementation of the law has been slow and has been extended until the
end of 2014. 12 Note that renting land is across farm sizes and forms, with share tenancy as the most common arrangement on
farms (Ballesteros and Bresciani, 2008; Estudillo et al., 2000).

10
(14.2 million hectares) and protected areas (15.88 million hectares). The A&D type of land is
mostly privately owned (65%) or state-owned but eligible for transfer to private hands.
According to Vargas (2003), the Philippines has one of the worst land tenure problems in the
developing world. The size of landholdings is a major determinant of household income in an
agrarian community such as the Philippines, where the people depend on farm production
(Estudillo et al., 2000). In spite of having a lot of land in the Philippines, much of it is
mountainous or made up of small islands, and those areas are unsuitable for rice production.
Therefore, land area for growing rice is limited in the Philippines.
The first major land reform law (Presidential Decree, 1972) was passed in 1972—also
known as Operation Land Transfer (OLT), which outlawed tenancy, in particular sharecropping.
The OLT program, which transferred land to others, was applied in the case of excess land more
than 7 hectares. Sharecropping was the preferred contract. Thus, the main objective of the land
reform program was to convert a leasehold land (land shared by farmers with a landlord)
situation to a share tenant (land leased with money for some years) situation. A Certificate of
Land Transfer (CLT), a program that transferred land to eligible tenants, provided rights to
purchase land by paying amortization fees. A CLT holder was required to pay amortization fees
to the Land Bank within 15 years in the Philippines. In spite of having a retention limit, certain
landlords register excess holdings in the names of sons, daughters, and close relatives (Otsuka,
1991; Otsuka et al., 1992).
Operation leasehold (LHO), a parallel program, absorbed tenants and landlords not
covered by OLT. Since small landlords (7 hectares or less) were exempted from OLT, their
tenants were not eligible to receive CLTs. Tenants were not evicted but were presumed to have
shifted from share tenancy to a leasehold arrangement (under either an oral or written contract).
11
In 1986, Corazon Aquino’s presidential campaign put forth a land reform first priority—“Land-
to-the-Tiller”—slogan. The land reform commission was formed in July 1987, Aquino
proclaimed the Comprehensive Agrarian Reform Program (CARP) and Congress passed the
CARP in 1988. The major purpose of the land reform program was to transfer land to actual
cultivators (Estudillo et al., 2000). The CARP was enacted to redistribute public and private
agricultural lands to farmers and farmworkers who were landless. The CARP’s vision was to
have equitable land ownership. It prohibited any form of transfer of land for 10 years and
mandated landlords to retain 7 hectares of land. Additionally, under the CARP, any form of
transfer of land awarded under the CARP was prohibited; land exceeding 7 hectares were bought
by the government and sold to landless farmers. Gordoncillo (2012) reported that the CARP was
a major intervention to affect rural development in the Philippines. However, because of current
problems with land titling and registration, the CARP has not been fully implemented.
Nonetheless, land reform activities can improve farming efficiency and productivity.
Land reform activities provide access to land to those with high agricultural ability to farm but
who own little or no land. Findings from previous studies (Ballesteros and Bresciani, 2008;
Tenaw et al., 2009; Kyomugisha, 2008) conclude that small farms tend to be more productive
than large farms from land reform activities. Tenaw et al. (2009) stated two reasons why there
was a positive link between access to land and agricultural productivity. Land ownership
eliminates the anxiety and uncertainty of expropriation, which encourages farmers to make long-
term investment decisions on land and to adopt best cropping systems. Similarly, it makes it easy
for farmers to use the land as collateral for credit. Therefore, access to land enables farmers to
make a durable investment and helps to intensify production systems in inputs, thus boosting
agricultural productivity. In another study, Kyomugisha (2008) stated that land tenure was an

12
important institutional factor that promotes investment in agricultural technology and enhances
the productivity of the land. Today, land tenure systems in the Philippines can be classified into
three categories: fully owned land, share tenant land, and leasehold land. Fully owned land refers
to land operated with a title of ownership in the name of the holder and, consequently, the right
to determine the nature and extent of the use of the land. Fully owned land is also land
categorized under the CLT and OLT program. Share tenant land refers to rented lands wherein
the rental arrangement is in the form of a share of the produce or harvest. Finally, leasehold land
refers to land that is cultivated by a lessee, which belongs to or is legally possessed by another,
the lessor. This category also includes land cultivated under borrow, pawned-in, mortgaged-in,
and rented-in. The rental payment is in the form of a fixed amount of either money or produce, or
both.
2.3. Literature Review
Several studies have investigated rice productivity and technical inefficiency of rice
production in developing countries (e.g., see Dawson and Lingard, 1989; Battese and Coelli,
1992; Tiongco and Dawe, 2002; Abedullah and Mushtaq, 2007; Rahman and Rahman, 2009;
Manjunatha et al., 2013). The frontier production function, developed by Farrell (1957), has been
used to measure technical efficiency of farms. For example, in the early 1990s, Battese and
Coelli (1992), using panel data of 1975-1985 with time-varying firm effects, studied the
production function of paddy farmers in India, and found that the share of irrigated land, farm
area, and labor costs had a positively significant effect on rice production. Similarly, Abedullah
and Mushtaq (2007) investigated production function and technical efficiency of rice producers
in Pakistan using a stochastic production frontier and cross-sectional data. Their findings
indicated that planted area, irrigation hours, and labor hours were positive and significant, while

13
plowing hours and amount of fertilizer were negatively significant factors affecting rice
production. Additionally, they found that age of the farmer and farm size had a significantly
positive effect on technical inefficiency, whereas education and farm mechanization (owning a
tractor) played a significant role in improving farmers’ technical efficiency.
In a recent study, Diagne et al. (2013) investigated rice productivity in the Senegal River
Valley using panel data from 2002-2006 and a fixed effects simplified translog production
function. They found that land, seed, fertilizer, and services had a significantly positive effect on
rice production, while labor costs had a negative effect on rice production. They also obtained
technical efficiency scores ranging between 55% and 60%. Further, the authors found that
fertilizer, herbicides, bird-chasing efforts, date of sowing, and the use of post-harvest
technologies such as a thresher-cleaner significantly improved the technical efficiency of rice
producers. Khai and Yabe (2011) investigated the technical efficiency of rice producers in
Vietnam using a household living standard survey, 2005-2006, and Cobb-Douglas production
function. The authors found that irrigation, education, and labor force had a positively significant
effect on technical efficiency—with 82% technical efficiency.
Using a stochastic frontier model and using data from a Loop Survey, but different years
(1970, 1974, 1979, and 1982), Dawson and Lingard (1989) studied farming efficiency in the
Philippines. Note that initially the Loop Survey was conducted every four years. The authors
estimated four, for each year, different production functions. They concluded that technical
inefficiency is a major reason for deviation from the frontier production function. They
calculated technical efficiencies for each farm in each year and found the highest technical
efficiency score (70%) in 1982. Tiongco and Dawe (2002) studied long-term rice productivity in
the Philippines. They found that long-term productivity was stagnant in important rice-growing
14
areas of the Philippines. The authors concluded that emphasis should be given to crop genetic
yield potential to improve productivity and alleviate poverty in farming households.13
Using Malmquist productivity indices from 1971 to 1990, Umetsu et al. (2003)
investigated regional differences in total factor productivity, efficiency, and technological change
in the Philippine rice sector. They found that cyclical productivity growth was negative during
the early 1970s, positive in the late to early 1980s, and negative in the late 1980s, whereas some
regions, such as Central Luzon, Western Visayas, and Southern and Northern Mindanao, had
higher rates of technological change. They argue that positive growth is mainly due to the
introduction of new rice varieties, while negative growth can be attributed to the intensification
of rice production in lowland farming systems. Using pooled Loop Survey data from 1990 to
1997,14 Villano and Fleming (2004) investigated technical efficiency and production risk in rice
farming in the Philippines. The authors chose rice producers in the rainfed lowland environment
and found a 79% average technical efficiency score during this time period (1990-1997). The
authors found that age of the operator, ratio of adults in the farm household, and off-farm income
had a statistically significant and negative effect, while education had a positive effect on
technical efficiency of rice farmers in the rainfed lowland environment.
In the early part of the 21st century, Yao and Shively (2007) studied technical change and
productive efficiency on irrigated rice farms of the Philippines using panel data, a Loop Survey,
from 1995 to 2002. They concluded that development in irrigation facilities led to a positive gain
in technical efficiency. However, the level of technical efficiency decreased because of both
distance to the irrigation canals and problems related to siltation of irrigation canals. Mariano et
13 Recall that the use of high-yielding varieties during the late 1960s increased rice production from 3.9 million
metric tons in 1961 to 9.6 million metric tons in 1990 (IRRI, 2014). 14 Pooling data during these years led to a dataset of 500 rice producers in the rainfed lowland environment.

15
al. (2011) studied the technical efficiency of rice farms in different agro-climatic zones15 and
pooled farm-level data (1996/97, 2001/2002, and 2006/2007 crop years) from the Philippines.
The dataset used in this study was from the Rice-Based Farm Household Survey (RBFHS)
conducted by the Philippine Rice Research Institute. Using a stochastic metafrontier production
function, the authors found that farm size, amount of seeds, fertilizer, pesticides, labor cost,
irrigation access, and machine cost increased rice productivity. On the other hand, age and
education of the farm operator and non-rice income negatively affected technical efficiency,
while experience and training, and land and machine ownership, had a significantly positive
effect on the technical efficiency of rice producers in all four climatic zones.
As reported above, rice production has been the focus of attention for a number of studies
in the developing countries—especially in South Asia. In the Philippines, several studies have
analyzed the factors that affect rice production and the technical efficiency of rice producers.
However, a potential drawback of these studies is the lack of focus on land ownership.
Specifically, none of the previous studies have analyzed the impact of land ownership on the
technical efficiency of rice producers. Recall that, since the implementation of the CARP (1988),
though it has yet to be fully implemented, land ownership is an issue that is discussed not only
by policymakers but also by farmers and peasants who have a significant stake in land policy
reforms. As mentioned above, land reform and land rental markets are important in the
Philippines. This study focuses on the impact of land ownership on the technical efficiency of
rice farmers in Central Luzon, also known as the “rice bowl” of the Philippines. We use the most
recent pooled farm-level data (2007-2012), collected by the International Rice Research Institute.
15 The authors use four climatic zones—these vary in intensity of sunlight, temperature, and rainfall—in this study
(see Mariano et al., 2011 for details).

16
This time period coincides with the final phase of CARP implementation.16 Finally, we use both
a half-normal and exponential distribution model to investigate which model explains the data
better.
2.4. Data
This study uses pooled farm-level data from the Central Luzon Loop Survey conducted
by the Social Sciences Division of IRRI. Central Luzon is a major rice-producing area of the
Philippines, also known as the “rice bowl of the Philippines” (Koide et al., 2013). This survey
contains detailed information on rice yields, input cost, labor use, land tenure systems, farm
mechanization, culture, and labor practices that is related to rice production. The Loop Survey
began in 1966 and is conducted about once every four years. The main objective of the Loop
Survey is to monitor the changes in rice farming in the Philippines. The Loop Survey collects
data from two domains of rice farming households. One domain is along a loop of the main
highway north of Metro Manila through the provinces of Central Luzon, namely, Bulacan,
Nueva Ecija, Pampanga, Tarlac, Pangasinan, and La Union. The other domain is along a loop
through the towns of Laguna. Most parts of these regions are heavily irrigated. In both domains,
double cropping is normal and the production systems in these two areas are similar. Rice is
established by transplanting and pesticide application has been lower since the mid-1980s.
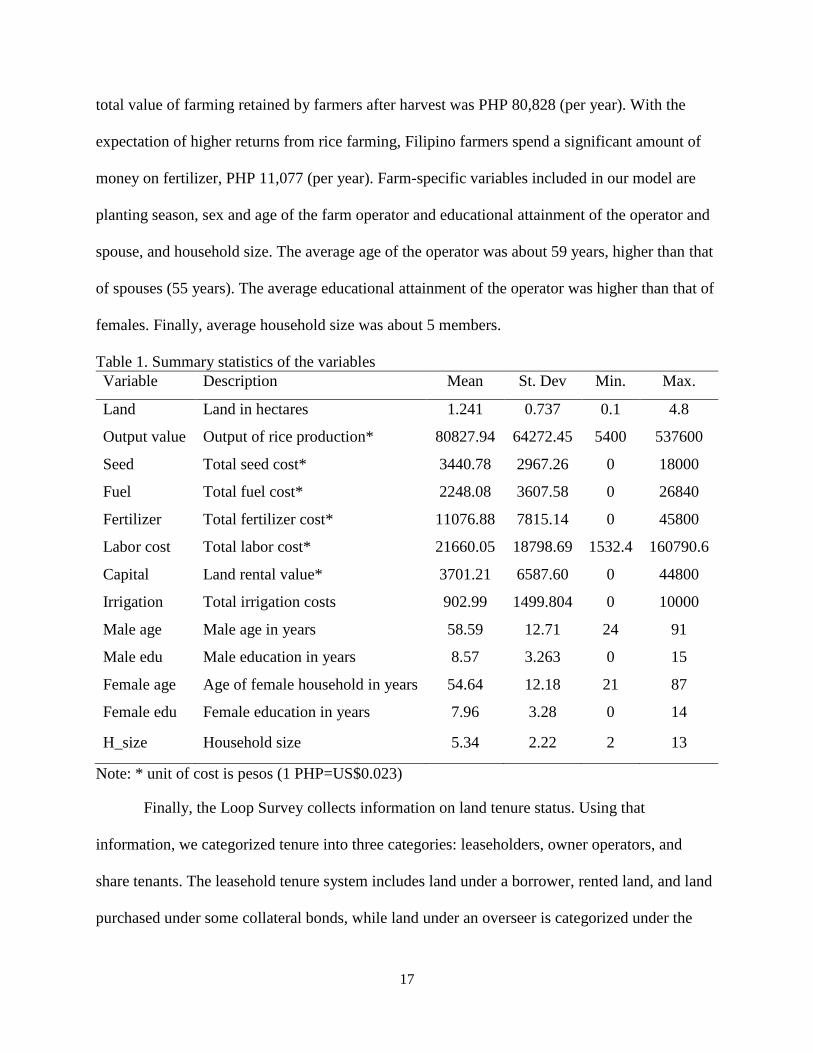
Table 1 presents descriptive statistics of inputs and farm-specific variables to estimate a
stochastic frontier production model using half-normal and exponential methods. There are 324
total number of households for pooled data. Each year on an average number of households
ranges from 75-84. The average Filipino rice farmers in the sample operated, on average, 1.24
hectares, ranging from 0.1 to 4.8 hectares, suggesting a significant variability in farm size. The
16 The author(s) realize that, though the intention of the original bill was to fully implement the CARP by 2013, it
was extended to 2014.
17
total value of farming retained by farmers after harvest was PHP 80,828 (per year). With the
expectation of higher returns from rice farming, Filipino farmers spend a significant amount of
money on fertilizer, PHP 11,077 (per year). Farm-specific variables included in our model are
planting season, sex and age of the farm operator and educational attainment of the operator and
spouse, and household size. The average age of the operator was about 59 years, higher than that
of spouses (55 years). The average educational attainment of the operator was higher than that of
females. Finally, average household size was about 5 members.
Table 1. Summary statistics of the variables
Variable Description Mean St. Dev Min. Max.
Land Land in hectares 1.241 0.737 0.1 4.8
Output value Output of rice production* 80827.94 64272.45 5400 537600
Seed Total seed cost* 3440.78 2967.26 0 18000
Fuel Total fuel cost* 2248.08 3607.58 0 26840
Fertilizer Total fertilizer cost* 11076.88 7815.14 0 45800
Labor cost Total labor cost* 21660.05 18798.69 1532.4 160790.6
Capital Land rental value* 3701.21 6587.60 0 44800
Irrigation Total irrigation costs 902.99 1499.804 0 10000
Male age Male age in years 58.59 12.71 24 91
Male edu Male education in years 8.57 3.263 0 15
Female age Age of female household in years 54.64 12.18 21 87
Female edu Female education in years 7.96 3.28 0 14
H_size Household size 5.34 2.22 2 13
Note: * unit of cost is pesos (1 PHP=US$0.023)
Finally, the Loop Survey collects information on land tenure status. Using that
information, we categorized tenure into three categories: leaseholders, owner operators, and
share tenants. The leasehold tenure system includes land under a borrower, rented land, and land
purchased under some collateral bonds, while land under an overseer is categorized under the

18
share tenant tenure system. In our data, 47% of the rice farmers were owner operators, 33% were
leasehold farmers, and the remaining 11% were classified as share tenants. Data show that,
during 2007-2012, in the Loop Survey region, the share of leasehold and share tenant farmers is
increasing, while at the same time the share of owner operators is decreasing. For example,
owner operators were 52%, 50%, 51%, and 46% in 2007, 2008, 2011, and 2012, respectively.
Likewise, leasehold operators were 30%, 31%, 27%, and 30% in 2007, 2008, 2011, and 2012,
respectively. The data reveal a steady rise in the share tenant farmer category—18%, 19%, 22%,
and 24% in 2007, 2008, 2011, and 2012, respectively. Perhaps this trend can be attributed to the
CARP and other land reform programs in the Philippines.17 It is evident that the land policy
reforms have had a small and perhaps insignificant impact on decreasing the number of share
tenants.
2.5. Econometric Model
Technical efficiency is an important topic studied in agricultural production because of
policy decisions and firms’ ability to use input mixes in the most efficient manner to produce
maximum output. Two approaches have been proposed to determine the technical efficiency of a
firm: parametric and non-parametric. The parametric approach assumes the production
functional form a priori estimation of the data. However, the non-parametric approach uses the
data to determine the functional form. The major limitation of the non-parametric approach is
that it assumes no sampling error and attributes all derivation from the production frontier to
inefficiency (Diagne et al., 2013). In this study, we use the parametric approach to estimate
technical inefficiency.
17 Recall that the CARP and other land reforms in the Philippines have stipulated that no more than 7 hectares of all
cropland could be owned.

19
2.5.1. Stochastic Production Frontier (SPF) Models
The stochastic frontier model is used in studies of production, cost, revenue, profit, and
other models of goal attainment. The stochastic production function is a parametric analysis that
has been commonly used to estimate technical inefficiency. The stochastic production frontier
shows the most efficient use of inputs to produce the maximum output. The stochastic frontier
regression model is a linear regression model having non-normal asymmetric disturbance. It was
originally developed by Aigner et al. (1997) and Meesuen and van den Broeck (1997). It has the
general form:
𝑌𝑖𝑡 = 𝑓(𝑋𝑖𝑡, 𝛽)exp(휀𝑖𝑡) (1)
𝑌𝑖𝑡 = 𝑓(𝑋𝑖𝑡; 𝛽) + 𝑉𝑖𝑡 − 𝑈𝑖𝑡 (2)
where 𝑌𝑖𝑡 is the output of farm 𝑖 (𝑖 = 1,2, …… ,𝑁) in 𝑡 (𝑡 = 1,2, … . . , 𝑇) year; 𝑋𝑖𝑡 is the vector of
inputs; 𝛽 is the vector of parameters to be estimated; and 휀𝑖𝑡 is the error term, which is composed
of two independent elements, 𝑉𝑖𝑡 and 𝑈𝑖𝑡, such that 휀𝑖𝑡 ≡ 𝑉𝑖𝑡 − 𝑈𝑖𝑡. Here, 𝑉𝑖𝑡 is assumed to be
symmetric identically and independently distributed errors that represent random variation in
output due to factors outside the control of farmers. It is assumed to be normally distributed with
mean zero and variance𝜎𝑣2. It is also called pure random error, which is linked to productivity.
𝑈𝑖𝑡 express non-negative random variables that represent the stochastic shortfall of outputs from
the most efficient production. It is also called one-sided error and is linked to efficiency.
A random variable𝑈𝑖𝑡 is of particular interest because it measures the percentage by
which a particular observation fails to achieve the frontier, ideal production rate (Greene, 2003).
The firm-specific technical efficiency parameter, 𝑈𝑖𝑡, takes the value of zero for a technically
efficient firm and one for a technically inefficient firm (Kalirajan and Shand, 1989). There are
four distributional frameworks for the inefficiency component: normal-half-
20
normal(𝑢~𝑁[0, 𝜎𝑢2]), normal-exponential (𝑢~exponentialwithparamenter𝜃), truncated
normal, and normal-gamma (𝑢~gammawithparameters𝜃and𝑃). We use the half-normal
and exponential model in this study to compare which model performs better in explaining the
data. In the exponential method, 𝑢𝑖 are independently exponentially distributed with variance𝜎𝑢2.
In the half-normal, 𝑢𝑖 are independently half-normally 𝑁+(µ,𝜎𝑢2) distributed. A frontier
command maximizes the log-likelihood function of a stochastic frontier model by using the
Newton-Raphson method, and the estimated variance-covariance matrix is calculated as the
inverse of the negative Hessian matrix (Belotti et al., 2012).
2.5.2. One-step SPF
Basically, the two-stage estimation approach is used in the estimation of the stochastic
production frontier. Specifically, the first stage involves the specification and estimation of a
stochastic frontier and prediction of the technical efficiency scores. The second stage estimates
the impact of the explanatory factors on the technical efficiency scores obtained in the first stage.
Some previous studies such as Wang and Schmidt (2002), Kumbhakar (1993), Kumbhakar et al.
(1991), Huang and Liu (1994), Reifcheneider and Stevenson (1991), and Battese and Coelli
(1995) stated that the two-stage estimation method is inconsistent and noted that one should use
a single equation model. The second stage contradicts the assumption of independently,
identically, and normally distributed (i.i.d.) inefficiency effects in the stochastic frontier function
(Battese and Coelli, 1995). Wang and Schmidt (2002) stated that the first step of the two-step
procedure is biased if 𝑥and𝑧 are correlated. Further, the first-step regression that ignores 𝑧
suffers from omitted variable problems. Additionally, second-step regression (the effect of z on
inefficiency) is likely to be biased downward, which is true regardless of whether 𝑥and 𝑧 are
correlated. The estimate of 𝛽 will be biased by the omission of𝑧 if 𝑧 affects 𝑦 and if 𝑧 and 𝑥 are
21
correlated. The direction of the bias depends on the direction of the effect of 𝑧 on 𝑢 and the sign
between them. In this study, all the parameters of the stochastic frontier function as well as those
of the inefficiency function were estimated together with a single maximum likelihood
estimation (MLE) procedure.
We can extend equation (2) by introducing heterogeneity in the one-sided inefficiency
(𝑢) as:
𝑦 = 𝑓(𝑥; 𝛽) + 𝑣 − 𝑢
𝑦 = 𝑓(𝑥; 𝛽) + 𝑣 − 𝑢(𝑧, 𝛿′) , 𝑢(𝑧, 𝛿′) ≥ 0,
𝜎𝑢2 = exp(𝛿′𝑧) (3)
where 𝜎𝑢2 is the variance in the inefficiency term. This variation is modeled as a function of
variation in 𝑧 variables. Here, 𝑧 variables include land tenure, socioeconomic, and demographic
variables. Variance in equation (3) is known as variance in inefficiency. In the above equation, 𝑣
is independent of 𝑥, 𝑧,and 𝑢. The technical inefficiency effect 𝑈𝑖𝑡 in equation (2) could be
specified in equation (4):
𝑈𝑖𝑡 = 𝑧𝑖𝑡𝜕 +𝑊𝑖𝑡 (4)
where 𝑊𝑖𝑡 is a random variable and defined by truncation of normal distribution with zero mean
and variance 𝜎2. The technical efficiency score of farms is estimated by the following equation:
𝑇𝐸𝑖 = exp (-�̂�𝑖) (5)
0 < 𝑇𝐸𝑖 < 1 (6)
Here, 𝑇𝐸𝑖 is greater than zero and less than one.
2.5.3. Functional Forms and Variables
The stochastic frontier production function estimated in our study is defined as:
ln 𝑌𝑖𝑡=∝0+∑ 𝛽𝑘𝑙𝑛𝑋𝑘𝑖𝑡𝑘 + 𝑣𝑖𝑡-𝑢𝑖 (7)

22
ln 𝑌𝑖𝑡=∝0+∑ 𝛽𝑘𝑙𝑛𝑋𝑘𝑖𝑡𝑘 + 𝑣𝑖𝑡-𝑢𝑖(𝑧𝑖𝑡, 𝛿′)
where the subscripts i, t, and k represent, respectively, farm, year, and inputs. The dependent
variable, ln 𝑌𝑖𝑡, is the log-transformed value of rice production (in pesos). Here, ∝0and𝛽𝑘are
parameters to be estimated. The independent variable, 𝑙𝑛𝑋𝑘𝑖𝑡, is the log-transformed factors of
production (cost of fertilizer, seed, fuel, and labor, and farm size); 𝑣𝑖𝑡represents random
statistical noise; and 𝑢𝑖≥0 represents technical efficiency. Here, 𝑧𝑖𝑡 includes the land tenure
dummy variables (owner operator, leasehold operator, and share tenant) and age and education
of the male and female members of the household—the farmer and spouse.
2.6. Results and Discussion
We applied a one-stage stochastic production frontier function as discussed by Wang and
Schmidt (2002). A Cobb-Douglas production function was estimated using half-normal and
exponential stochastic production methods. Parameter estimates of both models are presented in
Table 2. The estimated signs of the parameters are as expected. When comparing between the
half-normal and exponential model using a likelihood ratio test, we fail to reject the null
hypothesis (i.e., the half-normal model is the more suitable model).
Consistent with theory, Table 2 indicates that an increase in the quantity of input
increases the quantity of output produced (rice). We found that land area, fuel cost, fertilizer
cost, labor cost, capital, and irrigation cost are significant and have positive and significant effect
on the value of rice. Since all input variables and dependent variables (value of rice output) are
log-transformed, the coefficient represents elasticity. The coefficient of farm size (land area) is
significant and positive at the 5% level of significance. The result implies that a 1% increase in
land size increases the value of rice output by about 0.40% in both models. Another significant
variable is fuel cost. It is significant at the 10% level of significance. Though the coefficient of

23
fuel cost is very low, it indicates that a 1% increase in fuel cost increases the value of rice output
by 0.004%.
Table 2. Estimation of rice production and technical efficiency in the Philippines
Variable Half-normal Exponential
Land area 0.41**(6.71) 0.40**(6.55)
Seed cost 0.003(0.51) 0.003(0.52)
Fuel cost 0.004*(1.87) 0.004*(1.82)
Fertilizer cost 0.029**(3.69) 0.029**(3.79)
Labor cost 0.518**(11.55) 0.519**(11.48)
Capital 0.004*(1.93) 0.004*(1.93)
Irrigation cost 0.004*(1.79) 0.004*(1.74)
Constant 5.940**(13.33) 5.857**(13.16)
Ln𝜎𝑣2 0.007(0.34) -2.53**(-13.83)
Inefficiency components
Male age 0.007(0.34) 0.01(0.35)
Male education -0.015(-0.27) -0.024(-0.28)
Female age 0.005(0.22) 0.007(0.23)
Female education 0.123*(1.68) 0.236*(1.72)
Leasehold ownership 1.002**(2.04) 1.378**(2.12)
Share tenant ownership 0.804(0.98) 1.153(1.08)
Constant -4.244**(-3.15) -6.213**(-3.60)
Log pseudolikelihood -94.56 -94.24
Wald test 1541.72(0.0000) 1531.77(0.0000)
Notes: * and ** indicate significance at the 10 and 5 percent level of significance, respectively. Parentheses have t-
statistics.
Likewise, fertilizer is another important variable that can affect rice production. We
found that fertilizer (both organic and inorganic) cost is significant at the 10% level of
significance. The findings indicate that a 1% increase in fertilizer cost increases the value of rice
output by 0.03%, a much higher effect than that of fuel cost. Similarly, the coefficient of labor
24
cost has a positive and significant impact on output, indicating that a 1% increase in the cost of
labor increases the value of rice output by 0.52% in both the half-normal and exponential model.
In this analysis, labor cost does not include unpaid labor such as family labor. Similarly, capital
(the cost of renting land) is positive and significant at the 10% level of significance, indicating
that a 1% increase in the rental cost of land increases the value of rice output by 0.004%, about
the same effect as fuel cost. The result shows that the cost of irrigation has a positive and
statistically significant effect on the value of rice production.
We turn our attention to the bottom part of Table 2, which provides the estimates for the
factors that affect technical inefficiency. In particular, we are interested in the impact of land
ownership on technical inefficiency (or efficiency, with opposite signs). The results show that,
compared with that of owner operators, the coefficient on leasehold operators is positive and
statistically significant at the 5% level of significance, implying that being a leaseholder operator
(called leaseholders) increases technical inefficiency by 1% compared with owner operators.
This finding may provide some insight into the counterproductive land reform policies that have
been established in the Philippines over the past decades. Recall that, under the CARP,
landowners can legally own only 7 hectares of land and the rest of the land is redistributed to
landless farmers, tenants, and leaseholders. In most cases under such reforms, ownership was
converted from share tenancy to fixed-rent leaseholds, and this yielded technical inefficiency in
rice production—presumably because of the agency problem.18 Another possible explanation is
that farmers who lease land (leaseholders) for farming are less likely to invest in land
improvement activities, resulting in lower output (Abdulai et al., 2011). Additionally, for rice
production, especially with new hybrid rice varieties, investment in land and input improvement
18 Eswaran and Kotwal (1985) point out that, compared with share tenancy, fixed-rent leasehold would provide no
incentive for landowners to provide managerial skills.
25
is highly needed in order to ensure higher yields. Finally, because of the lack of security and
absence of sufficient incentives for returns on investment, farms operated by leaseholders may
not perform efficiently (Otsuka and Hayami, 1988).
Another source of technical inefficiency is the spouse’s education. The coefficient on
female educational attainment is positive and statistically significant at the 10% level of
significance. A plausible explanation is that farm operators are usually males and make day-to-
day farming decisions while spouses tend to work off-farm for additional income. Additionally,
supervision intensity decreases with off-farm wages—off-farm wages increase the opportunity
cost of females’ time. The findings here are consistent with the results obtained by Villano and
Fleming (2004), who found that off-farm income had a negative effect on the technical
efficiency of rice farmers in the rainfed lowland environment. Finally, based on the estimated
production function, we calculated the technical efficiency score of rice farmers in the
Philippines. The technical efficiency (TE) of a given firm is a ratio of its mean production to the
corresponding mean production if the firm used inputs most efficiently. This can be calculated
by subtracting:𝑇𝐸 = 1 − 𝑇 (technical inefficiency). Table 3 shows the summary statistics for
technical efficiency. We found a mean technical efficiency score of about 0.80 with standard
deviation of 0.09. The TE score for rice farmers in the sample ranged from 0.39 to 0.94 across all
farms. The mean TE score for our sample was 0.79 (79%), indicating that rice farmers in the
Philippines can increase rice production by 21% with existing technologies. Our findings are
consistent with the results obtained by Villano and Fleming (2004)—79% TE in Central Luzon,
Philippines (for 1990-1997). Our findings are comparable with the results obtained by Khai and
Yabe (2011), who found a TE score of 82% among Vietnamese rice producers. However, it
should be noted that Khai and Yabe (2011) used cross-sectional data.

26
Table 3. Summary of technical efficiency
Summary statistics Technical efficiency
Mean 0.79
Standard deviation 0.09
Min. 0.39
Max. 0.93
Table 4. Distribution of the TE of Filipino rice farmers
Range of TE Frequency % of farms in TE interval
0.30<TE<=0.40 1 0.31
0.40<TE<=0.50 3 0.92
0.50<TE<=0.60 14 4.29
0.60<TE<=0.70 20 6.13
0.70<TE<=0.80 82 25.15
0.80<TE<=0.90 191 58.59
0.90<TE<=1.00 15 4.60
Total 326 100.00
Technical efficiency 0.79
(0.09)1
Note: 1 standard deviations for technical efficiency in parentheses
Table 4 shows the distribution of technical efficiency of rice farmers in the Philippines. A
higher percentage of farmers (59%), which is 191 farmers out of 326 total farmers, have a TE
score in the range of 80-90%. The table shows that approximately 88% of the rice farmers (in the
sample) achieved technical efficiency of 70% or higher.
2.7. Summary and Conclusions
Agriculture is the main source of income in developing countries and increased
agricultural productivity has the potential to alleviate farmers’ poverty. Improvement in
agricultural productivity is a topic of high importance in these countries. Agricultural farms in

27
developing countries are heterogeneous: although some farms are commercialized, many still
practice traditional agricultural systems. Fifty years after the Green Revolution, the Philippines
continues to struggle to produce sufficient rice to feed its population. Food security is a major
problem in the Philippines and it is largely affected by farmers’ production decisions,
inappropriate land reform programs, and technical inefficiency of rice production. High
production costs, low government support, and a significant decrease in farm productivity are
some of the constraints that have led to a crisis in Philippine agriculture.
Additionally, the Filipino government has enacted several land reform policies to
redistribute agricultural land to landless farmers and tenants. The CARP could have an adverse
effect on the efficiency of the land rental market. It may constrain rental activity because of the
possibility that leasing of lands awarded under the CARP could lead to rental disputes and/or
cancellation of awarded rights to land—perhaps resulting in higher land rental rates. This study
attempted to estimate the rice production function using pooled farm-level (2007-2012)
longitudinal data from the Philippines. Particular attention was given to the role of land
ownership in technical inefficiency.
The findings here suggest that land reforms in the Philippines may have been
counterproductive. Our results indicate that leaseholder operator farms are likely to have lower
technical efficiency. Our analysis shows that the TE level of Filipino rice production is about
79%—still leaving room for improvement under current production methods and technology. An
interesting finding here is that the technical efficiency scores have remained the same over the
2007-2012 time period, compared with 1990-1997. Rice production is affected by farm size,
fuel, fertilizer, labor, and irrigation channels. Technical inefficiency scores tend to increase with
the spouse’s education.
28
2.8. References
Abdulai, A., Owusu, V., & Goetz, R. (2011). Land Tenure Differences and Investment in Land
Improvement Measures: Theoretical and Empirical Analyses. Journal of Development
Economics, 96(1), 66-78. doi: http://dx.doi.org/10.1016/j.jdeveco.2010.08.002.
Abedullah, K. S., & Mushtaq, K. (2007). Analysis of Technical Efficiency of Rice Production in
Punjab (Pakistan): Implications for Future Investment Strategies. Pakistan Economic and
Social Review, (2), 231.
Aigner, D., Lovell, C. A. A., & Schmidt, P. (1977). Formulation and estimation of stochastic
frontier production function models. Journal of Econometrics, 6(1), 21-37.
Arun, S. (1999). Does land ownership make a difference? Women's roles in agriculture in
Kerala, India. Gender & Development, 7(3), 19-27.
Ballesteros, M. M., & Bresciani, F. (2008). Land rental market activity in agrarian reform areas:
evidence from the Philippines (No. 22614). East Asian Bureau of Economic Research.
Battese, G. E., & Coelli, T. J. (1992). Frontier Production Functions, Technical Efficiency and
Panel Data: With Application to Paddy Farmers in India. Journal of Productivity
Analysis, 3(1/2), 153-169.
Battese, G. E., & Coelli, T. J. (1995). A Model for Technical Inefficiency Effects in a Stochastic
Frontier Production Function for Panel Data. Empirical Economics, 20(2), 325-332.
Belotti, F., Daidone, S., Ilardi, G., & Atella, V. (2012). Stochastic frontier analysis using Stata.
Center for Economic and International Studies Tor Vergata Research Paper Series, Vol.
10, Issue 12, No. 251.
Bordey, F. H. (2010). The impacts of research on Philippine rice production (Doctoral
dissertation, University of Illinois at Urbana-Champaign).
Dawe, D., Moya, P., & Casiwan, C. (2006). Why does the Philippines import rice? Meeting the
challenge of trade liberalization. AGRIS, EBSCOhost.
Dawson, P. J., & Lingard, J. J. (1989). Measuring Farm Efficiency over Time on Philippine Rice
Farms. Journal of Agricultural Economics, 40(2), 168-177.
Diagne, M., Demont, M., Seck, P., & Diaw, A. (2013). Self-sufficiency policy and irrigated rice
productivity in the Senegal River Valley. Food Security, 5(1), 55. doi: 10.1007/s12571-
012-0229-5.
Ding, C. (2003). Land policy reform in China: assessment and prospects. Land use policy, 20(2),
109-120.
29
Estudillo, J. P., Quisumbing, A. R., & Otsuka, K. (2000). Income distribution in rice-growing
villages during the post‐Green Revolution periods: the Philippine case, 1985 and 1998.
Agricultural Economics, 25(1), 71-84.
Eswaran, M. and A. Kotwal (1985): A Theory of Contractual Structure in Agriculture. American
Economic Review, 75(3), pp. 352-67.
Farrell, M. J. (1957). The measurement of productive efficiency. Journal of the Royal Statistical
Society. Series A (General), 253-290.
Gordoncillo, P. U. (2012). The economic effects of the comprehensive agrarian reform program
in the Philippines. Journal of ISSAAS (International Society for Southeast Asian
Agricultural Sciences), 18(1), 76-86.
Greene, W.H. 2003. Econometric Analysis. Prentice Hall, New York.
Huang, C. J., & Liu, J. (1994). Estimation of a Non-Neutral Stochastic Frontier Production
Function. Journal of Productivity Analysis, 5(2), 171-180.
IRRI. 2014. International Rice Research Institute. http://irri.org/news/hot-topics/why-does-the-
philippines-import-rice. Accessed in October, 2014.
Kalirajan, K. P., & Shand, R. T. (1989). A generalized measure of technical efficiency. Applied
Economics, 21(1), 25.
Khai, H. V., & Yabe, M. (2011). Technical efficiency analysis of rice production in Vietnam.
Journal of ISSAAS, 17(1), 135-146.
Koide, N., Robertson, A. W., Ines, A. V., Qian, J. H., DeWitt, D. G., & Lucero, A. (2013).
Prediction of Rice Production in the Philippines Using Seasonal Climate Forecasts.
Journal of Applied Meteorology and Climatology, 52(3), 552-569.
Kumbhakar, S. C. (1993). Production Risk, Technical Efficiency, and Panel Data. Economics
Letters, 41(1), 11-16.
Kumbhakar, S. C., Ghosh, S., & McGuckin, J. (1991). A Generalized Production Frontier
Approach for Estimating Determinants of Inefficiency in U.S. Dairy Farms. Journal of
Business & Economic Statistics, (3), 279.
Kyomugisha, E. (2008). Land tenure and agricultural productivity in Uganda. IFPRI Brief.
Washington, DC: International Food Policy Research Institute (IFPRI).
Manjunatha, A. V., Anik, A. R., Speelman, S., & Nuppenau, E. A. (2013). Impact of land
fragmentation, farm size, land ownership and crop diversity on profit and efficiency of
irrigated farms in India. Land Use Policy, 31, 397-405.
30
Mariano, M., Villano, R., & Fleming, E. (2011). Technical Efficiency of Rice Farms in Different
Agroclimatic Zones in the Philippines: An Application of a Stochastic Meta-frontier
Model. Asian Economic Journal, 25(3), 245-269.
Meeusen, W., & van den Broeck, J. (1977). Efficiency Estimation from Cobb-Douglas
Production Functions with Composed Error. International Economic Review, 18(2), 435.
Otsuka, K., & Hayami, Y. (1988). Theories of Share Tenancy: A Critical Survey. Economic
Development & Cultural Change, 37(10), 31-68.
Otsuka, K. (1991). Determinants and consequences of land reform implementation in the
Philippines. Journal of Development Economics, 35(2), 339.
Otsuka, K., Cordova, V., & David, C. C. (1992). Green revolution, land reform, and household
income distribution in the Philippines. Economic Development and Cultural Change, 40,
719-741.
Rahman, S., & Rahman, M. (2009). Impact of land fragmentation and resource ownership on
productivity and efficiency: The case of rice producers in Bangladesh. Land Use
Policy, 26(1), 95-103.
Reifschneider, D., & Stevenson, R. (1991). Systematic Departures from the Frontier: A
Framework for the Analysis of Firm Inefficiency. International Economic Review, 32(3),
715.
Rola, A. C. (1990). Philippine rice policy: Strategies for self-sufficiency, food security and
increasing farm incomes. Philippine Journal of Crop Science, 15(1), 3-12.
Tenaw, S., Islam, K. Z., & Parviainen, T. (2009). Effects of land tenure and property rights on
agricultural productivity in Ethiopia, Namibia and Bangladesh. University of Helsinki
Department of Economics and Management Discussion Papers, (33).
Timmer, C. P. (2012). Behavioral dimensions of food security. Proceedings of the National
Academy of Sciences, 109(31), 12315-12320.
Tiongco, M., & Dawe, D. (2002). Long-Term Evolution of Productivity in a Sample of
Philippine Rice Farms: Implications for Sustainability and Future Research. World
Development, 30(5), 891-898.
Umetsu, C., Lekprichakul, T., & Chakravorty, U. (2003). Efficiency and Technical Change in the
Philippine Rice Sector: A Malmquist Total Factor Productivity Analysis. American
Journal of Agricultural Economics, (4), 943-963.
Vargas, A. (2003). The Philippines Country Brief: Property Rights and Land Markets. National
Parks, Land Tenure Center, University of Wisconsin-Madison, 1, 4-47.
31
Villano, R., & Fleming, E. (2004). Analysis of technical efficiency in a rainfed lowland rice
environment in Central Luzon, Philippines, using a stochastic frontier production
function with a heteroskedastic error structure. Asian Economic Journal 20 (1), 29-46.
Wang, H. J., & Schmidt, P. (2002). One-step and two-step estimation of the effects of exogenous
variables on technical efficiency levels. Journal of Productivity Analysis, 18(2), 129-144.
Yao, R. T., & Shively, G. E. (2007). Technical Change and Productive Efficiency: Irrigated Rice
in the Philippines. Asian Economic Journal, 21(2), 155-168.

32
CHAPTER 3: THE ROLE OF GENDER IN AGRICULTURAL PRODUCTIVITY: THE
CASE OF THE PHILIPPINES
3.1. Introduction
Agriculture is a significant part of the national economy in many Asian countries.19 For
example, agriculture plays a significant role in the Philippine economy, in which nearly 20
percent of the gross domestic product (GDP) comprises agriculture and agriculture-related
enterprises. Additionally, nearly half of the labor force is employed in the agricultural sector;
two-thirds of the population depends on agriculture for its livelihood. Approximately half of all
rural women are classified as economically active; women play important roles in the production
of cash and subsistence crops, and in small livestock rearing. Interestingly, Quisumbing et al.
(2014) note that women comprise about 43% of the agricultural labor force in developing
countries, ranging from 20% in Latin America to 50% in sub-Saharan Africa and East Asia. In
agriculture, the largest number of women workers are involved in the production of rice,
coconut, and banana crops. In addition, women have a principal role in agribusiness, food
processing, marketing, consumer-related activity, and value-added food processing (Lu, 2010).
In most developing countries, women’s actual contribution to food production and the
rural economy remains undervalued, because of which women have less access to productive
resources or assets. For example, Quisumbing et al. (2014) noted that agriculture is
underperforming because half of its farmers—women—do not have equal access to resources
and opportunities. The authors noted that an empowered woman who can make decisions about
planting materials and inputs is more productive in agriculture. Swaminathan et al. (2012)
19 Nearly 50 percent of the economically active women in Asia are in agriculture and they contribute 65 percent of
household food production in Asia.

33
identified inter- and intra-household differences as key drivers of the dynamics affecting the
resource status of most female-headed farm households.20
In the international arena, female-headed farm households are commonly regarded as the
“poorest of the poor” throughout the world mainly because of their low income (Chant, 1997).
Pandey et al. (2010) studied the role of gender in rice farming in the Philippines and found that
gender roles and gender relations within households are strongly influenced by social, cultural,
and economic circumstances, family structure, and the degree of labor participation in the
marketplace. They found that 32% of the agricultural labor force in the Philippines was female
and there was a high incidence of migration of women from rural to urban areas and overseas.
The International Rice Research Institute (IRRI) acknowledges the role of women in the global
rice sector as both paid and unpaid family labor. Women contribute at least half of the total labor
inputs in rice production in Asia and sub-Saharan Africa.21 Some 39-49% of the farming
households in the Philippines hire women workers in both planting and harvesting activities in
rice fields. Women’s participation is also significant in planting and/or transplanting, manual
weeding, care of crops, and harvesting in the rice sector. Male workers are generally engaged in
land preparation, seedbed preparation, leveling, and care of irrigation canals.
Finally, rural women are mostly responsible for meeting the capital needs of the farm and
thus are most likely to engage in off-farm activities to help augment their household income.
Generally, the female labor force participation rate is 50 percent in the Philippines whereas the
male participation rate is 80 percent. An Asian Development Bank (ADB) project in the
Philippines helps to increase women’s influence in the farm decision-making process.22
20 Female-headed farm—female principal operator, the individual, responsible for day-to-day management of the
farm. 21 IRRI: http://irri.org/our-impact/engagine-women. 22 ADB: www.adb.org/sites/default/files/adb-annual-report-2013.pdf.

34
Recently, female-headed farm households have been increasing in the Philippines not only as a
result of widowhood but also of social changes such as the migration of males, awareness of
gender equity in society, and the rise in female labor force participation rates (Miralao, 1992).
A few studies discussed the role of gender using average treatment effect (Zanutto, 2006;
Holland, 1986). For example, Zanutto (2006) studied the effect of gender on salary from
information technology using the average treatment effect method. We may not consider the
effect of gender on outcomes to be a treatment effect in the causal sense because we cannot
manipulate gender. The main motivation of the use of gender in this study is to make descriptive
comparisons of the outcomes of similar female-headed farm households and male-headed farm
households. The role of gender in agriculture gained considerable attention among policymakers,
donors, and researchers in 2012. Consequently, policymakers need more knowledge and stronger
empirical evidence on the role of gender in agriculture and agricultural productivity in particular.
Gender equality can also lead to productivity gains, women’s increased control of household
resources can improve outcomes for the next generation, and empowering women as economic,
social, and political actors can result in more representative decision making. Therefore, the
objective of this study is to assess the impact of gender in rice farming in the Philippines.
Specifically, we investigate how gender affects net farm income, total farm output, farming
efficiency, production costs, and total household income.
3.2. Literature Review
3.2.1. Gender Status in the Philippines
In the developing countries, including the Philippines, gender gaps remain substantial in
terms of economic opportunities, decision making, and access to resources (Illo, 2010).
According to the Global Gender Gap (GGG) Index, introduced by the World Economic Forum
35
(2013),23 the Philippines ranks fifth (GGG Index=0.78) in the world, suggesting a smaller gender
gap between men and women. On the other hand, looking at educational attainment in the
Philippines (GGG Index=1.00), the country ranked first among 136 countries, implying that
there is no gender gap in the schooling of men and women. Similarly, based on economic
participation and opportunity, the Philippines ranked 16th globally (GGG Index=0.78),
indicating a smaller gender gap. Similarly, the report notes that women’s access to land
ownership was at the 0.5 level6, women’s access to credit at 0.5, and women’s access to property
other than land at the 0.00 level. These numbers suggest that a significant gender gap exists for
the access to land ownership, access to credit, and access to property for females.
Filipino women’s actual contribution to food production and the rural economy remains
undervalued if not invisible. As a result, Filipino women have less access to productive resources
than men do. Women farmers toil with their male counterparts in most farm tasks, except for
food preparation, which is usually undertaken by the women, and for ploughing with tractors,
which is usually done by men. Rice production in the Philippines—from selecting the seeds to
uprooting and transplanting the seedlings, and storing the grains—has long been the domain of
women. Filipino women are also mostly responsible for accessing capital needed for farm
production. In addition, many of these women engage in off-farm activities that can help
augment household income (PPI, 2002).
3.2.2. Previous Findings
In the context of rural livelihood, women make essential contributions not only to agriculture
but also to households’ social welfare. Handa (1996) studied expenditure behavior and children’s
welfare for female-headed households in Jamaica and concluded that children from female-
23 World Economic Forum: www3.weforum.org/docs/WEF_GenderGap_Report_2013.pdf.

36
headed households were less likely to suffer from poor health conditions and low educational
outcomes than those from male-headed households. This could be due to the fact that female-
headed farm households are more educated, caring for offspring, and efficient in the use of
household income. Gender differences in developing countries are mainly observed in access to
and use of agricultural inputs, tenure security and related investments in land and improved
technologies, market and credit access, human and physical capital, and informal and
institutional constraints. These factors explain the difference in agricultural productivity between
male-managed plots and female-managed plots (Palacios-Lopez and Lopez, 2014; Peterman et
al., 2011).
Udry et al. (1995) studied gender differentials and farm productivity in African
households and found that plots controlled by women for all crops have significantly lower
yields than plots controlled by men. This is because women have less access to productive
resources and opportunities than men. Quisumbing et al. (2014) argued that, if women had the
same access to productive resources as men, they could increase farm yields by 20-30%.
However, they have less access than men to productive resources and opportunities, especially in
land assets, inputs, financial services, extension, technology, and training in agriculture. Hwang
et al. (2011) studied women’s role in intra-household decision making in Korea and the
Philippines and found that, in spite of playing major roles in agricultural households, women
have less power in the decision-making process. Indeed, in the case of the Philippines, although
women are actively involved in most agricultural work, elder men still own the land, control
women’s labor, and make agricultural decisions.
According to Layton and MacPhail (2013), in a report published by the Asian
Development Bank, women own less land than men. Women are disadvantaged through
37
inheritance laws, land-titling systems, and their ability to purchase land. Women are responsible
for subsistence crops and have less access to cash crops and the resulting income. Layton and
MacPhail (2013) also report that women receive less agricultural extension training and credit in
the Philippines. This is true not only in the Philippines but also in South America. For example, a
study by Fletschner (2008) in Paraguay found that women-headed farm households were unable
to meet their credit needs, and thus unable to produce as much as they possibly could.
Similarly, Hoppe and Korb (2013) studied the characteristics of women farm operators
using census data from 1978 to 2007 in the United States. They found that the share of U.S.
farms operated by women tripled over the past decades, from 5 percent in 1978 to 14 percent by
2007. Their findings note that most women-operated farms are very small, women farm
operators are older and highly educated, their farms are mostly related to livestock, and they
often rely on off-farm work and income. However, Chant (1997) studied women-headed farm
households in the Philippines, Mexico, and Costa Rica and concluded that female household
headship may sometimes be a positive strategy for survival. The reason behind this is that female
household headships are good in the use of resources and are likely to obtain a loan from micro-
lending institutions.
When it comes to tasks performed by women in rural areas, women in the Philippines are
traditionally in charge of budgeting. The cultural setting in the Philippine household is that men
are expected to turn their earnings over to their wives for budgeting and allocation of resources;
however, women complain that their husbands do not turn over all of their income (Ashraf,
2009). In the Philippines, women can own, inherit, acquire, and dispose of property in their own
right but income from the wife’s pre-marriage property is considered conjugal income whose use
is subject to the husband’s consent. In rice-producing villages of the Philippines, daughters
38
typically receive less land and non-land assets than sons (Quisumbing, 1994a). Lu (2010) studied
women in Philippine agriculture and their occupational issues and stated that women’s
engagement in agricultural work is more intense than that of the males. However, they are
marginalized with respect to economic and social empowerment.
3.3. Econometric Model
Treatment effects are designed by matching individuals with the same covariates instead
of through a linear model for the effect of covariates. Treatment effect techniques use
observational data to create groups of treated and control units that have similar covariates values
so that comparisons, made within these matched groups, are not confounded by differences in
covariate distributions. It was initially used in medical research concerned with the causal effects
of binary variables, such as an experimental drug or a new surgical procedure. We applied the
average treatment effect (ATE) to analyze the impact of gender on income and rice production in
the Philippines. ATE basically measures the difference in mean outcomes between units assigned
to the treatment and units assigned to the control (Uematsu and Mishra, 2012; Tauer, 2009). Two
assumptions are that the treatments groups must have overlapping characteristics and firm
characteristics must be unconfounded to reduce selection bias are two assumption necessary for
effective use of the method of matching samples (Gillespie and Nehring, 2014).
We are interested in estimating the average effect of a binary treatment (gender) on the
proxy of rice productivity status: cost of production, farming efficiency, net farm income, total
household income, and value of rice produced. For individual i, i=1,….,N; let {𝑌𝑖0, 𝑌𝑖1} denote
the two potential outcomes: 𝑌𝑖0 as the outcome when the household head is male and 𝑌𝑖1 as the
outcome when the household head is female. In ATE, we have two values: 𝑌𝑖0is the value of the
outcome variable for untreated individual𝑖 and 𝑌𝑖1 is the value of the outcome for treated
39
individual𝑖—in our case, the treatment variable being the female-headed household. The
treatment effect for an individual is expressed as ATE= 𝑌𝑖1 − 𝑌𝑖0. The average treatment effect
for the entire population, population average treatment effect, is given byΕ[𝑌𝑖1 − 𝑌𝑖0]. ATE for
a sample is denoted as1
𝑁∑ (𝑌𝑖1𝑁𝑖=1 − 𝑌𝑖0), where 𝑁is size of the sample. In this method, each
farm is compared with a matching farm. In this method, each farm is compared with a matching
farm. In this paper, we choose average treatment effect for treated because a relatively small
percentage of farms in our Loop survey.
A practical problem with a cross-sectional dataset is that these two groups are mutually
exclusive, which means that we can observe either 𝑌𝑖1 or 𝑌𝑖0. In treatment effects, impact can be
measured in terms of two estimates. We can estimate what would be the cost of production for
male-headed farm households had they are female-headed farm households. Alternatively, we
can estimate such impact on female-headed farm households had they are male-headed farm
households. In this study we estimated average treatment for the treated (ATT) which is
represented as (Khanal et al., 2015)
𝐴𝑇𝑇 = 𝐸[𝑌𝑖1 − 𝑌𝑖0|𝑇 = 1] (1)
where T=1 indicates assignments to the treatment (female-headed farm households); 0 otherwise.
The biggest challenge in treatment effect in observational studies is the fact that
assignment to treatment is not random. In our context, we do not randomly assign farmers to
become female-headed farm households or male-headed farm households. Unlike the
experimental studies where we can set up randomness in treatment and control, individuals often
self-select into the treatment in most of observational research. Thus, observational treatment
effect are not free from self-selection biases. An estimation of ATEs without accounting for self-
selection leads to biased estimation. There are a number of ways developed and suggested to
40
correct for this bias. One of the ways is to use of matching estimators which involves matching
observations between treatment and control groups on the basis of some key observable factors.
There is always an overlap of the characteristics between treated and non-treated groups
after sorting and that can limit for any self-selection bias. Propensity score matching is one of the
matching estimators used in ATE analysis. In propensity score matching, the predicted
probability score of being in the treatment is estimated using either a logit or a probit model
(Becker and Ichino, 2002). In propensity score matching, a female-headed household will be
matched to a male-headed household with some similar characteristics, thereby ensuring that
dissimilar households and outliers will have no/little influence on the treatment impact. The
propensity score, defined by Rosenbaum and Rubin (1983), is expressed as
𝑝(𝑋) ≡ Pr{𝐷 = 1|𝑋} = 𝐸{𝐷|𝑋} (2)
where 𝐷 = {0,1} is the indicator of exposure to treatment and 𝑋 is the multidimensional vector
of pre-treatment characteristics.
In this study, we use the nearest neighbors-matching estimator developed by Abadie and
Imbens (2011). Each unit is used as a match more than once because matching is done with
replacement. Matching with replacement reduces biases in our analysis. The nearest neighbor-
matching estimator summarizes information from a multiple covariate into a single index using
the vector norm‖𝑥‖𝑣 = (𝑋′𝑉𝑋)1/2, where V is a positive definite matrix. The nearest neighbor-
matching sets define the minimum distance between two observations and this is represented as
‖𝑧 − 𝑥‖𝑣, where z and x are the vectors of observable characteristics for two observations. The
estimator for ATT is defined as
𝐴𝑇𝑇 =1
𝑁1∑ [𝑌𝑖1𝑁1𝑖:𝑇1=1
− 𝑌𝑖0́̇ ] (3)

41
where 𝑁1 is the number of observations in the treatment and the subscript 𝑖 represents individual
observations, whereas 𝑌𝑖1 is the observed outcome and 𝑌𝑖0́ is an unobserved variable for the 𝑖th
individual. An unobserved variable is expressed as
𝑌𝑖0́ = {𝑌𝑖 𝑖𝑓𝑇𝑖 = 01
𝑀∑ 𝑌𝑚𝑖𝑓𝑇𝑖 = 1𝑚∈𝑀𝑖
(4)
where 𝑀 is the number of matched observations and 𝑀𝑖 is the set of observations in the control
group matched to the 𝑖th observation in the treatment. Similarly, the term 1
𝑀∑ 𝑌𝑚𝑚∈𝑀𝑖
is simply a
weighted average of the outcome variables for all matched observations in the control group. The
nearest neighbor-matching estimator allows us to specify the number of matches,𝑚 for each
treated observation. We need to be very careful in choosing the values of 𝑚.If𝑚 = 1, each
treated observation is matched with an observation in the control group with the closest distance.
A large number of 𝑚 can reduce the quality of the match because of the use of more
observations in the matching process.
To consistently estimate the treatment effect of interest, we assume that assignment to a
treatment is independent of the outcomes and the probability of assignment is bounded away
from zero and one. Generally, more than one covariate is specified in ATT. When more than one
covariate is used, the matching depends on the weighting matrix. The output of ATT reflects our
choice of the inverse variance-weighting matrix (Abadie et al., 2004). We do not need to assume
specific functional form of the dependent variable and do not need to impose any distributional
assumption,24 due to which matching estimators are considered as non-parametric types of
estimators. Although the matching estimator attempts to eliminate selection bias, there is always
24 In a standard regression, we assume some specific functional form of the dependent variables and we impose
distributional assumption of the dependent variables. See more details: Uematsu and Mishra, 2012.

42
an effect of unobservable factors explaining the treatment. Therefore, a matching estimator is
used to reduce selection bias rather than to completely eliminate selection bias (Becker and
Ichino, 2002; Sitienei et al., 2014; Khanal et al., 2015). A treatment effect limits the impact of
outliers and provides a data reduction method. These benefits justify its use here with small
sample size and since female farms are likely to cluster around small acreage.
3.4. Data
This study uses farm-level cross-sectional data from the Central Luzon Loop Survey,
commonly known as the “Loop Survey,” conducted by the Social Sciences Division of the
International Rice Research Institute (IRRI). Central Luzon is the major rice-producing area of
the Philippines, also known as the “rice bowl of the Philippines.” This region grows rice three
times a year. This survey contains detailed information on rice yields, prices, fertilizer use,
pesticide inputs, labor use, land tenure systems, mechanization, and cultural and labor practices
related to rice production. The Loop Survey began in 1966, and is conducted about once every
four years.
We used the most recent (2012) Loop Survey for this study. The Loop Survey collects
data from rice-farming households along a loop of the main highway north of Metro Manila
through the provinces of Bulacan, Nueva Ecija, Pampanga, Tarlac, Pangasinan, and La Union.
Figure 1 shows the area under study, Central Luzon and its provinces. Variables of interest
include the costs of production (variable costs and fixed costs), the value of farm production,
indicators of income, rice yield per hectare, and farming efficiency. Fixed costs include the cost
of land rental and capital rental. Variable costs include the cost of seeds, fertilizer, fuel,
irrigation, and labor. Total household income and net farm income indicate the performance of
the farm. The farming efficiency variable is mostly related to managerial characteristics, and it is

43
defined as the ratio of gross value of production to total variable costs. A number of exogenous
variables, such as age, education, household size, land area, dummy variable for marital status,
and occupation, were used to match the farms.
Figure 1. Research study area, Central Luzon, Philippines Source: Political map of Central Luzon, Wikipedia
Table 5 provides the definition and summary statistics of the variables used in our
analysis for the entire sample, female-headed farm households and male-headed farm
households. Of 76 household observations, only 18 (or 23.6% of the entire sample) were female-
headed farm households. The last column of Table 1 shows t-statistics or z-statistics, which
compare the means of the treated (female-headed farm households) and control (male-headed
farm households) observations. These test statistics simply compare the means of each variable
Central
Luzon
Loop
Survey
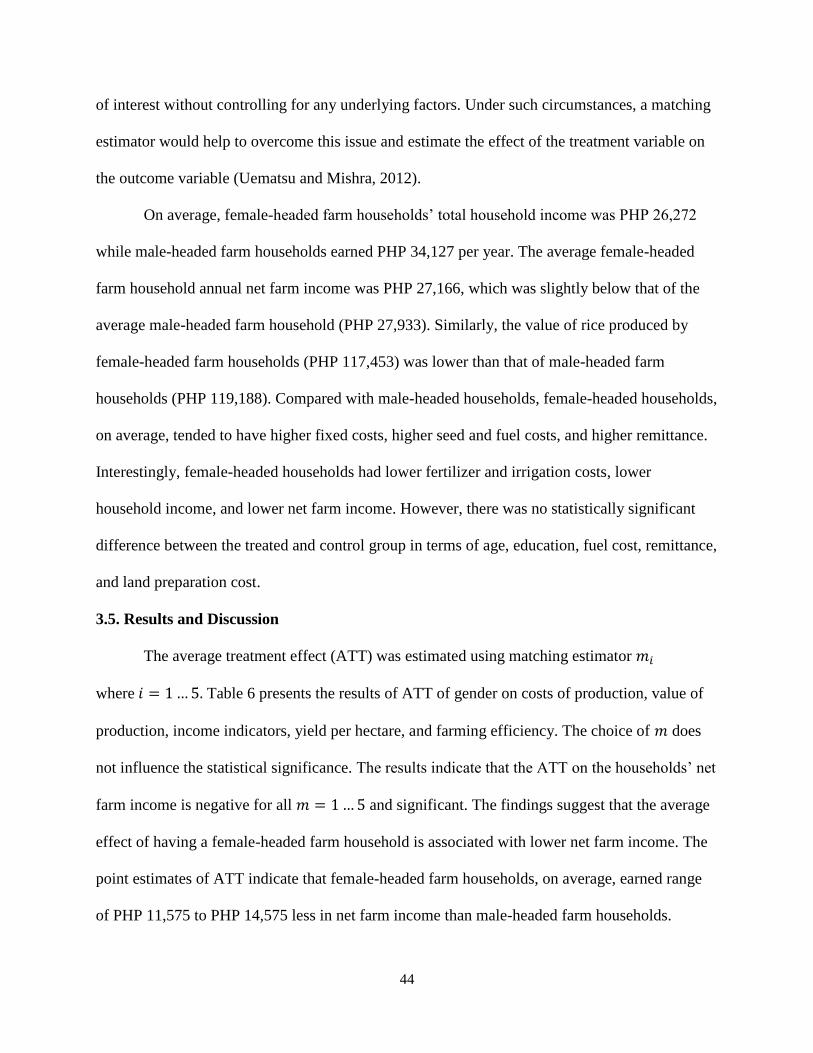
44
of interest without controlling for any underlying factors. Under such circumstances, a matching
estimator would help to overcome this issue and estimate the effect of the treatment variable on
the outcome variable (Uematsu and Mishra, 2012).
On average, female-headed farm households’ total household income was PHP 26,272
while male-headed farm households earned PHP 34,127 per year. The average female-headed
farm household annual net farm income was PHP 27,166, which was slightly below that of the
average male-headed farm household (PHP 27,933). Similarly, the value of rice produced by
female-headed farm households (PHP 117,453) was lower than that of male-headed farm
households (PHP 119,188). Compared with male-headed households, female-headed households,
on average, tended to have higher fixed costs, higher seed and fuel costs, and higher remittance.
Interestingly, female-headed households had lower fertilizer and irrigation costs, lower
household income, and lower net farm income. However, there was no statistically significant
difference between the treated and control group in terms of age, education, fuel cost, remittance,
and land preparation cost.
3.5. Results and Discussion
The average treatment effect (ATT) was estimated using matching estimator 𝑚𝑖
where𝑖 = 1…5. Table 6 presents the results of ATT of gender on costs of production, value of
production, income indicators, yield per hectare, and farming efficiency. The choice of 𝑚 does
not influence the statistical significance. The results indicate that the ATT on the households’ net
farm income is negative for all 𝑚 = 1…5 and significant. The findings suggest that the average
effect of having a female-headed farm household is associated with lower net farm income. The
point estimates of ATT indicate that female-headed farm households, on average, earned range
of PHP 11,575 to PHP 14,575 less in net farm income than male-headed farm households.

45
Table 5. Variable definition and summary statistics
Variable definition
Mean
t/z scorea Entire sample Female HH Male HH
Age (in years) 60 60 60 -0.69
Education (in years) 8 9 8 1.23
Household size 4.8 4 5 1.92*
Marital status (=1 if married; 0
otherwise
0.76 0.36 0.81 6.87**
Occupational status (=1 if farming;
0 otherwise)
0.77 0.72 0.78 0.38
Land area (hectares) 1.39 1.38 1.40 1.95*
Land preparation cost (PHP) 2,350 3,142 2,192 1.56
Post-harvest cost (PHP) 15,167 14,890 15,222 1.77*
Costs of production
Fixed costs (PHP)
Land rent 4,374 6,738 3,900 -1.73*
Capital rent 7,157 10,444 6,499 -1.85*
Variable costs (PHP)
Seed cost 4,478 4,746 4,424 -2.01**
Fertilizer cost 12,174 11,968 12,215 -1.98**
Fuel cost 2,728 3,158 2,642 -1.46
Irrigation cost 1,663 1,176 1,760 1.68*
Variable labor cost 31,518 33,400 31,225 1.83*
Permanent labor cost 8,929 9,949 8,726 -2.03**
Value of rice produced 1,18,899 1,17,453 1,19,188 2.07**
Income indicators
Household income (PHP) 32,818 26,273 34,127 1.98**
Net farm income (PHP) 27,805 27,166 27,933 2.54**
Remittance (PHP) 19,212 19,291 19,196 -1.45

46
Table 5 continued
Variable definition Mean
Entire sample Female HH Male HH t/z scorea
Production
Yield per hectare (kg) 5762.49 5362.97 5842.40 3.08**
Efficiency (Gross value of production/total variable costs)
Farming efficiency 5.66 4.76 5.84 1.72*
** and * indicate statistical significance at 5% and 10%, respectively.
a The differences in means are obtained by subtracting means for farm households with female-headed households
from those of households with male-headed. For continuous variable, 𝑡 test is used and 𝑡 statistics is reported; test
on the equality of proportions is used to compare the differences for binary variables and 𝑧 score is reported
Similarly, the total household income for 𝑚1, 𝑚2, and 𝑚3 of female-headed farm
households is negative and significant, suggesting that female-headed farm households, on
average, earned range of PHP 11,658 to PHP 62,114 less total household income than male-
headed households. Interestingly, female-headed farm households receive more in cash
remittance, range of PHP 1900 to PHP 11,472 more than male-headed households, though this
variable is insignificant for all𝑚𝑖 in ATT. Estudillo et al. (2001) reported that 60% of the
females in Central Luzon participated in non-farm employment compared with only 42% of the
males. Generally, female participants earned more in non-farm employment because they were
more educated, with about 2 years of additional schooling. It should be pointed out that women’s
farm wages are 48 percent lower than men’s during the wet season of rice production in the
Philippines (Quisumbing, 1994a).
The ATT estimates of fixed costs such as land rent and capital rent show that female-
headed farm households have higher fixed costs than male-headed farm households. The
matching estimators 𝑚1 and 𝑚2 are significant for land rent at the 10 percent level of
significance. Results in Table 6 show that a female-headed farm household, on average, pays

47
PHP 4,081 to PHP 4,290 more in land rent than a male-headed farm household. The entire
matching estimators are positive and significant at the 10 percent level of significance for capital
rent. The ATT on capital rent ranged between PHP 3,918 and PHP 4,484. Because of legal,
social, and institutional disparities between males and females, female-headed farm households
usually have higher levels of physical and human capital than male-headed households
(Quisumbing, 1994a).
We estimate the ATT on variable costs, which include seed cost, fertilizer cost, fuel cost,
irrigation cost, permanent labor cost, and variable labor cost. Among them, fertilizer cost and
fuel cost are not significant. This implies that there is no statistically significant difference in
fertilizer cost and fuel cost between female-headed farm households and male-headed farm
households. However, seed cost is positive and significant. A female-headed farm household
spends more (range of PHP 1,183 to PHP 1,554) on seeds than a male-headed farm household,
although it should be noted that female farmers are more likely to use improved seed varieties
and use agrochemicals (Quisumbing, 1994a). On the other hand, female-headed farm households
spend less (range of PHP 970 to PHP 1,516) on irrigation cost than male-headed farm
households. The total permanent labor cost is significant for 𝑚1, 𝑚2, and 𝑚3 and it has a positive
value. Similarly, variable labor cost is significant for 𝑚1 and has a positive value. The findings
suggest that a female-headed farm household pays range of PHP 5,691 to PHP 8,230 more in
permanent labor cost than a male-headed farm household.
Similarly, a female-headed farm household pays more (on average PHP 10,699) on
variable labor cost than a male-headed farm household. In the Philippines, women generally tend
to have lower marginal products of labor because of cultural constraints in farm work. Female-
headed farm households have less access to land and own fewer tools, and are less likely to adopt

48
farm machinery and a tractor because of the higher capital requirements. Therefore, female-
headed farm households invest large amounts in hiring labor compared with male-headed
households (Quisumbing, 1994a; Arun, 1999).
Although female-headed farm households lag behind their counterpart, the most
important result obtained from our analysis is that female-headed farm households have a higher
value of rice production than male-headed farm households. The results in Table 6 show that, in
spite of having less area of production and higher fixed costs and variable costs, female-headed
farm households have higher output as well as a higher value of rice production than male-
headed farm households. The value of rice production is significant for 𝑚1 and 𝑚2 and has a
positive sign. Table 6 indicates that a female-headed farm household earns (range of PHP 19,
969 to PHP 23,802) more from sales of rice than a male-headed farm household. There is one
questionnaire asking about who buys more improved seed. From response of survey it was found
that female buys more improved and high quality rice verities while males were more interested
to use previous year seed. Thus, a female-headed farm households spends more money to buy
improved varieties of seeds compared to a male-headed farm households. Since women are more
likely to adopt improved seed varieties, they will obtain more income from the sale of quality
rice.
The ATT estimate on rice yield (kg/hectare) indicates that female-headed farm
households have lower yield (on an average 1,320 kg/ha) than male-headed farm households. It
should be pointed out that, in the Philippines, Estudillo et al. (2001) and Quisumbing (1994b)
studied the gender differences in land inheritance and stated that sons receive 0.15 additional
hectare of land compared with daughters. However, Estudillo et al. (2001) and Quisumbing
(1994b) note that daughters were treated more favorably for schooling, receiving 2 more years of

49
schooling than sons, and were more likely to obtain off-farm jobs. This may explain why female-
headed farm households have small farms and lower total rice production than male-headed farm
households (Hoppe and Korb, 2013). Additionally, Saito et al. (1994) found that female-headed
farm households generally managed fewer quality plots than male-headed farm households.
It is plausible that female-headed farm households in the Philippines manage poor-quality
land and this may explain the lower yield per hectare than male-headed farm households. Finally,
we estimated farming efficiency for female-headed and male-headed farm households. Farming
efficiency is a ratio defined as the total value of rice production divided by the total variable cost
of rice production. The ATE estimates on farming efficiency are negative and significant at the 5
percent level of significance. A female-headed farm household is less efficient (a range of 1.10
to 1.33) than a male-headed farm household. This is not a surprise because female-headed farm
households spend more money than male-headed farm households on variable costs, which
eventually leads to lower farming efficiency. The findings here are consistent with those of
Fletschner (2008), who found that credit constraints for women can cause an additional 11%
drop in household/farm efficiency in Paraguay. Female farmers have less access to formal credit
because they are less mobile than men and they lack adequate collateral, particularly ownership
of land. Women are also less likely to have access to extension and other services, which may
lead to less efficiency in the use of inputs in rice (Saito et al., 1994; Lastarria-Cornhiel, 2008).

50
Table 6. Estimates of the average treatment effect (ATE) for the treated (ATT)
Variable
Number of
matches (m)
ATT
S.E.
p-values
Net farm income (PHP/year) 1 -14,425.26 6,750.19 0.033**
2 -11,862.00 6,771.342 0.047**
3 -14,040.11 6,580.052 0.026**
4 -11,574.82 5,633.507 0.031**
5 -14,242.80 6,120.775 0.022**
Total household income1
(PHP/year)
1 -11,6518.2 61,114.86 0.050**
2 -62,113.64 29,287.22 0.034**
3 -42,893.94 24,888.90 0.031**
4 -29,093.18 21,478.19 0.176
5 -23,025.09 18,201.00 0.206
Cash remittance2 (PHP/year) 1 11,472.73 11,419.70 0.315
2 9,909.09 12,057.27 0.411
3 7,181.81 10,642.12 0.500
4 -1,900.00 9,776.52 0.846
5 -4,025.45 11,238.04 0.720
Land rent (PHP/year) 1 4,081.22 2,067.009 0.048**
2 4,289.40 2,290.774 0.061*
3 2,916.71 2,686.924 0.278
4 2,636.45 3,107.607 0.396
5 2,899.97 3,215.504 0.367
Capital rent (PHP) 1 4,483.85 2,637.765 0.049*
2 3,917.95 2,350.988 0.050**
3 4,063.64 2,230.784 0.044**
4 4,315.25 2,497.216 0.059*
5 4,413.57 2,448.035 0.042**
Seed cost (PHP) 1 1,553.41 853.936 0.069*
2 1,283.52 612.405 0.036**
3 1,182.57 675.000 0.080*
4 1,243.75 708.032 0.079*
5 1,282.27 650.705 0.049*
Fertilizer cost (PHP) 1 347.50 1,817.091 0.848
2 1,827.56 1,402.346 0.193
3 826.481 903.059 0.360
4 1,449.31 1,103.188 0.189
5 1,599.81 1,373.679 0.244
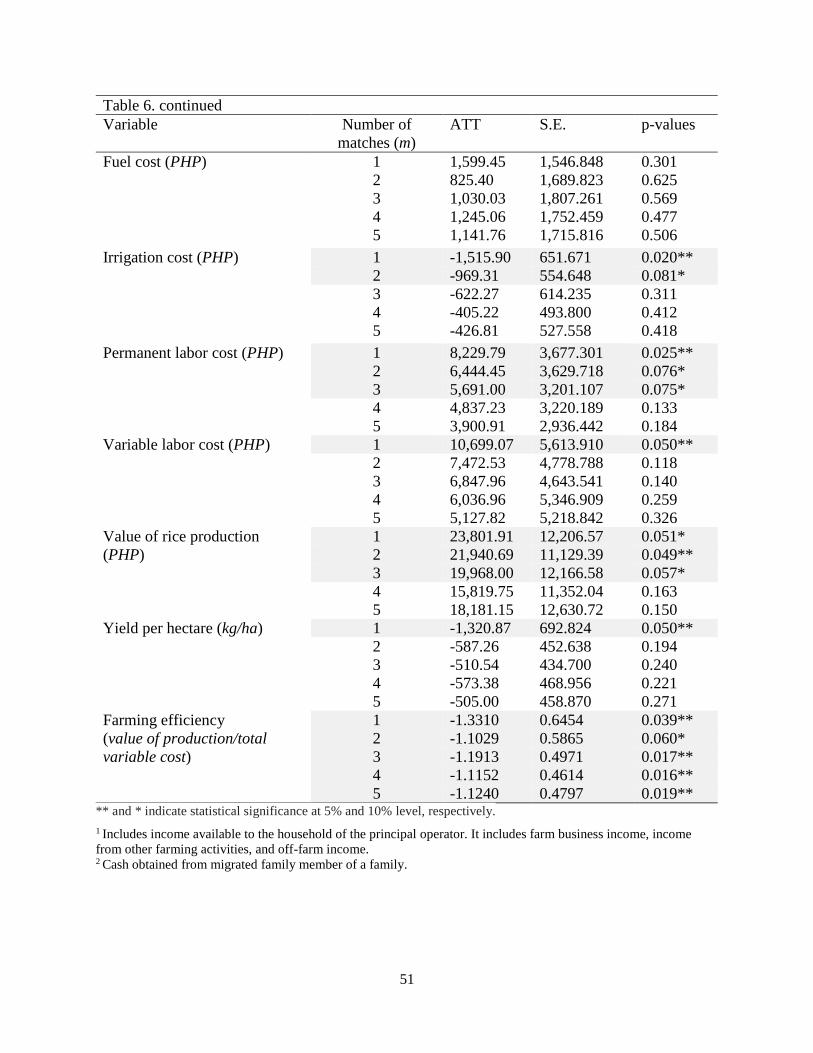
51
Table 6. continued
Variable Number of
matches (m)
ATT S.E. p-values
Fuel cost (PHP) 1 1,599.45 1,546.848 0.301
2 825.40 1,689.823 0.625
3 1,030.03 1,807.261 0.569
4 1,245.06 1,752.459 0.477
5 1,141.76 1,715.816 0.506
Irrigation cost (PHP) 1 -1,515.90 651.671 0.020**
2 -969.31 554.648 0.081*
3 -622.27 614.235 0.311
4 -405.22 493.800 0.412
5 -426.81 527.558 0.418
Permanent labor cost (PHP) 1 8,229.79 3,677.301 0.025**
2 6,444.45 3,629.718 0.076*
3 5,691.00 3,201.107 0.075*
4 4,837.23 3,220.189 0.133
5 3,900.91 2,936.442 0.184
Variable labor cost (PHP) 1 10,699.07 5,613.910 0.050**
2 7,472.53 4,778.788 0.118
3 6,847.96 4,643.541 0.140
4 6,036.96 5,346.909 0.259
5 5,127.82 5,218.842 0.326
Value of rice production
(PHP)
1 23,801.91 12,206.57 0.051*
2 21,940.69 11,129.39 0.049**
3 19,968.00 12,166.58 0.057*
4 15,819.75 11,352.04 0.163
5 18,181.15 12,630.72 0.150
Yield per hectare (kg/ha) 1 -1,320.87 692.824 0.050**
2 -587.26 452.638 0.194
3 -510.54 434.700 0.240
4 -573.38 468.956 0.221
5 -505.00 458.870 0.271
Farming efficiency
(value of production/total
variable cost)
1 -1.3310 0.6454 0.039**
2 -1.1029 0.5865 0.060*
3 -1.1913 0.4971 0.017**
4 -1.1152 0.4614 0.016**
5 -1.1240 0.4797 0.019** ** and * indicate statistical significance at 5% and 10% level, respectively.
1 Includes income available to the household of the principal operator. It includes farm business income, income
from other farming activities, and off-farm income. 2 Cash obtained from migrated family member of a family.

52
3.6. Summary and Conclusions
About 60 percent of the employed women in South Asia and in sub-Saharan Africa work
in agriculture. Women’s participation in the agricultural labor force and as owners and operators
is increasing in Africa and Asia. In Asia, women’s participation is much greater in rice-based
cropping systems, especially in transplanting, harvesting, weeding, and post-harvest activities,
than in other farming. In the developing countries, there is still a valid perception that “women
are not farmers,” which has resulted in the exclusion of women in agricultural research and
extension for development programs.
This study examined the role of female-headed farm households in rice farming. In
particular, we investigated the impact of female-headed farming operations on farm output,
income, costs (fixed and variable costs), and farming efficiency. To do this, we used a non-
parametric approach and the nearest neighbor matching method along with farm-level data from
rice-producing areas of the Philippines. We found that there was no statistical difference between
female-headed and male-headed farm households in terms of age, education, fuel cost, fertilizer
cost, and land preparation cost. An interesting finding from this study was that female-headed
farm households have a higher value of production than male-headed households. However,
female-headed farm households are less efficient (farming efficiency and yield per hectare) when
it comes to farming. Rental cost of land and farm capital and variable costs such as hired labor
and seeds were higher for female-headed households. However, irrigation costs were lower for
female-headed farm households than for male-headed farm households.
Female-headed farm households are a growing phenomenon in the Philippines, where
farms operated by women have more than doubled in the past 30 years. In spite of
improvements, women still face constraints on productive resources such as land, credit, and

53
reliable hired labor. Women have weaker rights to land than their counterparts because land
allocation patterns are generally skewed toward men. Additionally, women do not have the same
access to agricultural extension services. An understanding of women’s role in farming and the
constraints faced by women farmers is a prerequisite in preparing a gender policy in agriculture
not only in the Philippines but in any country. Therefore, legal provisions such as equal access to
land and other resources should be the starting point of a gender-sensitive agricultural policy.
Finally, gender differences appear in the type of technology and information disseminated to
farmers. Several knowledge-intensive technologies require knowledge and skills. Thus, steps
could be taken to strengthen extension services to educate, train, and provide guidance to women
farmers in farming activities as well as value chain enhancements in production agriculture and
the food industry.
3.7. References
Abadie, A., & Imbens, G. W. (2011). Bias-Corrected Matching Estimators for Average
Treatment Effects. Journal of Business & Economic Statistics, 29(1), 1-11. doi:
10.1198/jbes.2009.07333.
Abadie, A., Drukker, D., Herr, J. L., & Imbens, G. W. (2004). Implementing matching estimators
for average treatment effects in Stata. Stata Journal, 4, 290-311.
Arun, S. (1999). Does land ownership make a difference? Women's roles in agriculture in
Kerala, India. Gender & Development, 7(3), 19-27.
Ashraf, N. (2009). Spousal Control and Intra-Household Decision Making: An Experimental
Study in the Philippines. American Economic Review, 99(4), 1245-1277. doi:
10.1257/aer.99.4.1245.
Becker, S. O., & Ichino, A. (2002). Estimation of average treatment effects based on propensity
scores. Stata Journal, 2(4), 358-377.
Chant, S. (1997). Women‐Headed Households: Poorest of the Poor? Perspectives from Mexico,
Costa Rica and the Philippines. IDS Bulletin, 28(3), 26-48.
54
Estudillo, J. P., Quisumbing, A. R., & Otsuka, K. (2001). Gender Differences in Land
Inheritance, Schooling and Lifetime Income: Evidence from the Rural
Philippines. Journal of Development Studies, 37(4), 23.
Fletschner, D. (2008). Women's Access to Credit: Does It Matter for Household
Efficiency? American Journal of Agricultural Economics, 90(3), 669-683.
Gillespie, J., & Nehring, R. (2014). Pasture-Based versus Conventional Milk Production: Where
Is the Profit?. Journal of Agricultural and Applied Economics, 46(04).
Handa, S. (1996). Expenditure behavior and children's welfare: An analysis of female headed
households in Jamaica. Journal of Development Economics, 50(1), 165-187.
Holland, P. W. (1986). Statistics and causal inference. Journal of the American statistical
Association, 81(396), 945-960.
Hoppe, R. A., & Korb, P. (2013). Characteristics of Women Farm Operators and Their Farms.
USDA-ERS Economic Information Bulletin, (111).
Hwang, JI., Paris, T., Cabrera, E., & Choi, Y. (2011). A comparative study on women’s role in
intrahousehold decision-making in Korean and the Philippine rice farming households.
Journal of Rural Development/Nongchon-Gyeongje, vol. 34, issue 4.
Illo, J. I. (2010). Gender Concerns and Human Development. Human Development Network
(HDN), 202-213.
Khanal, A. R., Mishra, A. K., & Koirala, K. H. (2015). Access to the Internet and financial
performance of small business households. Electronic Commerce Research, 1-17.
Lastarria-Cornhiel, S. (2008). Feminization of agriculture: Trends and driving forces. The World
Development Report 2008.
Layton, R., & MacPhail, F. (2013). Gender equality in the labor market in the Philippines.
Mandaluyong City, Philippines: Asian Development Bank. ISBN 978-92-9254-403-4
www.adb.org/publications/gender-equality-labor-market-philippines.
Lu, J. (2010). Gender Analysis of Women in the Philippine Agriculture and Their Occupational
Issues. Journal of International Women's Studies, 11(4), 73.
Miralao, V. A. (1992). Female-Headed Households in the Philippines. Philippine Sociological
Review, 40(1-4), 46.
Palacios-López, A., & Lopez, R. 2014. Gender Differences in Agricultural Productivity: The
Role of Market Imperfections (No. 164061). Department of Agricultural and Resource
Economics, the University of Maryland.

55
Pandey, S., Byerlee, D., Dawe, D., Dobermann, A., Mohanty, S., Rozelle, S., & Hardy, B., Eds.
(2010). Rice in the Global Economy: Strategic Research and Policy Issues for Food
Security. IRRI. 477 p.
Peterman, A., Quisumbing, A., Behrman, J., & Nkonya, E. (2011). Understanding the
Complexities Surrounding Gender Differences in Agricultural Productivity in Nigeria
and Uganda. Journal of Development Studies, 47(10), 1482-1509. doi:
10.1080/00220388.2010.536222.
Philippine Peasant Institute (PPI). 4th quarter 2002. Farm News and Views. Magna Carta for
Rural Women: Recognizing the Rural Women.
Quisumbing, A. (1994a). Improving women’s agricultural productivity as farmers and
workers. Education and social policy, Department Discussion paper, 37.
Quisumbing, A. R. (1994b). Intergenerational Transfers in Philippine Rice Villages: Gender
Differences in Traditional Inheritance Customs. Journal of Development
Economics, 43(2), 167-195.
Quisumbing, A. R., Meinzen-Dick, R., Raney, T. L., Croppenstedt, A., Behrman, J. A., &
Peterman, A. (2014). Closing the knowledge gap on gender in agriculture. In Gender in
Agriculture (pp. 3-27). Springer, Netherlands.
Rosenbaum, P. R., & Rubin, D. B. (1983). The central role of the propensity score in
observational studies for causal effects. Biometrika, 70(1), 41-55.
Saito, K. A., Mekonnen, H. H., & Spurling, D. D. (1994). Raising the productivity of women
farmers in sub-Saharan Africa. World Bank Discussion Papers 230.
Sitienei, I., Mishra, A. K., Gillespie, J., & Khanal, A. R. (2014). Participation in Informal Off-
farm Labor Market and Its Impact on Household Income and Food Security in Malawi.
SAEA 2014 Annual Meeting, February 1-4, 2014, Dallas, Texas.
Swaminathan, H., Lahoti, R., & Suchitra, J. Y. (2012). Women’s Property, Mobility, and
Decisionmaking: Evidence from Rural Karnataka, India. International Food Policy
Research Institute discussion paper (01188).
Tauer, L. W. (2009). Estimation of treatment effects of recombinant bovine somatotropin using
matching samples. Applied Economic Perspectives and Policy, 31(3), 411-423.
Udry, C., Hoddinott, J., Alderman, H., & Haddad, L. (1995). Gender differentials in farm
productivity: Implications for household efficiency and agricultural policy. Food
Policy, 20(5), 407-423.
Uematsu, H., & Mishra, A. K. (2012). Organic farmers or conventional farmers: Where's the
money? Ecological Economics, 78, 55-62.

56
Zanutto, E. L. (2006). A comparison of propensity score and linear regression analysis of
complex survey data. Journal of Data Science, 4(1), 67-91.
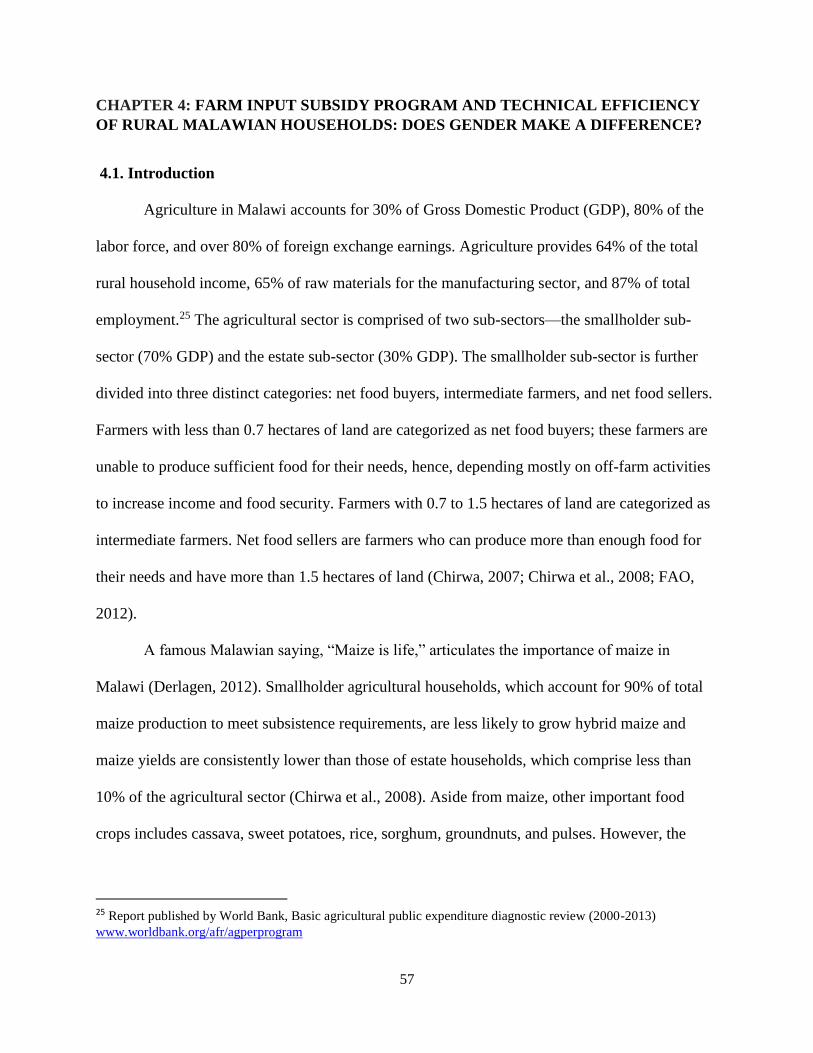
57
CHAPTER 4: FARM INPUT SUBSIDY PROGRAM AND TECHNICAL EFFICIENCY
OF RURAL MALAWIAN HOUSEHOLDS: DOES GENDER MAKE A DIFFERENCE?
4.1. Introduction
Agriculture in Malawi accounts for 30% of Gross Domestic Product (GDP), 80% of the
labor force, and over 80% of foreign exchange earnings. Agriculture provides 64% of the total
rural household income, 65% of raw materials for the manufacturing sector, and 87% of total
employment.25 The agricultural sector is comprised of two sub-sectors—the smallholder sub-
sector (70% GDP) and the estate sub-sector (30% GDP). The smallholder sub-sector is further
divided into three distinct categories: net food buyers, intermediate farmers, and net food sellers.
Farmers with less than 0.7 hectares of land are categorized as net food buyers; these farmers are
unable to produce sufficient food for their needs, hence, depending mostly on off-farm activities
to increase income and food security. Farmers with 0.7 to 1.5 hectares of land are categorized as
intermediate farmers. Net food sellers are farmers who can produce more than enough food for
their needs and have more than 1.5 hectares of land (Chirwa, 2007; Chirwa et al., 2008; FAO,
2012).
A famous Malawian saying, “Maize is life,” articulates the importance of maize in
Malawi (Derlagen, 2012). Smallholder agricultural households, which account for 90% of total
maize production to meet subsistence requirements, are less likely to grow hybrid maize and
maize yields are consistently lower than those of estate households, which comprise less than
10% of the agricultural sector (Chirwa et al., 2008). Aside from maize, other important food
crops includes cassava, sweet potatoes, rice, sorghum, groundnuts, and pulses. However, the
25 Report published by World Bank, Basic agricultural public expenditure diagnostic review (2000-2013)
www.worldbank.org/afr/agperprogram

58
priority of the Malawian government is to reorient the agricultural sector from focusing on
subsistence farming to commercial crops (Jayne et al., 2008; Malawi Government, 2011; Chirwa,
2007).
Policymakers also argue over the issue of food security (mainly defining it in terms of
access to maize, the main staple) in Malawi, high productivity and efficiency in maize
production, therefore, is critical to food security in the country. Already, over 80% of cultivated
land is dedicated to maize. However, several factors play into diminished productivity. Low
input use, inadequate access to agricultural credit, poor output and input markets, unfavorable
weather, small land holdings, and lack of proper technology are the main reasons for lower
agricultural productivity in Malawi (Malawi Government, 2011; Denning et al., 2009; Njuki et
al., 2011; Phiri et al., 2004). In addition, the combined effects of the HIV/AIDS pandemic and
constant migration of rural labor to urban areas contribute to a shortage of labor availability for
farming operations26 (Ngwira et al., 2012). Consequently, agricultural productivity in Malawi
has fallen below its potential, given the available technology (Tchele, 2009).
During the 1960s and 1970s in Malawi, adoption of improved seed varieties, mainly
hybrids and application of fertilizers, increased productivity. Fertilizer use in Africa is strikingly
low (8 kg/ha) compared to East and Southeast Asia (96 kg/ha) and South Asia (101 kg/ha). In
2005, the government of Malawi enacted the Farm Input Subsidy Program (FISP) in an effort to
boost maize production by providing subsidies on improved seed varieties and fertilizer. This
program had three primary goals: (I) to increase income of resource poor households; (II) to
encourage cash crop production; and (III) to help farmers achieve food self-sufficiency. As a
result, FISP has significantly influenced the agriculture and food security issues in Malawi since
26 Food insecurity encourages unsafe sexual practices leading to incidence of HIV/AIDS. See more details in
Denning et al., 2009.
59
its implementation.27 Proponents of FISP claim that FISP was so successful in 2006 and 2007
that it led to major surpluses (Denning et al., 2009). The program is of special interest to the
authors of this paper because the Malawian government initially enacted FISP to ensure benefits
to female-headed farm operator households; however, most beneficiaries were ultimately male-
headed farm operator households (Dorward and Chirwa, 2011; Chirwa, 2007).
The example of FISP points to how socially constructed relationships and gender
differences can affect the distribution of resources and responsibilities between men and women.
A gender difference is shaped by ideological, religious, ethnic, economic, and cultural
determinants (Quisumbing, 1996). For example, a female usually acts as the head of a household
in one of two scenarios: widowhood or abandonment. A female-headed farm operator household
is defined as those households where the women make the majority of decisions about
agricultural production and marketing (Njuki et al., 2011). A report presented to the World Bank
and UNDP (Ngwira et al., 2003) acknowledges that one-third of Malawi’s rural households,
mostly farmers, are female-headed. Overall, women comprise 51% of the total population. Of
these, about 97% of rural women are engaged in subsistence farming. Therefore, we can safely
say that women in both joint-headed and female-headed operator households are poor.
Throughout the agricultural sector in sub-Saharan Africa, two key features related to
productivity are the dominance of female labor and the prevalence of a gender gap. The gender
differential in agricultural productivity is based on the economic condition of the country, the
representativeness of the data, the type of crop, and other related factors. Previous research has
found that gender differentials in agricultural productivity range from 4 to 40% (Palacios-Lopez
and Lopez, 2014). Less access to productive inputs coupled with liquidity constraints may
27 IFPRI newsletter http://www.ifpri.org/sites/default/files/publications/massppn18.pdf

60
decrease the productivity of female-headed households as compared to male-headed households
(Saito and Weidemann, 1991; Njuki et al., 2011; Fletschner, 2008). Despite this, females may
continue to engage in agricultural labor instead of turning to off-farm activities due to
discrimination. Several factors may contribute to the differences in agricultural productivity
between farms operated by men and women in African rural households. Firstly, each group is
occupied with additional, gender-specific activities both on and off the farm. Second, differential
access and adoption of technologies, endowments of land rights, and factors of production which
impact efficiency of production (Oladeebo and Fajuyigbe, 2007).
In developing countries female-headed households are more likely to be poorer than
male-headed households, however, in Malawi female-headed households are becoming richer
than male-headed households (Handa, 1995). Malawi has a heavier concentration of matrifocal
ethnic groups, higher female participation in shifting agricultural systems (Handa, 1995) as well
as a matriarchal system which involves women in decision-making processes (Njuki et al.,
2011). Findings from previous studies point to other possible factors in the gender differential
agriculture in Malawi. These include: (1) the quantity of inputs applied; (2) the quality of inputs
(such as land, soil quality); (3) crop choice; and (4) shadow prices of inputs and access to credit
by male-headed and female-headed farm households, respectively.
Therefore, the objective of this study is to estimate the determinants of productivity and
identify the factors that explain variations in technical efficiency. Particular attention is given to
FISP and access to credit, as previous studies have failed to estimate the gender differential
impact of FISP on maize productivity and technical efficiency. Our study specifically analyzes
the average differences in agricultural productivity between plots belonging to male-headed farm
operators and those belonging to female-headed farm operators, separately.
61
4.2. Literature Review
4.2.1. Agricultural Sector of Malawi
Malawi is a landlocked tropical country and its economy is heavily dependent on
agriculture (Denning et al., 2009). Malawi has always been vulnerable to food insecurity due to
its limited resources, high population density, rainfed agriculture, and frequent droughts and
floods. Eighty-four percent of Malawians live in rural areas and about 11 million Malawians are
engaged in smallholder subsistence farming. However, due to mountains, forests, and rough
pastures, only one-third of the land is suitable for agriculture. Maize, a major staple food, is
grown by 97% of farming households and accounts for 60% of total calorie consumption in
Malawi (Denning et al., 2009). They compared the average yield of maize of Malawi (1.3 metric
tons per hectare) with the average yield of rainfed maize in Iowa (10 metric tons per hectare) for
1997-2007 periods and concluded that the absence of significant use of fertilizer in Malawi was
the major cause behind such inferior production.
Nonetheless, Derlagen (2012), in a technical note published by FAO, states that maize
yields increased from 0.99 to 2.3 tons per hectare between 1990 and 2010 time periods. The total
harvested area for maize increased from 1.14 million hectares to 1.65 million hectares between
1980 and 2010 while production more than tripled from 1.2 million to 3.8 million tons in these
periods. Total maize production was 3.64 million tons in 2013 and was expected to be 3.9
million tons (8% more than 2013) in 2014.28 This strong increase in production and yields has
been observed each year since 2006.29 Reasons for this include continuation of the Farm Input
Subsidy Program, a small expansion in planted area, and timely rainfall.
28 FAO, Malawi http://www.fao.org/giews/countrybrief/country.jsp?code=MWI 29 A Farm Input Subsidy Program has been effective since the 2005/2006 harvest season and is a major cause of
increase in maize production.

62
The 2004/2005 maize cropping season was worse than usual in Malawi. Severe drought
conditions during the crucial tasseling and ear development stages resulted in very low national
average maize production (0.76 tons per hectares). Total maize production was 24% less in 2005
compared to previous year production, which leads to the rise of maize price in local markets and
significant food deficits. Therefore, to increase maize production, the government of Malawi
decided to provide subsidies for rural farmers. The objective of FISP is to increase access to
improved agricultural inputs for resource poor smallholder farmers, with the subsequent aim of
food sufficiency, intensified maize production, and increased incomes in the long term.30 The
FISP support measures are primarily for maize production. They were first implemented during
the 2005/06 cropping season and are still in existence (Denning et al., 2009; Derlagen, 2012;
Chibwana et al., 2010). It is targeted to 1.5 million rural smallholders (about half of total
farmers) and provides each farmer with two coupons31 (1 coupon=50 kilogram bags of fertilizer).
A farmer receiving FISP should pay a small redemption fee, equating to a subsidy of two-
thirds or more of the commercial fertilizer price. A smallholder farmer is eligible for this
program if he or she cannot afford fertilizer at commercial price but has sufficient land and
human resources to make effective use of subsidized inputs (Arndt et al., 2013). In addition to
this, FISP also focuses on vulnerable groups such as child or female-headed farm households;
however, female-headed farm households and asset-poor households are less likely to receive
any type of coupons (Chibwana et al., 2010). FISP mandates a minimum distribution of 150,000-
170,000 metric tons of fertilizer per year; actual distribution peaked at 216,000 metric tons in
30 Basic agricultural public expenditure diagnostic review (2000-2013), a report published from World Bank. See
more details in http://www-
wds.worldbank.org/external/default/WDSContentServer/WDSP/IB/2014/07/17/000333037_20140717142122/Rend
ered/PDF/895110WP0P119400Box385284B00PUBLIC0.pdf 31 Two coupons were provided: One for a 50 kg bag of NPK (base fertilizer) and one for a 50 kg of urea (top
dressing).
63
2007/08. Additionally, FISP provides improved seeds32 to farmers, starting at 2-3 kilograms per
farmer in 2005/06 and 5-10 kilograms in 2009/10. Thus, a full package FISP program includes 5-
10 kg of seeds and 100 kg of fertilizer (Pauw and Thurlow, 2014).
When FISP was introduced after the drought years of 2004/2005, yield dramatically
improved in Malawi. Maize yields increased to 1.59 tons per hectare (2.58 million tons national
production) in 2005/06, doubling the yield (0.76 t/ha) and production (1.23 million tons) of
2004/05. This increase was due to subsidies on fertilizer and seeds coupled with favorable
weather (rainfall) during 2005/06. In the subsequent cropping season 2006/07, national maize
production (3.44 million tons) and yield (2.04 t/ha) further improved (Denning et al., 2009).
According to Arndt et al. (2013), FISP generates modest direct returns in the form of higher
maize productivity and production. Additionally, FISP also generates indirect benefits which are
represented by an economy-wide benefit-cost ratio on the national level. These findings from
previous studies (Chibwana et al., 2010; Arndt et al., 2013; Derlagen, 2012) lead us to conclude
that FISP programs are successful in achieving food self- sufficiency.
Several other factors contribute to diminished agricultural productivity in Malawi. One
significant problem Malawian farmers continue to face is limited availability of irrigation.
Agricultural production is mostly rainfed. Unfortunately, over the past two decades, Malawi has
experienced significant drought, including severe droughts in 1991/92, 1993/94, 1994/95, and
2000/01 (Edriss et al., 2004; Derlagen, 2012) which have led to fluctuating maize production.
Two additional binding constraints for agricultural productivity are land and poverty. Malawi’s
smallholder farmers are too poor to be able to benefit from any kind of government assisted
32 FISP provides both composites and hybrid seeds to farmers. A farmer can choose between composite and hybrid
seed varieties. Options are either 2 kg hybrid seeds or 4 kg open pollinated seed varieties. In 2009/10, FISP provided
90% of hybrid seeds.
64
credit program. Moreover, land constraints are so severe that even if they had access to adequate
credit and inputs, any increase in productivity would still fall below food demand (Diagne and
Zeller, 2001; FAO, 2011b). Edriss et al., (2004) noted that both the quantity and quality of land
input were major constraints for agricultural production in Malawi. However, the authors stated
that the largest contributing factor in the decline of maize productivity was a decrease in farm
labor input share.
4.2.2. Previous Findings
There is a growing literature concerning gender-based farm productivity and efficiency
issues across Africa. Peterman et al. (2011) studied gender differences in agricultural
productivity in Nigeria and Uganda using the 2004-2010 Fadama II data collected by IFPRI.
Using Cobb-Douglas production function in the first stage and multivariate Tobit models in the
second stage, the authors addressed gender differences. They found that female-owned plots and
female-headed household tend to have lower productivity than plots and households owned by
men in Nigeria and Uganda; women, it seems, farm on resource-poor farm land. Combaz (2013)
studied unequal decision-making power between male and female-headed farm households in
Uganda and concluded that men make about 70% of the decisions regarding marketing and men
and women jointly make 15% of the decisions, demonstrating that women have little authority
over marketing, sales, income, and spending.
Previous research on gender differences in agricultural productivity and technical
efficiency reach mixed conclusions. A number of studies in the late 1980s and early 1990s, as
well as some recent studies found no significant differences in the technical efficiency of male
and female-headed farms when differences in inputs are controlled (Peterman et al., 2001;
Gilbert et al., 2002; Thapa, 2008; Horrell and Krishnan, 2007). In fact, some studies found that

65
female-managed farms are more efficient than male-managed farms (Dadzie and Dasmani, 2010;
Oladeebo and Fajuyigbe, 2007). For example, Oladeebo and Fajuyigbe (2007) studied technical
efficiency of upland rice farmers in the Osun State of Nigeria using separate stochastic
dominance production function for female-headed and male-headed households. They found that
women farmers are more technically efficient than men farmers.
On the other hand, several studies have concluded that female-headed households or
female-managed plots have lower agricultural productivity and are technically less efficient than
male-managed plots (Udry, 1996; Quisumbing et al., 2001; Holden et al., 2001; Ogunniyi and
Ajao, 2010). Udry (1996) studied gender, agricultural production and the theory of the household
using four-year panel data (1981-1985) on Burkina Faso farm households from the International
Crops Research Institute for the Semi-arid Tropics (ICRIST). The author studied why female-
managed farms are less efficient and conclude that factor allocation (inputs) is not Pareto
efficient across plots. Plots controlled by women are farmed much less intensively than similar
plots controlled by men within the household with 6% of output lost due to inefficient factor
allocation within the household. Ogunniyi and Ajao (2010) studied gender and cost efficiency in
maize production in the Oyo State of Nigeria using two separate stochastic production function
and concluded that females are more cost inefficient than their male counterparts. Female
farmers, they found, have less access to seeds and tend to use the seed from the previous harvest.
Among various reasons of lower efficiency and productivity of female-managed farms,
access to credit is one of major barriers. For example, Fletschner (2008), in a study of 210
couples in Eastern Paraguay, studied women’s access to credit and its effect on household
efficiency33 using non-parametric data envelope analysis method. Findings showed that the
33 Household efficiency includes economic efficiency, technical efficiency, and allocative efficiency. For more
details, see Fletschner (2008).

66
women were unable to meet their needs for capital and their households experienced an
additional 11% loss in household efficiency. Diaz and Sanches (2011) studied gender wage gap
in Europe using stochastic frontier approach and data from European Community Household
Panel Data (1995-2001) and concluded that wage discrimination in women might be a reason for
lower productivity and efficiency of female-managed plots.
In spite of women appearing to have less productivity in farming, the general consensus
is that they are no less efficient than men in their use of resources. However, they generally face
greater barriers in procuring as many resources as their male counterparts. Similarly, access to
extension services is another barrier for female farmers. Gilbert et al. (2002) studied gender
analysis of a nationwide cropping system in Malawi using cross-sectional data of the 1998-99
cropping season. He found that agricultural extension services were biased toward male farmers;
i.e., extension agents chose 81% male farmers for a complex agronomic trial.
Studies have also shown that in Malawi, female-headed households have smaller
landholdings than male-headed households. According to a report published by FAO (2011)
females own less land and consequently use about 10% less total labor per hectare than their
male counterparts. This may occur for several reasons. Firstly, in general, family size is smaller
in female-headed households than male-headed households, due to the absence of the male
(Quisumbing, 1994a). But this is an additional hardship for the household since in some farming
operations, such as plowing and spraying, male labor is necessary. Consequently, female-headed
households need more cash to hire male labor to perform those farming activities.
Many studies explain and highlight the important factors that can affect efficiency of
farmers, information which is useful in helping determine technical efficiency of maize
producers in Malawi. For example, Chirwa (2007) analyzed technical efficiency of 156 maize

67
farms in Southern Malawi using 2006 cross-sectional data from a smallholder farmer
questionnaire. He found that smallholder maize farmers were 46.23% technically efficient and
stated that smallholder maize farmers in Malawi are inefficient, while hybrid seeds and club
membership could increase the efficiency of maize farmers. Farmers using hybrid maize seeds
are more efficient than farmers using local maize seeds. Tchale (2009) studied the efficiency of
smallholder agriculture in Malawi using stochastic production frontier model. The author found a
53% average technical efficiency score with determinants of efficiency being access to markets,
extension services, fertilizer, and improved seed varieties.
Similarly, Tchale and Sauer (2007) studied efficiency of maize farming household and
plot level data using 2003 survey data from the Agricultural Development Divisions in Malawi.
Using bootstrapped translog frontier, the authors concluded that integrated soil fertility, access to
agricultural input and output markets, credit provision, and extension services strongly influence
smallholders’ technical efficiency. Edriss et al. (2004) studied the impact of labor market
liberalization on maize production and productivity using a frontier production function and
Divisia Index. They found that between 1985-2000 time periods, total factor productivity
declined at a rate of 1.2% per annum. Two factors contributed most: decrease in farm labor input
share and labor market liberalization. The labor market liberalization including labor market
reform had directly or indirectly shifted allocation of labor from own farm to the other farms or
non-farm activities, resulting in a lower productivity and efficiency in maize production in
Malawi.
Taking this a step further to the topic of gender and its relationship with markets in
Malawi, Njuki et al. (2011) studied linkage between gender and intra-household dynamics. The
authors concluded that women only have the authority to control those commodities that

68
generate lower average revenues, while men are able to control commodities that have high
revenue. Thus, women are significantly excluded from markets and opportunities to move them
from subsistence agriculture to commercial agriculture in Malawi. Lack of arable and productive
land ownership, lack of access to resources, unequal domestic decision-making power, and a
gendered division of labor and time are hindering factors leading to lower productivity of
female-headed households’ plots than male-headed households’ plots.
4.3. Data
We use the third Integrated Household Survey (IHS3) data conducted by the Government
of Malawi through the National Statistical Office (NSO) in the period of March 2010 to March
2011. The NSO conducts the survey every 5 years to monitor and evaluate the changing
conditions of Malawian households. The IHS3 consists of four distinct questionnaire
instruments: the household questionnaire, the agriculture questionnaire, the fishery questionnaire,
and the community questionnaire. The household questionnaire covers a wide range of topics
including economics activities, demographics, welfare, and other sectorial information of
households. The agriculture questionnaire is carefully designed to provide consistency with the
National Census of Agriculture and Livestock and other surveys in sub-Saharan Africa. In this
study, we take data from both the household and agriculture questionnaires.
The IHS3 survey includes all three major regions of Malawi–North, Central, and South -
and 31 districts of Malawi. It does not include the island district of Likoma, which only
represents about 0.1% of the total Malawian population. For the collection of cross-sectional
data, households were visited only once. The survey data include output of maize and other food
crops produced and inputs used in the production process (such as land, labor, capital, fertilizer,

69
pesticides and seed) as well as demographic and socio-economic characteristics of the
households.
The IHS3 collected a total of 12,271 households’ observations. Among these, cross-
sectional data comprised 9,024 households and panel data comprised the remaining 3,247
households. In this study, we use only cross-sectional household observations. Table 7 shows the
summary statistics of the variables used in this analysis. Data reveals that in Malawi, about 80%
of rural households are headed by males who farm 1.15 hectares of maize compared to about
0.97 hectares of maize for female-headed households. A plot managed by a male has higher land
rent and land value compared to female-headed farm households. This implies that female-
headed farm households grows maize in less valuable land compared to male-headed farm
households. A female-headed farm household uses more fertilizer (418 kg) both organic and
inorganic, than male-headed farm households (353 kg). Pesticide use is minimal for both types of
household. A female-headed farm household participates less (3.9 months/year) in ganyu labor
compared to male-headed farm households (4.1 months/year). Ganyu is the word used to
describe informal off-farm labor opportunities, which is the common survival strategy for the
rural poor in Malawi (Sitienei et al., 2014; Takane, 2008).
Total quantity of maize sold and total value of sales are higher for male-headed farm
households than female-headed households. However, the data reveals that the average quantity
of maize output is higher for female-headed farm households (414 kg per year) compared to
male-headed farm households (335 kg per year). Similarly, net income for female-headed
households (2220 MK)34 is higher than for male-headed households (2045 MK).
34 MK denote Malawian Kwacha, measurement unit of money in Malawi. (1 US Dollar= 454.50 MK on data
2/20/15)
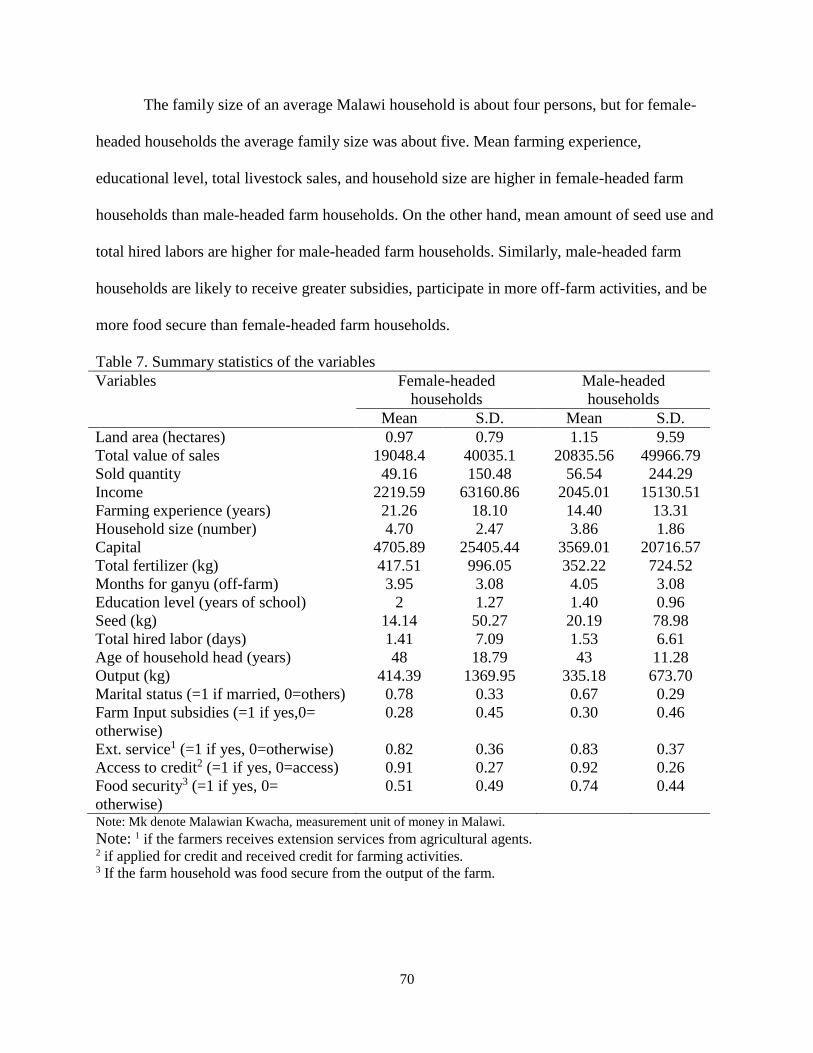
70
The family size of an average Malawi household is about four persons, but for female-
headed households the average family size was about five. Mean farming experience,
educational level, total livestock sales, and household size are higher in female-headed farm
households than male-headed farm households. On the other hand, mean amount of seed use and
total hired labors are higher for male-headed farm households. Similarly, male-headed farm
households are likely to receive greater subsidies, participate in more off-farm activities, and be
more food secure than female-headed farm households.
Table 7. Summary statistics of the variables
Variables Female-headed
households
Male-headed
households
Mean S.D. Mean S.D.
Land area (hectares) 0.97 0.79 1.15 9.59 Total value of sales 19048.4 40035.1 20835.56 49966.79
Sold quantity 49.16 150.48 56.54 244.29
Income 2219.59 63160.86 2045.01 15130.51
Farming experience (years) 21.26 18.10 14.40 13.31
Household size (number) 4.70 2.47 3.86 1.86
Capital 4705.89 25405.44 3569.01 20716.57
Total fertilizer (kg) 417.51 996.05 352.22 724.52 Months for ganyu (off-farm) 3.95 3.08 4.05 3.08
Education level (years of school) 2 1.27 1.40 0.96 Seed (kg) 14.14 50.27 20.19 78.98
Total hired labor (days) 1.41 7.09 1.53 6.61 Age of household head (years) 48 18.79 43 11.28 Output (kg) 414.39 1369.95 335.18 673.70
Marital status (=1 if married, 0=others) 0.78 0.33 0.67 0.29 Farm Input subsidies (=1 if yes,0=
otherwise) 0.28 0.45 0.30 0.46
Ext. service1 (=1 if yes, 0=otherwise) 0.82 0.36 0.83 0.37 Access to credit2 (=1 if yes, 0=access) 0.91 0.27 0.92 0.26
Food security3 (=1 if yes, 0=
otherwise)
0.51 0.49 0.74 0.44
Note: Mk denote Malawian Kwacha, measurement unit of money in Malawi.
Note: 1 if the farmers receives extension services from agricultural agents. 2 if applied for credit and received credit for farming activities. 3 If the farm household was food secure from the output of the farm.

71
4.4. Econometric Methods
Production functions have been widely used in the literature to estimate gender
differences in productivity and technical efficiency. The two-stage approach for estimating
technical efficiency has been criticized for inconsistency between the independency assumptions
of 𝑢𝑖𝑡 (inefficiency term) in the first step and the dependency assumption in the second step.
Another criticism is that a firm’s knowledge of its level of technical inefficiency influences its
input choice, so subsequent inefficiency may be dependent on the explanatory variables (Wang
and Schmidt, 2002). Therefore, we use one-stage simultaneous estimation approach in which the
inefficiency effects are expressed as an explicit function of a vector of firm-specific variables
(Chirwa, 2007; Wang and Schmidt, 2002). The mean of 𝑢𝑖𝑡 is assumed to depend on exogenous
variables. In African societies, men and women manage separate plots, so it is feasible to
estimate the technical efficiency difference on those plots (Quisumbing, 1996). We use a
separate stochastic production frontier approach for male-headed households and female-headed
households and then compare the parameters of production function and coefficient of technical
efficiency across gender. A two-stage stochastic production frontier as proposed by Aigner,
Lovell and Schmidit (1977) and Meeusen and van den Broeck (1977) is defined as
𝑦𝑖 = 𝑥𝑖𝛽 + 𝑣𝑖 − 𝑢𝑖 , 𝑖 = 1, … . , 𝑁, (1)
where 𝑦𝑖 is the production (or the logarithm of the production) of the firm 𝑖; 𝑥𝑖 is a vector of
inputs used by farm manager 𝑖; 𝛽 is an vector of unknown parameters; 𝑣𝑖 is random error which
is assumed to be identical and independently distributed; and 𝑢𝑖 is non-negative random
variables which are assumed to account for technical inefficiency in production and are assumed
to be identical and independently distributed. This production function assumes both that land
quality is the same for male-headed households and female-headed households. They both
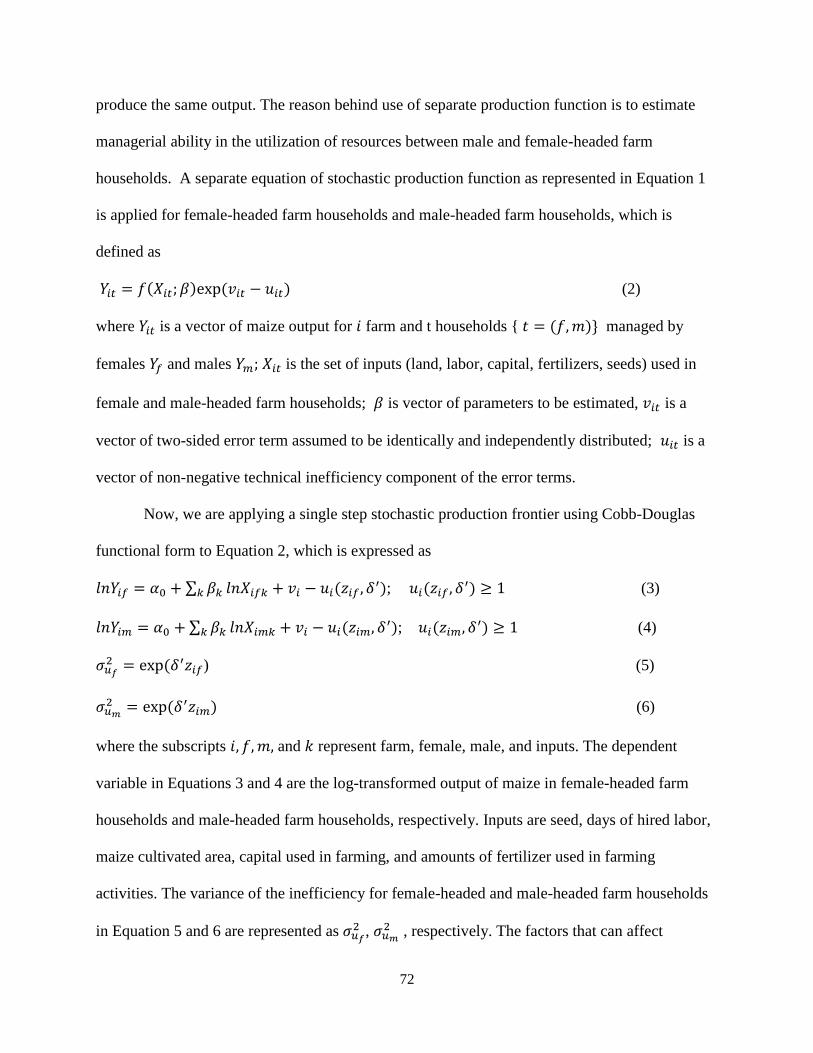
72
produce the same output. The reason behind use of separate production function is to estimate
managerial ability in the utilization of resources between male and female-headed farm
households. A separate equation of stochastic production function as represented in Equation 1
is applied for female-headed farm households and male-headed farm households, which is
defined as
𝑌𝑖𝑡 = 𝑓(𝑋𝑖𝑡; 𝛽)exp(𝑣𝑖𝑡 − 𝑢𝑖𝑡) (2)
where 𝑌𝑖𝑡 is a vector of maize output for 𝑖 farm and t households {𝑡 = (𝑓,𝑚)} managed by
females 𝑌𝑓 and males 𝑌𝑚; 𝑋𝑖𝑡 is the set of inputs (land, labor, capital, fertilizers, seeds) used in
female and male-headed farm households; 𝛽 is vector of parameters to be estimated, 𝑣𝑖𝑡 is a
vector of two-sided error term assumed to be identically and independently distributed; 𝑢𝑖𝑡 is a
vector of non-negative technical inefficiency component of the error terms.
Now, we are applying a single step stochastic production frontier using Cobb-Douglas
functional form to Equation 2, which is expressed as
𝑙𝑛𝑌𝑖𝑓 = 𝛼0 + ∑ 𝛽𝑘𝑘 𝑙𝑛𝑋𝑖𝑓𝑘 + 𝑣𝑖 − 𝑢𝑖(𝑧𝑖𝑓 , 𝛿′); 𝑢𝑖(𝑧𝑖𝑓 , 𝛿
′) ≥ 1 (3)
𝑙𝑛𝑌𝑖𝑚 = 𝛼0 +∑ 𝛽𝑘𝑘 𝑙𝑛𝑋𝑖𝑚𝑘 + 𝑣𝑖 − 𝑢𝑖(𝑧𝑖𝑚, 𝛿′); 𝑢𝑖(𝑧𝑖𝑚, 𝛿
′) ≥ 1 (4)
𝜎𝑢𝑓2 = exp(𝛿′𝑧𝑖𝑓) (5)
𝜎𝑢𝑚2 = exp(𝛿′𝑧𝑖𝑚) (6)
where the subscripts 𝑖, 𝑓, 𝑚, and 𝑘 represent farm, female, male, and inputs. The dependent
variable in Equations 3 and 4 are the log-transformed output of maize in female-headed farm
households and male-headed farm households, respectively. Inputs are seed, days of hired labor,
maize cultivated area, capital used in farming, and amounts of fertilizer used in farming
activities. The variance of the inefficiency for female-headed and male-headed farm households
in Equation 5 and 6 are represented as𝜎𝑢𝑓2 , 𝜎𝑢𝑚
2 , respectively. The factors that can affect

73
technical inefficiency, represented by 𝑧𝑖𝑡 where 𝑡 = (𝑓,𝑚), are subsidies coupons, months of
ganyu labor (informal labor, worked for cash income, off the farm), marital status, extension
services, access to credit, food security status of a family, age of household head, and education
of household head. A technical efficiency (TE) of the farm is estimated as
𝑇𝐸𝑖 = exp (-�̂�𝑖), 0 < 𝑇𝐸𝑖 < 1 (7)
4.5. Results and Discussion
We performed a mean comparison test. Table 8 shows the results of mean comparison
test for all variables. In the mean comparison test, land area, fertilizer, months of ganyu, farming
experience, household size, capital, educational level, seed, total hired labor, age, maize output,
and total livestock sales, as well as dummies for irrigation system, off-farm income, subsidies,
extension services, and access to credit are significant at 5% level of significance between
female-headed households and male-headed households, while pesticide use is found to be
significant at 10%. Variables such as quantity of maize sold, total value of sales, medical costs,
seed costs, number of farm visits by extension agent, net income, transportation costs for sales,
and marital status are not significant.
The female-headed households in Malawi do more livestock transaction than male-
headed households. The argument here could be that males value livestock ownership for
cultural reasons such as payment of dowry, signs of wealth, etc., unlike females who strictly
keep livestock for transactional purposes. Njuki et al., (2011) confirmed that women do manage
and control the ownership and marketing of livestock. Results from this test show that use of
resources between female-headed households and male-headed households is statistically
significant.

74
Table 8. Mean comparison test results
Variables Mean
T/Z scorea Entire
sample Female HH Male HH
Land area 1.13 0.97 1.15 -2.72** Total fertilizer 359.53 417.52 352.22 2.81** Pesticide 0.14 0.08 0.15 -1.79** Months of ganyu 4.04 3.95 4.05 -2.53** Sold quantity 55.46 49.16 56.54 -1.14
Total value of sales 20572.01 19048.4 20835.56 -1.32 Farming experience 15.72 21.26 14.40 37.91** Household size 4 5 4 57.61** Capital 3735.28 4705.89 3569.02 7.18**
Medical cost 4815.27 4104.96 4988.51 -1.19 Educational level 1.45 1.82 1.40 50.80**
Seed 19.37 14.14 20.19 -4.69** Seed cost 1134.12 1113.74 1137.33 -0.44
No. of farm visit by ext. age 1.42 1.68 1.38 1.24 Total hired labor 1.51 1.41 1.53 -2.46** Income 2070.55 2219.59 2045.01 0.84
Age 43.21 47.7 42.5 57.54** Output 346.07 414.39 335.18 6.14**
Transportation cost for sales 1072.41 1163.26 1056.69 0.77 Total sales of livestock 20962.73 243551.5 3186.54 4.40** Irrigation 0.004 0.005 0.003 2.84**
Wetland 0.83 0.83 0.83 0.43 Marital status 0.69 0.78 0.67 0.56
Off-farm 0.96 0.95 0.96 -10.41** Subsidies 0.30 0.28 0.30 -7.40**
Extension service 0.83 0.83 0.83 2.5** Access to credit 0.92 0.91 0.92 -2.62** Food security 0.71 0.51 0.74 -6.78** Notes: * and ** indicate significance at the 10 and 5% level of significance, respectively. a The differences in means are obtained by subtracting means for farm households with female-headed from those of
households with male-headed.
We applied separate single-stage stochastic production frontier function for female-
headed farm households and male-headed farm households, respectively. A Cobb-Douglas
production function was estimated using a half-normal distribution model. The estimated
coefficient represents elasticity. Parameter estimates of both female-headed and male-headed
farm households are presented in Table 9.

75
Table 9. Estimation of maize production and technical efficiency in the Malawi
Variables
Female-headed
farm households
Male headed
farm households
Seed (kg) 0.85**(8.92) 0.56*(1.92)
Land area (acres) 0.18**(3.10) 0.22** (3.56)
Labor (in days) -0.08 (-0.76) 0.35** (3.76)
Capital -0.52**(-3.22) -0.42** (-2.22)
Fertilizer (kg) 0.16**(2.16) 0.07(1.06)
Constant 3.75**(6.28) 4.30**(4.80)
Ln𝜎𝑣2 -0.92**(-5.46) -1.87**(-4.21)
Inefficiency components
Subsidies coupon -4.17**(-2.83) -3.29** (-2.33)
Months of ganyu 0.78**(2.19) 0.81**(2.91)
Marital status -1.74**(-3.48) -0.54** (-2.48)
Extension dummy 0.17(0.73) 0.16 (0.63)
Access to credit -1.95**(-3.58) -1.27** (-2.30)
Food security 0.89**(2.87) 0.40** (3.41)
Age 0.32**(3.09) 0.42**(3.19)
Education -0.28(-0.08) -0.18 (-0.07)
Constant -2.77 (-1.35) -3.19 (-1.45)
Notes: * and ** indicate significance at the 10 and 5% level of significance, respectively. Parentheses have t-
statistics.
The estimated signs of the parameters are as expected. Results indicate that output of
maize for female-headed farm households is affected by amount of seed, amount of fertilizer,
land area, and capitals. All of these variables are significant at 5% level of significance. Total use
of hired labor (days) is not significant. The coefficient of seed use is positive and significant
which implies that with a 1% increase in seed amount, maize productivity would increase by
0.85%. Similarly, area of maize cultivated and amount of fertilizer use is also positive and
76
significant at 5% level of significance. The coefficient of capital is negative which implies that a
1% increase in capital used decreases the maize output by 0.52%.
In the case of male-headed farm households, output of maize is affected by land area,
capital, seed, and labor days. The coefficient of maize cultivated area, capital, and labor is
significant at 5% level of significance while seed variable is significant at 10%. Amount of
fertilizer use is insignificant in the case of male-headed farm households. The only difference
between female-headed and male-headed farm households is that fertilizer use is not significant
in male-headed farm households and labor is not significant in female-headed farm households.
Previous research notes that females comprise a major portion of agricultural labor in Malawi. A
female head-of-household with her children spends more days on farm work than the members
of male-headed households. This is mainly due to the lower income of female heads of
households who have more household members, which forces them to rely more on agricultural
wage income than their male counterparts (Takane, 2008). Since female-headed farm households
cultivate maize in low fertilizer land and low value land, they use more fertilizer compared to
male-headed farm households. Thus, in spite of having less land area available for cultivation,
female-headed rural households have higher income and total output, indicating that female-
headed households are more productive than male-headed rural households.
Table 9 provides the estimates for the factors that affect technical inefficiency of maize
farmers. We find similar results and signs for both female-headed farm households and male-
headed farm households. Technical inefficiency is affected by subsidies coupons, months of
ganyu, marital status, credit constraints, food security, age, and education. For instance,
households that were food insecure were technically inefficient. Older farm operators and those
who participated in ganyu labor were also technically inefficient. On the other hand, negative

77
coefficients were obtained for subsidies, marital status, credit constraints, and educational level
of farm operators indicating a negative correlation between technical inefficiency and these
variables. A dummy variable for subsidy coupons is defined as those people who are getting
subsidies from government. About 46% of male-headed farm households and about 42% of
female-headed farm households received coupon subsidies. Our results show that female heads
are less likely to receive any type of coupons, which is also concluded by Chibwana et al. (2010).
As per our expectation, higher subsidies have significant and negative effects on technical
inefficiency. In other words, a subsidy leads to increased technical efficiency of maize farmers.
This is mainly due to the increased access to farm inputs which provide for poor Malawian maize
farmers. This result is consistent with the findings of Darko and Ricker-Gilbert (2013).
Another variable, months of ganyu labor, is also significant and has a positive impact on
technical inefficiency. This implies that if farmers participate in ganyu, they work away from
their own farm and spend less time on their own fields which leads to increased technical
inefficiency. This result is consistent with the findings of Edriss et al. (2004). On the other hand,
if a head of household, either male-headed or female-headed, is married, technical inefficiency of
farming is decreased. This may be due to married households investing more time on farming
while an unmarried head-of-household focuses more on off-farm activities.
A dummy variable for access to credit, if farmers have applied for and received credit, is
significant and is negatively related to technical inefficiency of farmers. This implies that
increase of access to credit increases the technical efficiency of Malawian farmers. However,
while about 38% of male-headed households receive credit, only 31% of female-headed farm
households receive credit. A dummy variable for food security, whether a household is food
secure, is positive and significant at 5% level. This implies that if a household is food secure by

78
any means, they are less efficient in farming. Age of a household head is also positive and
significant at 5% level, meaning that as the household head age, technical inefficiency also
increases.
Table 10 shows the summary statistics for technical efficiency for female-headed and
male-headed farm households. We found a mean technical efficiency score of about 0.64 with
standard deviation of 0.22 for female-headed farm households, while for men, the mean technical
efficiency score was 0.58 with standard deviation of 0.16. Findings here suggest that, both
female-headed and male-headed farming operations, still have room to improve technical
efficiency given the existing inputs and technology. This demonstrates that technical efficiency
was higher for female-headed farm households than male-headed farm households. A plausible
reason could be related to the higher educational levels of female-headed farm households and
their easy access to credit from local micro-finance and cooperatives, relative to male-headed
farm households. Table 11 shows the distribution of technical efficiency for female-headed and
male-headed farm households. About 60% of farms headed by females are operating at higher
than 60% technical efficiency, while only 55% of male-headed farm households are operating at
higher than 60% technical efficiency.
Table 10. Summary of technical efficiency
Summary
statistics Female-headed
farm households Male-headed
farm households
Mean 0.64 0.58 Standard deviation 0.22 0.16 Min. 0.04 0.12
Max. 0.91 0.89
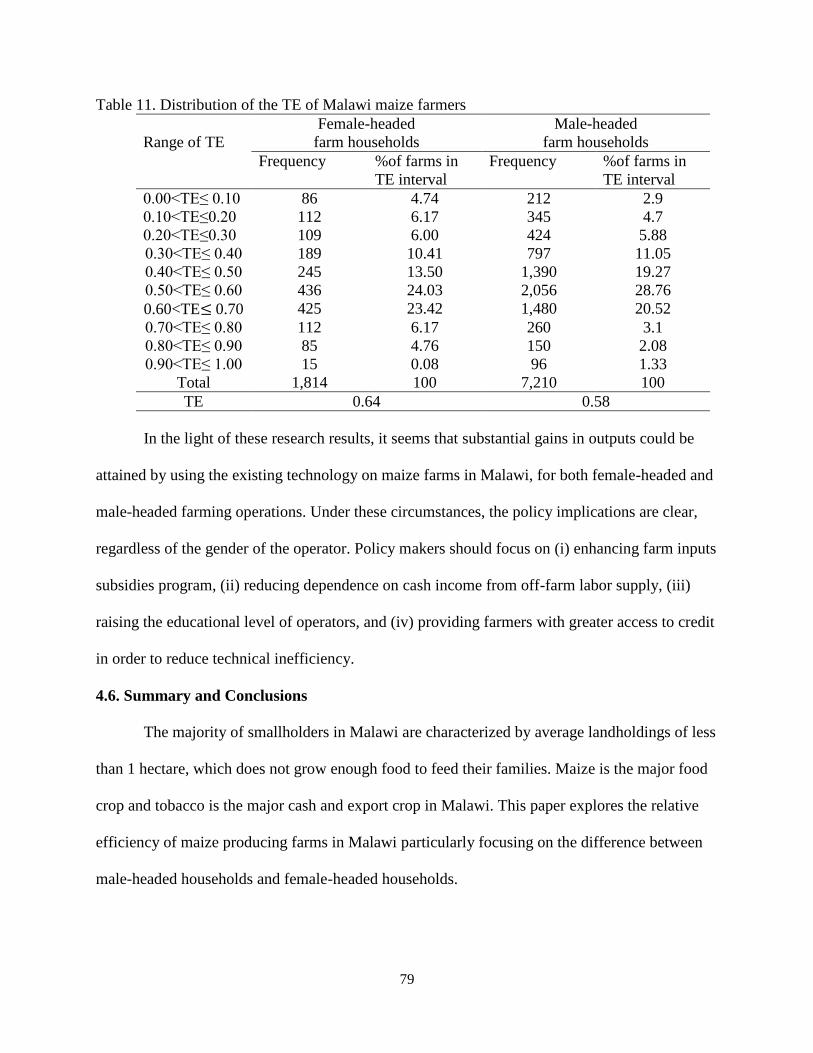
79
Table 11. Distribution of the TE of Malawi maize farmers
Range of TE
Female-headed
farm households
Male-headed
farm households
Frequency %of farms in
TE interval Frequency %of farms in
TE interval
0.00<TE≤ 0.10 86 4.74 212 2.9 0.10<TE≤0.20 112 6.17 345 4.7 0.20<TE≤0.30 109 6.00 424 5.88 0.30<TE≤ 0.40 189 10.41 797 11.05
0.40<TE≤ 0.50 245 13.50 1,390 19.27 0.50<TE≤ 0.60 436 24.03 2,056 28.76
0.60<TE≤0.70 425 23.42 1,480 20.52
0.70<TE≤ 0.80 112 6.17 260 3.1
0.80<TE≤ 0.90 85 4.76 150 2.08 0.90<TE≤ 1.00 15 0.08 96 1.33
Total 1,814 100 7,210 100
TE 0.64 0.58
In the light of these research results, it seems that substantial gains in outputs could be
attained by using the existing technology on maize farms in Malawi, for both female-headed and
male-headed farming operations. Under these circumstances, the policy implications are clear,
regardless of the gender of the operator. Policy makers should focus on (i) enhancing farm inputs
subsidies program, (ii) reducing dependence on cash income from off-farm labor supply, (iii)
raising the educational level of operators, and (iv) providing farmers with greater access to credit
in order to reduce technical inefficiency.
4.6. Summary and Conclusions
The majority of smallholders in Malawi are characterized by average landholdings of less
than 1 hectare, which does not grow enough food to feed their families. Maize is the major food
crop and tobacco is the major cash and export crop in Malawi. This paper explores the relative
efficiency of maize producing farms in Malawi particularly focusing on the difference between
male-headed households and female-headed households.
80
Findings from this study show that the level of technical efficiency among female-headed
farm households is about 5% higher than male-headed farm households under similar conditions.
Maize production is affected mainly by amount of seed, land area, capital, and labor. Technical
efficiency increases with input subsidies coupons, which implies that input subsidies have a
positive impact on technical efficiency of maize farmers—for both female-headed and male-
headed farming operations. This implies that the FISP is playing an important role in improving
technical efficiency of Malawian maize farming households. However, its success depends on
socioeconomic conditions, climatic conditions, and the agricultural policy. Another positive
factor for technical efficiency is access to credit. Although male-headed farm households receive
more subsidies than their counterparts, female-headed farm households are technically more
efficient. Additionally, the inefficiency effect model showed that factors such as access to credit,
and marital status negatively influenced technical inefficiency, while age, food secure farming
households, and off-farm income (ganyu) showed a positive relationship with inefficiency.
4.7. References
Arndt, C., Pauw, K., & Thurlow, J. (2013). The economy wide impacts and risks of Malawi’s
Farm Input Subsidy Program. In 4th International Conference of the African Association
of Agricultural Economists, Hammamet, Tunisia. Aigner, D., Lovell, C. A. A., & Schmidt, P. (1977). Formulation and estimation of stochastic
frontier production function models. Journal of Econometrics, 6(1), 21-37.
Chibwana, C., Fisher, M., Jumbe, C., Masters, W., & Shively, G. (2010). Measuring the impacts
of Malawi’s farm input subsidy program. In Contributed paper presented at the African
Association of Agricultural Economists (AAAE) conference, Cape Town, South Africa.
Chirwa, E. W. 2007. Sources of Technical Efficiency among Smallholder Maize Farmers in
Southern Malawi. The African Economic Research Consortium. ISBN: 9966-778-17-9.
Chirwa, E. W., Kumwenda, I., Jumbe, C., Chilonda, P., & Minde, I. 2008. Agricultural growth
and poverty reduction in Malawi: Past performance and recent trends. ReSAKSS-SA
Working Paper, 8.
81
Combaz, E. (2013). Women’s and girls’ benefits from market-oriented agriculture in Uganda.
GSDRC Helpdesk Research Report 998, University if Birmingham, UK.
Dadzie, S. K., & Dasmani, I. (2010). Gender difference and farm level efficiency: Metafrontier
production function approach. Journal of Development and Agricultural
Economics, 2(12), 441-451.
Darko, F. A., & Ricker-Gilbert, J. (2013). Economic Efficiency and Subsidized Farm Inputs:
Evidence from Malawi Maize Farmers. In 4th International Conference of the African
Association of Agricultural Economists, Hammamet, Tunisia.
Denning, G., Kabambe, P., Sanchez, P., Malik, A., Flor, R., Harawa, R., & Sachs, J. (2009).
Input Subsidies to Improve Smallholder Maize Productivity in Malawi: Toward an
African Green Revolution. Plos Biology, 7(1), e23. doi:10.1371/journal.pbio.1000023.
Derlagen, c., 2012. Analysis of Incentives and Disincentives for Maize in Malawi. Technical
notes series, Monitoring African Food and Agricultural Policies (MAFAP), FAO, Rome
Available at: www.fao.org/mafap.
Diagne, A., & Zeller, M. (2001). Access to Credit and Its Impact on Welfare in Malawi.
Research Report 116, Washington, DC: International Food Policy Research Institute.
Díaz, M., & Sánchez, R. (2011). Gender and potential wage in Europe: a stochastic frontier
approach. International Journal of Manpower, 32(4), 410-425.
doi:10.1108/01437721111148531.
Dorward, A., & Chirwa, E. 2011. The Malawi agricultural input subsidy programme: 2005/06 to
2008/09. International journal of agricultural sustainability, 9(1), 232-247.
Edriss, A., Tchale, H., & Wobst, P. (2004). The impact of labour market liberalization on maize
productivity and rural poverty in Malawi. Project paper. Available at
http://www.zef.de/module/register/media/303f_pasadJournalpaper.pdf.
FAO. (2011). The state of food and Agriculture. Women in agriculture: closing the gender gap
for development. Food and Agriculture Organization of the United Nations. Rome.
Retrieved from http://www.fao.org/docrep/013/i2050e/i2050e.pdf.
Fletschner, D. (2008). Women's Access to Credit: Does It Matter for Household
Efficiency? American Journal of Agricultural Economics, 90(3), 669-683.
Gilbert, R.A., Sakala, W.D. & Benson, T.D. (2002). Gender analysis of a nationwide cropping
system trial survey in Malawi. African Studies Quarterly, 6 (1). Handa, S. 1996. Expenditure behavior and children's welfare: An analysis of female headed
households in Jamaica. Journal of Development Economics, 50(1), 165-187.

82
Holden, S., Shiferaw, B., & Pender, J. (2001). Market Imperfections and Land Productivity in
the Ethiopian Highlands. Journal of Agricultural Economics, 52(3), 53-70.
Horrell, S., & Krishnan, P. (2007). Poverty and productivity in female-headed households in
Zimbabwe. The Journal of Development Studies, 43(8), 1351-1380.
IFPRI (2014). Malawi’s Farm Input Subsidy Program: Where do we go from here? Malawi
Strategy Support Program. Policy note 18. Available at:
http://www.ifpri.org/sites/default/files/publications/massppn18.pdf.
Jayne, T. S., Mangisoni, J., & Sitko, N. (2008). Social Analysis of Malawi’s Maize Marketing
Reforms. Report prepared for the World Bank/Malawi. Michigan State University, East
Lansing, Mi.
Kilic, T., Palacios-Lopez, A., & Goldstein, M. (2013). Caught in a Productivity Trap. op. cit. Malawi Government, 2011. Malawi Agricultural Sector Wide Approach: Malawi’s prioritised
and harmonised agricultural development agenda: 2011-2015. Lilongwe: Ministry of
Agriculture and Food Security. www.moafsmw.org.
Meeusen, W., & van den Broeck, J. (1977). Efficiency Estimation from Cobb-Douglas
Production Functions with Composed Error. International Economic Review, 18(2), 435.
Ngwira, A. R., Aune, J. B., & Mkwinda, S. (2012). On-farm evaluation of yield and economic
benefit of short term maize legume intercropping systems under conservation agriculture
in Malawi. Field crops research, 132, 149-157.
Ngwira, N., Kamchedzera, G., & Semu, L. (2003). Malawi Strategic Country Gender
Assessment (SCGA). 33774.
Njuki, J., Kaaria, S., Chamunorwa, A., & Chiuri, W. (2011). Linking Smallholder Farmers to
Markets, Gender and Intra-Household Dynamics: Does the Choice of Commodity
Matter? European Journal of Development Research, 23(3), 426-443.
Ogunniyi, L. T., & Ajao, A. O. (2010). Gender and cost efficiency in maize production in Oyo
state of Nigeria. Tropical and subtropical agroecosystems, 12(2), 333-338.
Oladeebo, J. O., & Fajuyigbe, A. A. (2007). Technical efficiency of men and women upland rice
farmers in Osun State, Nigeria. Journal of Human Ecology, 22(2), 93-100.
Palacios-López, A., & Lopez, R. 2014. Gender Differences in Agricultural Productivity: The
Role of Market Imperfections (No. 164061). Department of Agricultural and Resource
Economics, the University of Maryland. Pauw, K., & Thurlow, J. (2014) Malawi’s Farm Input Subsidy Program: Where Do We Go from
Here? International Food Policy Research Institute. Policy Note 18
http://www.ifpri.org/sites/default/files/publications/massppn18.pdf.
83
Peterman, A., Quisumbing, A., Behrman, J., & Nkonya, E. (2011). Understanding the
Complexities Surrounding Gender Differences in Agricultural Productivity in Nigeria
and Uganda. Journal of Development Studies, 47(10), 1482-1509.
doi:10.1080/00220388.2010.536222.
Phiri, D., Franzel, S., Mafongoya, P., Jere, I., Katanga, R., & Phiri, S. (2004). Who is using the
new technology? The association of wealth status and gender with the planting of
improved tree fallows in Eastern Province, Zambia. Agricultural systems, 79(2), 131-144.
Quisumbing, A. R. (1996). Male-female differences in agricultural productivity: Methodological
issues and empirical evidence. World Development, 24(10), 1579-1595.
Quisumbing, A. R., Payongayong, E., Aidoo, J., & Otsuka, K. (2001). Women's Land Rights in
the Transition to Individualized Ownership: Implications for Tree-Resource
Management in Western Ghana. Economic Development & Cultural Change, 50(1), 157.
Saito, K. A., & Weidemann, C. J. (1991). Agricultural extension for women farmers in Africa.
Agricultural Systems, 37: 319-322.
Takane, T. (2008). Labor use in smallholder agriculture in Malawi: six village case
studies. African Study Monographs, 29(4), 183-200.
Tchale, H. (2009). The efficiency of smallholder agriculture in Malawi. African Journal of
Agriculture and Resource Economics, 3(2), 101-121.
Tchale, H., & Sauer, J. 2007. The efficiency of maize farming in Malawi: A bootstrapped
translog frontier.
Thapa, S. (2008). Gender differentials in agricultural productivity: evidence from Nepalese
household data. Working paper. University of Trento, Trento, Italy.
Udry, C. (1996). Gender, agricultural production, and the theory of the household. Journal of
Political Economy, 104(5), 1010.
Udry, C. C., Hoddinott, J. J., Alderman, H. H., & Haddad, L. L. (1995). Gender differentials in
farm productivity: implications for household efficiency and agricultural policy. Food
Policy 20(5):407-423.
Wang, H. J., & Schmidt, P. (2002). One-step and two-step estimation of the effects of exogenous
variables on technical efficiency levels. Journal of Productivity Analysis, 18(2), 129-144.
World Bank (2013). Basic Agricultural Public Expenditure Diagnostic Review (2000-2013)
Malawi. Available at: www.worldbank.org/afr/agperprogram.
84
CHAPTER 5: CONCLUSION
This dissertation provides new knowledge on the land ownership, gender role, and
agriculture productivity in developing countries. The third and fourth chapters provide insights
on the role of gender in agricultural productivity and efficiency of rural farmers in Philippines
and Malawi. The second chapter provides evidence of land tenure status and the impact of land
ownership on the productivity and technical efficiency of Filipino farmers. Land is a key factor
in production agriculture and the land rental market is an important institution in agriculture.
Rental activity of both sharecropped and fixed rent arrangements represent about 25% of
cultivated land in the Philippines. The Comprehensive Agrarian Reform Program (CARP) of
1988, which essentially redistributes land to landless farmers, has implications for land
ownership and farm productivity. This study uses a 2007-2012 Loop Survey from the
International Rice Research Institute (IRRI). Findings of this study show that land ownership has
a significant impact on technical efficiency. A mean technical efficiency score of 79 percent
indicated that there is still room for improvement.
The third chapter provides knowledge on role of gender in agricultural productivity in
Philippines. Rural women are involved in a variety of production and farm management
activities. There is a significant increase in female-headed farm households in Philippines mainly
due to social changes such as the migration of males, awareness of gender equity in society, rise
in female labor force participation rates, and widowhood. The objectives of this chapter is to
make compare similar female-headed farm households and male-headed farm households in
terms of productivity parameters such as production cost (variable and fixed costs), farming
efficiency, net farming income, total household income, and yield per hectare. A non-parametric
approach and the nearest neighbor matching method was used. An interesting finding of this

85
study was that female-headed farm households have a higher value of production than male-
headed farm households; however, they are less efficient in farming.
In the fourth chapter, we analyzed gender difference in farm productivity and technical
efficiency of Malawian maize farmers. Our main purpose of this study is to examine the role of
gender on farm productivity and technical efficiency in an African country. For this study, we
use the third Integrated Household Survey data from Malawi. There is a growing interest in
investigating gender-based farm productivity and efficiency issues across Africa. The pressure of
population growth as well as greater off-farm employment opportunities for men have led to an
increasing proportion of African households headed by women. This might have led to
diminished technical efficiency in rural farms. We estimated maize productivity and technical
efficiency in Malawi for male-headed and female-headed farm households, separately. Findings
of this study reveal that female-headed farm households are 5 percent technically more efficient
compared to male-headed farm households under similar farming conditions. Additionally,
subsidies have a positive impact on technical efficiency of maize farmers. The Farm Input
Subsidy Program plays a driving role in the increase in production by improving technical
efficiency of rural Malawian households.

86
VITA
Koirala is from Chitwan, Nepal. He graduated BS from Institute of Agriculture and Animal
Science, Tribhuvan University in 2006 majoring in Agriculture Economics. He then got
opportunity to participate one year on the job training program conducted by Arava International
Center for Agriculture Training (AICAT), Central Arava, Israel. After completion of training
program, he joined in Local Initiatives for Biodiversity, Research, and Development (LI-BIRD)
as enumerator for short period and in Sustainable Enterprise and Environmental Development
Society (SEEDS) as project officer for a year. Afterward, he enrolled at University of Arkansas at
Monticello to pursue a MS in forest economics. He graduate in 2012 and enrolled at Louisiana
State University to purse doctorate degree in agricultural economics. He got second MS in
agriculture economics from Louisiana State University in May, 2015. He will be awarded doctoral
degree in August, 2015.