three eras of young adult home leaving in twentieth ... · the most important of the characteristic...
TRANSCRIPT

Three Eras of Young Adult Home Leaving in Twentieth-Century
America
Myron P. Gutmann Sara M. Pullum-Piñón
Department of History and Population Research Center
The University of Texas at Austin
Thomas W. Pullum
Department of Sociology and Population Research Center The University of Texas at Austin
Version of January 24, 2001
Paper Prepared for Submission to The Journal of Social History
Address all correspondence to Professor Myron P. Gutmann, Population Research Center, University of Texas at Austin, Austin, Texas 78712. Email:

Three Eras of Young Adult Home Leaving in Twentieth-
Century America1
This article divides the history of coming of age in the U.S. in the twentieth century into three
distinct time periods: one that ran from 1880 until World War II, one that started in the 1940s and
continued until the 1960s, and a third that began by 1970 and was clearly still in evidence in 1990.
The story is based on data that recorded whether young people were living with one or both of their
parents at the time of each of the decennial censuses of the U.S., from 1880 through 1990.2 We
focus on the ages at which young men and women left home based on census data, and we interpret
those levels and trends in terms of the broad social conditions in which they lived. In doing so we
see that during the twentieth century, the process by which young people passed from dependence
to independence underwent major changes.
The news here is in the history of home-leaving ages up until the time of the second world war.
Virtually all earlier studies assert that the age of home-leaving was declining from as early as it
could be measured until 1970. Our results say otherwise. From 1880 until 1940 for males and 1950
for females, the age at leaving home did not decline, it rose (see Figure 1). The decline came later.
Led by men in 1940, the generation of the Second World War experienced a sharp decline in the
age at which they left home, one that continued for everyone until 1960 and for white men and
women until 1970. Beginning with 1970, the age of home-leaving rose again, reaching relatively
high levels by 1990. These patterns hold generally for white and black Americans, and for males
and females, but we will show later that there are significant differences between these four groups.3

Three Eras of Young Adult Home Leaving in Twentieth-Century America - version of 1/24/01 - page 2
In the 1940s turnaround, for example, all four groups had had varying experiences. Among other
differences, trends for blacks are less well defined than for whites, so that the ups and downs are
less pronounced.
This research makes use of census data that document relationships within each household. We
focus on young people aged 15 to 29, because those are the ages at which most Americans made the
transition from living with their parents to living away from their parents. Our approach is shaped
by the fact that the census is a static document that records living arrangements on a given date.
These data do not capture the transition from living with at least one parent to living away from
both parents. Nor do they indicate whether an adult has left home, then returned in later years.
Nevertheless, the census allows us to examine the characteristics of persons who are living with a
parent or not living with a parent, and then ask whether the characteristics of those who are living at
home or away have changed over time, or whether they differ between groups.
The most important of the characteristic differences between young people at home and those
living on their own is their age. We say that young people left home “later” in 1940 than in 1920
because the average ages of those still at home in 1940 were greater than those of 1920, after taking
into account the overall age distribution of the population. Other important characteristics, in
addition to race and sex, are the region in which people lived, whether they were foreign-born or
native-born, whether they were single or married, whether they lived on a farm or not, and whether
they had migrated out of their region of birth. These are not the only personal attributes that shaped
the home-leaving experience, but the reliable census data that exist about these characteristics allow
us to tell an important story about the history of home-leaving in the U.S.

Three Eras of Young Adult Home Leaving in Twentieth-Century America - version of 1/24/01 - page 3
1880 1890 1900 1910 1920 1930 1940 1950 1960 1970 1980 199018
19
20
21
22
23
24
25
White Males White Females Black Males Black Females
Figure 1: Median Age at Leaving Home, United States, 1880-1990. Source data: see Table B.1.
The process of home leaving for young adults is closely related to becoming an independent
adult, and that the motivations that have caused young people through the twentieth century to leave
the parental home have varied. Leaving home may occur as a result of parental mortality, increased
personal or financial opportunities outside the home, or social expectations or rules requiring that
the young person live away from parents. While the wording is over-simplified, we can describe
these two groups of processes as either involuntary or voluntary separation of children from their
parents’ home. Involuntary home-leaving occurs when both parents die or when poverty leads to the
disintegration of the family household. In contrast, children may leave their parents’ home
voluntarily when they choose to attend school or work away from home, join the military, or when
they marry or otherwise establish an independent household separate from that of their parents.
Over the century, the prevalence of what we describe as involuntary home-leaving has decreased,
largely due to a decline in the likelihood of becoming an orphan between the ages of 15 to 29. The

Three Eras of Young Adult Home Leaving in Twentieth-Century America - version of 1/24/01 - page 4
more complex and socially driven reasons for leaving home, however, are important to the leaving
home process throughout the twentieth century.
The history of home-leaving in the U.S. since 1880 largely reflects changes in social
conventions, family relationships, and individual characteristics. During the Long First Half of the
Twentieth Century, one of the most important factors in the rising age of home-leaving was
declining adult mortality, which led to declining rates of orphanhood. High rates of immigration
into the U.S. up until the 1920s also influenced the age at which young people left home, because
young adults who immigrated by themselves during the peak years were necessarily away from the
home of their parents. Finally, social change that led to decreased child labor and increased
schooling in the first decades of the century led to later home leaving.
Those trends and experiences changed in the period we call War and Post-War, when the
median age of leaving home decreased for all groups that we study here. The driving force behind
the male experience of leaving home, we hypothesize, was the military draft. The continued
downward trend in the age at leaving home through the 1960 census is probably a result of
increased educational opportunities at the college level, particularly as a result of the G.I. Bill, and
of the post-war marriage boom
Finally, beginning during the 1960s, in the era we call the Baby Boomers and After, the age at
leaving home increased. College enrollment continued to be important, in part due to an increasing
number of institutions offering more flexible educational plans. Marriage ages rose during this era,
and marriage became a less important influence on the home-leaving behavior of women. Young
people during this period were both more likely to move away from their parents simply to form a
new and independent household, and more likely to return home and live with parents after they had

Three Eras of Young Adult Home Leaving in Twentieth-Century America - version of 1/24/01 - page 5
initially left. The result of these social changes has an upward trend in the age of leaving home, one
that is more dramatic for females for males, and one that was dramatic between 1980 and 1990.
Background
The story we tell about the ages of home leaving in the twentieth century U.S. expands upon
and retells a story told by other historians. Most of these earlier studies use either individual
longitudinal data, such as surveys and matched censuses, or local or national census data.
Longitudinal data allow the researcher to trace individuals’ transitions, the sequencing of those
transitions, and the changes in those individuals’ lives over time.4 Census statistics provide the
researcher with information about one time point only. Census data are more limited in their
usefulness, because they do not allow the researcher to see the experiences of individuals
experiencing the transition from youth to adulthood, but rather only their conditions either before or
after the transition.5
The most influential work on this subject has been done by Goldscheider and her colleagues.
At the national level, they show that for most of the twentieth century, each successive cohort of
young people left home at an average age below that of the cohort immediately preceding them.6
While there has been relatively little research dealing with the period prior to the 1930s, what there
has been suggests that the downward trend began even earlier.7 There is consensus, however, that
around 1980 the decline in the age at home-leaving began to reverse. One possible explanation for
this change is the increase in the age at marriage since the mid-1960s.8 A second trend is the
progression over time toward a narrower range of ages at which young people left home, reflecting
a more homogenized coming-of-age experience.
Three Eras of Young Adult Home Leaving in Twentieth-Century America - version of 1/24/01 - page 6
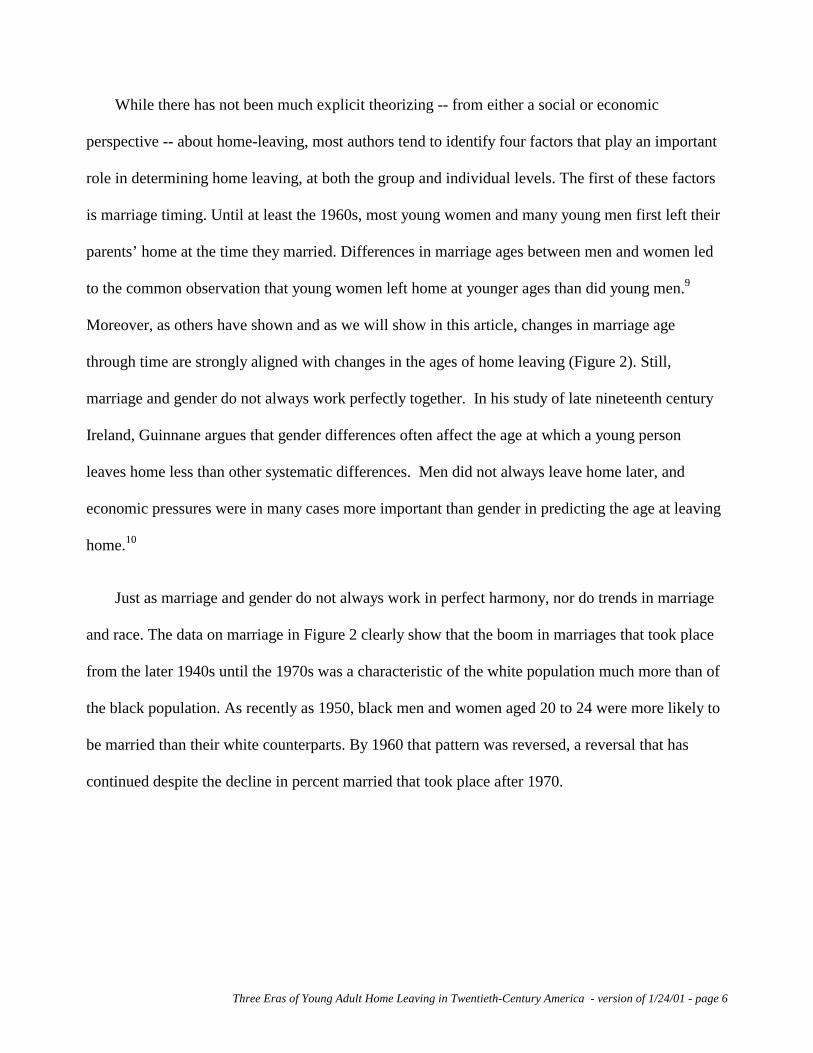
While there has not been much explicit theorizing -- from either a social or economic
perspective -- about home-leaving, most authors tend to identify four factors that play an important
role in determining home leaving, at both the group and individual levels. The first of these factors
is marriage timing. Until at least the 1960s, most young women and many young men first left their
parents’ home at the time they married. Differences in marriage ages between men and women led
to the common observation that young women left home at younger ages than did young men.9
Moreover, as others have shown and as we will show in this article, changes in marriage age
through time are strongly aligned with changes in the ages of home leaving (Figure 2). Still,
marriage and gender do not always work perfectly together. In his study of late nineteenth century
Ireland, Guinnane argues that gender differences often affect the age at which a young person
leaves home less than other systematic differences. Men did not always leave home later, and
economic pressures were in many cases more important than gender in predicting the age at leaving
home.10
Just as marriage and gender do not always work in perfect harmony, nor do trends in marriage
and race. The data on marriage in Figure 2 clearly show that the boom in marriages that took place
from the later 1940s until the 1970s was a characteristic of the white population much more than of
the black population. As recently as 1950, black men and women aged 20 to 24 were more likely to
be married than their white counterparts. By 1960 that pattern was reversed, a reversal that has
continued despite the decline in percent married that took place after 1970.

Three Eras of Young Adult Home Leaving in Twentieth-Century America - version of 1/24/01 - page 7
1880 1890 1900 1910 1920 1930 1940 1950 1960 1970 1980 199010
20
30
40
50
60
70
80
White Males White Females Black Males Black Females
Figure 2: Percent Ever Married Aged 20-24, United States. Percent ever married and age at marriage are generally inversely correlated, so that a lower percent married implies a higher age at marriage. Age at marriage rose for males from 1940 to 1960, and declined for males and females after 1960. Source data: see Table B.2.
By the end of the twentieth century, many young people chose to leave home for pre-marital
residential independence. If they can afford to, young adults increasingly prefer to live alone or in
non-familial arrangements.11 Acceptance of the trend, especially for young women, is nonetheless
highly variable across social groups. The relatively new phenomenon is generally accepted among
highly educated Protestants and Jews, but is more controversial in other communities.12
As Guinnane’s research suggests, structures of economic opportunity constitute the second
major factor determining home leaving ages. Young people stay at home if the household can offer
financial opportunities to those who remain. Alternatively, they leave home if the household cannot
offer them opportunities, or if better opportunities exist elsewhere. According to Florey and Guest,
the strongest predictor that a late-nineteenth century American farm boy would remain home was
the likelihood that he would inherit the farm.13

Three Eras of Young Adult Home Leaving in Twentieth-Century America - version of 1/24/01 - page 8
Economic opportunity in the community also influenced when a child left home. A young
adult who could not find a way to contribute to the family economy while remaining at home might
leave to look for work. Florey and Guest suggest that local economic development ‘pulled’ boys
from the farm toward more lucrative work.14 Although children had been a significant part of the
U.S. labor force at the turn of the century, their involvement decreased by the 1940s and 1950s
(Figure 3). Approximately two-thirds to one half as many children aged 15 to 19 were in the labor
force in 1940 as had been in 1900. The change was due in part to technological advances in
factories and legal reforms requiring children to be in school. New cultural perspectives also
contributed to the change. One result was that while middle class parents viewed urban or non-
family related work as damaging to young people, they believed that labor involvement in a family
farm or small business was morally and physically wholesome.15
1880 1890 1900 1910 1920 1930 1940 1950 1960 1970 1980 19900
20
40
60
80
100
White Males White Females Black Males Black Females
Figure 3: Percent in Labor Force, Ages 15-19. Teenage labor force participation generally declined for white males from 1880 to 1940 and for black males until 1960, before a short increase to 1970 and later decline. For white females it was steady until a post-war increase, while black females generally echo the trends of black males. Source data: see Table B.3.

Three Eras of Young Adult Home Leaving in Twentieth-Century America - version of 1/24/01 - page 9
After the 1950s, the involvement of children in the labor force changed again. Previously,
American children had worked as preparation for adult occupations. By the 1960s, however, young
workers were increasingly likely to be employed in service jobs, such as pumping gas or serving
food, which financed personal consumption but were unrelated to later work. As the U.S. service
economy expanded, young adults were more likely to work, but their jobs were less likely to lead to
economic self-sufficiency.16
The third factor in home leaving is the possibility of alternatives to marriage and employment.
Two such alternatives, education and military service, have played important and changing roles in
the United States in the twentieth century. Greater access to education has been a national trend in
the twentieth century. As more children received primary and secondary educations, entry into the
labor force occurred at a later age. The transition to mass college education after the 1940s led to a
decreased age at leaving home as financially dependent students lived away from their parents
while at school. The increase in college enrollment was due to several factors. First, the number of
high school graduates increased due to improved education in the first half of the century. Second,
the G.I. Bill allowed World War II and Korean War veterans an affordable undergraduate
education. Finally, the increasing number of public junior colleges and two-year institutions in the
1970s allowed more students to attend college, despite financial or scholastic constraints.17
After a period of stability until 1900 and from 1910 to 1920 for whites (but not for blacks), the
proportion of both males and females aged 15-19 attending school rose steadily, rising by half by
1940-1950, and doubling by 1970 (Figure 4). The lack of change from 1910 to 1920 may be more
exaggerated by the data than is appropriate, because the census enumerators’ instructions for 1910
encouraged them to give an occupation to persons who were employed in family businesses,

Three Eras of Young Adult Home Leaving in Twentieth-Century America - version of 1/24/01 - page 10
including farms.18 The likelihood of people between 15 and 19 attending high school increased
dramatically until 1970, with it the likelihood that they would live at home.
1880 1890 1900 1910 1920 1930 1940 1950 1960 1970 1980 19900
20
40
60
80
100
White Males White Females Black Males Black Females
Figure 4: Percent Attending School, Ages 15-19. Source data: see Table B.4.
Participation in voluntary or mandatory military service also determines the age at which a
young person leaves home. According to Goldscheider and Goldscheider, the cohort of men who
turned 18 during World War II left home two years earlier than the cohort who had turned eighteen
during the depression. More than half of the men in the World War II cohort first left home as a
direct result of a desire to enter military service.19 Modell reports that military service was
important for the generation that fought in World War II and the Korean War, but after that,
participation became less common.20 Goldscheider and Goldscheider, however, argue that even
after World War II, participation in military service was an important determinant of the age at
which men left home.21 Our results (Figure 5) confirm that finding by showing that the impact of
military service for males persisted at least until the cohort aged 15-29 in 1970.

Three Eras of Young Adult Home Leaving in Twentieth-Century America - version of 1/24/01 - page 11
1930 1940 1950 1960 1970 19800
20
40
60
80
White Black
Figure 5: Percent of Males who Served in Military by Cohort Aged 15-29. Except for 1980, the values presented here are based on the proportion in each cohort who had served in the military twenty years later, so the value for 1940 represents those men aged 35 to 49 in 1960 who were enumerated as having served in the military. The value for 1980 represents those aged 25 to 39 in 1990. Source data: see Table B.5.
The fourth major factor influencing patterns of home leaving is migration, which includes
internal migration within the U.S. as well as international immigration. The widespread twentieth
century migration from rural settings to cities and suburbs led to homogenization in the age at
leaving home. The migration from rural areas to urban areas that occurred in the 1920s was led by
young people leaving family farms to find work.22 Stevens describes this as a process in which “the
country moved from an agricultural society where young men from farm families were the last to
leave home, to an urban society in which all occupational classes experience this transition at the
same time.”23
International migration has also been instrumental in shaping American society (Figure 6).
Many of the young people who arrived in the U.S. in the last century did so without their parents.
Immigrants who came to the U.S. in the late nineteenth and early twentieth century brought their

Three Eras of Young Adult Home Leaving in Twentieth-Century America - version of 1/24/01 - page 12
own cultural practices and values. As some ethnic differences declined over the twentieth century,
however, the age at which children left home became more homogenized for all Americans.24
1880 1890 1900 1910 1920 1930 1940 1950 1960 1970 1980 19900
5
10
15
20
25
30
White Males White Females Black Males Black Females
Figure 6: Percent of Persons Aged 15-29 who were Foreign-Born. There was a sharp peak in the percent foreign-born in 1910, before the fall-off in 1920 and later, as well as the rising proportion of young people born outside the U.S. since 1960. Source data: see Table B.6.
A final influence on the age at which young people leave home is whether their parents are still
living. We define “living at home” as being in the same household as at least one parent. Orphaned
young people appear in our results to have left home, although they did not make the choice to do
so. The trend in orphanhood is difficult for us to describe because the census sample data that
would produce precise results do not specify whether a person is orphaned or not. Instead of
making direct computation of orphanhood rates from the census sample data, we have instead used
standard U.S. life tables to estimate the likelihood of a both parents of an individual dying by a
specified age, given average ages of childbearing for those parents.25 The estimates in Figure 7
show, for example, that the estimated probability of orphanhood for a twenty-year old child in 1900

Three Eras of Young Adult Home Leaving in Twentieth-Century America - version of 1/24/01 - page 13
was 0.037, meaning that slightly fewer than four percent of twenty-year olds were orphans. These
probabilities declined to a negligible level by the middle of the twentieth century.
The estimated probability of orphanhood in the United States varies dramatically by age (as
would be expected), and declines steadily from 1880 to 1990. In the most extreme case, a person
aged 30 had a 14.7% chance of being orphaned in 1880, which fell to twelve percent in 1900, to less
than ten percent in 1920, and to less than eight percent in 1920. The same declines are evident for
orphanhood at ages 15, 20, and 25, although they start at lower levels. Even in 1880, a 15-year hold
had only a one-in-40 chance of being orphaned, which declined by 1940 to less than one percent.
The conclusion that we draw from our estimates of orphanhood is that the steady decline of
adult mortality in the U.S. from 1880 to 1990 has reduced the role of orphanhood in determining the
ages at which young people have left home, with a decline by half taking place between 1880 and
1940. The rising overall age of home-leaving from 1880 to 1940 is consistent with this evidence.
What also needs to be said is that at the relatively young ages at which most people left their
parents’ homes in the late nineteenth century, the role of orphanhood was a modest factor.

Three Eras of Young Adult Home Leaving in Twentieth-Century America - version of 1/24/01 - page 14
1880 1890 1900 1910 1920 1930 1940 1950 1960 1970 1980 19900
0.02
0.04
0.06
0.08
0.1
0.12
0.14
0.16
15 20 25 30
Figure 7: Estimated Probability of Orphanhood, by Age of Child, United States. Source data: see Table B.7.
Young adults in the U.S. experienced changing living conditions between 1880 and 1990, a
result of evolving patterns of health, economic life, and the community’s expectations of them and
their families. These changed conditions influenced the length of time that they lived with their
parents. Up until the outbreak of the Second World War in 1941, many of the changes that took
place, especially in orphanhood, school attendance, and employment, should have led to later home
leaving. The war introduced one significant change, a dramatic increase in military service for men,
and indirectly led to two others -- more marriage and more higher education -- that reversed the
earlier trend, and led to earlier home leaving. The war and post-war trends ran their course by the
1970s, and were followed by stability in schooling and work, and a decline in the propensity for
young people to marry.

Three Eras of Young Adult Home Leaving in Twentieth-Century America - version of 1/24/01 - page 15
A Brief Introduction to Data and Methods
Before we present our analysis of home-leaving ages, we begin with a brief description of our
sources of methods. Those wishing more information should consult the appendixes. The analysis
reported here makes use of household-level and individual-level data drawn from the U.S. Census
of population from 1880 through 1990, with the exception of 1890 and 1930 (see note 2). These
data about individuals and households have been digitized from a sample of records extracted from
the original manuscripts of the census, and maintained as part of the IPUMS data collection by the
University of Minnesota.26 In every census used here, the enumeration recorded relationships
within each household, and it is usually possible from those relationships to identify the parents of
each child, if those parents lived within the household. The censuses changed the questions they
asked from time to time, but consistently allow identification of race, sex, place of current
residence, birthplace (both with varying levels of detail), marital status, and whether the individual
lived on a farm or not.27 We use these important characteristics of individuals to categorize the
subjects of our analysis. The characteristics that we do not use are also significant. It is not possible
to categorize the subjects of our analysis by their parents’ socioeconomic status, for example,
because we usually cannot know the parental SES of those who have already left home. This is a
weakness in our analysis, but it does not diminish the long-term trends and differences between
major population sub-groups that we have discovered.
We use the census data in three complementary ways.
The simplest thing we do is tabulate the distribution of persons with some characteristic
according to whether they still lived with one parent or not. This information is available directly
from the census. In Figure 3, for example, we report the percentage of women aged 15-29 by

Three Eras of Young Adult Home Leaving in Twentieth-Century America - version of 1/24/01 - page 16
marital status who live away from their parents. This information, while simple, is comparable
across censuses and sub-groups, and is immediately meaningful. If more married women in the
south than in the north lived away from home in a given time period, the results are meaningful.
The second way we use the data is to estimate the ages at which young people left home by
quartile, in order to produce estimates of the age at which one fourth (the first quartile), one half
(the median), and three-fourths (the third quartile) of all young men and women had left home. This
information is not available directly from the census, and therefore requires more complex methods,
because census data do not include information about actual transitions living at home to living
away, but are limited to cross-sectional information about whether individual persons do or do not
live with their parents at a single point in time. As a demographic transition, leaving home is
generally analogous to marriage, and we might have borrowed from two methods used by
demographers for the study of marriage.28 Because of the limitations of demographic approaches to
estimating home-leaving ages, the results reported here draw on statistical rather than demographic
methods. The statistical approach is described in greater detail in Appendix A, and involves fitting
the recorded proportions having left home to a logit model for each race-sex sub-population, with
other covariates (region, farm/non-farm, immigration status, and so on). We can estimate medians
and quartiles from the predicted values of those fitted models. These estimated medians and
quartiles allow us in Table B.1, for example, to give decennial estimates of the median age at which
white women left home, despite the fact that the census does not record that information itself.
The third way we use the data is an extension of the statistical approach just described, which
allows us to gauge the relative importance of the factors that influenced home leaving ages. The
logit regressions of the home leaving process produce coefficients that can be transformed into odds
ratios, which tell us just how much various factors influenced home leaving. While these

Three Eras of Young Adult Home Leaving in Twentieth-Century America - version of 1/24/01 - page 17
regressions cannot always be compared across time periods (unlike the estimated medians and
quartiles, and the simple distributions of people by home-leaving status), they allow us to take into
account possible interactions, for example if farm-resident black males in the south were different
from farm-resident white males in the south. They also allow us to gauge the overall strength of all
relationships be measure by looking at measures of goodness-of-fit for the overall model, such as r-
squared. We generally use these statistical results to confirm and illuminate the more easily
interpreted and compared results produced by the first two methods we have described.
Results
The key starting points for our research are reported in Figure 1. In this section of our article
we display trends in proportions away from home or the median home-leaving age graphically,
because of the ease with which they can be interpreted. The tables on which these figures are based
are presented in Appendix B. Figure 1 presents the median time spent living with parents for males
and females, by race, for the entire U.S. The most important initial finding that we demonstrate
here is the difference in the chronological pattern of our results and the patterns reported in the
previous literature.
Our results for the entire United States population, for both males and females, suggest that the
age at which young people ceased to live with their parents rose in the early twentieth century,
before reaching a peak in 1940 for men, and in 1950 for women. Following those peak years, the
age declined until 1970 before rising slightly from 1970 to 1990. These findings are in contrast to
the consensus view of home leaving in the literature. Several authors assert that the age at leaving
home has been declining since the early twentieth century. Our results show more complex changes
in the leaving home age until 1970, when the two sets of results become similar.

Three Eras of Young Adult Home Leaving in Twentieth-Century America - version of 1/24/01 - page 18
1880 1890 1900 1910 1920 1930 1940 1950 1960 1970 1980 19903
4
5
6
7
8
9
10
White Males White Females Black Males Black Females
Figure 8: Interquartile Ranges for Ages at Leaving Home. Source data: see Table B.8. There is no value reported for white females in 1990 because of data limitations. (See Table B.1.)
Although we report only the median age at leaving home in Figure 1, we also consider the first
and third quartiles--that is, the ages at which a quarter of the population had left home, and the age
at which three-quarters of the population had left home. The interquartile range, which spans the
first to the third quartile, indicates the uniformity of the leaving-home experience among all young
people. A large interquartile range suggests a variety of choices or experiences that affect the age at
which a person leaves home, while a smaller value indicates a narrower range of choices.
The most striking feature of Figure 8 is the extent to which patterns in the interquartile range
over time are associated with sex. For both white and black men, the interquartile range remained
stable from 1880 until 1940. In 1950 and 1960, the range decreased sharply, indicating that
leaving-home behavior became more uniform. We hypothesize that this is a result of increased
participation in military service during this period. From 1970 to 1990, the interquartile range for

Three Eras of Young Adult Home Leaving in Twentieth-Century America - version of 1/24/01 - page 19
men increased again, as military service became less common and social norms about leaving home
may have become more diverse. For both white and black women, the interquartile range was more
variable. Diversity in leaving home generally increased from 1920 to 1950, perhaps as a result of
new opportunities in education for some women. From 1960 to 1990, the interquartile range for
women followed a similar pattern to that of men, but with less variation. Because fewer women
than men served in the military in the post-1940 era, some of that decrease may have to do with a
more prescribed path in higher education. The sharp increase that both men’s and women’s
interquartile ranges showed from 1980 to 1990 may reflect a new social paradigm in which young
people leave home for the sole purpose of establishing a new household. For both men and women,
in almost all years, whites had a slightly higher interquartile range than blacks, which may result
from more cultural or economic choices in home-leaving.
1880 1890 1900 1910 1920 1930 1940 1950 1960 1970 1980 19900
20
40
60
80
100
White Married White Unmarried Black Married Black Unmarried
Figure 9: Percent Living Away From Parents by Marital Status, Females. Source data: see Table B.9.

Three Eras of Young Adult Home Leaving in Twentieth-Century America - version of 1/24/01 - page 20
For both sexes, although the phenomenon is more pronounced for women, we find the most
important predictor of home-leaving is marital status. Figure 9 shows the extent to which married
women were likely to live away from their parents. With the exception of 1950, no fewer than 85
percent of both white and black married women lived away from their parents. In 1950, the percent
of married women living away from their parents decreased, especially for blacks, in response to
post-World War II housing shortages. The behavior of white and black married women was almost
identical from 1880 to 1920. After 1920, however, black women were consistently more likely to
live with their parents after marriage.
1880 1890 1900 1910 1920 1930 1940 1950 1960 1970 1980 19900
5
10
15
20
25
30
White Males White Females Black Males Black Females
Figure 10: Percent of Married Persons Aged 15-29 Living with a Parent. In general, few married persons lived with a parent, except during the relative housing shortage that existed in the mid-twentieth century. More married young blacks than whites have lived with parents since 1940. Source data: see Table B.9.
In Figure 10, we show the percent of married people who lived with at least one parent. From
1880 to 1990, there was little difference between married men and women. Race became more
important after 1920, as married blacks were more likely than married whites to live with a parent.

Three Eras of Young Adult Home Leaving in Twentieth-Century America - version of 1/24/01 - page 21
Both races experienced a sharp increase in 1950, because housing was scarce in 1940 and 1950
relative to 1960 and later.29 In 1940 more than twenty percent of the population lived more than
one person per room, a percentage that fell to about sixteen percent in 1950, but only 8.5 percent in
1960. Housing shortages in 1940 and 1950 led to a relatively large proportion of married young
people living with a parent, a pattern that was sharply reduced by 1960, and had only partly returned
in 1980 and 1990.30 The increase that all groups experienced in living with a parent from 1980 to
1990 may reflect the recent tendency for adults to return home, either for financial reasons or to
care for aging parents.
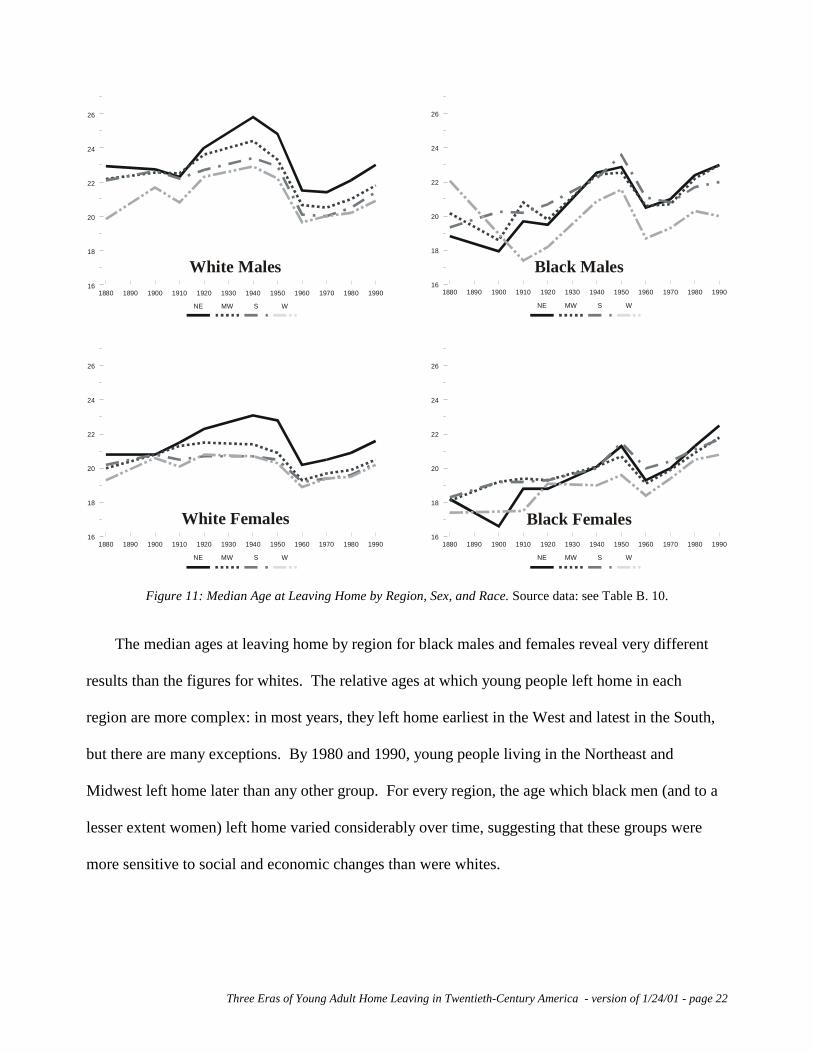
The age at which young men and women left home varied considerably across the regions of
the United States. For white men and women, a consistent pattern emerges (Figure 11). Young
men left home earliest in the West and latest in the Northeast. Young people in all four regions
experienced the same relative changes in home-leaving over time. One exception is the low age at
leaving home for Western young men in 1880, which is a result of westward migration and
employment possibilities for the very young. Overall, these results are very similar to the national
results for whites (Figure 1), because of the large proportion in all time periods of young people
who were white.
Three Eras of Young Adult Home Leaving in Twentieth-Century America - version of 1/24/01 - page 22
1880 1890 1900 1910 1920 1930 1940 1950 1960 1970 1980 199016
18
20
22
24
26
NE MW S W
1880 1890 1900 1910 1920 1930 1940 1950 1960 1970 1980 199016
18
20
22
24
26
NE MW S W
1880 1890 1900 1910 1920 1930 1940 1950 1960 1970 1980 199016
18
20
22
24
26
NE MW S W
1880 1890 1900 1910 1920 1930 1940 1950 1960 1970 1980 199016
18
20
22
24
26
NE MW S W
White Females Black Females
Black MalesWhite Males
Figure 11: Median Age at Leaving Home by Region, Sex, and Race. Source data: see Table B. 10.
The median ages at leaving home by region for black males and females reveal very different
results than the figures for whites. The relative ages at which young people left home in each
region are more complex: in most years, they left home earliest in the West and latest in the South,
but there are many exceptions. By 1980 and 1990, young people living in the Northeast and
Midwest left home later than any other group. For every region, the age which black men (and to a
lesser extent women) left home varied considerably over time, suggesting that these groups were
more sensitive to social and economic changes than were whites.

Three Eras of Young Adult Home Leaving in Twentieth-Century America - version of 1/24/01 - page 23
1880 1890 1900 1910 1920 1930 1940 1950 1960 1970 1980 199018
20
22
24
26
White Fem. on Farms White Fem. not on Farms Black Fem. on Farms Black Fem. not on Farms
1880 1890 1900 1910 1920 1930 1940 1950 1960 1970 1980 199018
20
22
24
26
White Males on Farms White Males not on Farms Black Males on Farms Black Males not on Farms
Male Female
Figure 12: Median Age at Leaving Home by Race and Farm Status. Source data: see Table B. 11.
Farm residence is another important factor that determined the timing of home leaving for
young people in the U.S. For all four groups (black and white, male and female), farm residents left
home later than non-farm residents until at least 1940 (Figures 12). This could be a function of
different social conditions for those who lived on the farm, so that they were slower to leave their
parents’ homes. Alternatively, it could be an artifact of social change, so that the prevailing pattern
of home leaving was one where young people moved from farm to non-farm residence when they
left home. Beginning in 1950, the differentials changed. For males, since 1950 those not living on
farms had higher median ages at leaving home, something that was especially so for black men.
This may represent the final surge of off-farm migration. For females, the pattern appears rather
different. Farm females continued to leave home later than non-farm females, and the difference
becomes more pronounced beginning in 1950.

Three Eras of Young Adult Home Leaving in Twentieth-Century America - version of 1/24/01 - page 24
1880 1890 1900 1910 1920 1930 1940 1950 1960 1970 1980 199017
18
19
20
21
22
23
24
25
Male Foreign Male Native Fem. Foreign Fem. Native
Figure 13: Median Age of Leaving Home by Nativity and Sex, White Males and Females. Source data: see Table B. 12.
The final set of issues we report have to do with migration. It stands to reason that young
people who have migrated away from their place of birth were likely to have home-leaving ages
younger than those who still lived in their place of birth. We examine this question from two points
of view. In Figure 13 we report the differences between native-born and foreign born young white
people in terms of home leaving ages (there are relatively few foreign born-born blacks, which
makes their results less interesting). This graph demonstrates that there was a dramatic difference
between the U.S.-born and the foreign born in the ways we expected, and that the differences
diminished over time, so that there is little difference in home-leaving ages for females by 1970,
and not much more difference for males in recent years. In Figure 14 we describe the differences in
the median age at leaving home between native-born young people who are still living in their
region of birth, and those who are currently living in a different region. These results show that
those living in the region of their birth consistently stay with their parents longer than do those who

Three Eras of Young Adult Home Leaving in Twentieth-Century America - version of 1/24/01 - page 25
leave, and that the differences for males is larger than for females. It is also interesting to note that
the differences are larger for blacks than for whites beginning in 1950.
1880 1890 1900 1910 1920 1930 1940 1950 1960 1970 1980 19900
1
2
3
4
5
6
7
White Males White Females Black Males Black Females
Figure 14: Difference in Home Leaving Age by Migration Status. Value presented is the difference between age at leaving home for those who have still live in their region of birth, and those who no longer live in their region of birth. This analysis is limited to the native-born. Source data: see Table B. 13.
In the analysis thus far, we have emphasized what we can learn by looking at the trends in
median home-leaving ages and proportions away from home for specific groups within the
population. We have also combined these analyses and estimated logistic regression models for
each year. We estimate the regressions in order to see if there are combinations of independent
variables that when used simultaneously change our overall interpretation or give us a different way
of seeing the role played by one independent variable or one set of social conditions. We are
especially interested in using this analysis -- which we explain and report fully in Appendix C -- to
give us a sense of the relative importance of the independent variables in explaining home leaving,
which is not clear from the medians and proportions we have discussed thus far.

Three Eras of Young Adult Home Leaving in Twentieth-Century America - version of 1/24/01 - page 26
For men and women of both races, a few variables clearly have the most impact in influencing
whether a person lives at home or away. In these results, age, marital status, age, and foreign
nativity explain most of the variance in living away from home. The importance of age is
predictable, because as young people aged they were more likely to be away from their parents.
Despite the logical importance of age, marital status is in fact the strongest predictor of leaving
home for all groups, which is a predictable consequence of the high association in U.S. society for
married people to establish their own households. The effects are greater for whites than for blacks,
and for women than for men. For women, the importance of marriage in determining the likelihood
of leaving home declines steadily from the late nineteenth century to the present, with important
declines between 1900 and 1910, and after 1960 (for white females) and 1970 (for black females),
with a very sharp decline after 1970. The overall decline in the importance of marriage for home-
leaving for females is very substantial. We suspect that the decline in importance in marriage as a
predictor of home-leaving has two causes. The first is the rising age at marriage. As fewer people
were married at each age, their importance in the overall pool of home-leavers diminished. The
second is the genuine trend for married people to be living with their parents shown in Figures 3
and 4. Married black women are less likely to live away from their parents than white women, in
every time period.
Nativity is the second major predictor of leaving home. The variable is much more likely to be
significant among whites than blacks, because only a few blacks were recorded as foreign born until
recent years. What is most interesting about the foreign-born and home-leaving is the change in the
direction of the relationship that takes place beginning after 1950. The general pattern up through
1950 is that the foreign-born were much more likely to be living away from their parents than the
native-born, something we would expect based on a migration pattern in which a large proportion of

Three Eras of Young Adult Home Leaving in Twentieth-Century America - version of 1/24/01 - page 27
young people came to the United States separately from their parents. Beginning in 1960 for white
males and 1970 for white females (and in 1980 for black males and females), the effect is reversed:
the foreign born are less likely to live away from their parents, perhaps a reflection of more family-
oriented migration streams that have emerged since the second world war.31 The variable that
identifies people living away from the region of their birth describes a strong and predictable
relationship between migration and home-leaving. Consistently over the century, young people who
have moved away from their region of birth are twice as likely as those who have not to live away
from their parents.
Conclusion
We began this article with the assertion that three time periods define the long-term trend in
home leaving ages in the United States since 1880. The evidence of those trends is clear from our
first pages, where Figure 1 demonstrates those trends. What we have done in the pages that follow
is to show the underlying elements that contributed to the creation of our periodization, as well as to
reveal key differences between young Americans by race and sex, region and residence.
In the Long First Half of the Twentieth Century, from 1880 until 1940 for men, and 1950 for
women, ages at leaving home rose in the United States. This is the most dramatic finding of our
research, because it contradicts assertions by other historians that the age of home leaving was
falling during much of this time period, part of a long trend that they assert did not end until the
1960s or later. We show otherwise. The explanation is clear in the supporting data we present.
While orphanhood never separated a large proportion of young Americans from their parents,
declining mortality gave it less and less of an impact. Much more important than mortality were
increases in school attendance and declines in the employment of teenagers. Children attending

Three Eras of Young Adult Home Leaving in Twentieth-Century America - version of 1/24/01 - page 28
secondary school but not employed were much more likely to live at home with their parents. Even
a lack of new housing in the 1930s contributed.
The Second World War brought dramatic changes to the timing of home-leaving for young
Americans. Increased military service and the transformation of economy and society spurred by
wartime mobilization drew young people away from their homes. After the war the process was
never fully reversed, so that at the time of the 1950 census young men were still more likely than in
1940 to be living apart from their parents, and young women were about to experience the same
trend. The draft and near-compulsory military service was only part of the process, even with the
continuing military obligations of the United States in Asia and Europe throughout the 1950s and
1960s, and into the 1970s. The end of the Second World War brought with it a sharp increase in
marriages for whites, if not for blacks. Through policies like the G.I. bill and state-sponsored post-
secondary education, more and more young people attended colleges and universities, and in doing
so lived away from home.
The War and Post-War decline in home-leaving ages was short-lived in our view, especially
when compared with the assessments of other historians. There was no century-long trend toward
declining ages of leaving home. Instead, the pattern was over after 1960 for blacks and 1970 for
whites, to be followed by a new set of paradigms for young people. These new paradigms were
experienced by the young people we have called the Baby Boomers and After. Reduced obligations
for military service led more young people to live at home with their parents. So did more available
local higher education in the form of community colleges. Finally, and most difficult to define,
changing expectations in terms of consumption and living arrangements made it more likely that
some young people would choose to return to living with their parents in order to spend more of
their disposable income on cars, food, and consumer goods, and less on rent.

Three Eras of Young Adult Home Leaving in Twentieth-Century America - version of 1/24/01 - page 29
The results we have presented are not simply about trends through time that cut across all
groups within the society of the United States. We have identified equally dramatic variations by
sex and race. The importance of military service in our explanations means that our findings are
more dramatic for men than for women. For women, the temporal trends that we associate with the
Second World war and its aftermath are less dramatic than they are for men. On the other hand, the
liberating social forces in the second half of the century that allowed women more flexibility in the
choices they make about their lives have led to substantial long-term changes in the home-leaving
experiences.
Similarly, young people of African descent in America have had a noticeably different set of
experiences than those of the white majority. While the gendered impact of military service for men
was shared by blacks and whites, racial variations in education and employment have distinguished
the two largest racial groups in the U.S. The housing shortage that led to more black than white
young married couples living with their parents was probably a consequence of both greater black
poverty and slower housing construction in some communities. The boom in higher education that
followed the Second World War was more pronounced for white men and women than for blacks,
despite G.I. Bill benefits for all veterans. Employment opportunities have generally been greater for
whites than blacks as well. Taken together, these factors led to less dramatic changes for blacks than
for whites after World War II, especially in the 1960s when the impact of higher education growth
may have been most rapid. In all this, region, residence, and migration have mattered as well, a sign
of their continued importance in the development of American society.
The broader message in our results is about the close correlation between the timing of home-
leaving for young Americans over the past century and longer, and the broadest social and cultural
transformations that we have experienced. There should be little surprise in that, but the story told

Three Eras of Young Adult Home Leaving in Twentieth-Century America - version of 1/24/01 - page 30
here shows that the big themes of transformation in migration, education, and military service,
coupled with the expansion of civil rights and the social emancipation of women and young adults,
has had a measurable impact on lives. We have made a cultural and social world for our children,
and they have lived in it and shaped it and their own lives at the same time.

Three Eras of Young Adult Home Leaving in Twentieth-Century America - version of 1/24/01 - page 31
APPENDIX A: Data and Methods for this Analysis
Sources of Data
For this paper, we use individual-level data from the United States Census of Population. Our
data come from the Integrated Public Use Microdata Series (IPUMS) prepared by the University of
Minnesota.32 We examine patterns in home leaving ages for the U.S. from 1880 to 1990. Within
that context we look at the differences between males and females, blacks and whites, farm and
non-farm residents, regional populations, and married and unmarried. Our analysis is twofold. We
calculate medians and quartiles of the age at leaving home by sex and race, using a fitted curve
derived from a logit regression model. We also use logit regressions for each sex and race subgroup
to test for the influence of contextual factors on the age at leaving home. In this analysis we assume
that the IPUMS samples are flat samples, and we have not used weights or attempted to adjust for
unrepresentative cases.
The coding of family relationships in the IPUMS data sets gives us a straightforward way to
characterize whether young people were still living with their parents or not, and then to estimate
the ages at which the transition took place. The IPUMS data sets consistently provide two variables
(momloc and poploc) that tell whether a person’s mother or father is living in the same household,
and then identifies that person in the data. We have used any valid value for these variables to
indicate that a person is still living with his or her mother or father; a value of zero indicates that the
person has already left his or her household of origin.

Three Eras of Young Adult Home Leaving in Twentieth-Century America - version of 1/24/01 - page 32
We analyze this transition from living with parents, to living away from parents, within a
multivariate statistical framework. Such a framework allows us to include several predictors of the
transition simultaneously, to estimate the intensity of their effects individually and in the presence
of other predictors, to evaluate the statistical significance of these effects, and to produce fitted
values.
Estimating the Distribution of Home-Leaving Ages
Our major methodological challenge is that our data do not include information about actual
transitions, but are limited to cross-sectional information about whether individual persons do or do
not live with their parents at a single point in time. An age distribution at the time of a census must
be synthesized into the behavior over time of an artificial or synthetic cohort, in the same sense that
a life table is a synthesis of cross-sectional data on mortality and survivorship. A life table is
typically summarized with the mean age at death, or expectation of life, but it could also be
summarized with the median age at death, and perhaps the first and third quartiles of the age at
death. Here we would like to estimate the quartiles of the distribution of age at leaving home,
within categories of covariates.
As a demographic transition, leaving home is much more comparable to marriage than to death.
Most of these transitions occur within a fairly narrow range of ages, about fifteen years, and not
everyone makes the transition. Persons who have made the transition remain in the population and
can be observed in a census or survey.
We will briefly describe two methods, well established in the demographic literature, for
describing the distribution of age at first marriage. The first, due to John Hajnal, is called the

Three Eras of Young Adult Home Leaving in Twentieth-Century America - version of 1/24/01 - page 33
singulate mean age at marriage (SMAM).33 It uses the proportions of women at each age who are
still unmarried, typically from a census. After removing an estimate of the proportion of women
who will not marry by age 55, the SMAM calculates the mean number of years lived in the
unmarried state, which is interpreted as a synthetic cohort estimate of the mean age at marriage (for
those who marry by age 55).
A second method to describe age at marriage is due to Coale and McNeil.34 They observed a
widespread international regularity in the distribution of age at marriage, which they were able to fit
very well with a specific function having three parameters. The risk or hazard that an unmarried
person of age a will marry in the interval a to a+da was found by Coale and McNeil to be closely
approximated with a double exponential function. The three parameters can be interpreted as an
initial age when marriages begin to be observed, the mean age at marriage, and the proportion who
never marry.
These two approaches can be modified to produce estimates of the mean age at leaving home or
the quartiles of the age at leaving home, with cross-sectional data on the proportions still at home,
rather than the proportions still unmarried. However, neither approach has any of the desirable
properties of a multivariate statistical model. Estimates must be re-calculated within separate
categories or combinations of predictors, there is no easy way to hold other covariates constant, and
there are no estimates of standard errors. Therefore, we prefer to draw on statistical rather than
demographic methods.
For most populations, when cross-sectional data on the proportion of persons who have left
home is graphed against age, the curve has the clear shape of an ogive. For the youngest ages, the
proportion is close to zero; it typically increases gradually in the early teens, very steeply in the late

Three Eras of Young Adult Home Leaving in Twentieth-Century America - version of 1/24/01 - page 34
teens and early twenties, and then levels off at a high level in the late twenties. It does not appear to
have an asymptote of one.
This kind of curve can be fitted with hazard models, but it can also be fitted very well, and
more simply, with a logit model that includes age, age squared, and covariates. A quadratic term
for age is needed because the deceleration in the rate of leaving home in the later ages is typically
less than the acceleration in the earlier ages.
After considerable testing of alternatives, we ran such logit regressions on the individual-level
files for persons aged 15-29 for each census year, with a binary dependent variable that was 1 if the
person was not living with parents and 0 if still living with parents. Because sex and race frequently
had significant interactions with the other four covariates--marital status, farm/nonfarm residence,
nativity, and region--we did separate analyses within each of the four combinations of sex and race.
We first did logit regressions with no covariates; with each of the four covariates; and then with all
four, in which each of these covariates would be adjusted for the effect of the other three. The
significance of a covariate, before or after adjustment for the others, is indicated by the standard
error for the coefficients in these logit regressions or by the improvement in fit when the covariate is
included.
The median age (or second quartile) at leaving home was found by determining the value of
age for which the fitted logit was log(.50/.50) = 0. The first quartile of the distribution is the value
of age for which the fitted logit is log(.25/.75) = -log(3) and the third quartile is the value of age for
which the fitted logit is log(.75/.25) = log(3). Standard errors of the estimated quartiles were also
estimated but are not included in the present paper, in order to avoid excessive complexity.

Three Eras of Young Adult Home Leaving in Twentieth-Century America - version of 1/24/01 - page 35
Calculating Estimates of Orphanhood
Haines gives plausible decennial life tables for 1850 through 1900, based on the Coale and
Demeny model West life tables. After 1900, the U.S. Department of Health and Human Services
gives decennial life tables based on vital statistics data.35 A complete series of life tables is
available from these sources for the total population of the United States, separately for males and
females but not for other subpopulations.
We assumed that persons were born when both parents were exactly age 30 and then estimated
the probability that the mother and father (separately) would have survived to exact ages 45, 50, 55,
and 60, at which time the child would be aged 15, 20, 25, and 30, respectively. For example, to
estimate the probability that the father of a 20-year old in 1900 was still alive, we calculated the
probabilities of surviving from 30 to 35, 35 to 40, 40 to 45, and 45 to 50. These four survival
probabilities were drawn from life tables for 1885, 1890, 1895, and 1900, and multiplied together.
(The probability of surviving from 30 to 35 in 1885, for example, was obtained as the geometric
mean of the probability of surviving from 30 to 35 in 1880 and 1890.) Finally, the probability that
this father was not still alive in 1900 was multiplied by the probability that the mother was not still
alive, giving the probability that both had died and the child was an orphan. This step assumes that
the survival of the mother and the survival of the father are independent. It is likely that they are
not independent, but are positively correlated.

Three Eras of Young Adult Home Leaving in Twentieth-Century America - version of 1/24/01 - page 36
APPENDIX B: Source Tables for Graphical Data Presented in the Text.
Table B.1: Estimated Quartiles for Number of Years Lived with One or Both Parents, United States, 1880-1990
White Males 1880 1900 1910 1920 1940 1950 1960 1970 1980 1990 First Quartile 18.5 18.8 18.9 20.0 20.9 20.6 18.5 18.6 18.8 19.1Second Quartile (Median) 22.3 22.6 22.0 23.3 24.3 23.4 20.5 20.4 20.9 21.7Third Quartile 26.2 27.0 26.5 28.0 28.9 27.5 23.3 22.9 23.6 25.3 White Females First Quartile 15.2 16.6 17.4 17.9 18.4 19.5 17.8 18.0 18.7 18.5Second Quartile (Median) 19.4 20.1 20.2 20.5 22.2 23.3 20.7 20.7 21.7 22.6Third Quartile 22.9 23.7 23.7 24.1 26.5 27.9 24.6 24.4 25.9 * Black Males First Quartile 17.2 17.6 17.9 18.5 18.8 18.8 17.8 18.1 18.2 18.5Second Quartile (Median) 20.3 20.8 20.9 21.4 21.6 21.2 19.4 19.7 19.9 20.6Third Quartile 24.6 25.2 25.4 26.1 26.2 24.8 21.5 21.8 22.1 23.4 Black Females First Quartile 15.9 16.2 16.6 16.9 17.1 18.0 17.2 17.8 18.4 18.5Second Quartile (Median) 18.3 19.8 19.1 19.3 20.0 21.3 19.7 20.2 21.0 21.8Third Quartile 21.3 22.8 22.6 22.6 24.3 27.1 23.1 23.3 24.6 27.2 *Estimate unavailable due to limitations in the data.As the median age at which white women leave home increases, it approaches the upper age limit of our data sample. This, combined with the slope of the change over time, produced clearly erroneous results.Source: Estimated from the Integrated Public Use Microdata Series (IPUMS) data for each year. Table B.2: Percent Ever Married, by Age, United States, 1880-1980 1880 1900 1910 1920 1940 1950 1960 1970 1980 1990White Males Aged 20-24 20.5 19.5 22.3 27.2 26.6 37.6 32.0 45.4 33.7 23.8White Females Aged 15-19 11.0 11.2 11.1 12.0 10.8 13.7 14.0 12.1 9.6 6.0White Females Aged 20-24 49.4 45.9 48.6 52.9 51.2 65.3 41.2 65.3 51.8 40.4Black Males Aged 20-24 39.0 34.1 41.0 44.6 40.8 43.9 30.6 40.9 22.2 14.8Black Females Aged 15-19 18.4 16.3 18.4 22.9 18.4 18.8 13.9 11.5 4.8 3.1Black Females Aged 20-24 65.3 59.9 66.2 69.2 63.5 65.6 38.8 56.7 32.4 20.5 Source: Tabulated from Integrated Public Use Microdata Series (IPUMS) data for each year.

Three Eras of Young Adult Home Leaving in Twentieth-Century America - version of 1/24/01 - page 37
Table B.3: Percent of Persons aged 15-19 in Labor Force, United States, 1880-1980 1880 1900 1910 1920 1940 1950 1960 1970 *1980 1990White Males 70.0 67.5 70.1 57.6 34.3 43.6 44.4 64.1 61.2 54.5White Females 23.7 27.4 32.6 34.7 18.2 26.1 28.7 49.5 56.2 51.4Black Males 86.6 81.3 84.9 69.4 49.8 52.3 36.6 49.1 42.4 39.1Black Females 54.1 48.0 60.3 40.5 24.4 21.4 19.8 36.9 37.0 38.1 Source: Tabulated from Integrated Public Use Microdata Series (IPUMS) data for each year. *Figures for 1980 are for persons aged 16-19. Table B.4: Percent of Persons Aged 15-19 Attending School, United States, 1880-1980 1880 1900 1910 1920 1940 1950 1960 1970 1980 1990White Males 35.2 31.5 39.5 39.6 57.7 64.0 72.0 81.1 75.3 80.5White Females 29.5 32.2 40.5 41.5 56.3 59.7 68.0 76.7 75.0 81.1Black Males 14.0 17.6 25.6 31.8 43.5 52.1 64.0 74.0 74.6 77.7Black Females 14.9 21.7 32.5 36.8 45.9 53.7 62.6 72.3 76.6 79.8 Source: Tabulated from Integrated Public Use Microdata Series (IPUMS) data for each year. Table B.5: Percent of Persons Who Have Served in Military by Cohort Aged 15-19 1930 1940 1950 1960 1970 1980White Males Veteran 6.4 58.6 73.3 47.1 37.0 15.0 No Service 17.6 39.5 24.9 51.5 63.0 85.0 N/A 75.6 1.9 1.8 1.4 0.0 0.0Black Males Veteran 4.5 44.1 58.5 33.4 30.7 19.9 No Service 18.1 54.8 39.8 64.8 69.3 80.1 N/A 77.4 1.1 1.7 1.8 0.0 0.0White Females Veteran 0.0 0.0 0.0 1.1 1.2 1.5 No Service 0.0 0.0 0.0 98.8 98.8 98.5 N/A 0.0 0.0 0.0 0.0 0.0 0.0Black Females Veteran 0.0 0.0 0.0 1.2 1.8 2.7 No Service 0.0 0.0 0.0 98.7 98.2 97.3 N/A 0.0 0.0 0.0 0.1 0.0 0.0 Source: Tabulated from Integrated Public Use Microdata Series (IPUMS) data for each year. For explanation of tabulations, see caption for Figure 5.

Three Eras of Young Adult Home Leaving in Twentieth-Century America - version of 1/24/01 - page 38
Table B.6. Population Aged 15-19 by Nativity, Percentages. 1880 1900 1910 1920 1940 1950 1960 1970 1980 1990White Males Native Born 86.7 85.8 75.0 87.6 96.7 97.5 96.8 96.0 94.0 90.6 Foreign Born 13.3 14.2 25.0 12.4 3.3 2.5 3.2 4.0 6.0 9.4Black Males Native Born 99.6 99.4 96.7 98.6 98.9 98.9 98.9 98.2 95.8 94.0 Foreign Born 0.4 0.6 3.3 1.4 1.1 1.1 1.1 1.8 4.2 6.0White Females Native Born 87.5 86.1 81.0 88.5 96.5 97.1 96.3 95.5 94.4 92.1 Foreign Born 12.5 13.9 19.0 11.5 3.5 2.9 3.7 4.5 5.6 7.9Black Females Native Born 99.6 99.9 97.5 99.0 99.0 99.1 99.2 98.1 96.0 94.1 Foreign Born 0.4 0.1 2.5 1.0 1.0 0.9 0.8 1.9 4.0 5.9 Source: Tabulated from Integrated Public Use Microdata Series (IPUMS) data for each year. Table B.7: Estimated Probability of Orphanhood (both parents dead) by time period and child’s age, United States, 1880-1990 1880 1890 1900 1910 1920 1930 1940 1950 1960 1970 1980 199015 0.025 0.024 0.018 0.016 0.012 0.010 0.006 0.003 0.002 0.001 0.001 0.00120 0.047 0.047 0.037 0.033 0.027 0.023 0.017 0.010 0.005 0.004 0.003 0.00225 0.086 0.083 0.071 0.061 0.052 0.046 0.038 0.025 0.015 0.011 0.008 0.00630 0.147 0.140 0.122 0.113 0.095 0.086 0.076 0.056 0.038 0.028 0.021 0.015 Source: Estimated from life tables presented in Historical Methods and Vital Statistics of the United States. For explanation of method, see Appendix A. Table B.8: Estimated Inter-Quartile Ranges in Age at Leaving Home, 1880-1990 1880 1900 1910 1920 1940 1950 1960 1970 1980 1990White Males 7.8 8.2 7.6 8.0 8.0 6.9 4.8 4.3 4.8 6.2White Females 7.7 7.1 6.3 6.2 8.1 8.4 6.8 6.4 7.2 *Black Males 7.4 7.7 7.5 7.6 7.4 6.0 3.7 3.7 3.9 4.9Black Females 5.4 6.6 6.0 5.7 7.2 9.1 5.9 5.5 6.2 8.7 Source: Estimated from the Integrated Public Use Microdata Series (IPUMS) data for each year. *For 1990 the third quartile figure is unavailable. (see Table 1).

Three Eras of Young Adult Home Leaving in Twentieth-Century America - version of 1/24/01 - page 39
Table B.9: Percent of Persons Aged 15-29 who live with Parents, by Marital Status, Race and Sex 1880 1900 1910 1920 1940 1950 1960 1970 1980 1990Married White Males Live with Parents 6.8 6.3 9.4 11.0 12.4 14.2 5.9 4.8 5.4 7.8 Live away from Parents 93.2 93.7 90.6 89.0 87.6 85.8 94.1 95.2 94.6 92.2 Unmarried White Males Live with Parents 65.2 67.4 66.1 76.8 84.8 87.8 74.2 73.3 66.2 65.3 Live away from Parents 34.8 32.6 33.9 23.2 15.3 12.2 25.8 26.7 33.9 34.7 Married Black Males Live with Parents 4.3 4.4 8.1 10.5 14.8 22.9 11.6 9.6 10.6 14.3 Live away from Parents 95.7 95.6 91.9 89.5 85.2 77.1 88.4 90.4 89.4 85.7 Unmarried Black Males Live with Parents 51.2 55.6 59.2 63.9 73.0 80.8 68.7 71.1 66.2 64.7 Live away from Parents 48.8 44.4 40.8 36.1 27.1 19.2 31.3 28.9 33.8 35.3 Married White Females Live with Parents 4.9 5.8 9.6 10.7 11.6 15.5 6.8 5.9 5.1 6.7 Live away from Parents 95.1 94.2 90.4 89.3 88.4 84.5 93.2 94.1 94.9 93.3 Unmarried White Females Live with Parents 72.3 73.6 79.8 83.0 84.3 89.1 79.8 76.8 66.7 65.1 Live away from Parents 27.7 26.4 20.2 17.0 15.7 10.9 20.2 23.2 33.3 35.0 Married Black Females Live with Parents 4.6 6.6 9.6 10.8 14.9 24.1 13.4 11.3 11.6 14.4 Live away from Parents 95.4 93.4 90.4 89.2 85.1 75.9 86.6 88.7 88.4 85.6 Unmarried Black Females Live with Parents 61.0 65.6 68.4 73.6 74.1 82.9 72.2 73.1 64.1 61.0 Live away from Parents 39.0 34.5 31.6 26.4 25.9 17.2 27.8 26.9 36.0 39.0 Source: Tabulated from Integrated Public Use Microdata Series (IPUMS) data for each year.

Three Eras of Young Adult Home Leaving in Twentieth-Century America - version of 1/24/01 - page 40
Table B.10: Median Age at Leaving Home by Region, Sex, and Race 1880 1900 1910 1920 1940 1950 1960 1970 1980 1990White Males Northeast 22.9 22.7 22.3 24.0 25.8 24.8 21.5 21.4 22.1 23.0 Midwest 22.2 22.6 22.5 23.6 24.4 23.3 20.7 20.5 21.0 21.8 South 22.1 22.6 22.2 22.7 23.4 22.9 20.1 20.0 20.5 21.4 West 19.8 21.7 20.8 22.3 22.9 22.2 19.6 20.0 20.2 20.9Black Males Northeast 18.8 17.9 19.7 19.5 22.6 22.9 20.5 21.0 22.4 23.0 Midwest 20.2 18.6 20.8 19.8 22.4 22.6 20.6 20.7 22.2 23.0 South 19.4 20.3 20.2 20.7 22.2 23.6 21.1 20.8 21.7 22.0 West 22.1 * 17.4 18.2 20.9 21.6 18.7 19.3 20.3 20.0White Females Northeast 20.8 20.8 21.5 22.3 23.1 22.8 20.2 20.5 20.9 21.6 Midwest 20.0 20.8 21.3 21.5 21.4 20.9 19.3 19.7 19.9 20.5 South 20.2 20.8 20.5 20.7 20.7 20.5 19.2 19.4 19.6 20.3 West 19.3 20.6 20.1 20.8 20.7 20.3 18.9 19.4 19.5 20.2Black Females Northeast 18.2 16.6 18.8 18.8 20.1 21.3 19.3 20.0 21.3 22.5 Midwest 18.1 19.2 19.4 19.3 20.1 20.7 19.1 19.9 20.9 21.8 South 18.3 19.2 19.2 19.3 20.0 21.5 20.0 20.4 21.1 21.7 West 17.4 * 17.5 19.1 19.0 19.6 18.4 19.4 20.5 20.8* There are so few Blacks in the west in the 1900 IPUMS sample that the computation is unreliable. Source: Estimated from the Integrated Public Use Microdata Series (IPUMS) data for each year. Table B.11: Median Age at Leaving Home by Sex and Farm Residence, 1880-1990
1880 1900 1910 1920 1940 1950 1960 1970 1980 1990White Males on Farms 22.7 24.2 23.8 24.8 25.3 25.3 22.9 23.8 23.8 25.9Black Males on Farms 20.7 21.7 21.6 21.6 21.7 21.4 20.2 21.4 21.4 22.8White Males not on Farms 19.6 21.8 21.3 21.7 23.0 25.5 23.6 23.3 25.5 25.8Black Males not on Farms 18.9 20.2 19.9 19.8 20.5 22.4 21.7 22.1 24.9 24.6 White Females on Farms 21.9 21.8 21.5 22.9 24.1 23.1 20.3 20.3 20.8 21.6Black Females on Farms 20.7 20.4 20.7 21.4 21.6 21.1 19.4 19.7 19.9 20.6White Females not on Farms 19.2 18.6 19.5 19.7 21.8 22.6 20.5 20.7 21.7 22.6Black Females not on Farms 18.0 18.3 18.6 18.8 19.8 20.9 19.5 20.1 21.0 21.8 Source: Estimated from the Integrated Public Use Microdata Series (IPUMS) data for each year.

Three Eras of Young Adult Home Leaving in Twentieth-Century America - version of 1/24/01 - page 41
Table B.12: Median Age of Leaving Home by Nativity, Sex, and Race 1880 1900 1910 1920 1940 1950 1960 1970 1980 1990White Males Foreign 19.7 19.8 19.2 21.0 24.3 21.7 19.9 20.3 20.2 20.3 Native Born 22.6 23.1 23.2 23.7 24.3 23.5 20.5 20.4 20.9 21.8Black Males Foreign 18.8 15.0 18.2 16.7 22.7 21.0 19.0 19.6 20.6 21.0 Native Born 19.4 20.1 20.2 20.6 22.2 23.3 20.8 20.7 21.8 22.0White Females Foreign 17.9 18.1 18.8 19.5 21.6 19.9 18.9 19.7 19.8 20.2 Native Born 20.6 21.2 21.4 21.7 21.6 21.2 19.4 19.7 19.9 20.7Black Females Foreign 18.7 1.4 18.6 17.9 20.0 19.6 18.6 19.2 20.5 21.1 Native Born 18.3 19.0 19.1 19.3 20.0 21.3 19.7 20.2 21.1 21.8 Source: Estimated from the Integrated Public Use Microdata Series (IPUMS) data for each year. Table B.13: Median Age of Leaving Home by Migration Status, Sex, and Race 1880 1900 1910 1920 1940 1950 1960 1970 1980 1990White Males Left Birth Region 20.0 20.2 19.5 21.0 22.4 21.1 18.8 19.2 19.6 20.1 Stayed in Birth Region 22.9 23.3 23.6 24.1 24.7 23.8 21.0 20.9 21.3 22.2Black Males Left Birth Region 18.6 14.1 18.1 18.2 21.3 20.7 19.0 19.3 19.8 20.0 Stayed in Birth Region 19.4 20.3 20.3 20.8 22.4 23.9 21.4 21.3 22.3 23.0White Females Left Birth Region 18.4 18.6 19.1 19.7 20.4 19.6 18.5 19.1 19.2 19.8 Stayed in Birth Region 20.7 21.3 21.6 21.9 21.7 21.4 19.6 19.9 20.1 20.9Black Females Left Birth Region 17.6 15.4 18.2 18.1 19.0 19.2 18.3 19.1 19.9 20.3 Stayed in Birth Region 18.3 19.1 19.2 19.4 20.2 21.7 20.1 20.5 21.3 22.1 Source: Estimated from the Integrated Public Use Microdata Series (IPUMS) data for each year.

Three Eras of Young Adult Home Leaving in Twentieth-Century America - version of 1/24/01 - page 42
APPENDIX C: Logistic Regressions
In addition to the median age at leaving home and the first and third quartile ages, we have
undertaken logistic regressions that demonstrate the influence of each contextual variable on the age
at leaving home.
For these regressions, our dependent variable indicates whether a given person lived away from
both parents. Our independent variables represent a variety of factors that we believe may explain
the variance in living with or away from parents, including age and farm residence, which we have
already described by use of the estimated quartiles and medians. We provide separate regressions
for the four sex and race groups as a recognition of the differences between these groups, and in
order to avoid including a large number of interaction terms in each of the models. We assume that
there would be interactions between sex and race and most of the independent variables in any
combined model. These are the independent variables used in the analysis:
Age and Age Squared. Age is the dominant factor in determining whether a young person has left
their parental home or not, in the sense that there is a steady increase by age in the number of
persons who are no longer living in their parents’ home, no matter what their other characteristics.
We also include age squared because the relationship between age and home-leaving is not linear.
These variables serve more as controls that define the overall process, and their odds ratios are not
necessarily easy to interpret.
Marital Status. While age is the most important factor overall in determining the time at which a
young person leaves home, we will see that marital status is the single most important factor overall
that determines whether he or she lives with parents or not. Simply put, married people are much

Three Eras of Young Adult Home Leaving in Twentieth-Century America - version of 1/24/01 - page 43
less likely to live with their parents than the unmarried, although the strength of the effect varies
through time and across sex and race groups.
Region of Residence. We divide the United States into four regions following standard U.S. census
divisions: Northeast, Midwest, South, and West. We hypothesize that living conditions will be
different in different regions and that these patterns will be expressed in different home leaving
ages. We recognize that the regional differences may reflect different proportions urban, different
racial and ethnic compositions, and different prevailing categories of socio-economic status, not all
of which we can control for in this analysis.
Stayed in Region. This variable represents the residence status of the individual relative to her or his
region of birth. We hypothesize that a person who has stayed in the region of birth is less likely to
live away from his or her parents.
Foreign-born. We hypothesize that persons who were born in a foreign country (and therefore who
have migrated to the U.S.) have a different status relative to living with their parents than do the
native born. The analysis permits us to recognize difference in the social conditions of migration for
the foreign born in different time periods. In some eras it is possible that migrants were more likely
to live with their parents than others, and that they were more likely to live with their parents than
the native born, holding age constant.
Farm Residence. This is the most consistently available variable in the census samples that gives an
indication of residence and economic role. Following the results reported for the estimated quartiles,

Three Eras of Young Adult Home Leaving in Twentieth-Century America - version of 1/24/01 - page 44
we hypothesize that farm residence is associated with later home-leaving, but we recognize that
there is a complication if a large proportion of home leaving involves a move from farm to non-
farm residence.
Percent aged 15-19 in the state attending school. We hypothesize that high levels of involvement in
public education in each state are associated with later ages at leaving home. One reason for this
outcome is that formal education for this age group is conversely related to participation in the labor
force. Young people who are attending high school are more likely to be still living with their
parents, partly because they are not under the financial pressures that apply to people in this age
group who are in the labor force.
We report regression results in Tables C.1 through C.4. The tables present odds ratios rather
than regression coefficients because of their ease of interpretation. For categorical variables, the
odds ratio represents the relative strength of the effect for the category measured relative to the
reference category, so that in Table C.1 in 1880, for example, foreign-born white males were 1.41
times as likely as native-born white males to live away from their parents.
We begin by comparing a model that simply includes age and age squared with one that
includes the full complement of independent variables. The results of these comparisons show two
things. First, the full models have higher values for r-squared, which confirms that the addition of
variables other than age helps explain the variation in home leaving age in a significant way.
Second, the r-squared values for the models for white males and females generally increase from
1880 to 1970, before falling back in 1980 and 1990. The trend of r-squared values for the black
male and female models is not so clear from 1880 to 1970, but has the same reduction in 1980 and

Three Eras of Young Adult Home Leaving in Twentieth-Century America - version of 1/24/01 - page 45
1990 that the models for whites have. This reflects the same reversal in patterns of convergence in
home-leaving that we saw in the trend for inter-quartile ranges. In 1980 and 1990 there is clear
evidence that the trend toward more similarities in the living experiences of young people had
turned around.

Three Eras of Young Adult Home Leaving in Twentieth-Century America - version of 1/24/01 - page 46
Table C.1: Logistic Regression Results, Age at Leaving Home, 1880-1990: Odds Ratios for White Males* Model 1: Age and Age Squared only 1880 1900 1910 1920 1940 1950 1960 1970 1980 1990 Intercept 0.001 0.000 0.000 0.000 0.000 0.000 0.000 0.000 0.000 0.000Age 1.398 1.607 2.463 2.423 2.216 3.121 5.824 6.710 4.897 3.664Age Squared 0.999 0.996 0.987 0.987 0.990 0.983 0.969 0.967 0.974 0.979 R squared 0.232 0.230 0.250 0.265 0.264 0.323 0.357 0.384 0.357 0.307 Model 2: Full Model 1880 1900 1910 1920 1940 1950 1960 1970 1980 1990 Intercept 0.002 0.001 0.000 0.000 0.000 0.000 0.000 0.000 0.000 0.000Age 1.654 1.671 2.271 2.121 1.842 2.216 5.043 6.600 5.235 4.034Age Squared 0.993 0.992 0.986 0.988 0.990 0.987 0.969 0.964 0.970 0.975Marital Status Not Married (ref) 1.000 1.000 1.000 1.000 1.000 1.000 1.000 1.000 1.000 1.000 Married 13.855 18.091 11.400 15.716 19.942 19.709 22.661 23.408 13.363 9.618Place of Birth U.S.-born (ref) 1.000 1.000 1.000 1.000 1.000 1.000 1.000 1.000 1.000 1.000 Foreign-born 1.405 1.576 1.741 1.344 0.544 1.288 0.667 0.521 0.648 0.833Mig. Since Birth Yes (ref) 1.000 1.000 1.000 1.000 1.000 1.000 1.000 1.000 1.000 1.000 Reg. Same as Birth 0.485 0.526 0.376 0.369 0.368 0.337 0.250 0.309 0.383 0.410Region Northeast 0.437 0.686 0.689 0.686 0.583 0.603 0.597 0.627 0.447 0.509 Midwest 0.632 0.923 0.876 0.943 0.818 0.990 0.847 0.904 0.722 0.731 South 0.556 0.970 0.738 1.238 1.036 1.001 0.951 0.937 0.764 0.732 West (reference) 1.000 1.000 1.000 1.000 1.000 1.000 1.000 1.000 1.000 1.000Farm Residence Non-farm (ref) 1.000 1.000 1.000 1.000 1.000 1.000 1.000 1.000 1.000 1.000 Farm 0.781 0.437 0.640 0.475 0.627 0.500 0.325 0.229 0.273 0.283% in School 15-19 0.986 1.006 1.005 1.008 1.005 0.999 0.987 0.989 1.024 1.023 R squared 0.340 0.359 0.381 0.414 0.427 0.477 0.492 0.499 0.449 0.397 Number of cases 62,026 12,286 61,862 121,635 159,270 184,511 152,515 208,694 252,654 231,733 * Coefficients in boldface are significant at alpha=0.05 or less Independent variables are described in Appendix C.

Three Eras of Young Adult Home Leaving in Twentieth-Century America - version of 1/24/01 - page 47
Table C.2: Logistic Regression Results, Age at Leaving Home, 1880-1990: Odds Ratios for Black Males* Model 1: Age and Age Squared only 1880 1900 1910 1920 1940 1950 1960 1970 1980 1990 Intercept 0.036 0.001 0.000 0.000 0.000 0.000 0.000 0.000 0.000 0.000Age 1.053 1.445 2.457 2.735 1.559 1.741 2.464 2.734 2.497 2.124Age2 1.006 0.999 0.987 0.985 0.996 0.994 0.986 0.984 0.986 0.988 R squared 0.235 0.244 0.267 0.273 0.236 0.241 0.276 0.288 0.266 0.175 Model 2: Full Model 1880 1900 1910 1920 1940 1950 1960 1970 1980 1990 Intercept 0.022 2,365.867 0.000 0.000 0.011 0.007 0.000 0.000 0.000 0.000Age 1.168 1.422 2.098 2.039 1.201 1.295 1.930 2.397 2.749 2.212Age Squared 1.001 0.996 0.988 0.988 0.999 0.997 0.989 0.985 0.982 0.986Marital Status Not Married 1.000 1.000 1.000 1.000 1.000 1.000 1.000 1.000 1.000 1.000Married 9.439 15.782 7.859 8.044 8.005 6.821 7.229 10.354 6.768 5.719Place of Birth U.S.–born (ref) 1.000 1.000 1.000 1.000 1.000 1.000 1.000 1.000 1.000 1.000Foreign-born 0.925 0.705 0.771 2.495 0.633 0.948 1.290 1.105 0.774 0.657Mig. Since Birth Yes (ref) 1.000 1.000 1.000 1.000 1.000 1.000 1.000 1.000 1.000 1.000Reg. Same as Birth 0.487 0.000 0.315 0.329 0.485 0.324 0.379 0.425 0.383 0.419Region Northeast 2.459 0.000 0.505 0.608 0.818 1.230 0.757 0.586 0.791 0.701Midwest 1.468 0.000 0.321 0.604 0.765 1.168 0.624 0.625 0.751 0.768South 2.278 0.000 0.651 0.951 1.491 1.881 0.965 0.876 0.873 0.780West (ref) 1.000 1.000 1.000 1.000 1.000 1.000 1.000 1.000 1.000 1.000Farm Residence Non-farm (ref) 1.000 1.000 1.000 1.000 1.000 1.000 1.000 1.000 1.000 1.000Farm 0.951 0.329 0.453 0.406 0.609 0.510 0.422 0.465 0.395 0.569% in School 15-19 1.006 1.003 1.006 1.005 1.013 1.001 0.994 1.023 0.968 0.982 R squared 0.294 0.365 0.347 0.370 0.333 0.339 0.365 0.385 0.337 0.246 Number of cases 8,807 1,708 6,183 14,383 18,081 27,402 18,294 26,150 37,469 31,191 * Coefficients in boldface are significant at alpha=0.05 or less Independent variables are described in Appendix C.

Three Eras of Young Adult Home Leaving in Twentieth-Century America - version of 1/24/01 - page 48
Table C.3: Logistic Regression Results, Age at Leaving Home, 1880-1990: Odds Ratios for White Females* Model 1: Age and Age Squared only 1880 1900 1910 1920 1940 1950 1960 1970 1980 1990 Intercept 0.000 0.000 0.000 0.000 0.000 0.000 0.000 0.000 0.000 0.000Age 1.971 2.177 2.821 3.028 3.629 4.773 8.801 8.468 6.518 4.582Age2 0.991 0.989 0.983 0.982 0.978 0.973 0.961 0.962 0.968 0.975 R squared 0.211 0.218 0.231 0.247 0.266 0.310 0.377 0.399 0.375 0.345 Model 2: Full Model 1880 1900 1910 1920 1940 1950 1960 1970 1980 1990 Intercept 0.004 0.002 0.000 0.000 0.000 0.000 0.000 0.000 0.000 0.000Age 1.447 1.434 1.777 1.831 2.282 2.374 4.940 5.977 6.019 4.409Age Squared 0.994 0.994 0.990 0.989 0.985 0.984 0.969 0.966 0.967 0.973Marital Status Not Married (ref) 1.000 1.000 1.000 1.000 1.000 1.000 1.000 1.000 1.000 1.000 Married 39.662 37.089 25.984 25.206 23.684 21.392 22.075 19.856 14.824 10.299Place of Birth U.S.-born (ref) 1.000 1.000 1.000 1.000 1.000 1.000 1.000 1.000 1.000 1.000 Foreign-born 2.232 1.809 1.547 1.455 0.832 1.458 1.062 0.647 0.575 0.646Mig. Since Birth Yes (ref) 1.000 1.000 1.000 1.000 1.000 1.000 1.000 1.000 1.000 1.000 Reg. Same as Birth 0.681 0.554 0.560 0.575 0.590 0.527 0.484 0.519 0.515 0.517Region Northeast 1.119 1.541 1.227 1.091 0.659 0.591 0.743 0.674 0.459 0.590 Midwest 1.212 1.318 1.235 1.298 1.042 1.050 1.146 1.027 0.759 0.824 South 1.124 1.267 1.015 1.429 1.070 1.073 1.132 0.984 0.817 0.801 West (reference) 1.000 1.000 1.000 1.000 1.000 1.000 1.000 1.000 1.000 1.000Farm Residence Non-farm (ref) 1.000 1.000 1.000 1.000 1.000 1.000 1.000 1.000 1.000 1.000 Farm 0.625 0.476 0.697 0.656 0.592 0.742 0.469 0.299 0.315 0.297% in School 15-19 0.998 1.011 1.016 1.019 1.000 1.005 1.025 1.017 1.042 1.031 R squared 0.440 0.451 0.454 0.467 0.469 0.477 0.504 0.510 0.470 0.429 Number of cases 60,752 12,343 57,506 122,258 161,003 190,989 154,992 213,530 249,252 225,118 * Coefficients in boldface are significant at alpha=0.05 or less Independent variables are described in Appendix C.

Three Eras of Young Adult Home Leaving in Twentieth-Century America - version of 1/24/01 - page 49
Table C.4: Logistic Regression Results, Age at Leaving Home, 1880-1990: Odds Ratios for Black Females* Model 1: Age and Age Squared only 1880 1900 1910 1920 1940 1950 1960 1970 1980 1990 Intercept 0.000 0.000 0.000 0.000 0.000 0.000 0.000 0.000 0.000 0.000Age 2.795 2.202 3.195 3.414 2.772 2.664 3.631 3.743 3.045 2.460Age2 0.983 0.988 0.980 0.979 0.983 0.984 0.978 0.978 0.983 0.986 R squared 0.222 0.211 0.220 0.242 0.216 0.215 0.261 0.308 0.295 0.222 Model 2: Full Model 1880 1900 1910 1920 1940 1950 1960 1970 1980 1990 Intercept 0.003 17,602.567 0.001 0.000 0.001 0.001 0.000 0.000 0.000 0.000Age 1.561 1.264 1.806 1.793 1.588 1.514 2.215 2.611 2.922 2.505Age Squared 0.993 0.998 0.989 0.990 0.992 0.993 0.986 0.983 0.982 0.984Marital Status Not Married (ref) 1.000 1.000 1.000 1.000 1.000 1.000 1.000 1.000 1.000 1.000 Married 19.726 20.562 13.436 13.675 10.052 8.695 8.413 9.553 5.597 4.505Place of Birth U.S.-born (ref) 1.000 1.000 1.000 1.000 1.000 1.000 1.000 1.000 1.000 1.000 Foreign-born 0.722 999.000 0.665 1.385 0.648 1.041 1.140 1.135 0.697 0.740Mig. Since Birth Yes (ref) 1.000 1.000 1.000 1.000 1.000 1.000 1.000 1.000 1.000 1.000 Reg. Same as Birth 0.712 0.332 0.567 0.430 0.450 0.373 0.447 0.536 0.518 0.550Region Northeast 1.080 0.000 1.214 1.800 0.925 1.120 1.144 0.906 0.942 0.811 Midwest 0.962 0.000 0.679 1.099 0.727 1.010 1.000 0.894 1.018 0.997 South 1.000 1.000 1.000 1.000 1.000 1.000 1.000 1.000 1.000 1.000 West (reference) 1.000 1.000 1.000 1.000 1.000 1.000 1.000 1.000 1.000 1.000Farm Residence Non-farm (ref) 1.000 1.000 1.000 1.000 1.000 1.000 1.000 1.000 1.000 1.000 Farm 0.584 0.426 0.499 0.573 0.648 0.736 0.522 0.550 0.332 0.476% in School 15-19 1.002 0.994 1.006 1.008 1.008 1.003 1.004 1.035 0.996 0.982 R squared 0.373 0.398 0.368 0.393 0.353 0.341 0.370 0.410 0.352 0.273 Number of cases 9,438 1,790 6,830 16,076 20,309 31,227 20,384 28,795 40,992 34,020 * Coefficients in boldface are significant at alpha=0.05 or less Independent variables are described in Appendix C.

Three Eras of Young Adult Home Leaving in Twentieth-Century America - version of 1/24/01 - page 50
Notes 1 This research has been supported by grant HD33554 from the National Institute of Child Health
and Human Development. We thank Michele Butler, who got us started on this topic, and on the
other members of the Great Plains Population and Environment group in Austin, as well as to Matt
Sobek. We presented earlier versions of this paper at the Annual Meetings of the Population
Association of America in New York, March, 1999, and the Social Science History Association in
Fort Worth, November, 1999, and at seminars at Brown University, at SUNY University at
Albany, and the University of Michigan in 2000. We are grateful for all the helpful suggestions we
received from those audiences.
2 The census enumeration forms for 1890 were destroyed in a fire, making detailed analysis of the
1890 census impossible; no 1930 census data are available for this analysis, because those census
schedules will not be available for consultation until 2002, and the preparation of public use data
files will then take several years. See the discussion of sources and methods later in this article for
more details.
3 In order to simplify analysis, we have excluded persons who were not classified as “white” or
“black” in the census. In all years, persons of Hispanic origin are classified as “white.”
4 Frances K. Goldscheider and Calvin Goldscheider, “Leaving and Returning Home in 20th Century
America,” Population Bulletin 48 (1994): 1-34; Timothy W. Guinnane and Myron P. Gutmann,
“Leaving Home in Nineteenth Century Texas” (Unpublished paper presented at the Annual
Meeting of the Social Science History Association: 1992); Francesca A. Florey and Avery M.
Guest, “Coming of Age among U.S. Farm Boys in the Late 1800s: Occupational and Residential

Three Eras of Young Adult Home Leaving in Twentieth-Century America - version of 1/24/01 - page 51
Choices,” Journal of Family History 13 (1988): 233-249; Modell, John, et al., “Social Change and
Transitions to Adulthood in Historical Perspective,” Journal of Family History 1 (1976): 7-32.
5 For an example of census-based research, see David A. Stevens, “New Evidence on the Timing of
Early Life Course Transitions: The United States 1900 to 1980,” Journal of Family History 15
(1990): 163-178. While our findings contradict his, we do not emphasize the divergence here. We
believe that there are errors in his quantitative analysis, but the article is unclear about methods,
and we could not locate the author for clarification.
6 Goldscheider and Goldscheider 1994.
7 Modell et al.; Stevens.
8 Goldscheider and Goldscheider 1994; F. Goldscheider and C. Goldscheider, The Changing
Transition to Adulthood: Leaving and Returning Home (Thousand Oaks: SAGE Publications,
1999).
9 C. Horace Hamilton, “The Annual Rate of Departure of Rural Youths from Their Parental
Homes,” Rural Sociology 1 (1936): 164-179
10 Timothy W. Guinnane, The Vanishing Irish: Households, Migration, and the Rural Economy in
Ireland, 1850-1914 (Princeton: Princeton University Press, 1997).
11 Fred C. Pampel, “Changes in the Propensity to Live Alone: Evidence from Consecutive Cross-
Sectional Surveys, 1960-1976,” Demography 20 (1983): 433-447.
12 Frances K. Goldscheider and Calvin Goldscheider, Leaving Home Before Marriage: Ethnicity,
Familism and Generational Relationships (Madison: The University of Wisconsin Press, 1993),
169-186.

Three Eras of Young Adult Home Leaving in Twentieth-Century America - version of 1/24/01 - page 52
13 Florey and Guest.
14 Ibid, 246-247.
15 Elliott West, Growing Up in Twentieth-Century America: A History and Reference Guide
(London: Greenwood Press, 1996), 207-208.
16 Ibid, 288-295.
17 Claudia Goldin, “A Brief History of Education in the United States.” Working Paper Series on
Historical Factors in Long Run Growth, Historical Paper 119 (1999), 13-14.
18 Matthew Sobek, “A Century of Work: Gender, Labor Force Participation, and Occupational
Attainment in the United States, 1880-1990” (University of Minnesota: Unpublished Ph.D.
dissertation, 1997).
19 Goldscheider and Goldscheider, 1994.
20 John Modell, Into One’s Own: From Youth to Adulthood in the United States, 1920-1975
(Berkeley: University of California Press, 1989).
21 Goldscheider and Goldscheider, 1994.
22 Ibid.
23 Stevens: 176.
24 Stevens.
25 For a more complete discussion of our computation of orphanhood rates, see Appendix B.
26 Steven Ruggles and Matthew Sobek, Integrated Public Use Microdata Series: Version 2.0
(Minneapolis: Minnesota Historical Census Projects, University of Minnesota, 1997).

Three Eras of Young Adult Home Leaving in Twentieth-Century America - version of 1/24/01 - page 53
27 The definition of a farm changes from census to census. See Ruggles and Sobek; Margo J.
Anderson, The American Census: A Social History (New Haven : Yale University Press, 1988);
U.S. Bureau of the Census, Twenty Censuses: Population and Housing Questions, 1790-1980
(Washington: U.S.G.P.O., 1979).
28 John Hajnal, “Age at Marriage and Proportions Marrying,” Populations Studies 7 (1953):111-36;
Ansley J. Coale, “Age Patterns of Marriage,” Population Studies 25 (1971): 193-214; Ansley J.
Coale and David McNeil, “The Distribution by Age of the Frequency of First Marriage in a
Female Cohort,” Journal of the American Statistical Association 67 (1972): 743-40.
29 There were relatively few housing starts between 1930 and 1945, which led to severe housing
shortages during the war, which continued for some time afterward. Kenneth T. Jackson,
Crabgrass Frontier: The Suburbanization of the United States (New York: Oxford University
Press, 1985), 232.
30 U.S. Bureau of the Census, Census of Housing, 1960, Volume I: States and Small Areas, Part I:
United States Summary (Washington, D.C.: Government Printing Office, 1961), xxviii-xxiv.
31 The decreasing likelihood of immigrants to leave home in the late twentieth century is a complex
issue. One cause of the reversal in that appears in our regression results is the increasing trend for
immigrants to enter the United States as a family (West, 1992, 299). A second possibility is that
foreign-born young adults were less likely to leave home for non-job related reasons, which
include education and financial pressures (Goldscheider and Goldscheider, 1999, 135). We do not
control for these variables in this regression. Finally, we know that immigrants were less likely
than native-born people to leave home for premarital residential independence in the late twentieth
century (Goldscheider and Goldscheider, 1993, 35). The importance of marriage in the leaving-

Three Eras of Young Adult Home Leaving in Twentieth-Century America - version of 1/24/01 - page 54
home patterns of the foreign-born may explain the difference in Table 11 and our regression
results, as only the regressions control for independent variables such as marriage.
32 Ruggles and Sobek.
33 John Hajnal, “Age at Marriage and Proportions Marrying,” Population Studies 7 (1953): 111-136.
34 Coale; Coale and McNeil.
35 Michael R. Haines, “Estimated Life Tables for the United States, 1850-1910,” Historical Methods
31 (1998): 149-170; Vital Statistics of the United States, 1990, Volume II: Mortality: Part A
(Hyattsville, Maryland: U.S. Dept. of Health and Human Services, 1994), 6.14.