three-dimensional numerical analysis of a dam-break using
TRANSCRIPT

311
Three-dimensional numerical analysis of a dam-break using OpenFOAM
1, 2 Esteban Sánchez-Cordero <[email protected]>
2 Manuel Gómez <[email protected]>
2 Ernest Bladé <[email protected]>
1 Department of Civil Engineering, Faculty of Engineering,
University of Cuenca, Cuenca, Ecuador 2 Department of Civil and Environmental Engineering,
FLUMEN Research Institute,
Polytechnic University of Catalonia, Barcelona, Spain
Abstract. This paper presents a 3D numerical analysis of flow field patterns in a dam break
laboratory scale by applying the numerical code based on Finite Volume Method (FVM),
OpenFOAM. In the numerical model the turbulence is treated with RANS methodology and
the VOF (Volume of Fluid) method is used to capture the free surface of the water. The
numerical results of the code are assessed against experimental data. Water depth and
pressure measures are used to validate the numerical model. The results demonstrate that the
3D numerical code satisfactorily reproduce the temporal variation of these variables.
Keywords: dam break; 3D; RANS; k-ε (RNG); OpenFOAM
DOI: 10.15514/ISPRAS-2017-29(6)-20
For citation: Sánchez-Cordero E., Gómez M., Bladé E. Three-dimensional numerical
analysis of a dam-break using OpenFOAM. Trudy ISP RAN/Proc. ISP RAS, vol. 29, issue 6,
2017. pp. 311-320. DOI: 10.15514/ISPRAS-2017-29(6)-20
1. Introduction
A dam is an engineering structure constructed across a valley or natural depression
to create a water storage reservoir. The fast-moving flood wave caused by a dam
failure can result in the loss of human lives, great amount of property damage, and
have a severe environmental impact. Therefore, significant efforts have been carried
out over the last years to obtain satisfactory mathematical numerical solutions for
this problem. Due to advances in computational power and the associated reduction
in computational time, three-dimensional (3D) numerical models based on Navier
Stokes equations have become a feasible tool to analyze the flow pattern in those
days.
Sánchez-Cordero E., Gómez M., Bladé E. Three-dimensional numerical analysis of a dam-break using OpenFOAM.
Trudy ISP RAN/Proc. ISP RAS, vol. 29, issue 6, 2017. pp. 311-320
312
Analytical studies of the dam break for a horizontal channel were performed by
Dressler [1]. Several numerical studies based on 2D approaches have been validated
against experimental data sets as demonstrated in [2] and [3]. Two dimensional
numerical models assume negligible vertical velocities and accelerations which
results in a hydrostatic pressure distribution. However, when an abrupt failure of a
dam happens, in which initially a high free surface gradients occurs, the hydrostatic
pressure assumption is no longer valid. Three dimensional numerical models have
been used to solve the structure of the flow in these areas.
This document presents a 3D numerical analyze of a dam break (laboratory scale)
using the numerical code based on the finite volume method (FVM) – OpenFOAM.
Turbulence is treated using Reynolds-averaged Navier Stokes equations (RANS) k-
ε (RNG) approach, and the volume of fluid (VOF) method is used to simulate the
air-water interface. The numerical results of the code are assessed against
experimental data obtained by Kleefsman et al [4]. Water depth and pressure
measures are used to validate the model. The results demonstrate that the 3D
numerical code satisfactorily reproduce the temporal variation of these variables.
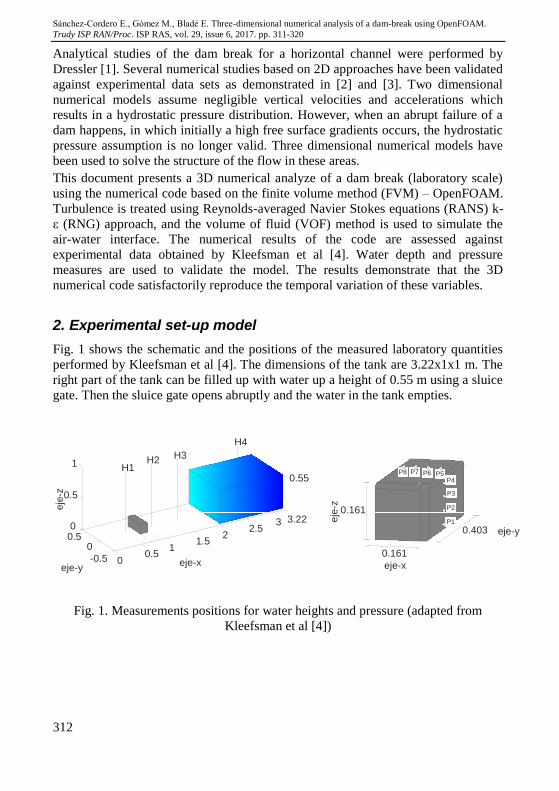
2. Experimental set-up model
Fig. 1 shows the schematic and the positions of the measured laboratory quantities
performed by Kleefsman et al [4]. The dimensions of the tank are 3.22x1x1 m. The
right part of the tank can be filled up with water up a height of 0.55 m using a sluice
gate. Then the sluice gate opens abruptly and the water in the tank empties.
Fig. 1. Measurements positions for water heights and pressure (adapted from
Kleefsman et al [4])
00.5
11.5
22.5
3
-0.5
00.50
0.5
1 H1H2 H3
H4
eje-xeje-y
P1
P2
P3
P4P5P6P7P8
eje
-z
3.22
0.55
0.403
0.161
0.161
eje-x
eje-y
eje
-z

Санчес-Кордеро Э., Гомез М., Блейд Э. Трехмерный численный анализ прорыва плотины с использованием
OpenFOAM Труды ИСП РАН, том 29, вып. 6, 2017 г., стр. 311-320
313
3. Numerical Model
3.1 Fluid Flow model
The governing equations for mass and momentum for the fluid flow can be
expressed as [5]:
∇ ∙ 𝑢 = 0 ( 1 )
𝜕𝜌𝑢
𝜕𝑡+ ∇ ∙ (𝜌𝑢 𝑢) − ∇ ∙ ((𝜇 + 𝜇𝑡)𝑆) = −∇𝑝 + 𝜌𝑔 + 𝜎𝐾
∇𝛼
|∇𝛼| ( 2 )
where u is velocity vector field, 𝑝 is the pressure field, 𝜇𝑡 is the turbulent eddy
viscosity, 𝑆 strain tensor (𝑆 = 1 2⁄ (∇𝑢 + ∇𝑢𝑡) , 𝜎 surface tension, 𝐾 surface
curvature, and 𝛼 volume fraction function (between 0-1).
3.2 Free surface model
Volume of Fluid Method (VOF) is used for the analysis of free surface flow. A
volume fraction indicator 𝛼 is used to determine the fluid contained at each mesh
element. To calculate 𝛼 a new transport equation is introduced.
𝜕𝛼
𝜕𝑡+ ∇(α ∙ 𝑢) + ∇ ∙ (𝛼(1 − 𝛼)𝑢𝑟) = 0 ( 3 )
OpenFOAM imposes the third term of equation (3) called phase compression;
where, 𝑢𝑟 = 𝑢𝑙 − 𝑢𝑔. The density 𝜌 and viscosity 𝜇 in the domain are given by:
𝜌 = 𝛼𝜌𝑙 + (1 − 𝛼)𝜌𝑔 ( 4 )
𝜇 = 𝛼𝜇𝑙 + (1 − 𝛼)𝜇𝑔 ( 5 )
where l and g denotes the different fluids (water and air).
3.3 Turbulence model
In the RANS equations the instantaneous variables of flow are decomposed into
their time-averaged and fluctuating quantities. In this analysis k-ε (RNG) turbulence
model is used due to provides an improved performance for types of flows that
include flows with separation zones [6]. It is a two equation model which provides
independent transport equations for both the turbulence length scale and the
turbulent kinetic energy.
Sánchez-Cordero E., Gómez M., Bladé E. Three-dimensional numerical analysis of a dam-break using OpenFOAM.
Trudy ISP RAN/Proc. ISP RAS, vol. 29, issue 6, 2017. pp. 311-320
314
3.3 Initial and Boundary Conditions
In the numerical configuration of the model, the sides surrounding the experiment
and the bottom are defined as wall. The top of the experimental box atmospheric
pressure prevails. At the beginning of the simulation an initial water height is
established, which is the initial water volume of the experiment.
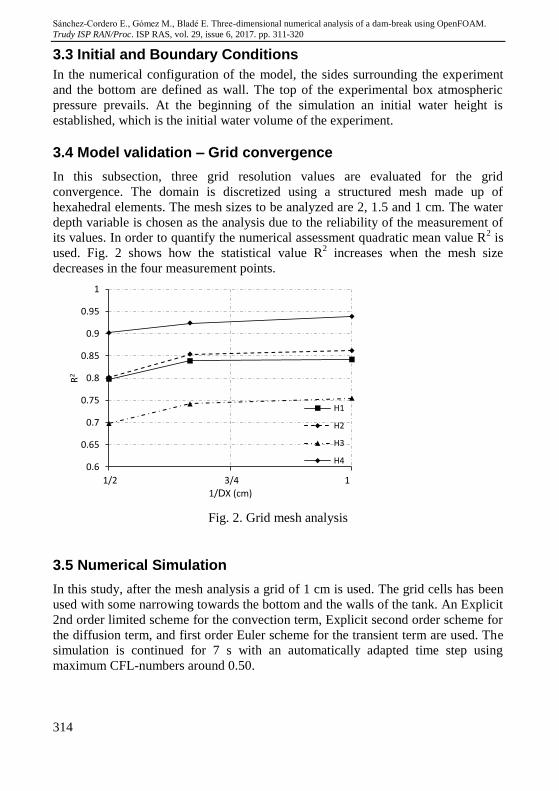
3.4 Model validation – Grid convergence
In this subsection, three grid resolution values are evaluated for the grid
convergence. The domain is discretized using a structured mesh made up of
hexahedral elements. The mesh sizes to be analyzed are 2, 1.5 and 1 cm. The water
depth variable is chosen as the analysis due to the reliability of the measurement of
its values. In order to quantify the numerical assessment quadratic mean value R2 is
used. Fig. 2 shows how the statistical value R2 increases when the mesh size
decreases in the four measurement points.
Fig. 2. Grid mesh analysis
3.5 Numerical Simulation
In this study, after the mesh analysis a grid of 1 cm is used. The grid cells has been
used with some narrowing towards the bottom and the walls of the tank. An Explicit
2nd order limited scheme for the convection term, Explicit second order scheme for
the diffusion term, and first order Euler scheme for the transient term are used. The
simulation is continued for 7 s with an automatically adapted time step using
maximum CFL-numbers around 0.50.
0.6
0.65
0.7
0.75
0.8
0.85
0.9
0.95
1
1/2 3/4 1
R2
1/DX (cm)
H1
H2
H3
H4
Санчес-Кордеро Э., Гомез М., Блейд Э. Трехмерный численный анализ прорыва плотины с использованием
OpenFOAM Труды ИСП РАН, том 29, вып. 6, 2017 г., стр. 311-320
315
4. Results and Discussion
In order to analyze the capabilities of the numerical model in the reproduction of the
flow variables in a dam break, a comparison between RANS numerical simulation
and experimental data was quantified by the quadratic mean value R2.
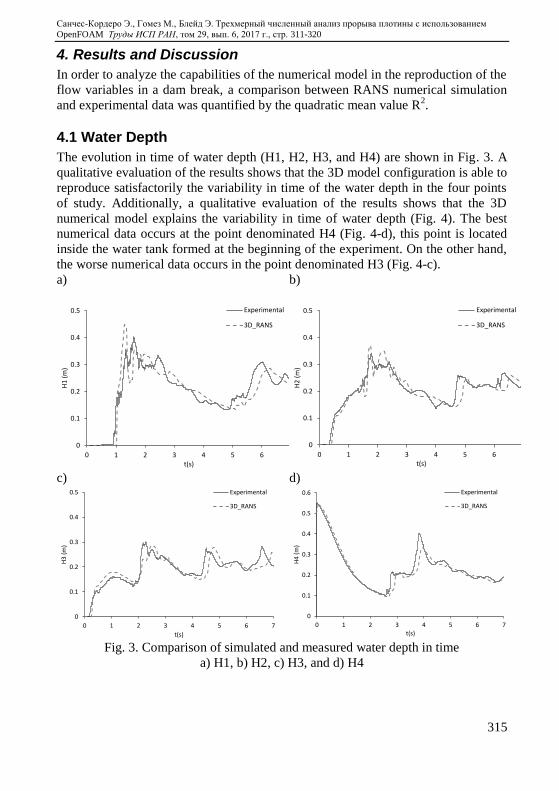
4.1 Water Depth
The evolution in time of water depth (H1, H2, H3, and H4) are shown in Fig. 3. A
qualitative evaluation of the results shows that the 3D model configuration is able to
reproduce satisfactorily the variability in time of the water depth in the four points
of study. Additionally, a qualitative evaluation of the results shows that the 3D
numerical model explains the variability in time of water depth (Fig. 4). The best
numerical data occurs at the point denominated H4 (Fig. 4-d), this point is located
inside the water tank formed at the beginning of the experiment. On the other hand,
the worse numerical data occurs in the point denominated H3 (Fig. 4-c).
a) b)
c) d)
Fig. 3. Comparison of simulated and measured water depth in time
a) H1, b) H2, c) H3, and d) H4
0
0.1
0.2
0.3
0.4
0.5
0 1 2 3 4 5 6 7
H1
(m
)
t(s)
Experimental
3D_RANS
0
0.1
0.2
0.3
0.4
0.5
0 1 2 3 4 5 6 7
H2
(m
)
t(s)
Experimental
3D_RANS
0
0.1
0.2
0.3
0.4
0.5
0 1 2 3 4 5 6 7
H3
(m
)
t(s)
Experimental
3D_RANS
0
0.1
0.2
0.3
0.4
0.5
0.6
0 1 2 3 4 5 6 7
H4
(m
)
t(s)
Experimental
3D_RANS

Sánchez-Cordero E., Gómez M., Bladé E. Three-dimensional numerical analysis of a dam-break using OpenFOAM.
Trudy ISP RAN/Proc. ISP RAS, vol. 29, issue 6, 2017. pp. 311-320
316
a) b)
c) d)
Fig. 4. Comparison of simulated and measured water depth (m)
a) H1, b) H2, c) H3, and d) H4
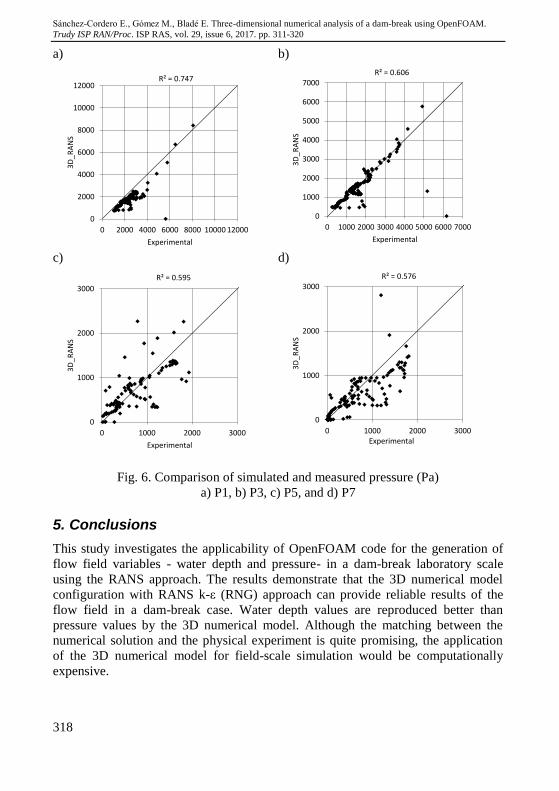
4.2 Pressure
Fig. 5 shows the variation in time of the pressure variable measured at different
points of the obstacle. The points P1, P3, P5, and P7 are analyzed. A qualitative
analysis shows a better capture of the temporal variation of the points in the frontal
face of the obstacle (P1, P3) than those that are in the upper part of the obstacle (P5,
P7). Numerical model results shows a time lag of peak value in the points P1 and
P3. Quantitative analysis allows for qualitative assertion (Figure 6). Thereby, R2 is
0.747 and 0.606 for pressure P1 and P3 respectively, whilst P5 and P7 are 0.595 and
0.576.
R² = 0.842
0
0.1
0.2
0.3
0.4
0.5
0 0.1 0.2 0.3 0.4 0.5
3D
_RA
NS
Experimental
R² = 0.862
0
0.1
0.2
0.3
0.4
0.5
0 0.1 0.2 0.3 0.4 0.5
3D
_RA
NS
Experimental
R² = 0.755
0
0.1
0.2
0.3
0.4
0.5
0 0.1 0.2 0.3 0.4 0.5
3D
_RA
NS
Experimental
R² = 0.939
0
0.1
0.2
0.3
0.4
0.5
0 0.1 0.2 0.3 0.4 0.5
3D
_RA
NS
Experimental

Санчес-Кордеро Э., Гомез М., Блейд Э. Трехмерный численный анализ прорыва плотины с использованием
OpenFOAM Труды ИСП РАН, том 29, вып. 6, 2017 г., стр. 311-320
317
a) b)
c)
d)
Fig. 5. Comparison of simulated and measured pressure in time
a) P1, b) P3, c) P5, and d) P7
0
2000
4000
6000
8000
10000
12000
0 1 2 3 4 5 6 7
P1
(Pa
)
t(s)
Experimental
3D_RANS
0
1000
2000
3000
4000
5000
6000
7000
0 1 2 3 4 5 6 7
P3
(Pa
)
t(s)
Experimental
3D_RANS
0
1000
2000
3000
0 1 2 3 4 5 6 7
P5
(Pa
)
t(s)
Experimental
3D_RANS
0
1000
2000
3000
4000
0 1 2 3 4 5 6 7
P7
(Pa
)
t(s)
Experimental
3D_RANS
Sánchez-Cordero E., Gómez M., Bladé E. Three-dimensional numerical analysis of a dam-break using OpenFOAM.
Trudy ISP RAN/Proc. ISP RAS, vol. 29, issue 6, 2017. pp. 311-320
318
a) b)
c) d)
Fig. 6. Comparison of simulated and measured pressure (Pa)
a) P1, b) P3, c) P5, and d) P7
5. Conclusions
This study investigates the applicability of OpenFOAM code for the generation of
flow field variables - water depth and pressure- in a dam-break laboratory scale
using the RANS approach. The results demonstrate that the 3D numerical model
configuration with RANS k-ε (RNG) approach can provide reliable results of the
flow field in a dam-break case. Water depth values are reproduced better than
pressure values by the 3D numerical model. Although the matching between the
numerical solution and the physical experiment is quite promising, the application
of the 3D numerical model for field-scale simulation would be computationally
expensive.
R² = 0.747
0
2000
4000
6000
8000
10000
12000
0 2000 4000 6000 8000 10000 12000
3D
_RA
NS
Experimental
R² = 0.606
0
1000
2000
3000
4000
5000
6000
7000
0 1000 2000 3000 4000 5000 6000 7000
3D
_RA
NS
Experimental
R² = 0.595
0
1000
2000
3000
0 1000 2000 3000
3D
_RA
NS
Experimental
R² = 0.576
0
1000
2000
3000
0 1000 2000 3000
3D
_RA
NS
Experimental

Санчес-Кордеро Э., Гомез М., Блейд Э. Трехмерный численный анализ прорыва плотины с использованием
OpenFOAM Труды ИСП РАН, том 29, вып. 6, 2017 г., стр. 311-320
319
Acknowledgments
This work was made possible largely because the financial support given by
Ecuadorian Government's Secretaria Nacional de Educacion Superior, Ciencia y
Tecnologia (SENESCYT) through a PhD grant for the first author.
References [1]. R. F. Dressler, “Hydraulic Resistance Effect Upon the Dam-Break Functions*,” J. Res.
Natl. Bur. Stand. (1934)., vol. 49, no. 3, 1952.
[2]. L. Fraccarollo and E. F. Toro, “Experimental and numerical assessment of the shallow
water model for two-dimensional dam-break type problems,” J. Hydraul. Res., vol. 33,
no. 6, pp. 843–864, Nov. 1995.
[3]. S. Soares-Frazão and Y. Zech, “Experimental study of dam-break flow against an
isolated obstacle,” J. Hydraul. Res., vol. 45, no. sup1, pp. 27–36, Dec. 2007.
[4]. K. M. T. Kleefsman, G. Fekken, A. E. P. Veldman, B. Iwanowski, and B. Buchner, “A
Volume-of-Fluid based simulation method for wave impact problems,” J. Comput.
Phys., vol. 206, no. 1, pp. 363–393, Jun. 2005.
[5]. X. Liu and M. H. García, “Three-Dimensional Numerical Model with Free Water
Surface and Mesh Deformation for Local Sediment Scour,” J. Waterw. Port, Coastal,
Ocean Eng., vol. 134, no. 4, pp. 203–217, 2008.
[6]. A. S. Ramamurthy, S. S. Han, and P. M. Biron, “Three-Dimensional Simulation
Parameters for 90° Open Channel Bend Flows,” J. Comput. Civ. Eng., vol. 27, no. 3, pp.
282–291, 2013.
Трехмерный численный анализ прорыва плотины с использованием OpenFOAM
1, 2 Эстебан Санчес-Кордеро <[email protected]>
2 Мануэль Гомез <[email protected]> 2 Эрнест Блейд <[email protected]>
1 Эквадор, г. Куэнка, Университет Куэнки,
Инженерный факультет, Департамент строительства 2 Испания, Барселона, Политехнический университет Каталонии,
Научно-исследовательский институт FLUMEN,
Департамент строительства и охраны окружающей среды
Аннотация. В статье представлен трехмерный численный анализ структуры поля
течения при прорыве плотины в масштабах лаборатории путем. Численные
вычисления основывались на методе конечных объемов (Finite Volume Method, FVM),
OpenFOAM. В численной модели турбулентность обрабатывается с применением
методологии RANS, а метод жидких объёмов (VOF, Volume of Fluid) используется для
отслеживания свободной поверхности воды. Результаты вычислений оцениваются на
основе экспериментальных данных. Для валидации численной модели используются
измерения глубины и давления воды. Результаты показывают, что численные
Sánchez-Cordero E., Gómez M., Bladé E. Three-dimensional numerical analysis of a dam-break using OpenFOAM.
Trudy ISP RAN/Proc. ISP RAS, vol. 29, issue 6, 2017. pp. 311-320
320
вычисления удовлетворительно воспроизводят изменения этих переменных во
времени.
Ключевые слова: прорыв платины; 3D; RANS; k-ε (RNG); OpenFOAM
DOI: 10.15514/ISPRAS-2017-29(6)-20
For citation: Санчес-Кордеро Э., Гомез М., Блейд Э. Трехмерный численный анализ
прорыва плотины с использованием OpenFOAM. Труды ИСП РАН, том 29, вып. 6,
2017 г., стр. 311-320 (на английском языке). DOI: 10.15514/ISPRAS-2017-29(6)-20
Список литературы [1]. R. F. Dressler, “Hydraulic Resistance Effect Upon the Dam-Break Functions*,” J. Res.
Natl. Bur. Stand. (1934)., vol. 49, no. 3, 1952.
[2]. L. Fraccarollo and E. F. Toro, “Experimental and numerical assessment of the shallow
water model for two-dimensional dam-break type problems,” J. Hydraul. Res., vol. 33,
no. 6, pp. 843–864, Nov. 1995.
[3]. S. Soares-Frazão and Y. Zech, “Experimental study of dam-break flow against an
isolated obstacle,” J. Hydraul. Res., vol. 45, no. sup1, pp. 27–36, Dec. 2007.
[4]. K. M. T. Kleefsman, G. Fekken, A. E. P. Veldman, B. Iwanowski, and B. Buchner, “A
Volume-of-Fluid based simulation method for wave impact problems,” J. Comput.
Phys., vol. 206, no. 1, pp. 363–393, Jun. 2005.
[5]. X. Liu and M. H. García, “Three-Dimensional Numerical Model with Free Water
Surface and Mesh Deformation for Local Sediment Scour,” J. Waterw. Port, Coastal,
Ocean Eng., vol. 134, no. 4, pp. 203–217, 2008.
[6]. A. S. Ramamurthy, S. S. Han, and P. M. Biron, “Three-Dimensional Simulation
Parameters for 90° Open Channel Bend Flows,” J. Comput. Civ. Eng., vol. 27, no. 3, pp.
282–291, 2013.