three-dimensional kernel utilization distributions improve estimates of space use in aquatic animals
TRANSCRIPT

Three-dimensional kernel utilization distributionsimprove estimates of space use in aquatic animals
Colin A. Simpfendorfer, Esben M. Olsen, Michelle R. Heupel, and Even Moland
Abstract: Tracking data have previously been used to define animal movement patterns through two-dimensional (2D) ker-nel utilization distributions and separate analysis of vertical locations. Here we describe the use of three-dimensional (3D)kernel utilization distributions to estimate the volumetric space use of individuals based on tracking data and to estimate theoverlap in activity space between individuals. Data from European eels (Anguilla anguilla) from Norwegian coastal waterswere used to compare the information conveyed by 2D and 3D activity space estimates and the utility of this approach foraquatic species. The use of 3D kernels produced detailed representations of space use in A. anguilla that permitted examina-tion of depth use in a geographic context. Comparison of 2D and 3D home ranges showed that 2D analyses overestimatedthe amount of overlap between individuals by 13%–20%, because individuals sometimes occurred in the same location butused different depths. Hence, the 3D approach provided more comprehensive representations of animal movement in threedimensions while producing a metric that can be used for testing hypotheses relating to scientific descriptions of activityspace, habitat use, and movement parameters.
Résumé : Les données de repérage ont servi dans le passé à définir les patrons de déplacement des animaux à l’aide de dis-tributions bidimensionnelles (2D) des noyaux d’utilisation et par analyse séparée des positions verticales. Nous décrivons icil’utilisation de distributions tridimensionnelles (3D) des noyaux d’utilisation afin d’estimer l’utilisation volumétrique de l’es-pace par les individus d’après des données de repérage et pour évaluer le chevauchement dans l’espace des activités entreles individus. Nous utilisons des données sur des anguilles européennes (Anguilla anguilla) des eaux côtières de la Norvègepour comparer l’information fournie par les estimations 2D et 3D de l’espace des activités et évaluer l’utilité de cette métho-dologie pour les espèces aquatiques. L’emploi de noyaux 3D génère des représentations détaillées de l’utilisation de l’espacepar A. anguilla qui permettent l’examen de l’utilisation de la profondeur dans un contexte géographique. Une comparaisondes domaines vitaux 2D et 3D montre que les analyses 2D surestiment le chevauchement entre les individus de 13%–20%,parce que les individus peuvent quelquefois se retrouver au même point, mais utiliser des profondeurs différentes. Ainsi, laméthodologie 3D produit des représentations plus complètes des déplacements des animaux en trois dimensions, tout enfournissant une métrique que peut servir à tester des hypothèses concernant les descriptions scientifiques des paramètres del’espace des activités, de l’utilisation des habitats et du déplacement.
[Traduit par la Rédaction]
Introduction
Numerous species have been the subject of tracking andmovement studies in aerial, terrestrial, and aquatic systems.While it is apparent many of these individuals live in athree-dimensional (3D) environment, tracking data are mostoften collected or represented in a two-dimensional (2D)framework. However, advances in tracking technology are in-creasingly providing the opportunity to gather additional databeyond 2D location coordinates for a tracked individual. Forexample, many aquatic studies collect depth data to indicatewhat portion of the water column an animal is using (e.g.,Schaefer and Fuller 2005; Kelly et al. 2007; Hobson et al.
2009). However, when vertical distribution data are collected,they are often analysed and displayed independent of locationdata. This analysis of movement and distribution parametersmakes it difficult to fully examine spatial usage and complexbehaviour patterns of individuals or groups.Recent research has begun to provide 3D analyses of ani-
mal movement. For example, paths of salmon smolt ap-proaching dams based on river flow rate have been recordedand described in three dimensions (Ehrenberg and Steig2003). Three-dimensional modelling has also been used totrack burrowing behaviours of worms (Bastardie et al. 2003)and movement paths of captive fish (Zhu and Weng 2007).Despite these computational advances, animal movement
Received 21 June 2011. Accepted 19 December 2011. Published at www.nrcresearchpress.com/cjfas on 23 February 2012.J2011-0272
C.A. Simpfendorfer. Fishing and Fisheries Research Centre, School of Earth and Environmental Sciences, James Cook University,Townsville, Queensland, 4811, Australia.E.M. Olsen and E. Moland. Institute of Marine Research, Flødevigen, 4817 His, Norway; Centre for Ecological and EvolutionarySynthesis (CEES), Department of Biology, University of Oslo, 0316 Oslo, Norway.M.R. Heupel. Australian Institute of Marine Sciences, PMB 3, Townsville, Queensland, 4810, Australia; School of Earth andEnvironmental Sciences, James Cook University, Townsville, Queensland, 4811, Australia.
Corresponding author: Colin A Simpfendorfer (e-mail: [email protected]).
565
Can. J. Fish. Aquat. Sci. 69: 565–572 (2012) doi:10.1139/F2011-179 Published by NRC Research Press
Can
. J. F
ish.
Aqu
at. S
ci. D
ownl
oade
d fr
om w
ww
.nrc
rese
arch
pres
s.co
m b
y U
nive
rsity
of
Mel
bour
ne o
n 09
/15/
14Fo
r pe
rson
al u
se o
nly.
studies have generally failed to integrate vertical data into ac-tivity space and habitat use estimates. Here we (i) demonstratethe application of a 3D kernel utilization distribution (KUD)estimator to describe the space use patterns of the Europeaneel (Anguilla anguilla), (ii) compare estimates of A. anguillaspace use over time using both 2D and 3D KUDs, and(iii) determine the overlap in 2D and 3D A. anguilla KUDsto identify if there are systematic biases in the results ob-tained from these two measures.
Materials and methods
Field methods
Study areaA telemetry study was conducted within the Sømskilen
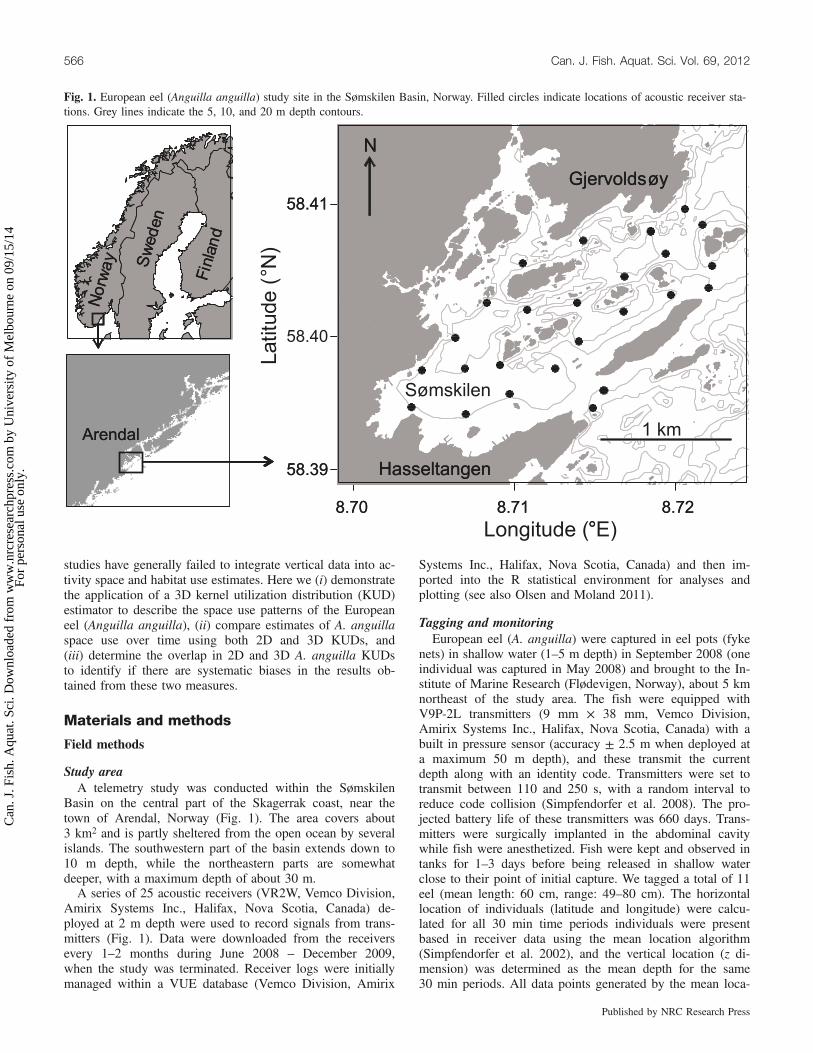
Basin on the central part of the Skagerrak coast, near thetown of Arendal, Norway (Fig. 1). The area covers about3 km2 and is partly sheltered from the open ocean by severalislands. The southwestern part of the basin extends down to10 m depth, while the northeastern parts are somewhatdeeper, with a maximum depth of about 30 m.A series of 25 acoustic receivers (VR2W, Vemco Division,
Amirix Systems Inc., Halifax, Nova Scotia, Canada) de-ployed at 2 m depth were used to record signals from trans-mitters (Fig. 1). Data were downloaded from the receiversevery 1–2 months during June 2008 – December 2009,when the study was terminated. Receiver logs were initiallymanaged within a VUE database (Vemco Division, Amirix
Systems Inc., Halifax, Nova Scotia, Canada) and then im-ported into the R statistical environment for analyses andplotting (see also Olsen and Moland 2011).
Tagging and monitoringEuropean eel (A. anguilla) were captured in eel pots (fyke
nets) in shallow water (1–5 m depth) in September 2008 (oneindividual was captured in May 2008) and brought to the In-stitute of Marine Research (Flødevigen, Norway), about 5 kmnortheast of the study area. The fish were equipped withV9P-2L transmitters (9 mm × 38 mm, Vemco Division,Amirix Systems Inc., Halifax, Nova Scotia, Canada) with abuilt in pressure sensor (accuracy ± 2.5 m when deployed ata maximum 50 m depth), and these transmit the currentdepth along with an identity code. Transmitters were set totransmit between 110 and 250 s, with a random interval toreduce code collision (Simpfendorfer et al. 2008). The pro-jected battery life of these transmitters was 660 days. Trans-mitters were surgically implanted in the abdominal cavitywhile fish were anesthetized. Fish were kept and observed intanks for 1–3 days before being released in shallow waterclose to their point of initial capture. We tagged a total of 11eel (mean length: 60 cm, range: 49–80 cm). The horizontallocation of individuals (latitude and longitude) were calcu-lated for all 30 min time periods individuals were presentbased in receiver data using the mean location algorithm(Simpfendorfer et al. 2002), and the vertical location (z di-mension) was determined as the mean depth for the same30 min periods. All data points generated by the mean loca-
Latitu
de
(°N
)
Longitude (°E)
Gjervoldsøy
N
1 km
Hasseltangen
Sømskilen
Norw
ay Sw
eden
Fin
land
Arendal
58.41
58.40
58.39
8.70 8.71 8.72
°
Gjervoldsøy
N
Hasseltangen
Norw
ay Sw
eden
Fin
land
Arendal
58.41
58.39
8.70 8.71 8.72
Fig. 1. European eel (Anguilla anguilla) study site in the Sømskilen Basin, Norway. Filled circles indicate locations of acoustic receiver sta-tions. Grey lines indicate the 5, 10, and 20 m depth contours.
566 Can. J. Fish. Aquat. Sci. Vol. 69, 2012
Published by NRC Research Press
Can
. J. F
ish.
Aqu
at. S
ci. D
ownl
oade
d fr
om w
ww
.nrc
rese
arch
pres
s.co
m b
y U
nive
rsity
of
Mel
bour
ne o
n 09
/15/
14Fo
r pe
rson
al u
se o
nly.

tion algorithm were used in the following analysis as formost 30 min periods individuals were detected on three tosix receivers, providing a relatively precise location estimate(Simpfendorfer et al. 2002).
Kernel estimationThe most common approach to estimating the activity
space or home range of animals from tracking data is to cal-culate KUDs) (Worton 1989). These are functions that definethe space in which an individual will occur with a given levelof probability. Most commonly, 50% KUDs are used to de-scribe the core activity space or home range, and 95%KUDs describe their extent (e.g., Heupel et al. 2004). Typi-cally, KUDs have been calculated in two dimensions for eco-logical studies, but can be calculated in as many dimensionsas desired (Duong 2007). Both 2D and 3D KUDs were esti-mated for European eels using the “ks” package (Duong2007) in the R statistical environment (R Development CoreTeam 2009). Horizontal data (latitude and longitude) wereconverted to a Universal Transverse Mercator projection sothat they were represented in metres, enabling the horizontaldata to be in the same units as the vertical data. A plug-inbandwidth selector was used to estimate the smoothing factormatrix for kernel estimation, as these have been found to pro-vide adequate results in home range studies (see Gitzen et al.2006 for a detailed treatment of different methods for esti-mating smoothing factors for home range analysis) andproved less computationally intensive than other methodssuch as least squares cross-validation. The “kde” function in“ks” was used to estimate 50% and 95% KUDs to representthe core and extent of the activity space, respectively. Vol-umes of 3D KUDs were determined by gridding the spaceand estimating the volume of individual voxels (the 3Dequivalent of pixels) multiplied by the estimated numberwithin the kernel. Areas of 2D KUDs were determined inthe same way, except that the area of pixels was calculated.An R script that produces 3D 50% and 95% KUDs and esti-mates of their volumes is provided in the online Supplemen-tary Materials1.Kernels produced with the smoothing factor from the plug-
in estimator were very complex, reflecting a high level ofconfidence in individual location estimates. Such confidencedid not match the uncertainty of the locations from the track-ing data, which in the approach used in this study can pro-duce errors up to 100 or 200 m in the horizontal dimensions(Simpfendorfer et al. 2002) and ∼5% in the vertical dimen-sion. Multiplying the smoothing factor matrix from the plug-in estimator by values >1 reduced the complexity of the ker-nel and increased smoothing, more accurately reflecting theuncertainty in the location estimates. To determine the opti-mal multiplier value, we examined the ratio between the vol-ume of the 50% and 95% KUDs at different multipliervalues. We assumed that the optimal multiplier occurred atthe lowest value at which the ratio was stable. To do this,the following steps were used: (1) the smoothing factor ma-trices from three representative individuals were multipliedby integer values between 1 and 10; (2) the ratio betweenthe volume of the 50% and 95% KUDs was determined foreach multiplier value for each individual; (3) the amount of
change in the ratio was calculated between increasing valuesof multiplier; (4) the amount of change was standardized foreach individual by dividing by the mean ratio across all mul-tiplier values (this permitted the direct comparison of individ-uals); and (5) standardized values were plotted againstmultiplier values and the multiplier closest to a value of onewith the smallest change for all individuals identified. Forthis study the lowest levels of change in standardized ratiooccurred with a multiplier of three, and this value was ap-plied to all smoothing factor matrices before estimation ofthe 2D and 3D KUDs.
Data analysisData from individual eel were used in the analyses if they
were present in the study site for more than 1 month. Thearea and volume of KUDs (50% and 95%) were calculatedfor each individual in each month that it was present. Detec-tions of eel were infrequent in winter (January through April2009), and these months were excluded from analysis be-cause of small numbers of locations. To determine if the 2Dand 3D kernels produced similar trends in space use overtime, Pearson correlation between monthly estimates for allindividuals was used. Repeated measures analysis of variance(RM-ANOVA) using log(x + 1)-transformed KUD data wasused to test for differences in KUDs between months, withtag as the within-subjects factor. The area and volume ofoverlap in monthly 2D and 3D KUDs between individuals ineach month were determined using the “ks” package in thesame way that volumes of KUDs were estimated. Compari-sons were done with a pairwise approach (i.e., each eel com-pared with each of the others present in a given month). Theamount of overlap was converted to a proportion of an indi-vidual’s KUD by dividing the overlap KUD by the KUDvalue of each individual. The difference in proportion ofoverlap in changing from 2D to 3D KUDs was determinedby subtraction. RM-ANOVA, with tag as the within-subjectsfactor, was used to test for differences in the change in pro-portion of overlap between months. Since this test examinedproportion data, these were arcsine-transformed for use in theRM-ANOVA.
ResultsEel fitted with acoustic transmitters were present in the
study area from a few days to 16 months, with seven eelsmeeting the criteria for inclusion in the comparison of 2Dand 3D activity space. Three-dimensional activity space esti-mates from KUDs provided more detailed representations ofeel locations when depth information was added than withhorizontal data alone (Fig. 2). Estimates of monthly 3D 50%activity space ranged from 93 to 288 098 m3, with most(61%) between 20 000 and 90 000 m3; monthly 3D 95% ac-tivity space estimates ranged from 5628 to 4 149 105 m3,with most (61%) from 250 000 to 900 000 m3. Estimates ofmonthly 2D 50% activity space ranged from 25 to88 250 m2, with most (71%) between 3000 and 30 000 m2;monthly 2D 95% activity space estimates ranged from 12 to450 196 m2, with most (78%) from 50 000 to 200 000 m2.Some individuals displayed bimodal depth distributions;however, these were not correlated with diel changes and
1Supplementary data are available with the article through the journal Web site at http://nrcresearchpress.com/doi/suppl/10.1139/f2011-179.
Simpfendorfer et al. 567
Published by NRC Research Press
Can
. J. F
ish.
Aqu
at. S
ci. D
ownl
oade
d fr
om w
ww
.nrc
rese
arch
pres
s.co
m b
y U
nive
rsity
of
Mel
bour
ne o
n 09
/15/
14Fo
r pe
rson
al u
se o
nly.

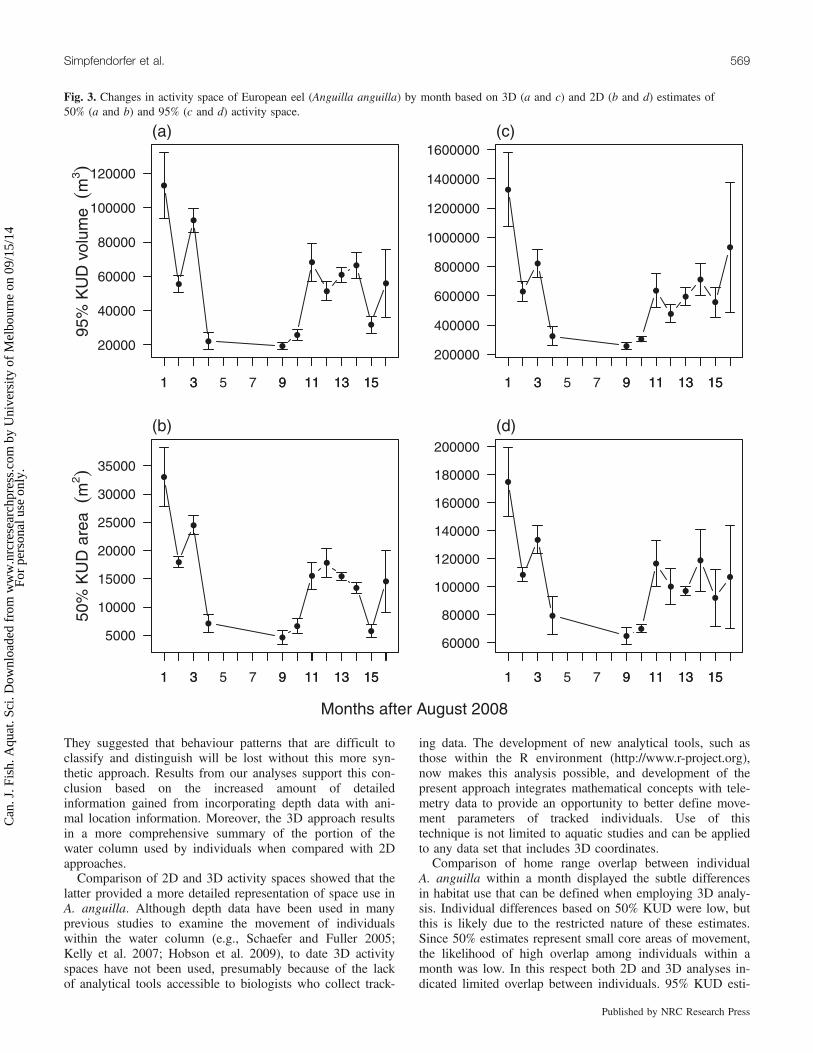
were not analysed further. There was significant correlationbetween the 3D and 2D monthly activity space estimatesbased on 50% KUDs (r2 = 0.741, p < 0.001) and 95%KUDs (r2 = 0.835, p < 0.001). The monthly trends in 3Dand 2D activity space were also similar (Fig. 3), with valuesdecreasing during winter and increasing during summer. Allfour analyses showed significant differences between months(RM-ANOVA, 3D 50%: F[1,246] = 21.46, p < 0.001; 3D 95%:F[1,246] = 8.74, p < 0.01; 2D 50%: F[1,246] = 2.06, p < 0.001;2D 50%: F[1,246] = 9.30, p < 0.01).The overlap in monthly activity space between individual
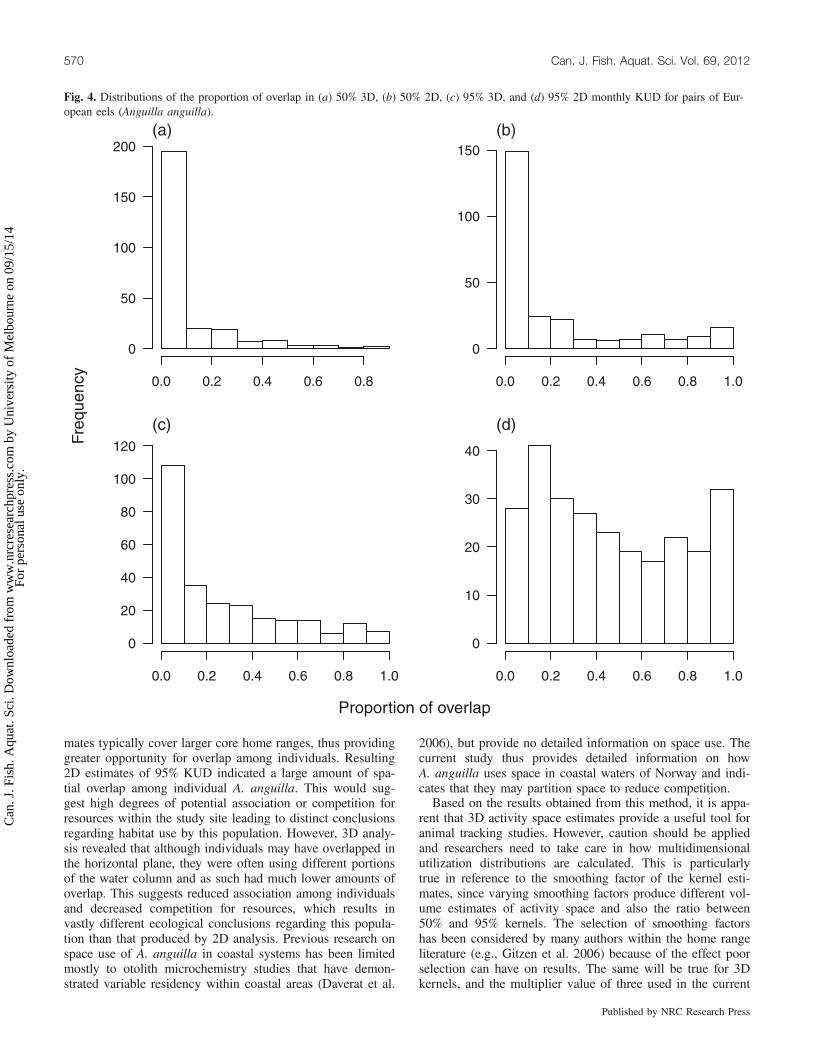
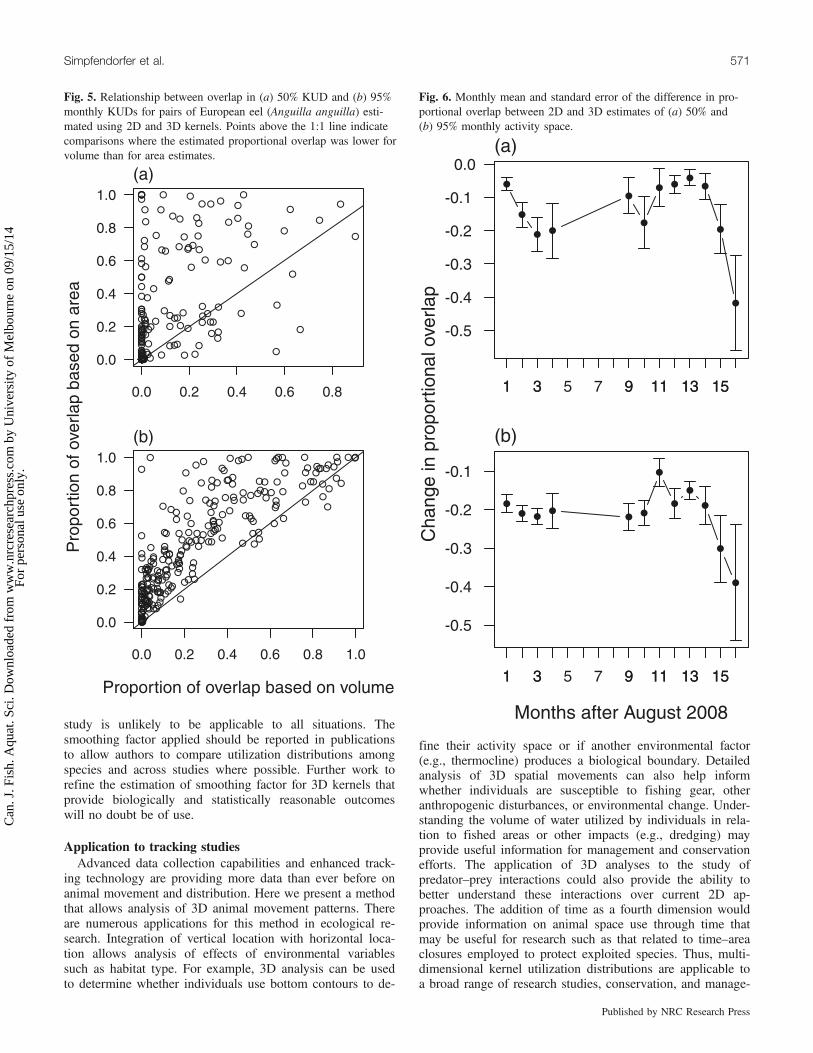
eels, as a proportion of their monthly activity space, weremostly in the range from 0 to 0.2 (Fig. 4), except for the95% 2D KUD analysis, which had a more even distributionbetween 0 and 1 (Fig. 4d). Typically, 3D overlaps weresmaller than the corresponding 2D estimates (Fig. 5). Themean change in overlap for 50% KUDs from 2D to 3D was13.3%; for 95% KUDs this was 20.4%. The majority ofchanges in overlap proportion were relatively small (<0.2),but in some cases the consideration of 3D data resulted inmajor changes. This included cases where individuals occu-pied different depths for the entire month while having over-lapping horizontal locations, resulting in changes in overlapfrom close to one to zero. The reduction in overlap revealedby a 3D perspective persisted throughout the duration of thestudy (Fig. 6). There were no significant differences inchanges of overlap proportions between 2D and 3D KUDsbetween months for both 50% (RM-ANOVA, F[1,250] =
0.127, p = 0.72) and 95% (RM-ANOVA, F[1,250] = 0.645,p = 0.42.) KUDs.
DiscussionVolumetric analysis of 3D data provides a comprehensive
perspective of habitat use by animals that live in a 3D envi-ronment. Although 2D analyses are informative about the lo-cation of individuals, volumetric analyses provide the addedbenefit of combining 3D information into metrics that repre-sent the actual activity space utilized by animals. In the caseof A. anguilla, this allowed for a more comprehensive under-standing of the degree of overlap in space use between indi-viduals, with 2D analyses overestimating the amount ofoverlap by between 13.3% and 20.4%. This difference in theestimate of overlap occurred because the 3D analysis allowedseparation between individuals that occurred in the same lo-cation (latitude and longitude) but used different depths. Thisapproach allows researchers to describe animal distribution inthe same number of dimensions as the environment in whichthey live, providing a realistic description of space use.Zhu and Weng (2007) drew similar conclusions when
comparing 2D and 3D fish trajectories. Comparison of videoobservation of fish movements resulted in significant differ-ences in 2D and 3D analyses, where turning rates were morerepresentative of actual movements and complex behavioursin 3D recordings. They also concluded that animal behaviouranalyses need to integrate multiple parameters rather thanhandling them individually as is the current convention.
0
2
4
6
8
10
De
pth
(m
)
Northing (m)Easting (m)
6472800
6472600
6473200
6473000
483400 483200
Easting (m)
No
rth
ing
(m)
(a) (b)
Fig. 2. Representation of monthly 3D (a) and 2D (b) kernel utilization distributions (KUDs) for a pair of European eel (Anguilla anguilla)during August 2009. Green and brown shapes indicate 50% KUDs; red and blue shapes indicate 95% KUDs; circles indicate positions used tocalculate KUDs.
568 Can. J. Fish. Aquat. Sci. Vol. 69, 2012
Published by NRC Research Press
Can
. J. F
ish.
Aqu
at. S
ci. D
ownl
oade
d fr
om w
ww
.nrc
rese
arch
pres
s.co
m b
y U
nive
rsity
of
Mel
bour
ne o
n 09
/15/
14Fo
r pe
rson
al u
se o
nly.
They suggested that behaviour patterns that are difficult toclassify and distinguish will be lost without this more syn-thetic approach. Results from our analyses support this con-clusion based on the increased amount of detailedinformation gained from incorporating depth data with ani-mal location information. Moreover, the 3D approach resultsin a more comprehensive summary of the portion of thewater column used by individuals when compared with 2Dapproaches.Comparison of 2D and 3D activity spaces showed that the
latter provided a more detailed representation of space use inA. anguilla. Although depth data have been used in manyprevious studies to examine the movement of individualswithin the water column (e.g., Schaefer and Fuller 2005;Kelly et al. 2007; Hobson et al. 2009), to date 3D activityspaces have not been used, presumably because of the lackof analytical tools accessible to biologists who collect track-
ing data. The development of new analytical tools, such asthose within the R environment (http://www.r-project.org),now makes this analysis possible, and development of thepresent approach integrates mathematical concepts with tele-metry data to provide an opportunity to better define move-ment parameters of tracked individuals. Use of thistechnique is not limited to aquatic studies and can be appliedto any data set that includes 3D coordinates.Comparison of home range overlap between individual
A. anguilla within a month displayed the subtle differencesin habitat use that can be defined when employing 3D analy-sis. Individual differences based on 50% KUD were low, butthis is likely due to the restricted nature of these estimates.Since 50% estimates represent small core areas of movement,the likelihood of high overlap among individuals within amonth was low. In this respect both 2D and 3D analyses in-dicated limited overlap between individuals. 95% KUD esti-
1 3 9 11 13 15
●
●
●
●●
●
●
●
●●
●
●
(a)
95%
KU
D v
olum
e(m
3 )
1 3 5 7 9 11 13 15
20000
40000
60000
80000
100000
120000
1 3 9 11 13 15
●
●
●
●●
●
●
●
●
●
●
●
(c)
1 3 5 7 9 11 13 15
200000
400000
600000
800000
1000000
1200000
1400000
1600000
1 3 9 11 13 15
●
●
●
●
●
●
●
●
●
●
●
●
(b)
50%
KU
D a
rea
(m2 )
1 3 5 7 9 11 13 15
5000
10000
15000
20000
25000
30000
35000
1 3 9 11 13 15
●
●
●
●
●●
●
●●
●
●
●
(d)
Months after August 2008
1 3 5 7 9 11 13 15
60000
80000
100000
120000
140000
160000
180000
200000
Fig. 3. Changes in activity space of European eel (Anguilla anguilla) by month based on 3D (a and c) and 2D (b and d) estimates of50% (a and b) and 95% (c and d) activity space.
Simpfendorfer et al. 569
Published by NRC Research Press
Can
. J. F
ish.
Aqu
at. S
ci. D
ownl
oade
d fr
om w
ww
.nrc
rese
arch
pres
s.co
m b
y U
nive
rsity
of
Mel
bour
ne o
n 09
/15/
14Fo
r pe
rson
al u
se o
nly.
mates typically cover larger core home ranges, thus providinggreater opportunity for overlap among individuals. Resulting2D estimates of 95% KUD indicated a large amount of spa-tial overlap among individual A. anguilla. This would sug-gest high degrees of potential association or competition forresources within the study site leading to distinct conclusionsregarding habitat use by this population. However, 3D analy-sis revealed that although individuals may have overlapped inthe horizontal plane, they were often using different portionsof the water column and as such had much lower amounts ofoverlap. This suggests reduced association among individualsand decreased competition for resources, which results invastly different ecological conclusions regarding this popula-tion than that produced by 2D analysis. Previous research onspace use of A. anguilla in coastal systems has been limitedmostly to otolith microchemistry studies that have demon-strated variable residency within coastal areas (Daverat et al.
2006), but provide no detailed information on space use. Thecurrent study thus provides detailed information on howA. anguilla uses space in coastal waters of Norway and indi-cates that they may partition space to reduce competition.Based on the results obtained from this method, it is appa-
rent that 3D activity space estimates provide a useful tool foranimal tracking studies. However, caution should be appliedand researchers need to take care in how multidimensionalutilization distributions are calculated. This is particularlytrue in reference to the smoothing factor of the kernel esti-mates, since varying smoothing factors produce different vol-ume estimates of activity space and also the ratio between50% and 95% kernels. The selection of smoothing factorshas been considered by many authors within the home rangeliterature (e.g., Gitzen et al. 2006) because of the effect poorselection can have on results. The same will be true for 3Dkernels, and the multiplier value of three used in the current
0.0 0.2 0.4 0.6 0.8
0
50
100
150
200(a)
Freq
uenc
y
0.0 0.2 0.4 0.6 0.8 1.0
0
20
40
60
80
100
120
(c)
0.0 0.2 0.4 0.6 0.8 1.0
0
50
100
150(b)
0.0 0.2 0.4 0.6 0.8 1.0
0
10
20
30
40
(d)
Proportion of overlap
Fig. 4. Distributions of the proportion of overlap in (a) 50% 3D, (b) 50% 2D, (c) 95% 3D, and (d) 95% 2D monthly KUD for pairs of Eur-opean eels (Anguilla anguilla).
570 Can. J. Fish. Aquat. Sci. Vol. 69, 2012
Published by NRC Research Press
Can
. J. F
ish.
Aqu
at. S
ci. D
ownl
oade
d fr
om w
ww
.nrc
rese
arch
pres
s.co
m b
y U
nive
rsity
of
Mel
bour
ne o
n 09
/15/
14Fo
r pe
rson
al u
se o
nly.
study is unlikely to be applicable to all situations. Thesmoothing factor applied should be reported in publicationsto allow authors to compare utilization distributions amongspecies and across studies where possible. Further work torefine the estimation of smoothing factor for 3D kernels thatprovide biologically and statistically reasonable outcomeswill no doubt be of use.
Application to tracking studiesAdvanced data collection capabilities and enhanced track-
ing technology are providing more data than ever before onanimal movement and distribution. Here we present a methodthat allows analysis of 3D animal movement patterns. Thereare numerous applications for this method in ecological re-search. Integration of vertical location with horizontal loca-tion allows analysis of effects of environmental variablessuch as habitat type. For example, 3D analysis can be usedto determine whether individuals use bottom contours to de-
fine their activity space or if another environmental factor(e.g., thermocline) produces a biological boundary. Detailedanalysis of 3D spatial movements can also help informwhether individuals are susceptible to fishing gear, otheranthropogenic disturbances, or environmental change. Under-standing the volume of water utilized by individuals in rela-tion to fished areas or other impacts (e.g., dredging) mayprovide useful information for management and conservationefforts. The application of 3D analyses to the study ofpredator–prey interactions could also provide the ability tobetter understand these interactions over current 2D ap-proaches. The addition of time as a fourth dimension wouldprovide information on animal space use through time thatmay be useful for research such as that related to time–areaclosures employed to protect exploited species. Thus, multi-dimensional kernel utilization distributions are applicable toa broad range of research studies, conservation, and manage-
●●●
●
● ●
●
●●●●●●●
●
●●
●●●●●●●●●
●●
●●●
●
●●●●●●●●●●●●●
●
●
●●
●●
●●●●●●●●●●●●●●
●
●●●●●●●●●●
●
●●
●
●
●
●
●
●
●
●
●
●
●
●
●
●
●
●
●
●
●
●
●
●
●
●
●●
●
●
●
●
●
●
●
●
●
●
●
●
●
●
●●
●
●
●
●
●
●
●
●
●●●
●
●
●
●
●●●●
●
●●
●
●
●
●●●●●●●●●
●
●
●●●●●●●●●●●
●
●●●●
●
●
●
●●●●
●●●●●●●●●●●●●●
●
●●●●●●●●●●●
●
●●
●●●
●●
●●
●
●
●
●●●
●
●
●
●
●●
●●
● ●
●
●
●
●
●
●
●
●●
●
●
●
●
●
●
●
●
●●●●
●●
●
●
●
●
●●
●
●
●
●
●
●●
●●
●
●
●
● ●●
● ●
●
●●
● ●
●
●
●
●
●
●●
●
●
●
●●
●●
●
●●
●●
●●
●
●
●
●
●
●
● ●
●
●
●
●●
●●
●
●●
●
●
●●
●
●
●●
●
●●●
●
●
●
●
●
● ●
●●
●●
●
●
●
●●
●
●●
●
●
●
●
●
●
●
●
●
●
●
●●
●
●
●
●
●
●●●
●
●
●●
●●
●
●
●
●
●
●●
●
●
●
●
●●
●
●
●
●
●
●
●
●
●●
●
●●
●
●
●
●
●●
●
●
●
●
●●
●
●●
●
●
●
●●
●
●●
●
●
●
●
●
●
●
●
●
●●
●
●●
●
●
●
●
●
●
●●
●
●
●
●
●
●
●
●
●
●
●
●
●
●
●
●
●
●
●●
●
●
●
●
●
●●
●●
●● ● ●
● ●
●
●
●
●
●
●
●
●
●
●
● ●
● ●
●
●
●
● ●
●●
●●●
●● ●
●
●
●
0.0 0.2 0.4 0.6 0.8 1.0
0.0
0.2
0.4
0.6
0.8
1.0(b)
Proportion of overlap based on volume
0.0 0.2 0.4 0.6 0.8
0.0
0.2
0.4
0.6
0.8
1.0(a)
Pro
port
ion
of o
verla
p ba
sed
on a
rea
Fig. 5. Relationship between overlap in (a) 50% KUD and (b) 95%monthly KUDs for pairs of European eel (Anguilla anguilla) esti-mated using 2D and 3D kernels. Points above the 1:1 line indicatecomparisons where the estimated proportional overlap was lower forvolume than for area estimates.
1 3 9 11 13 15
●
●
● ●
●
●
● ●●
●
●
●
(a)
Cha
nge
in p
ropo
rtio
nal o
verla
p
1 3 5 7 9 11 13 15
-0.5
-0.4
-0.3
-0.2
-0.1
0.0
1 3 9 11 13 15
●● ●
●● ●
●
●
●
●
●
●
(b)
Months after August 2008
1 3 5 7 9 11 13 15
-0.5
-0.4
-0.3
-0.2
-0.1
Fig. 6. Monthly mean and standard error of the difference in pro-portional overlap between 2D and 3D estimates of (a) 50% and(b) 95% monthly activity space.
Simpfendorfer et al. 571
Published by NRC Research Press
Can
. J. F
ish.
Aqu
at. S
ci. D
ownl
oade
d fr
om w
ww
.nrc
rese
arch
pres
s.co
m b
y U
nive
rsity
of
Mel
bour
ne o
n 09
/15/
14Fo
r pe
rson
al u
se o
nly.
ment planning and should be considered in current and futureresearch where detailed position data are available.
AcknowledgementsThis analysis was funded by support from the Australian
Academy of Science (awarded to CAS). Funding for the Nor-wegian eel study was provided by the Research Council ofNorway (grant No. 178376) and the Institute of Marine Re-search. The authors thank J.A. Knutsen (Norway) for assistancewith field work. Special thanks go to T. Duong for advice onestimating volumes of 3D kernel utilization distributions.
ReferencesBastardie, F., Capowiez, Y., and Cluzeau, D. 2003. Burrowing
behaviour of radio-labelled earthworms revealed by analysis of3D-trajectories in artificial soil cores. Pedobiologia (Jena), 47:554–559.
Daverat, F., Limburg, K.E., Thibault, I., Shiao, J., Dodson, J.J.,Caron, F., Tzeng, W., Iizuka, Y., and Wickstrom, H. 2006.Phenotypic plasticity of habitat use by three temperate eel species,Anguilla anguilla, A. japonica and A. rostrata. Mar. Ecol. Prog.Ser. 308: 231–241. doi:10.3354/meps308231.
Duong, T. 2007. ks: Kernel density estimation and kerneldiscriminant analysis for multivariate data in R. J. Stat. Softw.21: 1–16.
Ehrenberg, J.E., and Steig, T.W. 2003. Improved techniques forstudying the temporal and spatial behaviour of fish in a fixedlocation. ICES J. Mar. Sci. 60(3): 700–706. doi:10.1016/S1054-3139(03)00087-0.
Gitzen, R.A., Millspaugh, J.J., and Kernohan, B.J. 2006. Bandwidthselection for fixed-kernel analysis of animal utilization distribu-tions. J. Wildl. Manage. 70(5): 1334–1344. doi:10.2193/0022-541X(2006)70[1334:BSFFAO]2.0.CO;2.
Heupel, M.R., Simpfendorfer, C.A., and Hueter, R.E. 2004.Estimation of shark home ranges using passive monitoringtechniques. Env. Biol. Fish. 71: 135–142.
Hobson, V.J., Righton, D., Metcalfe, J.D., and Hays, G.C. 2009. Linkbetween vertical and horizontal movement patterns of cod in theNorth Sea. Aquat. Biol. 5: 133–142. doi:10.3354/ab00144.
Kelly, J.T., Klimley, A.P., and Crocker, C.E. 2007. Movements ofgreen sturgeon, Acipenser medirostris, in the San Francisco Bayestuary, California. Environ. Biol. Fishes, 79(3–4): 281–295.doi:10.1007/s10641-006-0036-y.
Olsen, E.M., and Moland, E. 2011. Fitness landscape of Atlantic codshaped by harvest selection and natural selection. Evol. Ecol.25(3): 695–710. doi:10.1007/s10682-010-9427-9.
R Development Core Team. 2009. R: a language and environment forstatistical computing [online]. R Foundation for StatisticalComputing, Vienna, Austria. Available from http://www.R-project.org [accessed 14 September 2010].
Schaefer, K.M., and Fuller, D.W. 2005. Behavior of bigeye (Thunnusonesus) and skipjack (Katsuwonus pelamis) tunas within aggrega-tions associated with floating objects in the equatorial easternPacific. Mar. Biol. (Berl.), 146(4): 781–792. doi:10.1007/s00227-004-1480-x.
Simpfendorfer, C.A., Heupel, M.R., and Hueter, R.E. 2002.Estimation of short-term centers of activity from an array ofomnidirectional hydrophones, and its use in studying animalmovements. Can. J. Fish. Aquat. Sci. 59(1): 23–32. doi:10.1139/f01-191.
Simpfendorfer, C.A., Heupel, M.R., and Collins, A.B. 2008.Variation in the performance of acoustic receivers and itsimplication for positioning algorithms in a riverine setting. Can.J. Fish. Aquat. Sci. 65(3): 482–492. doi:10.1139/f07-180.
Worton, B.J. 1989. Kernel methods for estimating the utilizationdistribution in home-range studies. Ecology, 70(1): 164–168.doi:10.2307/1938423.
Zhu, L., and Weng, W. 2007. Catadioptric stereo-vision system forthe real-time monitoring of 3D behaviour in aquatic animals.Physiol. Behav. 91(1): 106–119. doi:10.1016/j.physbeh.2007.01.023. PMID:17355885.
572 Can. J. Fish. Aquat. Sci. Vol. 69, 2012
Published by NRC Research Press
Can
. J. F
ish.
Aqu
at. S
ci. D
ownl
oade
d fr
om w
ww
.nrc
rese
arch
pres
s.co
m b
y U
nive
rsity
of
Mel
bour
ne o
n 09
/15/
14Fo
r pe
rson
al u
se o
nly.