three-dimensional cluster analysis identifies interfaces...
TRANSCRIPT

doi:10.1006/jmbi.2001.4540 available online at http://www.idealibrary.com on J. Mol. Biol. (2001) 307, 1487±1502
Three-dimensional Cluster Analysis IdentifiesInterfaces and Functional Residue Clusters in Proteins
Ralf Landgraf, Ioannis Xenarios and David Eisenberg*
UCLA-DOE Laboratory ofStructural Biology andMolecular Medicine, 405Hilgard Avenue, Box 951570Los Angeles, CA 90095-1570USA
E-mail address of the [email protected]
Abbreviations used: ERK, extraceregulated kinase; MAPK, mitogen-akinase; FBP, fructose 1,6-bisphosph1-phosphate; DHAP, dihydroxyacetCR(x), regional conservation score fosimilarity deviation score; CP(x), poscore for residue x; CD, common d
0022-2836/01/051487±16 $35.00/0
Three-dimensional cluster analysis offers a method for the prediction offunctional residue clusters in proteins. This method requires a representa-tive structure and a multiple sequence alignment as input data. Individ-ual residues are represented in terms of regional alignments that re¯ectboth their structural environment and their evolutionary variation, asde®ned by the alignment of homologous sequences. From the overall(global) and the residue-speci®c (regional) alignments, we calculate theglobal and regional similarity matrices, containing scores for all pairwisesequence comparisons in the respective alignments. Comparing thematrices yields two scores for each residue. The regional conservationscore (CR(x)) de®nes the conservation of each residue x and its neighborsin 3D space relative to the protein as a whole. The similarity deviationscore (S(x)) detects residue clusters with sequence similarities that deviatefrom the similarities suggested by the full-length sequences. We evalu-ated 3D cluster analysis on a set of 35 families of proteins with availablecocrystal structures, showing small ligand interfaces, nucleic acid inter-faces and two types of protein-protein interfaces (transient and stable).We present two examples in detail: fructose-1,6-bisphosphate aldolaseand the mitogen-activated protein kinase ERK2. We found that theregional conservation score (CR(x)) identi®es functional residue clustersbetter than a scoring scheme that does not take 3D information intoaccount. CR(x) is particularly useful for the prediction of poorly con-served, transient protein-protein interfaces. Many of the proteins studiedcontained residue clusters with elevated similarity deviation scores.These residue clusters correlate with speci®city-conferring regions: 3Dcluster analysis therefore represents an easily applied method for the pre-diction of functionally relevant spatial clusters of residues in proteins.
# 2001 Academic Press
Keywords: bioinformatics, evolutionary tracing, protein families, residuepatches, phylogeny
*Corresponding authorIntroduction
The prediction of functionally relevant residuesin proteins can lead to the assignment of new func-tions and elucidate the mechanism by which pro-teins carry out known functions. Various methodshave been applied to this important problem.
ing author:
llular signal-ctivated protein
ate; F-1-P, fructoseone phosphate;r residue x; S(x),
sitional conservationocking.
Some of the predictions are based on biophysicalproperties of individual residues (Jones &Thornton, 1997a,b; Tsai et al., 1997; Xu et al., 1997),others are based on harvesting evolutionary infor-mation inherent in sets of homologous sequences.Of those methods harvesting the evolutionaryinformation, the most direct approach (Bucher &Bairoch, 1994; Henikoff & Henikoff, 1991) assignssequence motifs directly to particular functions. Ina more elaborate approach (Casari et al., 1995), vec-torial analysis of sequence pro®les is used to ident-ify functionally important residues. In a thirdmethod, evolutionary tracing (Lichtarge et al., 1996,1997), information inherent in a phylogenetic treeis added to the analysis of conserved sequences,often revealing more subtle aspects of protein func-tion. Starting with a multiple sequence alignment,
# 2001 Academic Press

1488 Prediction of Functional Sites in Proteins
a representative structure, and a phylogenetic tree,this method evaluates the conservation at eachposition in the alignment for different sequencesimilarity cut-offs. In its original implementation,residues are classi®ed as variable, conserved orgroup-speci®c, that is speci®c to one branch of thephylogenetic tree. This analysis can be furtherexpanded by the use of amino acid substitutionmatrices to evaluate conservation (Landgraf et al.,1999). In either case, a representative structure isused to visualize the distribution of scores at theend of the analysis.
Here, we present 3D cluster analysis, a furtherextension of evolutionary tracing (Lichtarge et al.,1997) with two goals. The ®rst goal is to improvethe sensitivity with which functional residue clus-ters can be identi®ed. The availability of a repre-sentative structure provides a source of signi®cantadditional information, which can improve the sen-sitivity of detection. In addition to projecting the®nal scores onto a reference structure, 3D clusteranalysis makes the structural information an inte-gral part of the analysis. The second goal is toidentify functionally relevant residue clusterswithin a protein without reliance on a phylogenetictree as input data. The grouping of sequences in aphylogenetic tree often re¯ects similarity in func-tion, a fact that is exploited in evolutionary tracing.However, we speculate that a protein possessesregions or residue clusters for which the phyloge-netic tree does not adequately re¯ect relationshipsof sequence similarity and function. We foreseeseveral scenarios in which such a deviation mightoccur. For a protein with multiple functional resi-due clusters, the grouping of sequence in theapparent phylogenetic tree can represent the aver-age of several conserved functions. In addition, thesimilarity relationships of a highly conserved resi-due cluster could dominate the phylogenetic treeand overshadow the grouping suggested by a less-conserved residue cluster associated with a differ-ent function. The detection of such clusters, associ-ated with secondary functions of the protein,would not be possible by conventional evolution-ary tracing. Here, we propose a score, termed simi-larity deviation score (S(x)), which detects residueclusters that exhibit deviations in their regionalsequence similarity relationships. The detection ofsuch residue clusters should facilitate the assign-ment of functions that are not adequately rep-resented in the grouping of the ``apparentphylogenetic tree''.
Three-dimensional cluster analysis places struc-tural information at the core of the analysis andevaluates conservation in terms of spatiallyde®ned residue clusters within a protein. Thismethod requires a representative structure andmultiple sequence alignment but no phylogenetictree as input. Our analysis shows that function-ally relevant residue clusters that exhibit a lowdegree of conservation can be detected withenhanced sensitivity when we use regional con-servation scores as opposed to a scoring scheme
that does not take 3D information into account.We also ®nd cases of residue clusters that,when compared between different sequences,show similarity relationships that deviate fromthe similarity relationships observed for the pro-tein as a whole. Comparison with biochemicaldata suggests that these residue clusters conferspeci®city to catalytic reactions or protein inter-actions.
We evaluate 3D cluster analysis on a set of 35protein families, for which a cocrystal structure ofa representative member identi®es functionally rel-evant interfaces. We ®rst analyze what percentageof known interface residues can be identi®ed by3D cluster analysis. We then evaluate the predic-tions made by 3D cluster analysis against theknown biochemical properties of two families ofproteins in detail. The ®rst family is extracellularsignal-regulated kinase (ERK) 2. The ERK1/ERK2mitogen-activated protein (MAP) kinases (MAPKs)represent one of four known MAP kinase path-ways in mammalian cells, where they transducesignals in response to various growth factors(Blenis, 1993; Blumer & Johnson, 1994; Davis, 1993;Schlessinger, 1994). ERK2 is activated throughphosphorylation by upstream kinases (MAPKKs)such as MEK1/MEK2 (Crews et al., 1992; Mansouret al., 1994) and is subject to deactivation by phos-phatases (Anderson et al., 1990; Boulton & Cobb,1991; Zheng & Guan, 1993). MAPKKs show strongspeci®city in their interaction with MAPKs and thenature of this speci®city has been an area of intenseinvestigation.
The second family of proteins to which we apply3D cluster analysis are type I fructose-1,6-bispho-sphate aldolases (aldolases). Type I aldolases cata-lyze the Schiff base-mediated, reversible cleavageof fructose 1,6,-bisphosphate (FBP) or fructose1-phosphate (F-1-P) to dihydroxyacetone phos-phate (DHAP) and glyceraldehyde 3-phosphate orglyceraldehyde, respectively (for a general review,see Horecker et al., 1972). The functional unit ofaldolase is a tetramer and the active sites in eachmonomer are found at the core of the monomer(b/a)8 barrel (Cooper et al., 1996; Dalby et al., 1999;Gamblin et al., 1990; Sygusch et al., 1987). Mamma-lian class I aldolases exist in three isoforms withdifferent tissue distribution (type A, muscle; B,liver; C, brain) and catalytic preference for FBPover F-1-P. The liver (B) isoform stands out, in thatit utilizes both substrates equally well (Penhoetet al., 1966, 1969), a re¯ection of the utilization ofexogenous fructose by the liver enzyme. Inaddition to its catalytic activity, aldolase has beenreported to interact with the cytoskeleton. Themetabolically controlled interaction of aldolasewith F and G actin has been shown to mediate theassociation of the insulin-responsive glucose trans-porter (Glut-4) with the cytoskeleton, thereby regu-lating the levels of glucose transporter moleculeson the cell surface (Clarke & Masters, 1975; Clarke& Morton, 1976, 1982; Clarke et al., 1984; Walshet al., 1981).
Prediction of Functional Sites in Proteins 1489
Results
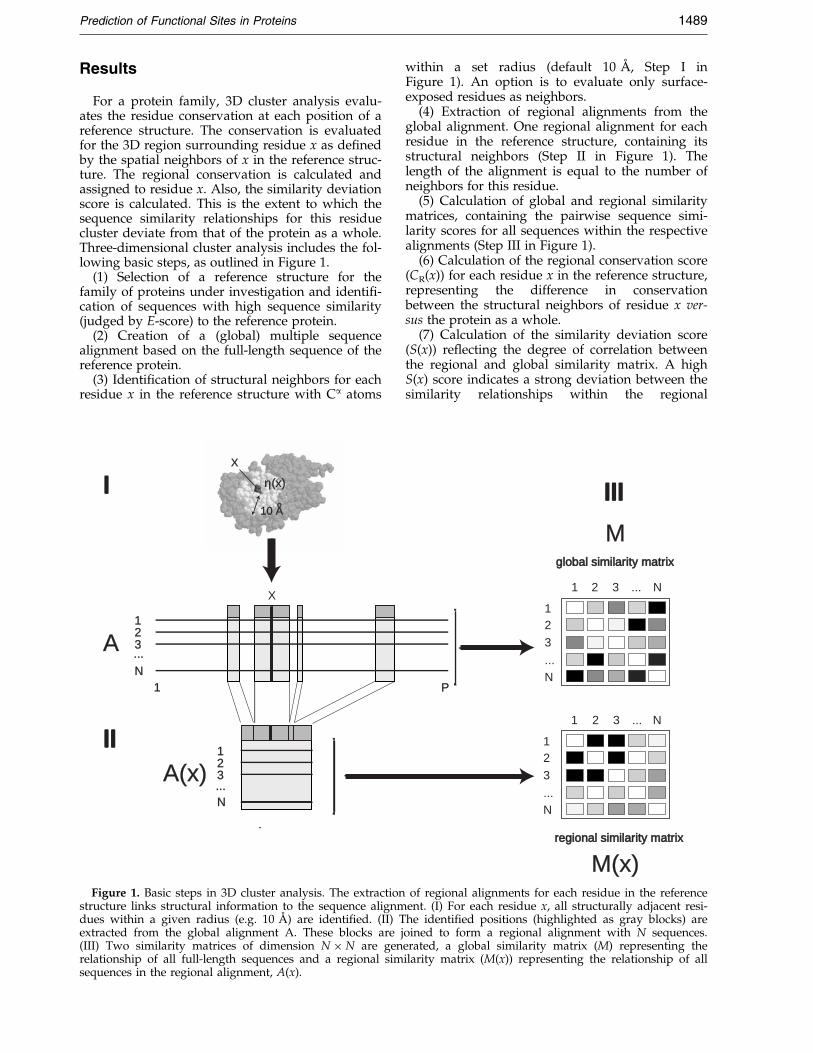
For a protein family, 3D cluster analysis evalu-ates the residue conservation at each position of areference structure. The conservation is evaluatedfor the 3D region surrounding residue x as de®nedby the spatial neighbors of x in the reference struc-ture. The regional conservation is calculated andassigned to residue x. Also, the similarity deviationscore is calculated. This is the extent to which thesequence similarity relationships for this residuecluster deviate from that of the protein as a whole.Three-dimensional cluster analysis includes the fol-lowing basic steps, as outlined in Figure 1.
(1) Selection of a reference structure for thefamily of proteins under investigation and identi®-cation of sequences with high sequence similarity(judged by E-score) to the reference protein.
(2) Creation of a (global) multiple sequencealignment based on the full-length sequence of thereference protein.
(3) Identi®cation of structural neighbors for eachresidue x in the reference structure with Ca atoms
1
N
32
X
123
N...
X
10 Ao
I
II
η(x)
...A
A(x)
1
Figure 1. Basic steps in 3D cluster analysis. The extractionstructure links structural information to the sequence alignmdues within a given radius (e.g. 10 AÊ ) are identi®ed. (II) Textracted from the global alignment A. These blocks are j(III) Two similarity matrices of dimension N � N are genrelationship of all full-length sequences and a regional simsequences in the regional alignment, A(x).
within a set radius (default 10 AÊ , Step I inFigure 1). An option is to evaluate only surface-exposed residues as neighbors.
(4) Extraction of regional alignments from theglobal alignment. One regional alignment for eachresidue in the reference structure, containing itsstructural neighbors (Step II in Figure 1). Thelength of the alignment is equal to the number ofneighbors for this residue.
(5) Calculation of global and regional similaritymatrices, containing the pairwise sequence simi-larity scores for all sequences within the respectivealignments (Step III in Figure 1).
(6) Calculation of the regional conservation score(CR(x)) for each residue x in the reference structure,representing the difference in conservationbetween the structural neighbors of residue x ver-sus the protein as a whole.
(7) Calculation of the similarity deviation score(S(x)) re¯ecting the degree of correlation betweenthe regional and global similarity matrix. A highS(x) score indicates a strong deviation between thesimilarity relationships within the regional
1 2 3 N...
12
3
N...
regional similarity matrix
1 2 3 N...
12
3
N...
global similarity matrix
III
P
M
M(x)of regional alignments for each residue in the referenceent. (I) For each residue x, all structurally adjacent resi-he identi®ed positions (highlighted as gray blocks) areoined to form a regional alignment with N sequences.erated, a global similarity matrix (M) representing theilarity matrix (M(x)) representing the relationship of all

5 10 15 20 25 30 35 40
0.1
0.2
0.3
0.4
0.5
0.6
0.7
Number of neighborsNumber of neighbors
Sco
re
C' (x)C' (x)R
S'(x)
a
10% 1%
-10 -8 -6 -4 -2 0 2 4 6 8 10
100
200
300
400
500
600
700
800
900
1000
1100
Z-score
Occ
uren
ce
C (x)C (x)Rb
10%
-10 -8 -6 -4 -2 0 2 4 6 8 10
100
200
300
400
500
600
700
800
1%
Z-score
Occ
uren
ce
S(x)c
Figure 2. The distributions of CR(x) and S(x) scoresare distinct from the distributions of scores based onreshuf¯ed alignments. (a) Distribution of the raw CR
0 (x)(&) and S0(x) scores (*) and the respective scoresderived from randomly assembled neighborhoods(mean of random S0(x) (^), CR
0 (x) (*). Standard devi-ation of random neighborhood scores is indicated aserror bars). The raw CR
0 (x) and S0(x) scores were con-verted to Z-scores, using the mean and standard devi-ation for a random neighborhood containing an equalnumber of residues. The raw data shown were obtainedfor aldolase. (b) and (c) Distribution of regional conser-vation Z-scores (CR
0 (x), (b) and similarity deviationZ-scores (S(x), (c) (gray area graph) compared to the dis-tribution of the respective scores obtained from
1490 Prediction of Functional Sites in Proteins
alignment of the structural neighbors of residue xand the similarity relationships obtained for thefull-length sequences.
(8) Visualization of the distribution of regionalconservation and similarity deviation scores basedon the reference structure.
Determining background thresholds for CR(x)and S(x) Z-scores
We applied 3D cluster analysis to 35 proteinfamilies. The protein families selected representfour classes of proteins: proteins with small ligand-binding sites, RNA-binding proteins, DNA-bindingproteins and protein complexes. Protein complexeswere further classi®ed as stable (e.g. the aldolasetetramer) or transient (e.g. the Ras-Gap complex).Figure 2(a) shows the raw CR
0 (x) and S0(x) scoresfor the aldolase protein family as a function of thenumber of neighboring residues within a 10 AÊ
radius of each evaluated residue. We compare theraw scores to the mean and standard deviation(error bars in Figure 2(a)) of control scoresobtained for an equal number of randomlyselected, non-neighboring residues within the refer-ence structure. The raw CR
0 (x) scores clusteraround 0.5, the expected value for comparable con-servation within the regional and local similaritymatrix. For the raw S0(x) score, values graduallyapproach zero with an increasing number of evalu-ated residues, because the difference between theregional and the global similarity matrixdiminishes. However, as is the case for the CR
0 (x)scores, the data obtained for ``true'' structure-basedneighbors show a broader distribution than thestandard deviation of scores obtained for randomlyselected ``neighbors''.
Based on the comparison of the raw CR0 (x) and
S0(x) scores and the distribution of scores from ran-domly assembled residue ``neighborhoods'', wecalculated Z-scores (CR(x)) and S(x)). Figure 2(b)and (c) show the distribution of Z-scores for allprotein families evaluated. To determine thethreshold above which a Z-score can be consideredto indicate a true regional conservation or regionaldeviation of sequence similarity, we generated asecond set of Z-scores based on randomlyreshuf¯ed alignments (rS(x) and rCR(x)). For both,the S(x) and CR(x) scores, the distribution of scoresobtained from the reshuf¯ed alignments are dis-tinct, although a substantially larger separationexists in the case of the CR(x) score (Figure 2(b)).We took the percentage of rS(x) and rCR(x) scoresabove a speci®c cut-off to be an indicator of the
reshuf¯ed alignments (rCR (x) and rS(x), continuousline). The distribution of Z-scores from all residues in all35 protein families is shown. The Z-scores (backgroundthresholds) at which the distribution of scores fromreshuf¯ed alignments has less than 1 or 10 % of residuesabove the threshold is indicated in both cases.

Prediction of Functional Sites in Proteins 1491
number of anticipated false positives, andextracted the Z-score above which less than 1 %and 10 %, respectively, of scores can be observedfor rS(x) and rCR(x). We refer to these Z-scores asthe 1 % and 10 % background thresholds. For therCR(x) score, the background thresholds were 1.8and ÿ0.4, respectively (Figure 2(b)). At theseZ-scores, 18 % and 51 %, respectively, of the CR(x)scores are above the threshold. In the case of therS(x) score (Figure 2(c)), the 1 % and 10 % back-ground thresholds were 3.8 and 1.0 with 7 % and31 %, respectively, of the S(x) scores above thethreshold. This difference in the extent to whichthe CR(x) and S(x) vary from the rS(x) and rCR(x)scores is also apparent when raw scores (equival-ent to the aldolase data in Figure 2(a)) are plottedseparately for each protein family (data notshown). The distribution seen for the CR
0 (x) scoresof aldolase in Figure 2(a) are representative ofmost protein families analyzed. However, theextent to which the raw S(x) scores show a broaderdistribution than the standard deviation of scoresfor random neighbors differs signi®cantly betweenprotein families.
Testing the ability of 3D cluster analysis todetect interfaces
Next we evaluated the ability of the 3D clusteranalysis to identify known clusters of functionalresidues. For this, we tabulated the extent to whichresidue positions known to be in interfaces receiveZ-scores above the background thresholds deter-mined above. Residues involved in interfaces withsmall ligands, nucleic acids or other proteins wereidenti®ed from cocrystal structures. This class ofresidues represents only a subset of functionallyrelevant residues and is limited to those residuesmaking direct ligand contact, but has the advan-tage of a clear standard for evaluation, namely thepercentage of buried surface area upon complexformation. Table 1 lists the number of residues in
Table 1. The 3D cluster analysis identi®es the majority of res
Catalytic sites (smallmolecule complexes)
Protein-DNA/RNAcomplexes
15 examples 6 examples214 residues 68 residues
Score 1% 10% 1% 10%
CR(x) 50 (1) 83 (2) 31 (0) 62 (4)CP(x) 66 (19) 90 (55) 62 (16) 77 (47)S(x) 27 (0) 62 (9) 11 (0) 22 (7)
CR(x) 63 (0) 88 (19) 39 (0) 66 (19)CP(x) 54 (20) 86 (50) 50 (21) 66 (60)S(x) 32 (0) 70 (18) 2 (0) 22 (4)
The four categories of interfaces are listed together with the numdues in this category. For each category we list the percentage of inolds (1 or 10 %) indicated in Figure 2(b) and (c). For comparison,threshold, calculated for this particular interface and based on reshufor two different E-score thresholds.
the various types of interfaces and the extent towhich these residues were identi®ed by 3D clusteranalysis. To evaluate the extent to which the incor-poration of 3D information bene®ts the predictionof functional residues, we contrast the resultsobtained for the regional conservation score (3Dinformation included) with a positional conserva-tion score (Cp(x), no 3D information included),described in Materials and Methods. In brief, thisscore measures the conservation at each position inan alignment without consideration of neighboringresidues in the structure. No randomizationscheme equivalent to that used for the generationof the CR(x) Z-score is available for the CP(x) score.In order to ®nd a comparable backgroundthreshold for the CP(x) score, we created a histo-gram of CP(x) scores for each protein family anddetermined the score above which the percentageof residues with scores above the thresholds isequivalent to the percentage of residues above theCR(x) background threshold. The absolute value ofthe background threshold for the Cp(x) score willtherefore differ for each example, depending onthe degree of overall sequence conservation withineach protein family.
Table 1 compares for four types of interfacesand two E-score thresholds the percentage ofknown interface residues above backgroundthresholds for the three scores (CR(x), S(x)and Cp(x)). The results are compared with thoseobtained on the basis of reshuf¯ed alignments(shown in parentheses) to obtain a measure forthe percentage of anticipated false positives. Sev-eral features emerge from this comparison. TheCR(x) scores identify, on average, 36 % of inter-face residues at the most stringent backgroundthreshold (<1 % expected from reshuf¯ed align-ments) and 67 % at a less stringent backgroundthreshold, anticipating less than 10 % of the highscores to occur at random. The identi®cation ofinterface residues increases as the sequencediversity increases (E-score 10ÿ50 versus 10ÿ20), in
idues in interfaces
Protein-protein complexes
Stable Transient12 examples 13 examples381 residues 208 residues
1% 10% 1% 10% E-score
27 (1) 64 (6) 17 (0) 53 (0) 10ÿ50
36 (18) 58 (51) 46 (15) 61 (50) 10ÿ50
5 (1) 30 (15) 15 (2) 52 (4) 10ÿ50
28 (1) 63 (10) 31 (1) 72 (6) 10ÿ20
32 (20) 59 (54) 16 (17) 51 (45) 10ÿ20
7 (1) 25 (19) 7 (0) 38 (22) 10ÿ20
ber of example proteins and the total number of interface resi-terface residues with scores above the two background thresh-the percentage of residues with scores above the backgroundf¯ed alignments, is given in parentheses. Results are presented

Figure 3. The regional conserva-tion score identi®es two distinctinterfaces on ERK2 and bene®tsfrom the inclusion of more distanthomologs. The regional conserva-tion scores (CR(x)) and positionalconservation scores (CP(x)) ((c) and(d)) are superimposed on the struc-ture of rat ERK2. Scores above the1 % Z-score threshold (or Cp(x)score equivalent) are presented inred. All scores below the 10 %background threshold are coloredin dark blue. All remaining resi-dues are colored on a spectral scalefrom orange to light blue withdecreasing scores. (a) and (c) Showthe ``front'' of ERK2, containing thekey catalytic region (cat), the P1site (P1), ATP-binding pocket(ATP) and the dual phosphoryl-ation site (T183, Y185). The key fea-ture on the backside of the protein((b) and (d)) is the L16 loop (shownin ribbon representation). Key resi-dues of the common dockingdomain are indicated. The regionalconservation score identi®es a con-served residue cluster on the frontof ERK2 and the improved signalto noise ratio allows one to de®nethe outlines of a conserved residuecluster on the backside of ERK2more clearly. (e) and (f) Backside of
ERK2 with superimposed (e) Cp(x) and (f) CR(x) (f) scores, calculated with an E-score threshold of 10ÿ20. In contrastto the positional conservation score, the inclusion of more distant homologs improves the identi®cation of the back-side interface on ERK2 by the CR(x) score.
1492 Prediction of Functional Sites in Proteins
some categories at the expense of accuracy,especially at the less-stringent backgroundthreshold. The interface categories show markeddifferences with regard to the percentage ofrecovered residues and the percentage of falsepositives. A high recovery with low error ratescan be achieved using the 10 % backgroundthreshold and a stringent E-score threshold(10ÿ50) in the case of catalytic sites, protein-nucleic acid interfaces, and even stable protein-protein interfaces. Notably, the prediction oftransient protein-protein interfaces bene®ts themost from the inclusion of more distantsequence homologs. At a background threshold,allowing for up to 10 % false positives and anE-score threshold of 10ÿ20, 72 % of the transientprotein interface residues can be recovered witha background of only 6 % from reshuf¯ed align-ments.
Comparison of the predictive value of thedifferent scores
A comparison of the CR(x) and Cp(x) scoreshows that the Cp(x) score identi®es a large num-ber of the interface residues, especially in the cata-
lytic sites. However, the information value of thisscore for the prediction of functional residue clus-ters is diminished by a high rate of false positives.A comparison with the scores obtained fromreshuf¯ed alignments suggests that the Cp(x) scorecan be used successfully for active sites and highlyconserved residues in protein-DNA interfaces butis unlikely to provide good predictions in the caseof less conserved protein-protein interfaces. In con-trast to the CR(x) score, the addition of more dis-tant sequence homologs diminishes the predictivepower of the Cp(x) score. In short, the CR(x) scoreis generally more effective than the Cp(x) score in®nding clusters of functional residues.
At the outset of this analysis, we asked whetherregional differences in sequence similarity relation-ships exist. The tabulated results for the S(x) scoreshow that a signi®cantly higher percentage ofinterface residues has S(x) scores above the back-ground threshold compared to the percentageobtained from reshuf¯ed alignments. As is the casefor the CR(x) score, marked differences existbetween the four categories. In the case of the S(x)score, we observe the largest percentage for activesites and transient interfaces. The percentagesobtained for protein-nucleic acid and stable

Figure 4. The similarity deviationscore identi®es three distinct resi-due clusters in ERK2. (a) On thefront, the speci®city conferring P1site and the ATP binding pocketreceive high scores. (b) On thebackside, the S(x) scores outlines anarrow cluster of residues, centeredon the common docking (CD)domain. (c) Ribbon diagram of theN-terminal domain of ERK2 withsuperimposed similarity deviationscores and key residues within theATP-binding site. (d) Top view ofthe C-terminal domain with super-imposed similarity deviation scores.A cluster of high scores is locatedin the center of a bundle of helicesforming the core and backside ofERK2. (The coloring scheme is asdescribed for Figure 3).
Prediction of Functional Sites in Proteins 1493
protein-protein interfaces are signi®cantly lower. Inthe case of catalytic sites and transient interfaces,the best ratio of identi®ed residues compared toanticipated false positives is obtained for the morestringent E-score threshold (10ÿ50). However, theS(x) score may highlight functional regions of pro-teins other than interfaces. To evaluate the predic-tion of other functional residue clusters requiresfurther study of the biochemistry for each proteinfamily. We selected two protein families, to investi-gate the predictive power of 3D cluster analysis inmore detail.
The 3D cluster analysis of the MAPkinase ERK2
The reference structure for this analysis is that ofrat ERK2 (Gamblin et al., 1990). A FASTA searchwith the sequence of rat ERK2 identi®ed 147sequences with an E-score below 10ÿ50. The 147homologous sequences are primarily composed ofclose ERK homologs, homologs of the related P38MAPK and a series of MAPKs from higher plants(Figure 5). Figure 3 shows the regional conserva-tion (CR(x), Figure 3(a) and (b)) and positional con-servation score (CP(x), Figure 3(c) and (d)).Conserved features on the front of the largerC-terminal lobe (right side of Figure 3(a) and (c)),such as the phosphorylation lip with Thr183 andTyr185, the catalytic region (residues 147 to 152),and the substrate speci®city-conferring P1 site(residues 186 to 192), are readily detectable in bothscoring schemes. However, residues with high pos-itional conservation scores are more scattered,especially on the ``backside''(Figure 3(d)). In con-trast, the regional conservation score (Figure 3(b))clearly identi®es the outlines of a conserved resi-due cluster, centered on the poorly conserved L16loop (shown in ribbon representation). This L16loop contains the recently identi®ed common
docking (CD) domain (Tanoue et al., 2000). At anE-score threshold of 10ÿ20, the regional conserva-tion score de®nes the outlines of a contiguous resi-due cluster even more clearly (Figure 3(f)). Incontrast, the signal on the backside is all but lostwhen we use the positional conservation score(Figure 3(e)) at this E-score threshold. This obser-vation con®rms our earlier ®nding that the CR(x)score, in contrast to the CP(x) score, bene®ts fromthe inclusion of distant homologs.
Due to the inclusion of neighboring residues intothe regional alignments, ``signal spill-over'' couldoccur from an adjacent residue cluster with highscores. To con®rm that the elevated conservationscores on the backside of ERK2 is not the result ofsignal spill-over from high-scoring residues on thefront of ERK2, we included only neighbors with aminimum surface exposure of 3 AÊ 2 in the analysis.This approach removes residues in the core ofERK2 that could facilitate signal spill over from thefront of the molecule. Compared to the calculationwithout a limit for minimum surface exposure,only small changes could be observed on the back-side of ERK2, con®rming that the identi®ed residuecluster is indeed an independent residue cluster.
A comparison of the regional conservation scores(Figure 3) and similarity deviation scores (Figure 4)shows considerable overlap with respect to thebroadly de®ned residue clusters but differences inthe emphasis of subsections. On the front of ERK2(Figure 4(a)), the catalytic region and phosphoryl-ation lip have been de-emphasized by the S(x)score, while the highest scores can be seen forthe speci®city-conferring P1 region and the ATP-binding pocket. The P1 site confers speci®city forsubstrates with proline adjacent to the phosphoryl-ation site (position P � 1). On the backside, a nar-rowly de®ned cluster of residues shows high S(x)scores (Figure 4(b)). This residue cluster consists of

2
FUS3
HOG1
HOG1
SPK1FUS3 yeast
Global Cluster Specific
SPK1
PlantPlant
PlantPlant
P38P38P38P38
ERKERK
ERKERK
Figure 5. The N-terminal ATP-binding site of ERK2 shows shifted sequence similarity relationships. The shift insequence similarity relationships is evident in the apparent phylograms derived from the full-length sequence (global)and N-terminal residues with high S(x) scores (cluster speci®c). Homologs of ERK2 are marked as black diamonds,P38 homologs dark gray circles, and plant MAPKs as light gray squares. The MAPKs HOG1, SPK1 and FUS3 arelabeled individually.
1494 Prediction of Functional Sites in Proteins
the CD domain containing L16 loop and itsimmediate surrounding.
The N-terminal domain of ERK2 primarily scoresbased on its S(x) score. Further analysis of theN-terminal domain of ERK2, shown in ribbon rep-resentation in Figure 4(c), identi®es the N-terminalb-sheet as the source of elevated S(x) scores. Thisb-sheet matches the PROSITE pro®le for ATP bind-ing sites in protein kinases (PS00107). Mutationalanalysis implicates Lys52 in ATP-binding(Robinson et al., 1996). We extracted all high-scoring residues from this residue cluster (residues23 to 41, 49 to 55 and 102) and compared the ``glo-bal phylogram'', based on the full-length sequence,with a ``cluster-speci®c phylogram'', based on thecomparison of residues from this residue clusteralone (Figure 5). The global phylogram clusters allERK homologs, while homologs of the mammalianP38 MAPK, and plant MAPKs are clearly set apart.In contrast, the cluster-speci®c phylogram groupsERK and P38 homologs together and sets plantMAPKs aside. The ATP binding of ERK2 site is
therefore one example of a functionally relevantresidue cluster that exhibits sequence similarityrelationships that deviate form those derived fromthe full-length sequence.
The 3D cluster analysis of aldolase
As a second example for a detailed evaluation of3D cluster analysis predictions, we chose type Ifructose-bisphosphate aldolase (aldolase). Thereference structure for this analysis was that of onesubunit of the rabbit muscle aldolase tetramer(Blom & Sygusch, 1997). A FASTA search with anE-score threshold of 10ÿ50 provided 109 homolo-gous sequences, representing all three mammalianisoforms as well as plant, Drosophila and severalparasite aldolase sequences. The results of the 3Dcluster analysis of aldolase are summarized inFigure 6. Compared to ERK2, positions with highpositional conservation scores are even more scat-tered throughout the structure (Figure 6(a)).Although key residues show high Cp(x) scores, the

Figure 6. The 3D cluster analysisof aldolase identi®es oligomerinterfaces and a speci®city-confer-ring residue cluster. (a) and (b) Theuse of regional conservation scoresimproves the signal to noise ratiocompared to positional conserva-tion scores. Scores are superim-posed on the structure of themonomer of rabbit muscle aldolase(the coloring scheme is as describedfor Figure 3). (a) Positional conser-vation scoring results in scatteredhigh scores. (b) Regional conserva-tion scores identify the catalyticcore region (Schiff base formingLys229 in CPK) and marginallyconserved interfaces. The identi®edoligomer interfaces are marked bypositions 128 and 256 (shown asCPK). Mutations in these positionsare known to disrupt tetramer for-mation. (c) The CPK representationof the regional conservation scoresemphasizes the clear outlines of thedistinct oligomer interfaces. Theorientation of aldolase is similar tothat of subunit D in the aldolasetetramer, but is slightly rotated topresent a better frontal view ofboth interfaces. (d) Structure of thealdolase tetramer with highlightedinterfaces (CPK), as de®ned bythe regional conservation scores,and location of interface-disruptingmutations in position 256(magenta) and 128 (cyan). (e) CPKpresentation of aldolase monomerwith superimposed CR(x) scoresshowing the backside view relativeto (c). In addition to portions of theA:B (C:D) interface around residue128 and the highly conservedentrance to the active site (center),a marginally conserved region to
the right contains the residues implicated in the interaction of aldolase with actin (AS, outlined in white). (f) Thesimilarity deviation scores identify portions of the active site and a residue cluster near the C terminus. Mutations inpositions 337 (CPK) are associated with a loss of liver isoform speci®city.
Prediction of Functional Sites in Proteins 1495
scatter of the signal makes it dif®cult to identifyadditional functional residue clusters.
A signi®cant improvement in the signal to noiseratio can be achieved when CR(x) scores are evalu-ated instead of CP(x) scores. The area showing thehighest CR(x) scores is located in the core of the b/a-barrel and includes all key residues known to beinvolved in catalysis (Figure 6(b), Schiff base form-ing Lys229 in CPK representation). The reducedscattering of signal facilitates the identi®cation ofcontiguous residue clusters with low to intermedi-ate conservation scores. Two such residue clustersare found at the periphery. Both clusters are associ-ated with naturally occurring mutations in pos-itions 256 and 128, known to interfere with theassociation of aldolase monomers to functional tet-
ramers (Beernink & Tolan, 1994; Rellos et al., 2000).A space-®lling representation of the aldolasemonomer with superimposed CR(x) scores(Figure 6(c)) clearly outlines two surface patches.Figure 6(d) shows the aldolase tetramer (Blom &Sygusch, 1997), a dimer of dimers with two typesof dimer interfaces, and highlights the peripheralresidues identi®ed by the CR(x) score. The ®rstinterface (subunits A:D and B:C) contains the natu-rally occurring mutation at position 256 (magentaCPK) (Rellos et al., 2000). Peripheral residues withCR(x) scores above the 10 % background thresholdare shown as CPK and colored yellow for the A:Dinterface. The second interface (red CPKs), betweensubunits A:B and C:D, is associated with the

A
plant
B
DMA
plantB
C
Global
CP
CS
TR
LM
PM CPCS
TR
LM
PM
DM
Cluster Specific
C
A
plant
C
DM
B
Figure 7. The C-terminal residuecluster of aldolase shows liver iso-form-speci®c shifts in the apparentphylogram. An apparent phylo-gram was generated with ClustalWand TreeView for the full-lengthsequences (Global) and residuesthat make up the C-terminal cluster(cluster speci®c) based on theirsimilarity deviation scores. Mam-malian isoforms of aldolase aremarked as A (muscle isoform), B(liver isoform) and C (brain iso-form), DM, Drosophila; LM, Leish-mania; TR, Trypanosomes; PM,Plasmodium. Plant sequences aresubdivided into cytosolic (CS) andchloroplast (CP) forms.
1496 Prediction of Functional Sites in Proteins
mutation in position 128 (cyan CPK) (Beernink &Tolan, 1994).
A moderately conserved non-catalytic residuecluster is located on the backside of the aldolasemonomer, relative to the orientation shown inFigure 6(c). The CPK representation (Figure 6(e))identi®es the entrance to the highly conservedactive site at the center and the location of residue128 to the left marks the outer border of the A:B(C:D) interface. To the right of the active siteentrance, the white outline (marked AS) identi®esa residue cluster with moderate conservation. Pep-tide mapping studies suggest that this region isinvolved in the transient, regulatory interaction ofaldolase with actin. The corresponding regioncould not be identi®ed through the use of pos-itional conservation scores (data not shown).
In contrast to ERK2, the similarity deviationscores for aldolase emphasize primarily a residuecluster that differs from those identi®ed by theirconservation score (Figure 6(f)). While some over-lap exists in sections of the catalytic core,additional high scores can be found near theC-terminal section of aldolase (residues 26 to 32, 72to 75, 268 to 272, 279 to 289, 297 to 307, 331 to338), centered on the helix located underneath the¯exible C terminus of aldolase. This residue clusteris associated with a naturally occurring mutationin position 337 (shown in CPK). This mutation hasbeen identi®ed in patients with hereditary fructoseintolerance and abolishes the equal utilization ofF-1-P and FBP (Rellos et al., 1999), unique to theliver isoform of aldolase. Figure 7 shows a com-parison of the global phylogram and the cluster-speci®c phylogram based on the highest-scoringresidues in this C-terminal residue cluster(Figure 7). The global phylogram separates thethree mammalian aldolases (split further intomuscle (A), liver (B) and brain (C) isoforms), plantaldolases (separated into cytosolic and chloroplastforms) as well as Drosophila and several parasitealdolase sequences. The cluster-speci®c phylogram
reproduces the same groups of sequences. How-ever, in contrast to the global phylogram, themammalian liver (B) isoforms are now groupedwith cytosolic plant aldolases.
Discussion
In order to evaluate the predictive power of 3Dcluster analysis we used two different tests. First,we measured the ability of 3D cluster analysis toidentify functionally relevant interfaces, as de®nedby cocrystal structures, in 35 protein families. Wealso used this ®rst level of analysis to establishabsolute cut-off values (background thresholds) forthe Z-scores, describing regional conservation(CR(x)) and regional changes in sequence similarityrelationships (S(x)). Second, we used two proteinsto analyze in detail the biochemical relevance of allpredicted functional residue clusters. In both testswe evaluated the ability of 3D cluster analysis toachieve our two main goals. First, to improve theaccuracy of functional residue cluster prediction,especially for moderately conserved protein-protein interfaces; second, to evaluate whether resi-due clusters with divergent sequence similarityrelationships exist and if they can be correlatedwith biological functions.
Identification of functional residue clustersbased on regional conservation scores
With respect to the detection of known interfaceresidues by 3D cluster analysis, an average of 67 %of residues (63 % for protein-protein interfaces) canbe identi®ed by their regional conservation scores(CR(x)) at a background threshold that produces anaverage of 8 % false positives (37 % detected with afalse positive rate of <1 %) (Table 1). Therefore, themajority of interface residues can be predicted withrelatively great accuracy. Whilst higher successrates could be achieved for active-site residues,which generally show high sequence conservation,
Prediction of Functional Sites in Proteins 1497
protein-protein interfaces are more dif®cult todetect based on sequence conservation patterns. Arecent analysis of the level of sequence conserva-tion in stable oligomer interfaces showed that con-servation at stable interfaces is higher than theconservation observed for randomly selected sur-face residue patches, but the conservation signal isgenerally weak (Jones et al., 2000). One wouldexpect an even lower level of sequence conserva-tion for transient protein-protein interfaces, wherethe interactions are weaker, and residues have toful®l the requirement for two types of environ-ments. Residues in transient interfaces have indeedthe lowest detection rate at an E-score threshold of10ÿ50. However, a striking feature of 3D clusteranalysis is its ability to harvest the informationinherent in a large number of more distant homo-logs, especially for transient interfaces. At anE-score threshold of 10ÿ20, 72 % of transient inter-face residues could be detected based on theirCR(x) score, with only 6 % anticipated false posi-tives. The same trend, although less pronouncedand calculated for a smaller number of examples,is evident for protein-nucleic acid interfaces.Hence, the additional information provided by theup-front inclusion of 3D information allows 3Dcluster analysis to make effective use of infor-mation inherent in a diverse set of homologoussequences. A comparison of the anticipated rate offalse positives for the positional and regional con-servation score indicates that CR(x) is less vulner-able than CP(x) to errors resulting from the use of``less than optimal'' alignments. This effect is note-worthy, since multiple sequence alignments are akey element of most evolution-based methods andit explains the bene®cial contribution of diversesequences to 3D cluster analysis.
In the case of ERK2, the improved detectionof transient interfaces is evident for the backsideresidue cluster surrounding the CD domain(Figure 3(b)). The addition of divergent sequencesdid improve the extent to which this residue clus-ter is set apart from its surroundings (Figure 3(f)).In contrast, this addition resulted in a reduction ofthe signal from the positional conservation score(Figure 3(e)). The residue cluster on the backside ofERK2 is centered around and underneath the L16loop. This loop is of variable length between differ-ent MAPKs and shows little conservation by itself,except for a pattern of conserved acidic residues(Asp316 and Asp319 in ERK2) identifying the CDdomain (Tanoue et al., 2000). This CD domainserves as a docking site for multiple proteins,including MEK1, MAPK phosphatases (MKPs) andMAPK substrates, and enhances the ef®ciency ofthe respective interaction. The speci®city withwhich different MAPKs interact with their signal-ing partners is still an area of intense investigation.The outline of the conserved residue cluster on thebackside of ERK2 is consistent with biochemicaldata. These data suggest that portions of both theN and C-terminal lobe of ERK2 are involved in theinteractions between ERK and MEK (Wilsbacher
et al., 1999) or the regulatory phosphatase MKP-3(Nichols et al., 2000).
The example of the oligomer interfaces in aldo-lase emphasizes another important feature of theCR(x) score: its ability to give information on resi-dues under the surface. In contrast to the Cp(x)score, residues above the CR(x) backgroundthreshold that are not part of the direct interfaceare distributed primarily in the immediate sur-rounding of the identi®ed interface (Figure 6(b)).Since the calculation of CR(x) scores includes non-surface residues, the underlying layer of residues isalso evaluated. This broader de®nition of subunitinterfaces is supported by the location of naturallyoccurring mutations, known to interfere with tetra-mer formation. In addition to residue 128, whichtakes part in direct interface contacts, twomutations, in position, 256 and 142 (not labeled),are known to affect oligomer formation directly (asopposed to destabilization of the monomer) (Relloset al., 2000). Both residues are buried and do notmake direct interface contacts but are part of theresidue cluster identi®ed by 3D cluster analysis.
Sequence clusters with deviating sequencesimilarity relationships. The S(x) score
At the outset of this analysis, we asked whetherproteins could possess residue clusters for whichthe global sequence similarity relationships mightnot adequately re¯ect evolutionary and functionalrelationships. This question is of particular import-ance when global phylogenetic trees are used forthe prediction of functional or speci®city-conferring regions in a protein. Our analysis ofsimilarity deviation scores (S(x)) indicates that suchresidue clusters do exist and, furthermore, suggeststhat elevated S(x) scores may indicate regionscontrolling the speci®city of protein functions.
The evaluation of prede®ned interfaces for theirS(x) score shows the highest occurrence of highS(x) scores in active sites, closely followed by tran-sient protein-protein interfaces. A case by caseevaluation of residue clusters with high S(x) scoresprovides more insight into the nature of these clus-ters. In the case of ERK2, the S(x) score emphasizeda portion of the active site ( the P1 region) knownto confer substrate speci®city (Figure 4(a)). Anarrow stretch of residues on the backside outlinesthe CD domain in the L16 loop. The transient inter-actions of MAPKs with their upstream and down-stream partners are known to be highly speci®c,although the nature of this speci®city is still poorlyunderstood. The prediction based on the S(x) scoremay aid in reconciling the requirement for speci-®city with the universal nature of the CD motif. Atop view in ribbon presentation (Figure 4(d)) illus-trates the presence of a four-helix bundle with elev-ated S(x) scores that makes up the back and core ofthe C-terminal domain of ERK2. It is tempting tospeculate that these residues form a cluster thatmay be involved in transmitting signal from thebinding events at the CD site to the catalytic region

1498 Prediction of Functional Sites in Proteins
on the front of the protein in a manner that deter-mines the speci®city of the outcome. However, nomutational data are available at this point to evalu-ate this hypothesis.
The only region in ERK2 that stands out primar-ily on the basis of its S(x) score is the ATP-bindingpocket (Figure 4(a) and (c)). As illustrated inFigure 5, the high S(x) score is a re¯ection of achange in sequence similarities between ERK2 andP38 homologs and plant MAPKs, respectively. Thechange in the grouping pattern would in fact indi-cate that this residue cluster represents a strongsignature element of mammalian MAPKs. Hence,the identi®cation of key residue clusters for thepurpose of classi®cation of proteins with unknownfunction may be another application of similaritydeviation scores.
In the case of aldolase, the S(x) score identi®es aresidue cluster that (except for a small active-sitecomponent) does not coincide with any of the pre-de®ned interface categories we evaluated on theabove set of 35 protein families. The comparison ofthe cluster-speci®c and global phylogram impli-cates this residue cluster in liver isoform speci®city.The regrouping of the liver isoform aldolases withplant cytosolic aldolases in the cluster-speci®c phy-logram is consistent with this assumption. Like themammalian liver isoform, the cytosolic aldolasefrom maize preferably catalyzes the cleavage ofF-1-P over FBP. Point mutations in the C-terminaltail of maize aldolase have been shown to contrib-ute to this substrate speci®city (Berthiaume et al.,1991). Portions of the extreme C terminus of mam-malian aldolases have likewise been implicated inthe modulation of enzyme speci®city (Syguschet al., 1987). However, the strongest support for thehypothesis that the identi®ed residue cluster isinvolved in B-isoform speci®city, comes from anaturally occurring mutation in human liver aldo-lase (A337V, CPK in Figure 6(f)), located in thecenter of the cluster. This mutation, found inpatients with hereditary fructose intolerance,abolishes equal utilization of F-1-P and FBP by theliver enzymes (Rellos et al., 1999) and causes ade®ciency in the utilization of exogenous fructose.This residue cluster does not stand out based ondomain organization or conservation patterns (incontrast to the P1 site or backside interface ofERK2). Aldolase therefore provides an example ofhow the S(x) score extends the prediction of func-tionally relevant residue clusters.
Although we do not include mechanisticassumptions in the calculation of S(x) scores, weask what is the origin of clusters with high simi-larity deviation scores. Clusters with high S(x)scores are, by de®nition, characterized by devi-ations from the averaged sequence similarities ofthe full-length sequence. We speculate that recom-bination events that exchange sections of homolo-gous but functionally divergent proteins result indeviations from average sequence similarities.Alternatively, differences in the rates of evolutionwithin the protein sequence and between branches
of the phylogenetic tree may account for theobserved deviations. A recent study, applying acovarion model to elongation factors, correlatesregions in the protein that exhibit divergent ratesof evolution among branches of the phylogenetictree with differences in speci®city (Gaucher et al.,2001). Here, we evaluate the S(x) score as a newpredictive parameter, and the observed linkbetween functional residue clusters and high S(x)scores suggests that the underlying mechanismcontributes to the acquisition of speci®city in cata-lytic and binding events.
Limitations of 3D cluster analysis
Several limitations have to be kept in mindwhen 3D cluster analysis is applied to homologoussequences. First, 3D cluster analysis identi®es func-tionally relevant residue clusters. Thus, the scoresassigned to each residue do not necessarily re¯ectthe relative importance of that residue comparedto its immediate neighbors. Examples of this limi-tation are provided by the conserved positions inthe CD domain of ERK2 or the interface pointmutants in aldolase. In both cases, the regionalconservation score is required to outline the resi-due cluster of interest. In a next step, the positionalconservation scores provide a more accuratemeasure of the relative importance of individualresidues.
A second limitation arises from the assumptionof structural similarity within the set of homo-logous proteins. This assumption is based on thehigh level of sequence similarity at the E-scorethreshold chosen for our analysis and affects theextent to which more diverse sequences can beincluded or structures of distant homologs can beused as a reference. To evaluate the effect of vari-ations in the reference structure, we carried outtwo tests. Using the same set of aligned sequences,we evaluated the ERK2 sequence alignment basedon the structure of the closely related P38 MAPK(Wang et al., 1998) (rmsd 1.94 AÊ ). In a second test,we analyzed the aldolase sequence alignmentusing the monomer structure of the human musclealdolase as a reference structure (Gamblin et al.,1991) instead of one subunit of the rabbit muscletetramer (rmsd 0.22 AÊ ). In both cases we obtainedthe same results with respect to the outlines of thepredicted residue clusters, with minor variationsfor the contribution of individual residues (datanot shown). This ®nding re¯ects the fact that theprobe radius of 10 AÊ , de®ning the neighborhood ofeach residue, acts as a buffer towards minor struc-tural deviations. The probe radius is importantwith respect to the inclusion of more divergentsequences, determined by the E-score threshold.We chose two E-scores (10ÿ50 and 10ÿ20) at whichstructural similarity is a relatively safe assumption.However, data sets with a small number of highlyhomologous sequences may contain insuf®cientsequence diversity to carry out a successful anal-ysis. Insuf®cient sequence diversity precludes the

Prediction of Functional Sites in Proteins 1499
calculation of Z-scores (see Materials and Methods)or results in a high percentage of anticipated falsepositives. A further lowering of the E-score or awidening of the probe radius can improve detec-tion in some cases. However, if these parametersare changed, it is crucial that the validity of a pre-dicted residue cluster is evaluated on the basis of areshuf¯ed alignment model.
In summary, we present a method for the pre-diction of functionally signi®cant residue clustersin proteins. This method relies on a representativestructure and a multiple sequence alignment asinput data. Three-dimensional cluster analysisemphasizes the importance of spatially contiguousresidue clusters as the sites of functionality withinproteins. The inclusion of structural information atthe start of the analysis signi®cantly enhances thedetection of interfaces that are marked by moder-ate conservation. This enhancement is particularlypronounced for transient protein-protein interfaces.Functional residue clusters include all residues thatcontribute to the maintenance of a functional inter-face. This broader interface de®nition includes resi-dues that participate directly in protein-proteincontacts and others beneath the site that are crucialfor the maintenance of the interface.
Our evaluation of changes in regional sequencesimilarity relationships indicates that a proteinwith multiple conserved functions may containresidue clusters in which the sequence groupingderived from the full-length sequence does notadequately re¯ect all aspects of the functional relat-edness of the different sequences. We introduce asimilarity deviation score to de®ne residue clusterswhere such deviations exist. This score highlightsresidue clusters important in conferring speci®citywithin a set of homologous but functionally diver-gent proteins.
Materials and Methods
Three-dimensional cluster analysis
For each protein family, we select a representativestructure, evaluate surface exposure with CCP4-AREAI-MOL (version 2.15) (CCP4, 1994) (optional), and identifyhomologous sequences by a FASTA search (Pearson &Lipman, 1988). Sequences below a set expectation valueare aligned using ClustalW (version 1.8, Thompson et al.,1994) to generate a preliminary multiple sequence align-ment, which may contain gaps in the sequence represent-ing the reference structure. Next, we remove all positionsin the preliminary alignment for which the referencesequence contains a gap. This creates the global, struc-ture-matched alignment denoted by A. A is an N � Pmatrix (equation (1)) representing the alignment of allsequences N in all positions P, where P denotes both thelength of the alignment and the number of residues inthe reference structure:
A � �An;p� n 2 �1 . . . N�; p 2 �1 . . . P� �1�The structural environment of a residue is representedby its neighbors in 3D space and is evaluated as outlinedin Figure 1. For each residue x in the reference structure,
all residues with Ca atoms within a set radius (default10 AÊ ) are considered neighbors (Z(x)) (Step I in Figure 1).The similarity relationships of the structural environmentof residue x is represented by the alignment of all pos-itions that are considered structural neighbors of x (StepII in Figure 1). We refer to this alignment as the regionalalignment at residue x, denoted A(x). A(x) is a subset ofthe global alignment, A (equation (2)). All subsequentcalculations are based on the comparison of the level ofsequence similarity between the regional and globalalignment and the results are assigned to residue x:
A�x� � �An;p� n 2 �1 . . . N�; p 2 �Z�x�� �2�Next, we construct a similarity matrix for each alignment(Step III in Figure 1). The global similarity matrix (M) isan N � N matrix containing N2 sequence similarityterms, denoted m (equation (3)), where each similarityterm (mn,n0) is a measure of sequence similarity betweensequence n and n0 in the global alignment (equation (5)).A total of P regional similarity matrices (M(x)) are con-structed on the basis of the regional alignments, one foreach residue in the reference structure:
M � �mn;n0 �M�x� � �mn;n0 �x��
n 2 �1 . . . N�;n0 2 �1 . . . N�n 2 �1 . . . N�;n0 2 �1 . . . N� �3�
As described by Landgraf et al. (1999), the global simi-larity terms (mn,n0) are calculated on the basis of thesimilarity of the full-length sequences in the global align-ment A (equation (4)), where S(An,p,An0p) denotes the sub-stitution score for the replacement of the residue inposition p of sequence n with the residue in position pand sequence n0. The substitution score is taken from apositive BLOSUM 62 matrix (Henikoff & Henikoff,1992). The positive matrix was obtained by subtractionof the lowest (negative) score in the standard BLOSUM62 matrix from all matrix entries. Values for mn,n0 canrange from 0 to 1. The alignment of a sequence to itselfwould produce a score of zero. The regional similarityterms mn,n0(x) are calculated accordingly, using thesequences from the regional alignment A(x):
mn;n0 � 1
P
XP
p�1
s�An;p;An;p� ÿ s�An;p;An0;p�s�An;p;An;p� �4�
For each residue in the reference structure, two scoresare calculated. The raw regional conservation score CR
0 (x)is a measure for the conservation of the structural neigh-borhood of residue x, compared to the protein as awhole. CR
0 (x) is a measure for differences in magnitudebetween the M and M(x) matrices. For ease of represen-tation the CR
0 (x) score was converted to a score from 0 to1 (initially ÿ1 to 1). Low CR
0 (x) scores indicate that thestructural neighborhood of residue x shows a higher con-servation than the protein as a whole:
C0R �x� �1�
Xn;n0
Mn;n0 ÿM�x�n;n0N2
!2
�5�
Whilst the CR0 (x) score captures differences in the magni-
tude of the two matrices, the second score, termed thesimilarity deviation score, captures differences that arethe result of rearrangements of high and low scoreswithin a matrix. The raw similarity deviation score S0(x)(equation (9)) captures this difference by evaluating thecorrelation between the global and regional similarity

1500 Prediction of Functional Sites in Proteins
matrix. Scores for S0(x) can range from 0 to 1 (equation(9)) where r denotes the correlation coef®cient of the twomatrices (equation (8)), ranging from ÿ1 to 1, and Mdenotes the mean value for each matrix (equation (7)).The scaling of the S0(x) score from 0 to 1 was done tofacilitate the analysis of raw similarity deviation scoresfor selected data sets:
�M �
Xn;n0
Mn;n0
N2�7�
r �
Xn;n0�Mn;n0 ÿ �M��Mn;n0 �x� ÿM�x��������������������������������������������������������������������������������X
n;n0�Mn;n0 ÿ �M�2
Xn;n0�Mn;n0 �x� ÿM�x��2
r �8�
S0�x� � 1ÿ r2
�9�
To envisage the meaning of the S0(x) score, consider thefollowing example. Given a set of three sequences n1, n2
and n3 that are related in such a way that sequence n1 iscloser to n2 than n3, it follows that mn1,n2 < mn1,n3. How-ever, the local similarity terms might indicate that for thestructural neighborhood of residue x, n1 shows highersimilarity to n3 than n2, i.e. m(x)n1,n2 > m(x)n1,n3. This shiftin sequence similarity relationships is re¯ected in arearrangement of similarity terms in the regional com-pared to the global similarity matrix. Depending on theaverage conservation at this residue cluster, there maynot be any net change in the value of CR
0 (x) but the lackof correlation is re¯ected in the S0(x) score. For actualdata sets, the differences between the regional and globalsimilarity matrices are often the result of both types ofchanges.
Finally, the raw similarity deviation scores (S0(x)) wereconverted to Z-scores (S(x)). This was done by compari-son with scores (S) obtained from a regional alignmentof randomly picked positions, equal in number to thenumber of positions in A(x). S and s(S) denote thesample mean and standard deviation obtained for scoresobtained from 50 independently generated randomregional alignments (equation (10)). Random neighborswere chosen equally from the global alignment withoutregard to their location in the structure but had to adhereto the same optional surface area requirement used forthe selection of neighbors in A(x). The CR
0 (x) score wasconverted to a Z-score (CR(x)) similarly. The conversionof both scores to Z-scores standardizes the data sets,which have marked differences in the intrinsic levels ofsequence conservation and permits the establishment ofabsolute Z-score cut-off values (background threshold)for all proteins. Unless otherwise stated, all evaluationsin this analysis are based on Z-scores (CR(x) and S(x)):
S�x� � S0�x� ÿ �S
s�S� �10�
The two regional scores, describing the properties of thestructural neighborhood of residue x, are complementedby a positional conservation score CP(x) (equation (11)).The positional conservation score does not take the struc-tural environment of residue x into account and merelydescribes the degree of conservation at position x withinthe global alignment. With a decreasing probe radius,the CR
0 (x) score will converge towards CP(x):
CP�x� � 1
N2 ÿN
Xn;n0n6�n
� s�An;x;An;x� ÿ s�An;x;An0;x�s�An;x;An;x� x 2 �1 . . . P�
�11�
The resulting scores for all residues were visualizedusing the reference structure. Clusters of residues withhigh S(x) scores were further analyzed to evaluate thenature of the shifts in sequence similarity relationships.To this end, high-scoring residues with a Ca distance ofless than 6 AÊ to each other were represented as anungapped alignment. The value of 6 AÊ was determinedempirically as optimal for most proteins to enforce aclustering of spatially adjacent residues whilst prevent-ing complete fusion of all residues into one uninforma-tive cluster. The sequence similarity relationships of theresidues within the extracted residue clusters were eval-uated with ClustalW. For clusters of suf®cient size, phy-lograms were generated with TreeView for visualizationpurposes.
Evaluation of 35 protein families by 3Dcluster analysis
The criteria for the selection of proteins for this anal-ysis were the availability of a crystal structure of a com-plex, identifying the interface between two proteins orthe protein and one of its ligands, and the availability ofa suf®cient number of homologous sequences. Antibody-antigen complexes were not used for the analysis. Hom-ologous sequence for each protein family were compiledat E-score thresholds of 10ÿ50 and 10ÿ20, resulting in datasets ranging from 31 to 630 sequences. Data sets thatdid not have suf®cient sequence diversity to calculateZ-scores at the default probe radius of 10 AÊ were elimi-nated. Highly redundant data sets result in the selectionof randomly assembled neighborhoods consisting onlyof fully conserved neighbors with a standard deviationof zero, thus preventing the calculation of Z-scores(equation (10)). The following structures were used forthe analysis: 1ad0, 1bfn, 1mem, 1eai, 1d7r, 1e61, 1ogs,1am4, 1blx, 1buh, 1®n, 1ak4, 2pcc, 1efp, 1itb, 1c1j, 1wq1,1dfj, 1 vol, 1a7k, 1avx, 2uug, 1gdt, 1uaa, 1ser, 1axr and1ncf.
For the evaluation of interface residues, the exposedsurface area for each residue was calculated separatelyfor the protein chain under analysis and the appropriatecomplex structure using AREAIMOL. In cases where aprotein has more than one type of interface, e.g. a smallligand-binding site and an oligomer interface, the inter-faces were considered independently. Residues wereconsidered interface residues if the exposed surface areawas reduced by more than 30 % upon complex for-mation. For protein-protein complexes, the proteins wereevaluated independently if they met the above criterion.The scores obtained for each protein family were com-pared with those obtained from a reshuf¯ed alignment.For the reshuf¯ing, each sequence in the alignment wasreshuf¯ed independently, maintaining the relative aminoacid composition of each sequence.
Acknowledgments
We thank Matteo Pellegrini, Edward Marcotte, RobGrothe and Parag Mallick for helpful discussions during

Prediction of Functional Sites in Proteins 1501
the development of this method. We thank Gary Kleigerfor discussions and for providing a list of non-redundantprotein complex structures. We thank Lukasz Salwinskifor his assistance with computational questions. Thiswork was supported by the DOE (DE-FC03-87ER-60615)and NIH (GM 31299), an NIH-NRSA fellowship to R.L.and Swiss national fellowship to I.X.
References
Anderson, N. G., Maller, J. L., Tonks, N. K. & Sturgill,T. W. (1990). Requirement for integration of signalsfrom two distinct phosphorylation pathways foractivation of MAP kinase. Nature, 343, 651-653.
Beernink, P. T. & Tolan, D. R. (1994). Subunit interfacemutants of rabbit muscle aldolase form activedimers. Protein Sci. 3, 1383-1391.
Berthiaume, L., Loisel, T. P. & Sygusch, J. (1991). Car-boxyl terminus region modulates catalytic activityof recombinant maize aldolase. J. Biol. Chem. 266,17099-17105.
Blenis, J. (1993). Signal transduction via the MAPkinases: proceed at your own RSK. Proc. Natl Acad.Sci. USA, 90, 5889-5892.
Blom, N. & Sygusch, J. (1997). Product binding and roleof the C-terminal region in class I D-fructose 1,6-bisphosphate aldolase [letter]. Nature Struct. Biol. 4,36-39.
Blumer, K. J. & Johnson, G. L. (1994). Diversity in func-tion and regulation of MAP kinase pathways.Trends Biochem. Sci. 19, 236-240.
Boulton, T. G. & Cobb, M. H. (1991). Identi®cation ofmultiple extracellular signal-regulated kinases(ERKs) with antipeptide antibodies. Cell Regul. 2,357-371.
Bucher, P. & Bairoch, A. (1994). A generalized pro®lesyntax for biomolecular sequence motifs and itsfunction in automatic sequence interpretation. CellRegul. 2, 53-61.
Casari, G., Sander, C. & Valencia, A. (1995). A methodto predict functional residues in proteins. NatureStruct. Biol. 2, 171-178.
Collaborative Computational Project Number 4 (1994).The CCP4 program suite: programs for proteincrystallography. Acta Crystallog. sect. D, 50, 760-763.
Clarke, F. M. & Masters, C. J. (1975). On the associationof glycolytic enzymes with structural proteins ofskeletal muscle. Biochim. Biophys. Acta, 381, 37-46.
Clarke, F. M. & Morton, D. J. (1976). Aldolase bindingto actin-containing ®laments. Formation of para-crystals. Biochem. J. 159, 797-798.
Clarke, F. M. & Morton, D. J. (1982). Glycolytic enzymebinding in fetal brain-the role of actin. Biochem.Biophys. Res. Commun. 109, 388-393.
Clarke, F. M., Stephan, P., Huxham, G., Hamilton, D. &Morton, D. J. (1984). Metabolic dependence ofglycolytic enzyme binding in rat and sheep heart.Eur. J. Biochem. 138, 643-649.
Cooper, S. J., Leonard, G. A., McSweeney, S. M.,Thompson, A. W., Naismith, J. H., Qamar, S.,Plater, A., Berry, A. & Hunter, W. N. (1996). Thecrystal structure of a class II fructose-1,6-bispho-sphate aldolase shows a novel binuclear metal-binding active site embedded in a familiar fold.Structure, 4, 1303-1315.
Crews, C. M., Alessandrini, A. & Erikson, R. L. (1992).The primary structure of MEK, a protein kinase
that phosphorylates the ERK gene product. Science,258, 478-480.
Dalby, A., Dauter, Z. & Littlechild, J. A. (1999). Crystalstructure of human muscle aldolase complexedwith fructose 1,6-bisphosphate: mechanistic impli-cations. Protein Sci. 8, 291-297.
Davis, R. J. (1993). The mitogen-activated protein kinasesignal transduction pathway. J. Biol. Chem. 268,14553-14556.
Gamblin, S. J., Cooper, B., Millar, J. R., Davies, G. J.,Littlechild, J. A. & Watson, H. C. (1990). The crystalstructure of human muscle aldolase at 3.0 AÊ
resolution. FEBS Letters, 262, 282-286 [publishederratum appears in FEBS Letters, 1990, 264, 159].
Gamblin, S. J., Davies, G. J., Grimes, J. M., Jackson,R. M., Littlechild, J. A. & Watson, H. C. (1991).Activity and speci®city of human aldolases. J. Mol.Biol. 219, 573-576.
Gaucher, E. A., Miyamoto, M. M. & Benner, S. A.(2001). Function-structure analysis of proteins usingcovarion-based evolutionary approaches: elongationfactors. Proc. Natl Acad. Sci. USA, 98, 548-552.
Henikoff, S. & Henikoff, J. G. (1991). Automated assem-bly of protein blocks for database searching. Nucl.Acids Res. 19, 6565-6572.
Henikoff, S. & Henikoff, J. G. (1992). Amino acid substi-tution matrices from protein blocks. Proc. Natl Acad.Sci. USA, 89, 10915-10919.
Horecker, B. L., Tsolas, O. & Lai, C. Y. (1972). Aldolases.In The Enzymes (Boyer, P. D., ed.), 3rd edit., vol. 7,Academic Press, New York.
Jones, S. & Thornton, J. M. (1997a). Analysis of protein-protein interaction sites using surface patches. J. Mol.Biol. 272, 121-132.
Jones, S. & Thornton, J. M. (1997b). Prediction ofprotein-protein interaction sites using patchanalysis. J. Mol. Biol. 272, 133-143.
Jones, S., Marin, A. & Thornton, J. M. (2000). Proteindomain interfaces: characterization and comparisonwith oligomeric protein interfaces. Protein Eng. 13,77-82.
Landgraf, R., Fischer, D. & Eisenberg, D. S. (1999). Anal-ysis of heregulin symmetry by evolutionary tracing.Protein Eng. 12, 943-951.
Lichtarge, O., Bourne, H. R. & Cohen, F. E. (1996). Anevolutionary trace method de®nes binding surfacescommon to protein families. J. Mol. Biol. 257, 342-358.
Lichtarge, O., Yamamoto, K. R. & Cohen, F. E. (1997).Identi®cation of functional surfaces of the zinc bind-ing domains of intracellular receptors. J. Mol. Biol.274, 325-337.
Mansour, S. J., Matten, W. T., Hermann, A. S., Candia,J. M., Rong, S., Fukasawa, K., Vande Woude, G. F.& Ahn, N. G. (1994). Transformation of mammaliancells by constitutively active MAP kinase kinase.Science, 265, 966-970.
Nichols, A., Camps, M., Gillieron, C., Chabert, C.,Brunet, A., Wilsbacher, J., Cobb, M., Pouyssegur, J.,Shaw, J. P. & Arkinstall, S. (2000). Substrate recog-nition domains within extracellular-signal regulatedkinase mediate binding and catalytic activation ofMAP kinase phosphatase-3. J. Biol. Chem. 275,24613-24621.
Pearson, W. R. & Lipman, D. J. (1988). Improved toolsfor biological sequence comparison. Proc. Natl Acad.Sci. USA, 85, 2444-2448.
Penhoet, E., Rajkumar, T. & Rutter, W. J. (1966). Mul-tiple forms of fructose diphosphate aldolase in
1502 Prediction of Functional Sites in Proteins
mammalian tissues. Proc. Natl Acad. Sci. USA, 56,1275-1282.
Penhoet, E. E., Kochman, M. & Rutter, W. J. (1969).Ioslation of fructose diphosphate aldolases A, B,and C. Biochemistry, 8, 4391-4395.
Rellos, P., Ali, M., Vidailhet, M., Sygusch, J. & Cox,T. M. (1999). Alteration of substrate speci®cityby a naturally-occurring aldolase B mutation(Ala337! Val) in fructose intolerance. Biochem. J.340, 321-327.
Rellos, P., Sygusch, J. & Cox, T. M. (2000). Expression,puri®cation, and characterization of natural mutantsof human aldolase B. Role of quaternary structurein catalysis. J. Biol. Chem. 275, 1145-1151.
Robinson, M. J., Harkins, P. C., Zhang, J., Baer, R.,Haycock, J. W., Cobb, M. H. & Goldsmith, E. J.(1996). Mutation of position 52 in ERK2 createsa nonproductive binding mode for adenosine50-triphosphate. Biochemistry, 35, 5641-5646.
Schlessinger, J. (1994). SH2/SH3 signaling proteins.Curr. Opin. Genet. Dev. 4, 25-30.
Sygusch, J., Beaudry, D. & Allaire, M. (1987). Moleculararchitecture of rabbit skeletal muscle aldolase at2.7-AÊ resolution. Proc. Natl Acad. Sci. USA, 84, 7846-7850.
Tanoue, T., Adachi, M., Moriguchi, T. & Nishida, E.(2000). A conserved docking motif in MAP kinasescommon to substrates, activators and regulators.Nature Cell Biol. 2, 110-116.
Thompson, J. D., Higgins, D. G. & Gibson, T. J. (1994).CLUSTAL W: improving the sensitivity of progress-ive multiple sequence alignment through sequenceweighting, position-speci®c gap penalties andweight matrix choice. Nucl. Acids Res. 22, 4673-4680.
Tsai, C. J., Lin, S. L., Wolfson, H. J. & Nussinov, R.(1997). Studies of protein-protein interfaces: a stat-istical analysis of the hydrophobic effect. Protein Sci.6, 53-64.
Walsh, T. P., Masters, C. J., Morton, D. J. & Clarke, F. M.(1981). The reversible binding of glycolytic enzymesin ovine skeletal muscle in response to tetanicstimulation. Biochim. Biophys. Acta, 675, 29-39.
Wang, Z., Canagarajah, B. J., Boehm, J. C., Kassisa, S.,Cobb, M. H., Young, P. R., Abdel-Meguid, S.,Adams, J. L. & Goldsmith, E. J. (1998). Structuralbasis of inhibitor selectivity in MAP kinases. Struc-ture, 6, 1117-1128.
Wilsbacher, J. L., Goldsmith, E. J. & Cobb, M. H. (1999).Phosphorylation of MAP kinases by MAP/ERKinvolves multiple regions of MAP kinases. J. Biol.Chem. 274, 16988-16994.
Xu, D., Lin, S. L. & Nussinov, R. (1997). Protein bindingversus protein folding: the role of hydrophilicbridges in protein associations. J. Mol. Biol. 265, 68-84.
Zheng, C. F. & Guan, K. L. (1993). Dephosphorylationand inactivation of the mitogen-activated proteinkinase by a mitogen-induced Thr/Tyr protein phos-phatase. J. Biol. Chem. 268, 16116-16119.
Edited by J. Thornton
(Received 25 September 2000; received in revised form 29 January 2001; accepted 30 January 2001)