thq nordic at full speed, net sales increased by …mb.cision.com/main/15049/2265956/674658.pdf ·...
TRANSCRIPT
1THQ NORDIC AB JAN – MAR 2017
THQ NORDIC AB (PUBL) REG NO.: 556582-6558 INTERIM REPORT • 1 JANUARY – 31 MARCH 2017
THQ NORDIC AT FULL SPEED, NET SALES INCREASED BY 90%We deliver great results by capitalizing on our portfolio of acquired franchises ac-cording to our business model. There is a great momentum delivering new releases under our asset care program and we had five releases in the first quarter. We are still building up the portfolio of development and in total we had 32 projects ongoing by the end of the quarter. Our first sequels will be finalised and released during the second half of 2017.
Our growing publishing team in Vienna is leading the organisation to deliver on our full release schedule for the third and fourth quarter. It will be an intense period of sales, PR, marketing and distribution.
After the quarter we announced Darksiders III, a sequel of one of our largest franchises. The feedback from the fans and gaming press have in general been positive. It is de-veloped by parts of the original team of creators at Gunfire Games in Austin. The game is planned to be released during 2018.
Financially, we continued to deliver growth and profitability during the first quarter. Net sales increased by 90% to SEK 81.9 m and EBIT increased by 125% to SEK 31.9 m result-ing in an EBIT margin of 39%. This is a great achievement, however, I would like to state that we are still a small player in a large industry.
– LARS WINGEFORS, FOUNDER & CEO
SEK m Jan-Mar 2017 Jan-Mar 2016 Full year 2016
Net sales 81.9 43.1 301.9
EBITDA 41.9 23.1 132.4
EBIT 31.9 14.2 95.0
Profit after tax 23.5 10.7 71.9
Earnings per share, SEK 0.33 0.18 1.18
Cash flow from operating activities 29.7 25.3 99.2
Sales growth, % 90 15 42
EBITDA margin, % 51 54 44
EBIT margin, % 39 33 31
Net sales split:
– Owned titles, % 67 86 71
– Publishing titles, % 33 14 29
– Other, % - - -
KEY PERFORMANCE INDICATORS, GROUP
FIRST QUARTER 2017> Net sales increased by 90% to SEK 81.9 m (43.1).
> Owned titles represented SEK 55.4 m (27.1), or 67%, of net sales in the quarter.
> EBITDA was SEK 41.9 m (23.1), corresponding to an EBITDA margin of 51.2%.
> Cash flow from operating activities amounted to SEK 29.7 m (25.3).
> Earnings per share, before and after dilution, amounted to SEK 0.33 (0.18).
> As of 31 March 2017, cash and cash equivalents were SEK 130.8 m (167.4 as of 31 December 2016).
> One acquisition of a Franchise were finalized during the first quarter.
> Five owned titles and one publishing title launched in the first quarter.
Throughout the Report, all comparatives within parentheses refer to the corresponding period of the previous year, unless otherwise stated.
Darksiders 3
2THQ NORDIC AB JAN – MAR 2017
FINANCIAL PERFORMANCE, FIRST QUARTER 2017Consolidated net sales for the first quarter were up by 90% to SEK 81.9 m (43.1). The growth was mainly sourced from the wide range of new releases. Combined net sales of new releases during first quarter amounted to SEK 29.6 m (0.0) or 36% (0%) of revenues.
The existing portfolio continued to deliver stable sales, especially on digital distribution channels such as Steam, Playstation Network, PSNow and Xbox Live.
CONSOLIDATED EXPENSES
Expenses were SEK 63.8 m (35.3) in the first quarter. Cost of goods sold was SEK 24.5 m (13.3), with the increased costs mainly due to higher sales. Other external expenses were SEK 10.7 m (3.9), with the increase primarily relating to marketing and increased cost in THQ Nordic AB. Personnel expenses were SEK 18.0 m (8.6), the increase partly sourced from new enterprises not consolidated in the first quarter of the previous year and a higher headcount in THQ Nordic GmbH and the development studio Grimlore Games GmbH. Depreciation and amortization was SEK 10.1 m (8.8). The increase is mainly due to deprecia-tion of an ongoing project 1,0 m. Other operating expenses amounted to SEK 0.5 m (0.6).
CONSOLIDATED EARNINGS
The group’s EBITDA for the first quarter 2017 increased by 81% to SEK 41.9 m (23.1), due to increased sales and economies of scale. Operating profit (EBIT) in the quarter was SEK 31.9 m (14,2). Profit after financial items was SEK 31.5 m (14.0) for the third quarter. Profit after tax was SEK 23.5 m (10.7).
CASH FLOW AND FINANCIAL POSITION
Cash flow from operating activities for the quarter was SEK 29.7 m (25.3). The difference is primarily due to improved operating profit, higher depreciation, less tax payments and negative working capital development compared to same quarter last year
Cash flow from investing activities was SEK –68.1 m (–25.1) the majority relating to investments in game projects. Cash flow from financing activities amounted to SEK 1.9 m (-2.5), of which SEK 1.9 m is additional use of the overdraft facility.
Cash and cash equivalents at the end of the period were SEK 130.8 m, and SEK 167.4 m as of 31 Decem-ber 2016. The Company also had unutilized credit facilities of SEK 69.3 m (-). Accordingly, the group’s total available cash and cash equivalents were SEK 200.1 m, and SEK 238.7 m at 31 December 2016.
CAPITAL EXPENDITURE, DEPRECIATION AND AMORTIZATION
In the first quarter, the group’s investments in intangible assets amounted to SEK 67.2 m (24.8), mainly capitalized expenditure for game development. Investments in property, plant and equipment amounted to SEK 0.9 m (0.3)).
Amortization of intangible assets in the first quarter was SEK 9.8 m (8.7). Depreciation of property, plant and equipment amounted to SEK 0.3 m (0.1).
LocksQuest
3THQ NORDIC AB JAN – MAR 2017
OPERATIONSTHQ Nordic acquires, develops and publishes PC and console games. The company has wide catalogue of 260 games including 80 owned franchises such as Darksiders, Titan Quest, MX vs ATV, Red Faction, Destroy All Humans, Aquanox, ELEX, Jagged Alliance, SpellForce and The Guild. THQ Nordic has a global publishing reach within marketing, sales and distribution, both online, and offline. The Groups headoffice is based in Karlstad, Sweden and its operational office in Vienna, Austria. THQ Nordic employs and contractu-ally collaborates with more than 400 people and has four in-house development studios based in Germany, USA and Sweden.
NEW RELEASES IN THE FIRST QUARTER
In the first quarter of the financial year, the company released a wide range of games, covering various platforms and genres.
In January, “MX vs ATV Supercross Encore 2017 Official Track Edition” (PS4/Xbox One) was brought into the North American market. This version was sold only as physical product and contained – beside the already released “MX vs ATV Supercross Encore”-Game all 16 tracks of the 2017 Supercross Champion-ship series. Digitally, the 16 tracks of the Franchise was offered as a downloadable Season Pass.
In the same month – in the course of our asset care program – updated versions were relesead of our “Imperium Galactica”-Franchise on Steam and other digital PC platforms. This franchise was acquired by THQ Nordic in 2016 and comprises “Imperium Galactica” (PC) as well as “Imperium Galactica II” (PC/MAC/Linux/iOS).
One of the highlights in the first quarter was “Halo Wars 2” (PC), which was published as a physical product in Europe.
In addition “Jagged Alliance – Complete Edition” (PC) was released in selected territories.
“This is the Police” (PS4/Xbox One) was released by the end of March.
Together with Deepsilver FISHLABS, THQ Nordic released “The Book of Unwritten Tales 2” in Apple’s AppStore and in Google Play Store in February, and the game is now available on nine platforms.
ACQUISITIONS IN THE FIRST QUARTER
On March 31, we announced that an asset purchase agreement with Slipgate Studios regarding the IP “Rad Rodgers” has been closed. “Rad Rodgers” has become part of THQ Nordic’s IP portfolio. On top of that, the company has made an agreement with Slipgate Studios to complete development of Rad Rodgers on PlayStation™ 4 and Xbox One.
Darksiders 3
4THQ NORDIC AB JAN – MAR 2017
UPCOMING RELEASES IN THE SECOND QUARTER 2017
Planned releases in the second quarter:
THQ NORDIC Q2 RELEASES 2017 IP owner Platform ChannelSRP
(USD/EUR)
De Blob THQ Nordic PC Online 19.99
Darksiders “Warmastered Edition” THQ Nordic Nintendo WiiU On- and Offline 19.99
Locks Quest THQ Nordic PC/PS4/Xbox One On- and Offline 19.99
Victor Vran – Overkill Edition Wired Productions PC/PS4/Xbox One Offline 39.99
The Town of Light Wired Productions PC/PS4/Xbox One Offline 19.99
Baja: Edge of Control HD THQ Nordic PS4/Xbox One On- and Offline 29.99
Neighbours from Hell THQ Nordic iOS/Android Online TBD
In addition, all Steam owners of Spellforce 2 will get a free update of “SpellForce 2 – Anniversary Edition” (PC, online only).
ONGOING DEVELOPMENT AND RELEASES IN 2017
As stated in the year-end report, 2017 will be the first year THQ Nordic releases sequels of company’s own IPs. These new releases are scheduled for the third and fourth quarters of 2017. In the same period, some publishing titles will also be ready for release. Announced releases during 2017 include “SpellForce 3”, “ELEX”, “The Guild 3”, “Battle Chasers: Night War” and “Aquanox—Deep Descent”.
The company is planning to participate in this year’s major tradeshows, E3 Expo in June and GamesCom in August. Management is expecting to make further product announcements, not only limited to the tradeshows, on both owned and publishing titles going forward.
As of March 31 2017, the company had 32 projects in development, compared with 27 at 31 December 2016. 14 of these had been publically announced at the end of the first quarter, compared with 7 at 31 December 2016.
THQ Nordic’s mobile games developer Foxglove Studios AB will continue having its two major multi-players titles, “Snipers vs Thieves” and “The Muscle Hustle” under soft launch. Both are published through external parties.
HUMAN RESOURCES
As of March 31 2017, the Company had 94 employees (56). The average number of full-time employees for the quarter was 90 (50).
PARENT COMPANY
The Parent Company’s net sales for the first quarter were SEK 30.5 m (19.6) and profit before tax was SEK 21.6 m (10.8). Profit after tax was SEK 16.8 m (8.4).
Cash and cash equivalents as of 31 March 2017 were SEK 115.6 m (9.8).
Investments in intangible assets in the period were SEK 0.8 m (0.0). The Parent Company’s equity at the end of the quarter was SEK 343.6 m (81.4).
Baja
5THQ NORDIC AB JAN – MAR 2017
RELATED PARTY TRANSACTIONS
For the first quarter 2017, companies within Nordic Games Group AB invoiced THQ Nordic for QA services amounting to a total of SEK 0.7 m. In the period, THQ Nordic invoiced Game Outlet Europe AB for sold games amounting to a total of SEK 2.5 m. THQ Nordic also has rent agreement with Lars Wingefors AB. During the first quarter THQ Nordic paid SEK 0.1 m in rent and has also paid SEK 0.1 m for other services to companies within the Lars Wingefors Group.
OWNERSHIP BY 31 MARCH 2017
NameClass A shares
Class B shares
Share of capital, %
Share of votes, %
LARS WINGEFORS AB 1) 6,501,467 29,523,732 50.01 61.78
XAGONUS AB 2) 1,407,724 6,392,600 10.83 13.38
SWEDBANK ROBUR 3) 0 3,985,928 5.53 2.60
HANDELSBANKEN FONDER 4) 0 3,380,443 4.69 2.21
CMB HOLDING AB 5) 483,378 2,195,063 3.72 4.59
DIDNER & GERGE SMÅBOLAG 0 2,250,000 3.12 1.47
RAM ONE AB 0 1,826,666 2.54 1.19
LUMARISIMO AB 6) 289,966 1,316,760 2.23 2.76
FÖRSÄKRINGS AB, AVANZA PENSION 0 1,259,148 1.75 0.82
NOVOBIS AB 0 1,250,000 1.74 0.82
OTHER SHAREHOLDERS 317,465 9,652,160 13.84 8.38
TOTAL NUMBER OF SHARES (A/B) 9,000,000 63,032,500 100.00 100.0
TOTAL NUMBER OF VOTES 153,032,500
1) Lars Wingefors AB is controlled to 100% by CEO Lars Wingefors2) Xagonus AB is controlled to 100% by CFO Erik Stenberg3) Swedbank Robur consists of two funds; Småbolagsfond Sverige and Småbolagsfond Norden4) Handelsbanken Fonder consists of four funds; Sverige, Svenska Småbolag, Bosparfond Bostadsrätterna and Nordiska Småbolag5) CMB Holding AB is controlled to 100% by Mikael Brodén6) Lumarisimo AB is controlled by Pelle Lundborg with family
INFORMATION ABOUT FIRST NORTH
Nasdaq First North (”First North”) is an alternative marketplace operated by the constituent exchanges of NASDAQ Stockholm. It does not have the same legal status as a regulated marketplace. Companies quoted on First North are subject to First North’s rules, rather than the legal requirements set for trading on a regulated marketplace. An investment in a company trading on First North implies higher risk than one in a listed company. Companies must apply to the exchange and gain approval before trading on First North can commence. A Certified Adviser guides the company through the listing process and also ensures that the company continuously satisfies First North’s standards. FNCA Sweden AB is THQ Nordic’s certified adviser.
Darksiders 3
6THQ NORDIC AB JAN – MAR 2017
RISKS AND UNCERTAINTY FACTORS
The risks related to THQ Nordic’s operations are reviewed below.
DEVELOPING GAME PROJECTS THQ Nordic develops games in-house via its own development studios and in collaboration with external game developers. Delays to planned and ongoing game projects can have a negative impact on cash flows, revenues and operating margins. Delays can occur to in-house and external development projects. The completion of a game project may also consume more resources than originally estimated, and then usually, and especially for in-house projects, the expense must be met by THQ Nordic.
LAUNCHES OF NEW GAME TITLES CAN GENERATE LOWER-THAN-EXPECTED REVENUESWhen new game titles are launched, there is a risk that they are not well received by the market. This can lead to revenue losses, lower margins and reduced cash flows. This applies to both self-financed projects and games where the Company is the publisher and bears a significant share of finance. Capi-talized development expenses are also subject to the risk of impairment.
THQ NORDIC IS DEPENDENT ON A SMALL NUMBER OF SIGNIFICANT DISTRIBUTORS OF ITS GAME TITLESThe Company’s sales of digital and physical game titles are largely through a small number of major distributors. Distributors continuing to provide digital and physical distribution channels is a precondition for THQ Nordic being able to keep generating revenue from them.
THQ NORDIC MAY BE UNSUCCESSFUL IN DEVELOPING AND ADAPTING TO NEW TECHNOLOGY AND CONSUMER PREFERENCES AND STANDARDS, AS WELL AS ALTERED REGULATION The evolution of the gaming industry is largely driven by the wants and needs of gamers, game com-pa¬nies and publishers, which means that operators must continuously offer new products and services with the aim of attracting and retaining a broad spectrum of gamers. In a sector featuring the rapid creation and development of new products, technologies and gamer behavior, it is important for the Company to continuously update and develop new and existing products and technologies.
INTELLECTUAL PROPERTYLike other operators active in the same sector as the Company, THQ Nordic is dependent on intellectual property and its satisfactory protection. Disputes, mainly relating to intellectual property rights, do occur in the game sector from time to time. Accordingly, there is a risk that THQ Nordic may become involved in legal or administrative procedures in the future, which may relate to extensive damages claims or other claims for payment including damages claims from customers or competitors.
THQ NORDIC IS DEPENDENT ON RETAINING AND BEING ABLE TO HIRE KEY INDIVIDUALS THQ Nordic is dependent on specific key individuals and employees. The loss of these individuals or dif-fi¬culties in attracting new staff, may negatively impact on the Company’s operating activities and ability to execute current and future strategies.
ACQUISITIONS THQ NORDIC has executed, and may execute, acquisitions that may prove unsuccessful and/or put the group’s resources under strain. More detail on the risks related to THQ Nordic’s operations are on THQ Nordic’s website: www.thqnordic-investors.com
ACCOUNTING AND VALUATION POLICIESThis Interim Report has been prepared in accordance with the Swedish Annual Accounts Act. The ac-counting and valuation policies applied are consistent with the Swedish Accounting Standards Board’s Category 3 (BFN K3) regulation and are unchanged since the latest published Annual Accounts, and the Swedish Accounting Standards Board’s BFNAR 2007:1 guidelines on voluntary interim reporting. The Company’s accounting policies are stated in its most recent Annual Accounts (2016). Amounts are reported in Swedish kronor, rounded to the nearest thousand unless otherwise stated. Rounding to the nearest thousand may mean that amounts are not consistent when added. Amounts and figures stated in brackets are comparatives for the corresponding period of the previous year.
de BLOB
7THQ NORDIC AB JAN – MAR 2017
AUDITOR’S REVIEW This Report has not been subject to summary review by the Company’s auditor.
FORTHCOMING REPORTS THQ Nordic intends to publish financial reports on the following dates:Interim Report, January-June 2017 and the Second Quarter 15 August 2017 Interim Report, January-September 2017 and the Third Quarter 14 November 2017Year-end Report 2017 14 February 2018
FOR MORE INFORMATION There is more information on the Company at its website: www.thqnordic.com and thqnordic-investors.com.
If you have any questions on this report, please contact: Lars Wingefors, Founder & CEO, [email protected].
Lars Wingefors Chief Executive Officer
Karlstad, Sweden, 16 May 2017
Darksiders 3
8THQ NORDIC AB JAN – MAR 2017
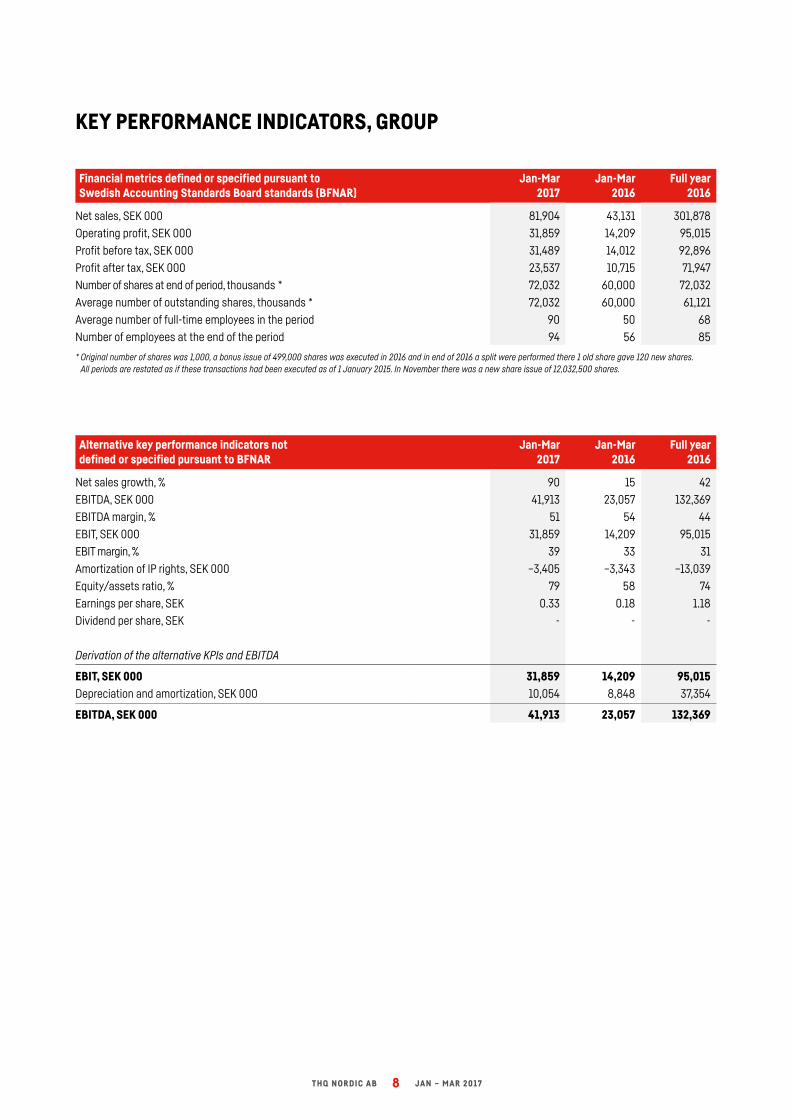
Financial metrics defined or specified pursuant to Swedish Accounting Standards Board standards (BFNAR)
Jan-Mar 2017
Jan-Mar 2016
Full year 2016
Net sales, SEK 000 81,904 43,131 301,878
Operating profit, SEK 000 31,859 14,209 95,015
Profit before tax, SEK 000 31,489 14,012 92,896
Profit after tax, SEK 000 23,537 10,715 71,947
Number of shares at end of period, thousands * 72,032 60,000 72,032
Average number of outstanding shares, thousands * 72,032 60,000 61,121
Average number of full-time employees in the period 90 50 68
Number of employees at the end of the period 94 56 85
* Original number of shares was 1,000, a bonus issue of 499,000 shares was executed in 2016 and in end of 2016 a split were performed there 1 old share gave 120 new shares. All periods are restated as if these transactions had been executed as of 1 January 2015. In November there was a new share issue of 12,032,500 shares.
Alternative key performance indicators not defined or specified pursuant to BFNAR
Jan-Mar 2017
Jan-Mar 2016
Full year 2016
Net sales growth, % 90 15 42
EBITDA, SEK 000 41,913 23,057 132,369
EBITDA margin, % 51 54 44
EBIT, SEK 000 31,859 14,209 95,015
EBIT margin, % 39 33 31
Amortization of IP rights, SEK 000 –3,405 –3,343 –13,039
Equity/assets ratio, % 79 58 74
Earnings per share, SEK 0.33 0.18 1.18
Dividend per share, SEK - - -
Derivation of the alternative KPIs and EBITDA
EBIT, SEK 000 31,859 14,209 95,015Depreciation and amortization, SEK 000 10,054 8,848 37,354
EBITDA, SEK 000 41,913 23,057 132,369
KEY PERFORMANCE INDICATORS, GROUP
9THQ NORDIC AB JAN – MAR 2017
DEFINITIONS OF ALTERNATIVE KPIs
DEFINITIONS OF KPIs, GROUP
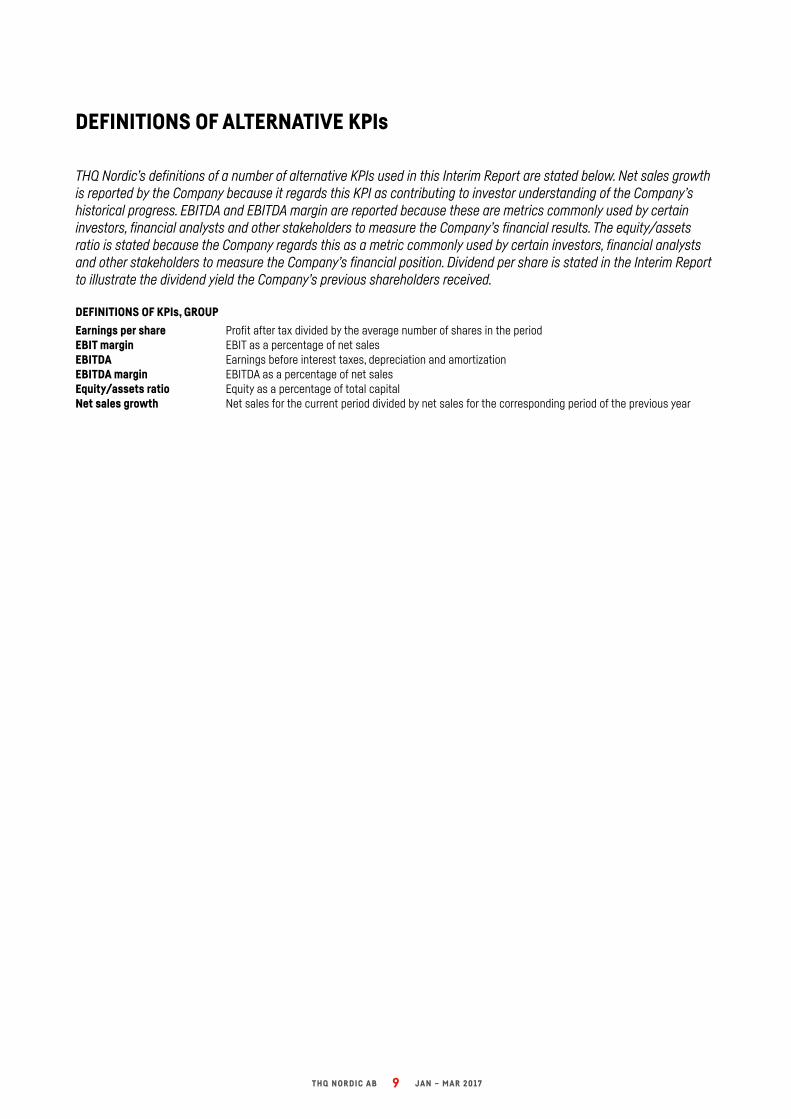
Earnings per share Profit after tax divided by the average number of shares in the periodEBIT margin EBIT as a percentage of net sales EBITDA Earnings before interest taxes, depreciation and amortization EBITDA margin EBITDA as a percentage of net sales Equity/assets ratio Equity as a percentage of total capital Net sales growth Net sales for the current period divided by net sales for the corresponding period of the previous year
THQ Nordic’s definitions of a number of alternative KPIs used in this Interim Report are stated below. Net sales growth is reported by the Company because it regards this KPI as contributing to investor understanding of the Company’s historical progress. EBITDA and EBITDA margin are reported because these are metrics commonly used by certain investors, financial analysts and other stakeholders to measure the Company’s financial results. The equity/assets ratio is stated because the Company regards this as a metric commonly used by certain investors, financial analysts and other stakeholders to measure the Company’s financial position. Dividend per share is stated in the Interim Report to illustrate the dividend yield the Company’s previous shareholders received.
10THQ NORDIC AB JAN – MAR 2017
SEK 000Jan-Mar
2017Jan-Mar
2016Full year
2016
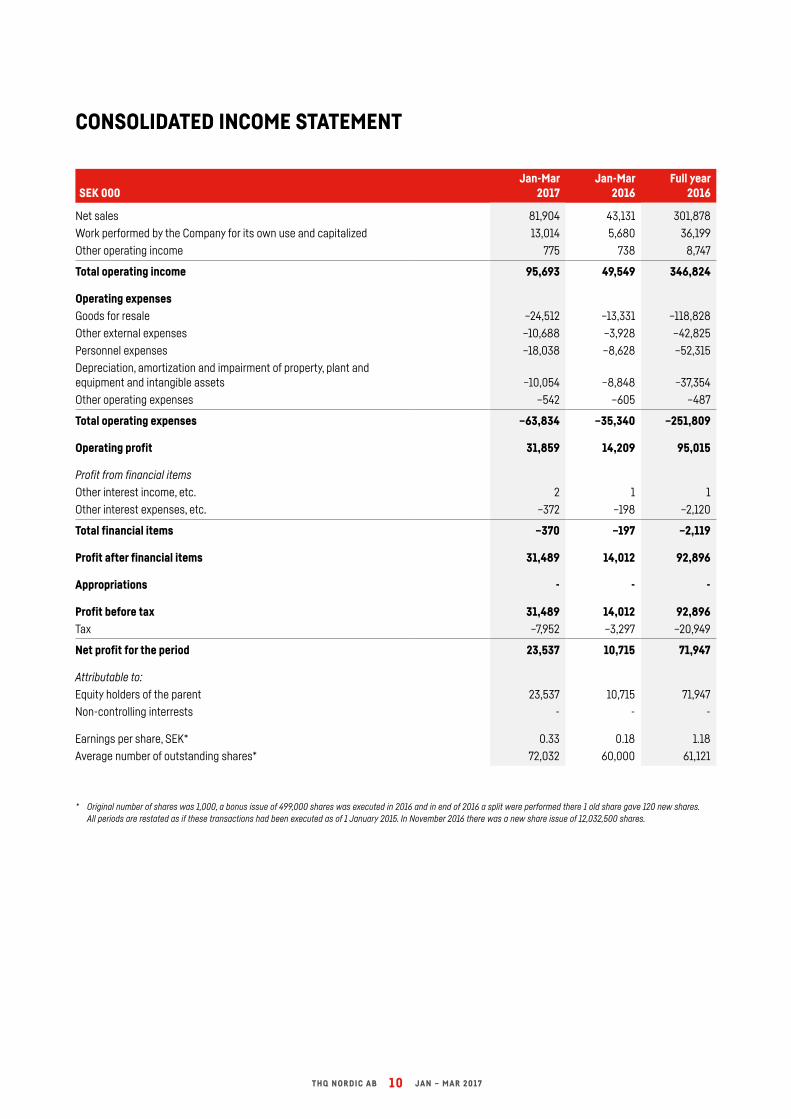
Net sales 81,904 43,131 301,878
Work performed by the Company for its own use and capitalized 13,014 5,680 36,199
Other operating income 775 738 8,747
Total operating income 95,693 49,549 346,824
Operating expensesGoods for resale –24,512 –13,331 –118,828
Other external expenses –10,688 –3,928 –42,825
Personnel expenses –18,038 –8,628 –52,315
Depreciation, amortization and impairment of property, plant and equipment and intangible assets –10,054 –8,848 –37,354
Other operating expenses –542 –605 –487
Total operating expenses –63,834 –35,340 –251,809
Operating profit 31,859 14,209 95,015
Profit from financial items
Other interest income, etc. 2 1 1
Other interest expenses, etc. –372 –198 –2,120
Total financial items –370 –197 –2,119
Profit after financial items 31,489 14,012 92,896
Appropriations - - -
Profit before tax 31,489 14,012 92,896Tax –7,952 –3,297 –20,949
Net profit for the period 23,537 10,715 71,947
Attributable to:
Equity holders of the parent 23,537 10,715 71,947
Non-controlling interrests - - -
Earnings per share, SEK* 0.33 0.18 1.18
Average number of outstanding shares* 72,032 60,000 61,121
CONSOLIDATED INCOME STATEMENT
* Original number of shares was 1,000, a bonus issue of 499,000 shares was executed in 2016 and in end of 2016 a split were performed there 1 old share gave 120 new shares. All periods are restated as if these transactions had been executed as of 1 January 2015. In November 2016 there was a new share issue of 12,032,500 shares.
11THQ NORDIC AB JAN – MAR 2017
SEK 00031 Mar
201731 Mar
201631 Dec
2016
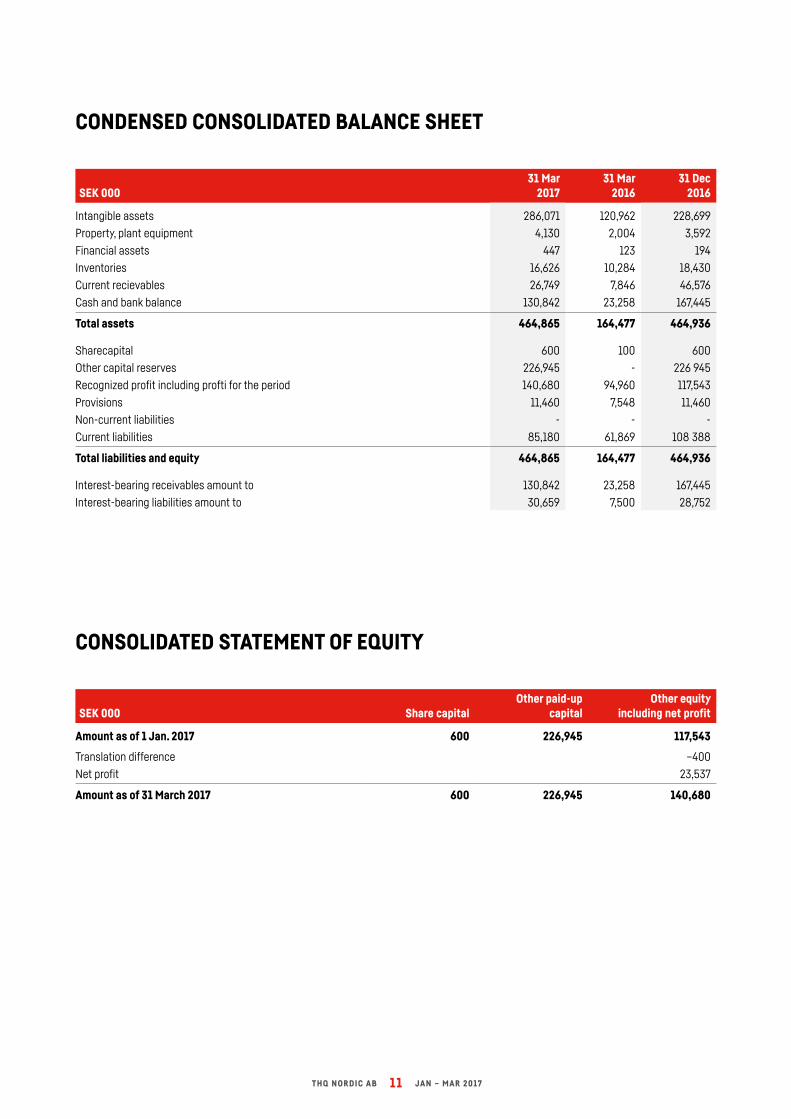
Intangible assets 286,071 120,962 228,699
Property, plant equipment 4,130 2,004 3,592
Financial assets 447 123 194
Inventories 16,626 10,284 18,430
Current recievables 26,749 7,846 46,576
Cash and bank balance 130,842 23,258 167,445
Total assets 464,865 164,477 464,936
Sharecapital 600 100 600
Other capital reserves 226,945 - 226 945
Recognized profit including profti for the period 140,680 94,960 117,543
Provisions 11,460 7,548 11,460
Non-current liabilities - - -
Current liabilities 85,180 61,869 108 388
Total liabilities and equity 464,865 164,477 464,936
Interest-bearing receivables amount to 130,842 23,258 167,445
Interest-bearing liabilities amount to 30,659 7,500 28,752
CONDENSED CONSOLIDATED BALANCE SHEET
SEK 000 Share capitalOther paid-up
capitalOther equity
including net profit
Amount as of 1 Jan. 2017 600 226,945 117,543
Translation difference –400
Net profit 23,537
Amount as of 31 March 2017 600 226,945 140,680
CONSOLIDATED STATEMENT OF EQUITY

12THQ NORDIC AB JAN – MAR 2017
SEK 000Jan-Mar
2017Jan-Mar
2016Full year
2016
Cash flow from operating activities before changes in working capital 34,662 9,617 107,896Change in working capital –5,012 15,719 –8,660
Cash flow from operating activities 29,650 25,336 99,236
Cash flow from investing activities –68,068 –25,122 –159,732
Cash flow from financing activities 1,907 –2,500 201,960
Cash flow for the period –36,511 –2,286 141,464Cash and cash equivalents at beginning of period 167,446 25,606 25,606
Translation difference in cash and cash equivalents –93 –62 375
Cash and cash equivalents at end of period 130,842 23,258 167,445
CONDENSED CONSOLIDATED CASH FLOW STATEMENT
13THQ NORDIC AB JAN – MAR 2017
SEK 000Jan-Mar
2017Jan-Mar
2016Full year
2016
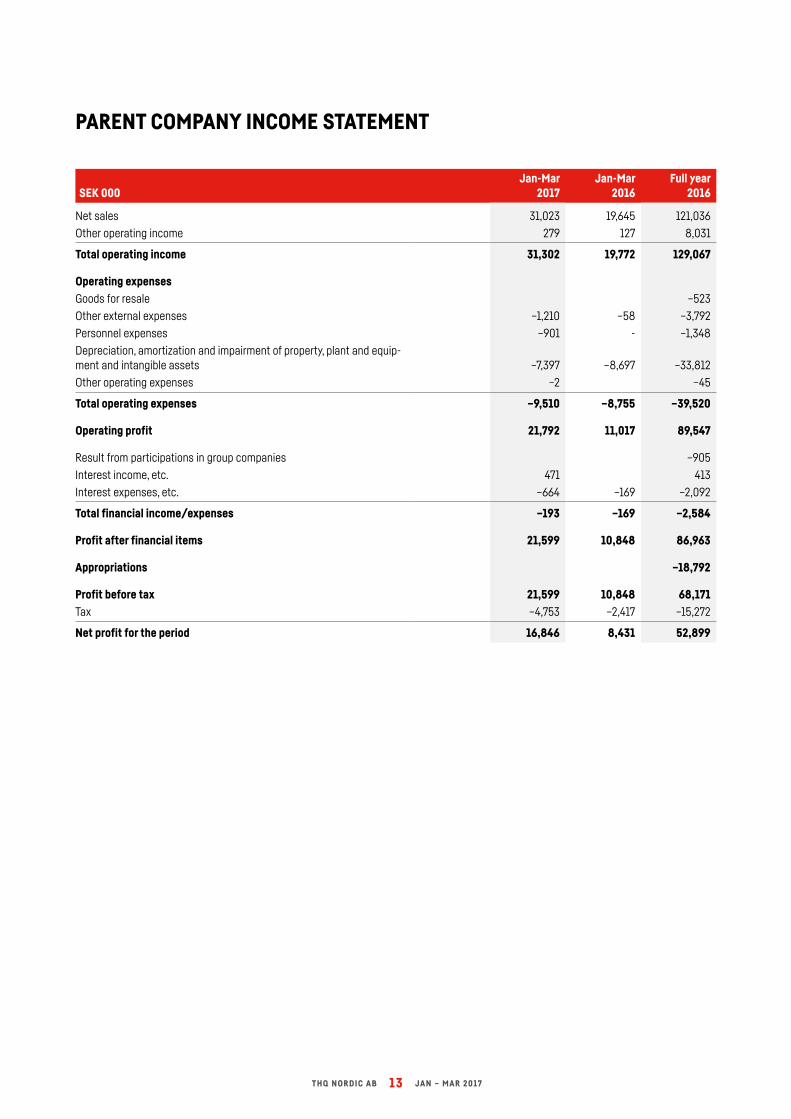
Net sales 31,023 19,645 121,036
Other operating income 279 127 8,031
Total operating income 31,302 19,772 129,067
Operating expensesGoods for resale –523
Other external expenses –1,210 –58 –3,792
Personnel expenses –901 - –1,348
Depreciation, amortization and impairment of property, plant and equip-ment and intangible assets –7,397 –8,697 –33,812
Other operating expenses –2 –45
Total operating expenses –9,510 –8,755 –39,520
Operating profit 21,792 11,017 89,547
Result from participations in group companies –905
Interest income, etc. 471 413
Interest expenses, etc. –664 –169 –2,092
Total financial income/expenses –193 –169 –2,584
Profit after financial items 21,599 10,848 86,963
Appropriations –18,792
Profit before tax 21,599 10,848 68,171Tax –4,753 –2,417 –15,272
Net profit for the period 16,846 8,431 52,899
PARENT COMPANY INCOME STATEMENT
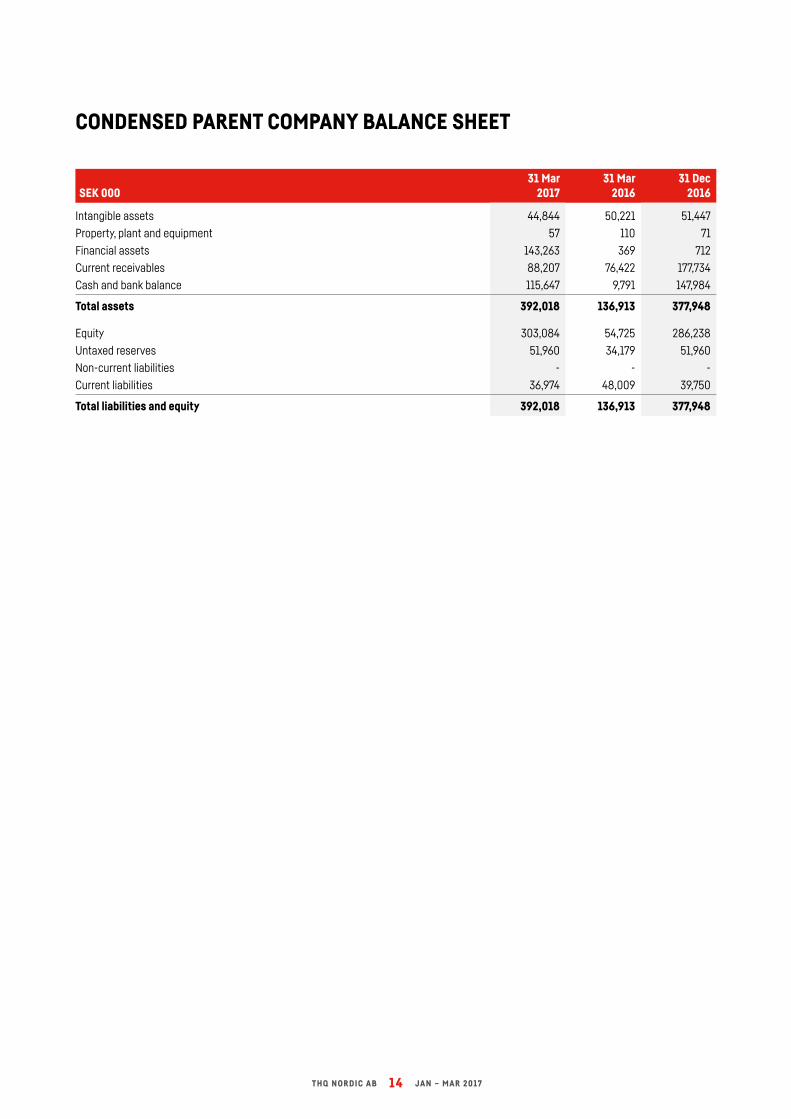
14THQ NORDIC AB JAN – MAR 2017
SEK 00031 Mar
201731 Mar
201631 Dec
2016
Intangible assets 44,844 50,221 51,447
Property, plant and equipment 57 110 71
Financial assets 143,263 369 712
Current receivables 88,207 76,422 177,734
Cash and bank balance 115,647 9,791 147,984
Total assets 392,018 136,913 377,948
Equity 303,084 54,725 286,238
Untaxed reserves 51,960 34,179 51,960
Non-current liabilities - - -
Current liabilities 36,974 48,009 39,750
Total liabilities and equity 392,018 136,913 377,948
CONDENSED PARENT COMPANY BALANCE SHEET
THQ NORDIC AB (PUBL)
ÄLVGATAN 1652 25 KARLSTAD
SWEDEN
WWW.THQNORDIC.COMWWW.THQNORDIC-INVESTORS.COM