thomas nore head of mobile access telenor norway€¢ after an area (2-6 clusters) were swapped to...
TRANSCRIPT

History, current and future of Performance Management at Telenor Norway
Thomas Nore – Head of Mobile Access – Telenor Norway

Synopsis
• The presentation will cover the transformation from the original implementation
in 2010 to the evolved PrOptima™ installation at Telenor Norway today.
• Cluster Based Operating Model and the use of Company Dashboards are
important to bring focus to the everyday operation and the continuous
development of our networks.
• Furthermore, more challenging weather conditions pushes for automated
processes and quick prioritization to deliver the availability and connectivity of
people and IoT devices.
• Focus ahead will be advanced analytics, combining customer centric data with
network information to optimize cost for the operator and quality for the
customer.
2


Telenor Norway
• The leading Norwegian
telecommunications provider
• 3.2 million mobile subscribers
• Smartphone penetration 80%
• 50% market share (mobile)
• 4.200 employees in 30 locations
• Implemented PrOptima™ in
2010/2011
• Running PrOptima™ v 4.2
• 50 basic user licences
• New web client launched 2016
• 320 registered users
• Very satisfied PrOptima™ users
4

BRAIN RAN Swap Project
Swap of 9000 base stations at 6500 sites in Norway –cities and villages, mountains and fjords, offshore and on Spitzbergen…

Use case: RAN Swap• After a cluster (25-30 sites) were swapped to Huawei equipment, the network
was monitored and optimised. When the performance were at the expected level, the Provisional Acceptance (PAC) report were used to document the performance -> Partial payment.
• After an area (2-6 clusters) were swapped to Huawei equipment, the network were monitored through a stability period. After this period, the Final Acceptance (FAC) report were used to document the performance -> Remaining payment.
• These reports triggered huge payments!

SWAP report in PrOptima™

Success criteria introducing a new PM system during our swap process
• External Database integration (database):• Migrating Cell/Area/Cluster info from Swap Support Application to PrOptima™
• Inventory info like county and radio planner
• Migration of legacy data:• At least all KPIs being used in Acceptance Reporting (FAC/PAC)
• Multi vendor KPI possibilities• Creating KPIs combining legacy data and new vendor data
•Multi system KPI possibilities• Creating KPIs combining 2G and 3G data
•Short time to develop necessary reports
• Capacity and troubleshooting reports available from day 1
•Operator and vendor using the same PM solution
•Training• All users have been through a tailor-made training program

Getting our focus right
• More than 3,5 million Network Elements
• 12 billion counters loaded
• Time granularity from 5 to 60 min (depending on NE)
• Storage time from 30 to 700 days
An enormous amount of data are passing through our system every day
Too much data is like no data;
We have to focus on the most important one using:• Good KPIs • Reports supporting our work processes

Our PrOptima™ set up
Adaptors for:
• Huawei BSS
• Huawei UTRAN
• Huawei LTE
• Ericsson CS Core
• Cisco PS Core
Modules:
• GIS (WMS)
• Workspace
• Alarm & Profiling
• New Web Client
Other integrations:
• Inventory
• Fault Management
Live network Test network
LiveStaging
Exports:
• Neighbor
Management Tool
• Site Support
Enhanced

What has changed during these 6 years?
Usage of the system
• More dedicated users
• More use of scheduled reports to
automate reporting and share KPIs
in emails
• Near Real Time Data (5/15 mins)
New Web Client
• Easier access to published data
• Better look and feel
• Dashboards on big screens in the
office locations
11
Cluster Based Operating Model
• Regional focus to improve awareness
and engangement
• Hierarchical Network Areas
• Heterogenous Networks
TAPs
• Valuable kick start when introducing a
new vendor
• From now on updated by Telenor
themselves

What has changed during these 6 years?Technology
12
• LTE launched (2012)
• LTE-A (4G+) launched (2015)
• VoLTE launched (2016)
• LTE-A (4G++) launched (2016)
Ahead
• VoWifi
• LTE-A Pro

Cluster Based Operating Model
• Norway divided in 5 regions with
KPI dashboards for every region
• Increased KPI awareness among
employees
• Engagement, Compare &
compete
• Dashboards at all office locations
• Next generation Web Client to be
used in NOC/SOC
13

4G Rollout – VoLTE Launch
• Day by day monitoing the 4G rollout
• Clustered by county and
municipalities
• Increases awareness about where
we are improving our network
• VoLTE launched for Android in
January. VoLTE for iOS soon to
follow
• Focus on maintaining traditional
Voice KPI levels also for VoLTE as a
service.
14

15

Telenor – trends & examples
• Lifestyle Network effect
– Crowdsourcing; OpenSignal, NPS, Customer handling on Facebook
• Streaming Natives:
– Delivering 5-10 Mbps for streaming everywhere
• Sensing homes, AMR and M2M
– How to handle the enormous numbers of connected devices?
• Smart commuters
– 55% are dissatisfied with their internet connection while commuting
• Emergency chat
– «It’s bad to lose the electricity, but even worse not being able to tell anybody about
it»
16

Extreme weather puts Operations
under pressure
17
30.01.16

Automatic Meter Reading has «children’s diseases»
• Like the first signalling storms after the smartphone era, IoT and M2M will also be
challenging for network operators. Best practice sharing among the whole IoT eco
system is vital to manage these challenges.
• Keep in mind: most of the M2M devices the next 2-3 years will come in the GSM 900
band
18
June (before AMR) September (after AMR) December (improved AMR)
AMR launch/pilot area:
19
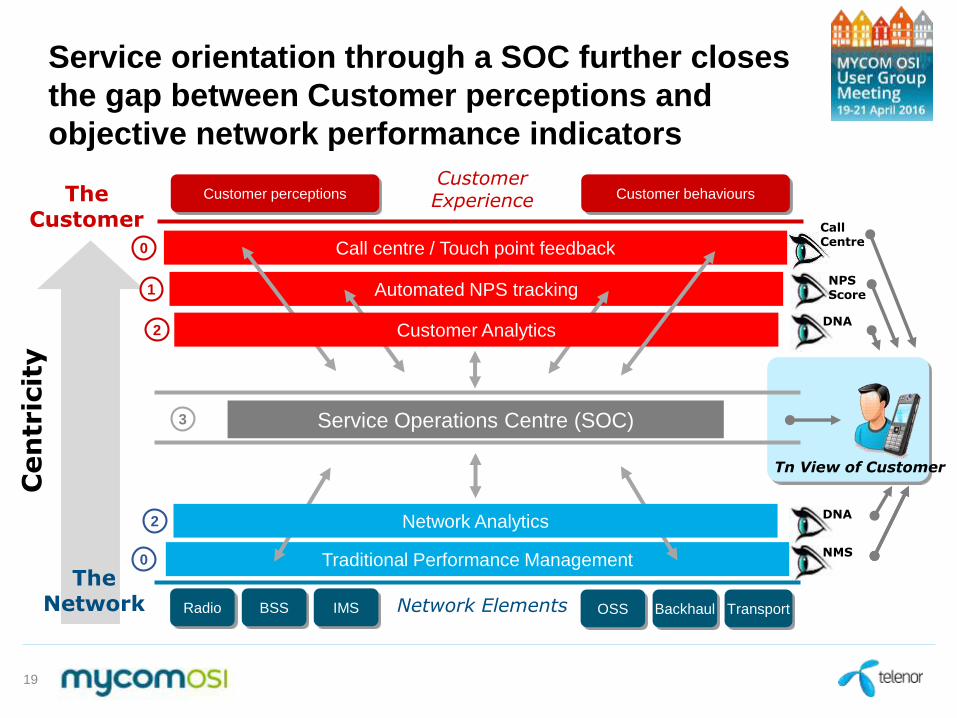
Service orientation through a SOC further closes
the gap between Customer perceptions and
objective network performance indicators
The Network
The Customer
Cen
tric
ity
0
NPS Score1
NMS
0
Call Centre
TransportBackhaulOSSRadio BSS IMS Network Elements
Traditional Performance Management
Customer perceptions Customer behavioursCustomer Experience
Call centre / Touch point feedback
Automated NPS tracking
2
2
DNA
DNA
Service Operations Centre (SOC)3
Tn View of Customer
Network Analytics
Customer Analytics

The way ahead
• Traditional Performance Management is still as
important as before for engineering purposes.
• But in addition, the operators need:
• Customer Insight Analytics will be imperative to be
able to understand customer behavior, customer
preferences and customer perception
• Device analytics is necessary to understand and
cater for the wide range of terminals and devices that
will come with Internet of Things.
• Service Operations Centre to monitor performance in
a service oriented way
• Big data to gather information from PM, FM, NPS,
NOC, SOC and others.
20

The way ahead, contd.
21

The way ahead, contd.
• M2M/IoT
• Alarms for houses, cabins, cars etc
• Surveillance of buildings
• Level monitoring of tanks and containers
• Fleet management & order handling for cars
• Positioning services for cars, boats, containers etc.
• Payment & transactions
• Automatic Meter Reading Systems
• E-health
22

Thank you